Embed Size (px)
Citation preview
March 31, 2021(Un-Audited)
3rd Quarterly Accounts
For the period March 31, 2021
02
1st Quarterly Accounts03
For the period March 31, 2021
04
1st Quarterly Accounts05
For the period March 31, 2021
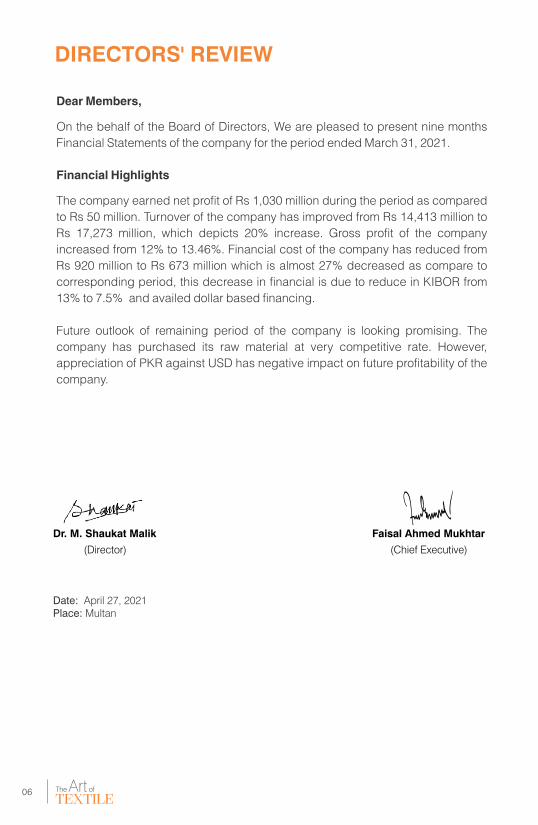
Date: April 27, 2021Place: Multan
DIRECTORS' REVIEW
Faisal Ahmed Mukhtar
(Chief Executive)
Dr. M. Shaukat Malik
(Director)
06
Dear Members,
On the behalf of the Board of Directors, We are pleased to present nine months
Financial Statements of the company for the period ended March 31, 2021.
Financial Highlights
The company earned net profit of Rs 1,030 million during the period as compared
to Rs 50 million. Turnover of the company has improved from Rs 14,413 million to
Rs 17,273 million, which depicts 20% increase. Gross profit of the company
increased from 12% to 13.46%. Financial cost of the company has reduced from
Rs 920 million to Rs 673 million which is almost 27% decreased as compare to
corresponding period, this decrease in financial is due to reduce in KIBOR from
13% to 7.5% and availed dollar based financing.
Future outlook of remaining period of the company is looking promising. The
company has purchased its raw material at very competitive rate. However,
appreciation of PKR against USD has negative impact on future profitability of the
company.

1st Quarterly Accounts07
For the period March 31, 2021
92067327
137.5
17,27320
272021
rd3 QuarterlyAccounts
March 31, 2021(Un-Audited)

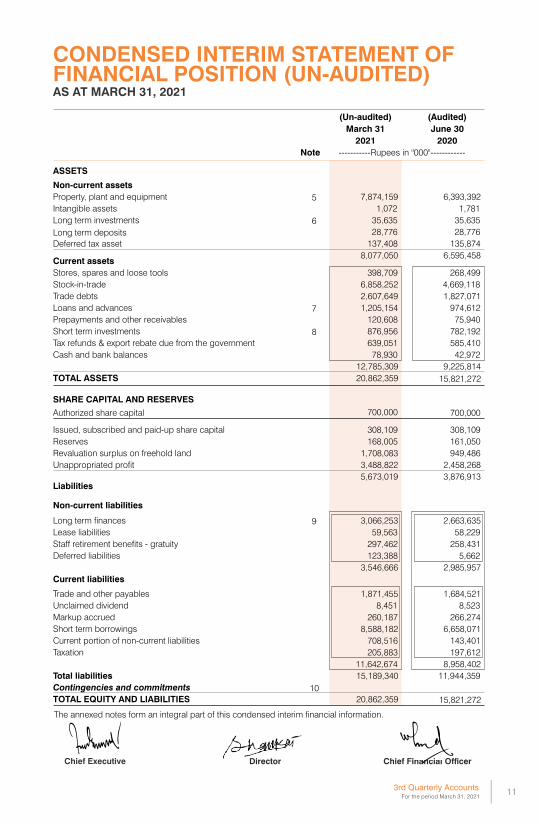
CONDENSED INTERIM STATEMENT OFFINANCIAL POSITION (UN-AUDITED)
(Un-audited) (Audited)
March 31 June 30
2021 2020
-----------Rupees in ''000''------------
AS AT MARCH 31, 2021
Note
Chief Executive
3rd Quarterly AccountsFor the period March 31, 2021
11
ASSETS
Non-current assets
Property, plant and equipment
Intangible assets
Long term investments
Long term deposits
Deferred tax asset
SHARE CAPITAL AND RESERVES
5 7,874,159 6,393,392
1,072 1,781
6 35,635 35,635
28,776 28,776
137,408 135,874
8,077,050 6,595,458Current assets
Stores, spares and loose tools
Stock-in-trade
Trade debts
Loans and advances
Prepayments and other receivables
Short term investments
Tax refunds & export rebate due from the government
Cash and bank balances
TOTAL ASSETS
398,709 268,499
6,858,252 4,669,118
2,607,649 1,827,071
7 1,205,154 974,612
120,608 75,940
8 876,956 782,192
639,051 585,410
78,930 42,972
12,785,309 9,225,814
20,862,359 15,821,272
Authorized share capital
Issued, subscribed and paid-up share capital
Reserves
Revaluation surplus on freehold land
Unappropriated profit
Liabilities
700,000 700,000
308,109 308,109
168,005 161,050
1,708,083 949,486
3,488,822 2,458,268
5,673,019 3,876,913
Non-current liabilities
Long term finances
Lease liabilities
Staff retirement benefits - gratuity
Deferred liabilities
Current liabilities
Trade and other payables
Unclaimed dividend
Markup accrued
Short term borrowings
Current portion of non-current liabilities
Taxation
Total liabilities
Contingencies and commitments
TOTAL EQUITY AND LIABILITIES
The annexed notes form an integral part of this condensed interim financial information.
9 3,066,253 2,663,635
59,563 58,229
297,462 258,431
123,388 5,662
3,546,666 2,985,957
1,871,455 1,684,521
8,451 8,523
260,187 266,274
8,588,182 6,658,071
708,516 143,401
205,883 197,612
11,642,674 8,958,402
15,189,340 11,944,359
10
20,862,359 15,821,272

FOR THE PERIOD ENDED MARCH 31, 2021
CONDENSED INTERIM STATEMENTOF PROFIT OR LOSS (UN-AUDITED)
Chief Executive
12
March 31 March 31 March 31 March 31
2021 2020 2021 2020
The annexed notes form an integral part of this condensed interim financial information.
Nine months period ended Three months period ended
----------------------------------Rs in ''000''-----------------------------Note
17,273,346 6,498,004 5,160,155
(14,948,233) (5,484,045) (4,688,224)
2,325,113 1,013,959 471,931
(221,747)
(85,309) (68,644)
(155,401)
(53,859) (49,379)
(84,334)
(35,266) (199,244)
44,940 (16,236) 27,466
(416,542) (190,670) (289,801)
1,908,571
823,289 182,130
(673,668)
(253,654) (278,835)
1,234,903 569,635 (96,705)
- - (5,733)
1,234,903 569,635 (102,438)
(204,349) (85,043) (53,938)
1,030,554 484,592 (156,376)
Sales - net 11
Cost of sales
Gross profit
Distribution and marketing expenses
Administrative expenses
Other expenses
Other income
Profit from operations
Finance cost
Share of loss of associates
Profit / (loss) before taxation
Provision for taxation
Profit / (loss) after Taxation
Earnings per share 33.45
14,413,661
(12,665,114)
1,748,547
(179,107)
(155,240)
(287,245)
78,474
(543,118)
1,205,429
(920,740)
284,689
(74,790)
209,899
(159,806)
50,093
1.63 15.73 (5.08)
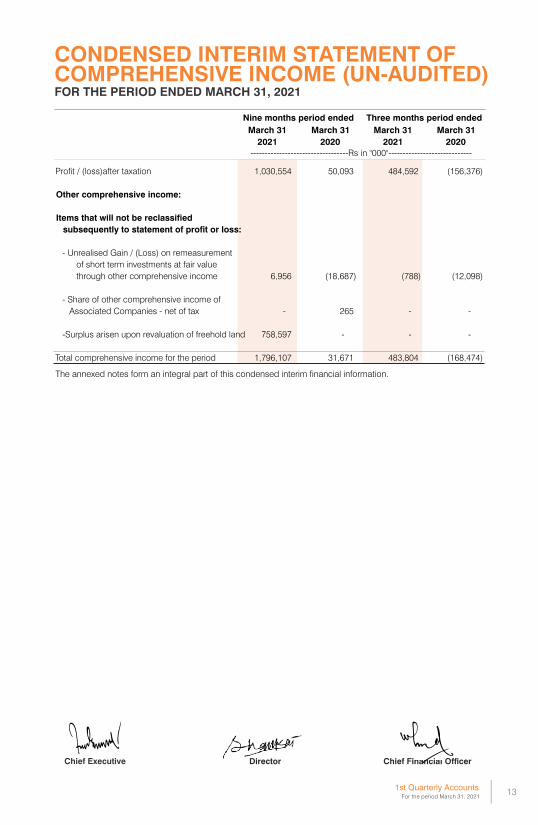
The annexed notes form an integral part of this condensed interim financial information.
CONDENSED INTERIM STATEMENT OFCOMPREHENSIVE INCOME (UN-AUDITED)FOR THE PERIOD ENDED MARCH 31, 2021
Chief Executive
1st Quarterly Accounts13
March 31 March 31 March 31 March 31
2021 2020 2021 2020
Nine months period ended Three months period ended
----------------------------------Rs in ''000''-----------------------------
1,030,554 50,093 484,592 (156,376)
6,956 (18,687) (788) (12,098)
- 265 - -
758,597 - - -
1,796,107 31,671 483,804 (168,474)
Profit / (loss)after taxation
Other comprehensive income:
Items that will not be reclassified
subsequently to statement of profit or loss:
- Unrealised Gain / (Loss) on remeasurement
of short term investments at fair value
through other comprehensive income
- Share of other comprehensive income of
Associated Companies - net of tax
-Surplus arisen upon revaluation of freehold land
Total comprehensive income for the period
For the period March 31, 2021
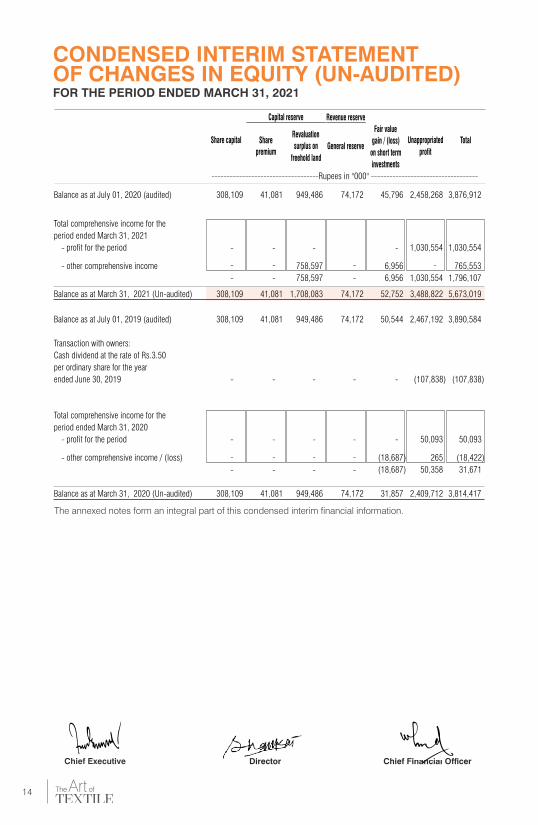
Balance as at July 01, 2020 (audited) 41,081 949,486 74,172 Total comprehensive income for the
period ended March 31, 2021
- profit for the period - -
-- other comprehensive income 758,597
- 758,597 -
Balance as at March 31, 2021 (Un-audited)
1,708,083 74,172
Balance as at July 01, 2019 (audited)
41,081
949,486 74,172
Transaction with owners:
Cash dividend at the rate of Rs.3.50
per ordinary share for the year
ended June 30, 2019 - - -
Total comprehensive income for the
period ended March 31, 2020
- profit for the period - - -
- other comprehensive income / (loss)
- - -
Balance as at March 31, 2020 (Un-audited) 41,081 949,486 74,172
Revenue reserve
-----------------------------------Rupees in ''000'' -----------------------------------
Capital reserve
Share capital Share
premium
Revaluation
surplus on
freehold land
General reserve
Fair value
gain / (loss)
on short term
investments
CONDENSED INTERIM STATEMENTOF CHANGES IN EQUITY (UN-AUDITED)FOR THE PERIOD ENDED MARCH 31, 2021
Unappropriated
profit
Total
The annexed notes form an integral part of this condensed interim financial information.
Chief Executive
14
308,109
-
-
308,109
308,109
-
-
-
308,109
41,081
45,796
-
6,956
6,956
52,752
50,544
-
-
(18,687)
(18,687)
31,857
2,458,268
1,030,554
1,030,554
3,488,822
2,467,192
(107,838)
50,093
265
50,358
2,409,712
3,876,912
1,030,554
765,553
1,796,107
5,673,019
3,890,584
(107,838)
50,093
(18,422)
31,671
3,814,417
- --
- - --
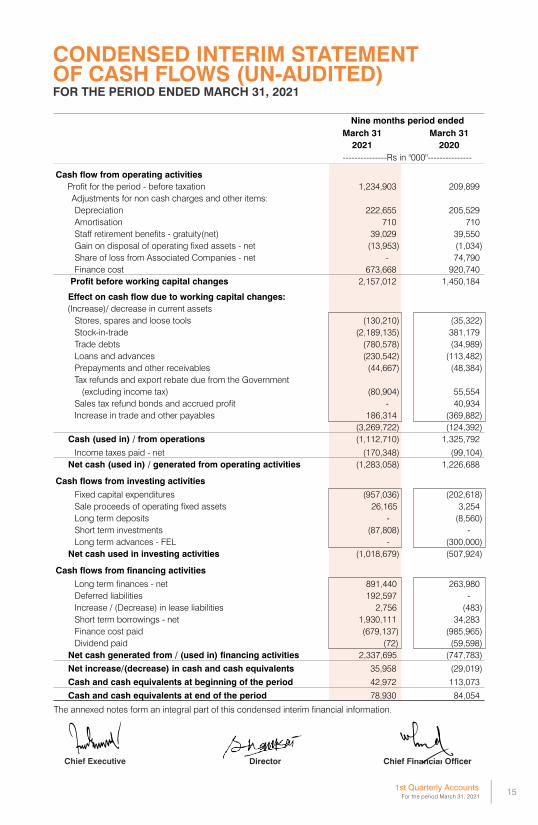
CONDENSED INTERIM STATEMENTOF CASH FLOWS (UN-AUDITED)FOR THE PERIOD ENDED MARCH 31, 2021
March 31 March 31
2021 2020
Nine months period ended
---------------Rs in ''000''---------------
The annexed notes form an integral part of this condensed interim financial information.
Chief Executive
1st Quarterly Accounts15
Cash flow from operating activities
Profit for the period - before taxation 1,234,903 209,899
Adjustments for non cash charges and other items:
Depreciation 222,655 205,529
Amortisation 710 710
Staff retirement benefits - gratuity(net) 39,029 39,550
Gain on disposal of operating fixed assets - net (1,034)
Share of loss from Associated Companies - net - 74,790
Finance cost 673,668 920,740
Profit before working capital changes 2,157,012 1,450,184
Effect on cash flow due to working capital changes:
(Increase)/ decrease in current assets
Stores, spares and loose tools (130,210) (35,322)
Stock-in-trade (2,189,135) 381,179
Trade debts (780,578) (34,989)
Loans and advances (230,542) (113,482)
Prepayments and other receivables (44,667) (48,384)
Tax refunds and export rebate due from the Government
(excluding income tax) (80,904) 55,554
Sales tax refund bonds and accrued profit - 40,934
Increase in trade and other payables 186,314 (369,882)
(3,269,722) (124,392)
Cash (used in) / from operations (1,112,710) 1,325,792
Income taxes paid - net (170,348) (99,104)
Net cash (used in) / generated from operating activities (1,283,058) 1,226,688
Cash flows from investing activities
Fixed capital expenditures (957,036) (202,618)
Sale proceeds of operating fixed assets 26,165 3,254
Long term deposits - (8,560)
Short term investments (87,808) -
Long term advances - FEL - (300,000)
Net cash used in investing activities (1,018,679) (507,924)
Cash flows from financing activities
Long term finances - net 891,440 263,980
Deferred liabilities 192,597 -
Increase / (Decrease) in lease liabilities 2,756 (483)
Short term borrowings - net 1,930,111 34,283
Finance cost paid (679,137) (985,965)
Dividend paid (72) (59,598)
Net cash generated from / (used in) financing activities 2,337,695 (747,783)
Net increase/(decrease) in cash and cash equivalents 35,958 (29,019)
Cash and cash equivalents at beginning of the period 42,972 113,073
Cash and cash equivalents at end of the period 78,930 84,054
For the period March 31, 2021
(13,953)
Un-audited Audited
March 31 June 30
Note
2021 2020
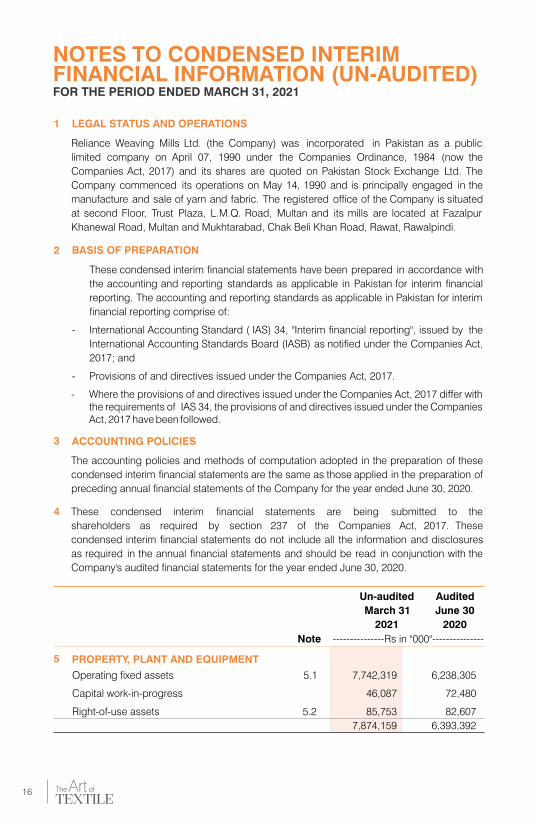
5 PROPERTY, PLANT AND EQUIPMENT
NOTES TO CONDENSED INTERIMFINANCIAL INFORMATION (UN-AUDITED)FOR THE PERIOD ENDED MARCH 31, 2021
---------------Rs in ''000''---------------
16
1 LEGAL STATUS AND OPERATIONS
2 BASIS OF PREPARATION
-
-
-
3 ACCOUNTING POLICIES
4
Provisions of and directives issued under the Companies Act, 2017.
The accounting policies and methods of computation adopted in the preparation of these
condensed interim financial statements are the same as those applied in the preparation of
preceding annual financial statements of the Company for the year ended June 30, 2020.
These condensed interim financial statements are being submitted to the
shareholders as required by section 237 of the Companies Act, 2017. These
condensed interim financial statements do not include all the information and disclosures
as required in the annual financial statements and should be read in conjunction with the
Company's audited financial statements for the year ended June 30, 2020.
Reliance Weaving Mills Ltd. (the Company) was incorporated in Pakistan as a public
limited company on April 07, 1990 under the Companies Ordinance, 1984 (now the
Companies Act, 2017) and its shares are quoted on Pakistan Stock Exchange Ltd. The
Company commenced its operations on May 14, 1990 and is principally engaged in the
manufacture and sale of yarn and fabric. The registered office of the Company is situated
at second Floor, Trust Plaza, L.M.Q. Road, Multan and its mills are located at Fazalpur
Khanewal Road, Multan and Mukhtarabad, Chak Beli Khan Road, Rawat, Rawalpindi.
These condensed interim financial statements have been prepared in accordance with
the accounting and reporting standards as applicable in Pakistan for interim financial
reporting. The accounting and reporting standards as applicable in Pakistan for interim
financial reporting comprise of:
International Accounting Standard ( IAS) 34, ''Interim financial reporting'', issued by the
International Accounting Standards Board (IASB) as notified under the Companies Act,
2017; and
Operating fixed assets 5.1 7,742,319 6,238,305
Capital work-in-progress 46,087 72,480
Right-of-use assets 5.2 85,753 82,607
7,874,159 6,393,392
Where the provisions of and directives issued under the Companies Act, 2017 differ with the requirements of IAS 34, the provisions of and directives issued under the Companies Act, 2017 have been followed.
Un-audited Audited
March 31 June 30
2021 2020
Note -------Rupees in ''000''-------
NOTES TO CONDENSED INTERIMFINANCIAL INFORMATION (UN-AUDITED)FOR THE PERIOD ENDED MARCH 31, 2021
1st Quarterly Accounts17
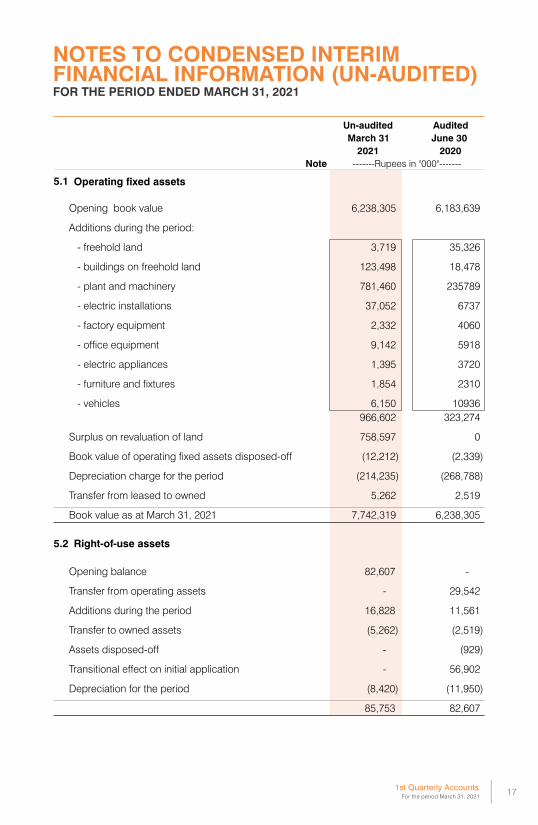
5.1 Operating fixed assets
Opening book value 6,238,305 6,183,639
Additions during the period:
- freehold land 3,719 35,326
- buildings on freehold land 123,498 18,478
- plant and machinery 781,460 235789
- electric installations 37,052 6737
- factory equipment 2,332 4060
- office equipment 9,142 5918
- electric appliances 1,395 3720
- furniture and fixtures 1,854 2310
- vehicles 6,150 10936
966,602 323,274
Surplus on revaluation of land 758,597 0
Book value of operating fixed assets disposed-off (12,212) (2,339)
Depreciation charge for the period (214,235) (268,788)
Transfer from leased to owned 5,262 2,519
Book value as at March 31, 2021 7,742,319 6,238,305
5.2 Right-of-use assets
Opening balance 82,607 -
Transfer from operating assets - 29,542
Additions during the period 16,828 11,561
Transfer to owned assets (5,262) (2,519)
Assets disposed-off - (929)
Transitional effect on initial application - 56,902
Depreciation for the period (8,420) (11,950)
85,753 82,607
For the period March 31, 2021
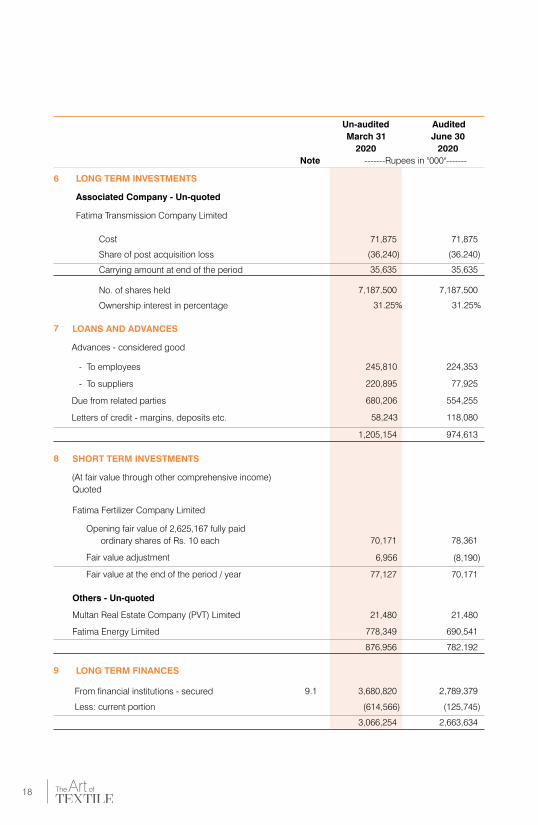
6 LONG TERM INVESTMENTS
Associated Company - Un-quoted
Fatima Transmission Company Limited
7 LOANS AND ADVANCES
Advances - considered good
- To employees
- To suppliers
Due from related parties
Letters of credit - margins, deposits etc.
8 SHORT TERM INVESTMENTS
(At fair value through other comprehensive income)
Quoted
Fatima Fertilizer Company Limited
Opening fair value of 2,625,167 fully paid
ordinary shares of Rs. 10 each
Fair value adjustment
Fair value at the end of the period / year
Others - Un-quoted
Cost
Share of post acquisition loss
Carrying amount at end of the period
No. of shares held
Ownership interest in percentage
Multan Real Estate Company (PVT) Limited
Fatima Energy Limited
9 LONG TERM FINANCES
From financial institutions - secured
Less: current portion
Un-audited Audited
March 31 June 30
2020 2020
Note -------Rupees in ''000''-------
18
245,810 224,353
220,895 77,925
680,206 554,255
58,243 118,080
1,205,154 974,613
70,171 78,361
6,956 (8,190)
77,127 70,171
71,875 71,875
(36,240) (36,240)
35,635 35,635
7,187,500 7,187,500
31.25% 31.25%
21,480 21,480
778,349 690,541
876,956 782,192
9.1 3,680,820 2,789,379
(614,566) (125,745)
3,066,254 2,663,634
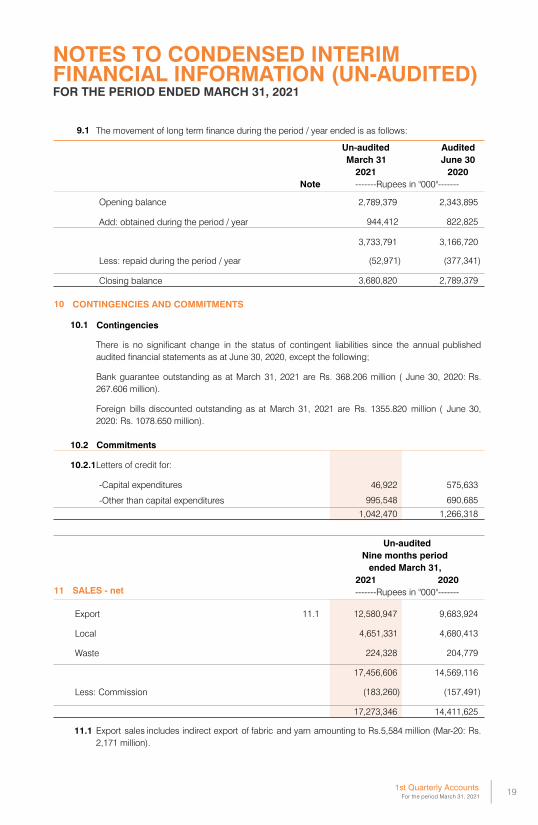
11.1 Export sales includes indirect export of fabric and yarn amounting to Rs.5,584 million (Mar-20: Rs.
2,171 million).
9.1 The movement of long term finance during the period / year ended is as follows:
Opening balance 2,789,379 2,343,895
Add: obtained during the period / year 944,412 822,825
3,733,791 3,166,720
Less: repaid during the period / year (52,971) (377,341)
Closing balance 3,680,820 2,789,379
10 CONTINGENCIES AND COMMITMENTS
10.1 Contingencies
10.2 Commitments
10.2.1Letters of credit for:
-Capital expenditures 46,922 575,633
-Other than capital expenditures 995,548 690,685
1,042,470 1,266,318
11 SALES - net
Export 11.1 12,580,947 9,683,924
Local 4,651,331 4,680,413
Waste 224,328 204,779
17,456,606 14,569,116
Less: Commission (183,260) (157,491)
17,273,346 14,411,625
Foreign bills discounted outstanding as at March 31, 2021 are Rs. 1355.820 million ( June 30,
2020: Rs. 1078.650 million).
There is no significant change in the status of contingent liabilities since the annual published
audited financial statements as at June 30, 2020, except the following;
Bank guarantee outstanding as at March 31, 2021 are Rs. 368.206 million ( June 30, 2020: Rs.
267.606 million).
Un-audited Audited
March 31 June 30
2021 2020
Note -------Rupees in ''000''-------
2021 2020
Un-audited
Nine months period
ended March 31,
-------Rupees in ''000''-------
NOTES TO CONDENSED INTERIMFINANCIAL INFORMATION (UN-AUDITED)FOR THE PERIOD ENDED MARCH 31, 2021
1st Quarterly Accounts19
For the period March 31, 2021

20
12 TRANSACTIONS WITH RELATED PARTIES
Nature of transaction
Associated undertakings
- purchase of goods 83,503 203,296
- mark-up income 1,744 23,472
- mark-up expense 4,303
960
- advances obtained 905,236 614,600
- advances repaid 1,147,889
974,133
- other expenses shared 17,222
18,739
Key management personnel
- remuneration and other benefits 20,646 20,464
Donations to Mian Mukhtar A. Sheikh Trust 18,000 16,663
All transaction with related parties have been carried-out on commercial terms and conditions.
13 FINANCIAL RISK MANAGEMENT
14 CAPITAL MANAGEMENT
The Company's financial risk management objective and policies are consistent with those
disclosed in the financial statements as at and for the year ended June 30, 2020.
The Company's capital management objective and policies are consistent with those disclosed in
the financial statements as at and for the year ended June 30, 2020.
The related parties comprise of associated companies, undertakings and key management
personnel. The Company in the normal course of business carries-out transactions with various
related parties. Amounts due from and to related parties are shown under receivables and
payables. Other significant transactions with related parties are as follows:
2021 2020
Un-audited
Nine months period
ended March 31,
Rupees in thousand
NOTES TO CONDENSED INTERIMFINANCIAL INFORMATION (UN-AUDITED)FOR THE PERIOD ENDED MARCH 31, 2021
1st Quarterly AccountsFor the period March 31, 2021
21
15
SE
GM
EN
T R
EP
OR
TIN
G
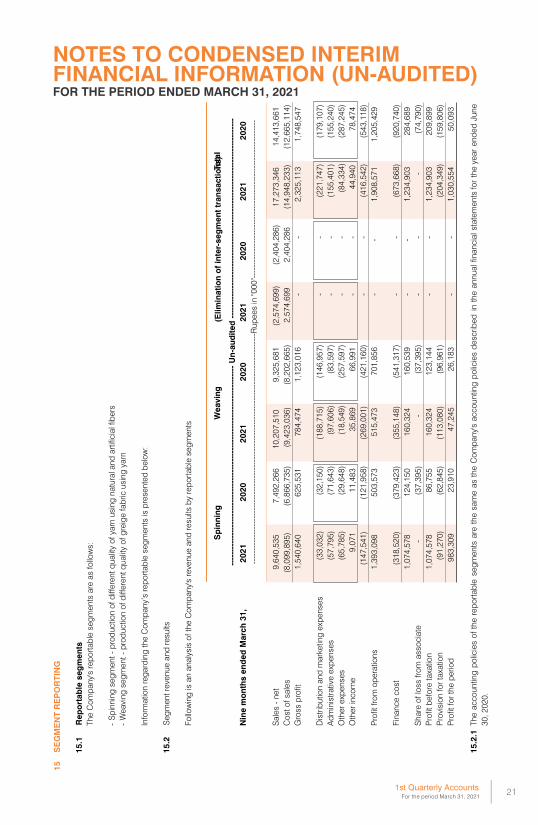
15.1
Re
po
rtab
le s
eg
me
nts
- -
15.2
Seg
men
t re
ven
ue a
nd
resu
lts
2021
2020
2021
2020
2021
2020
2021
2020
Sa
les
- n
et
9,6
40
,53
57
,49
2,2
66
1
0,2
07
,51
09
,32
5,6
81
(2,5
74
,69
9)
(2,4
04
,28
6)
17
,27
3,3
46
14
,41
3,6
61
Co
st o
f sa
les
(8,0
99
,89
5)
(6,8
66
,73
5)
(9,4
23
,03
6)
(8,2
02
,66
5)
2,5
74
,69
92
,40
4,2
86
(14
,94
8,2
33
)(1
2,6
65
,11
4)
Gro
ss p
rofit
1,5
40
,64
06
25
,53
1
78
4,4
74
1,1
23
,01
6
--
2,3
25
,11
31
,74
8,5
47
Dis
trib
utio
n a
nd
ma
rketin
g e
xpen
ses
(33
,03
2)
(32
,15
0)
(18
8,7
15
)
(14
6,9
57
)
--
(22
1,7
47
)(1
79
,10
7)
Ad
min
istr
ativ
e e
xpen
ses
(57
,79
5)
(71
,64
3)
(97
,60
6)
(83
,59
7)
--
(15
5,4
01
)(1
55
,24
0)
Oth
er
exp
en
ses
(65
,78
5)
(29
,64
8)
(18
,54
9)
(25
7,5
97
)-
-(8
4,3
34
)(2
87
,24
5)
Oth
er
inco
me
9,0
71
11
,48
33
5,8
69
66
,99
1-
-4
4,9
40
78
,47
4
(14
7,5
41
)(1
21
,95
8)
(26
9,0
01
)(4
21
,16
0)
--
(41
6,5
42
)(5
43
,11
8)
Pro
fit f
rom
op
era
tion
s1
,39
3,0
98
50
3,5
73
51
5,4
73
70
1,8
56
--
1,9
08
,57
11
,20
5,4
29
Fin
an
ce c
ost
(3
18
,52
0)
(37
9,4
23
)(3
55
,14
8)
(54
1,3
17
)-
-(6
73
,66
8)
(92
0,7
40
)
1,0
74
,57
81
24
,15
01
60
,32
41
60
,53
9-
-1
,23
4,9
03
28
4,6
89
Sh
are
of
loss
fro
m a
sso
cia
te-
(37
,39
5)
-(3
7,3
95
)-
--
(74
,79
0)
Pro
fit b
efo
re t
axa
tion
1,0
74
,57
88
6,7
55
16
0,3
24
12
3,1
44
--
1,2
34
,90
32
09
,89
9
Pro
visi
on
fo
r ta
xatio
n(9
1,2
70
)(6
2,8
45
)(1
13
,08
0)
(96
,96
1)
(20
4,3
49
)(1
59
,80
6)
Pro
fit f
or
the p
erio
d9
83
,30
92
3,9
10
47
,24
52
6,1
83
--
1,0
30
,55
45
0,0
93
15.2
.1
Th
e C
om
pa
ny'
s re
po
rta
ble
seg
men
ts a
re a
s fo
llow
s:
Sp
inn
ing
seg
men
t -
pro
du
ctio
n o
f d
iffere
nt
qu
alit
y o
f ya
rn u
sin
g n
atu
ral a
nd
art
ificia
l fib
ers
Wea
vin
g s
eg
men
t -
pro
du
ctio
n o
f d
iffere
nt
qu
alit
y o
f g
reig
e f
ab
ric u
sin
g y
arn
Info
rma
tion
reg
ard
ing
th
e C
om
pa
ny’
s re
po
rta
ble
seg
men
ts is
pre
sen
ted
belo
w:
Fo
llow
ing
is a
n a
na
lysi
s o
f th
e C
om
pa
ny'
s re
ven
ue a
nd
resu
lts b
y re
po
rta
ble
seg
men
ts
(Elim
inati
on
of
inte
r-se
gm
en
t tr
an
sacti
on
s)
Tota
l
----
----
----
----
----
----
----
----
----
----
----
----
----
----
----
----
----
----
- U
n-a
ud
ite
d -
----
----
----
----
----
----
----
----
----
----
----
----
----
----
----
----
----
----
Nin
e m
on
ths e
nd
ed
Marc
h 3
1,
----
----
----
----
----
----
----
----
----
----
----
----
----
----
----
----
----
----
----
----
----
--R
up
ees
in "
00
0"-
----
----
----
----
----
----
----
----
----
----
----
----
----
----
--
Th
ea
cco
un
ting
po
licie
so
fth
ere
po
rta
ble
seg
men
tsa
reth
esa
me
as
the
Co
mp
an
y's
acco
un
ting
po
licie
sd
esc
rib
ed
inth
ea
nn
ua
lfin
an
cia
lst
ate
men
tsfo
rth
eye
ar
en
ded
Jun
e
30
, 2
02
0.
Sp
inn
ing
We
avin
g
22
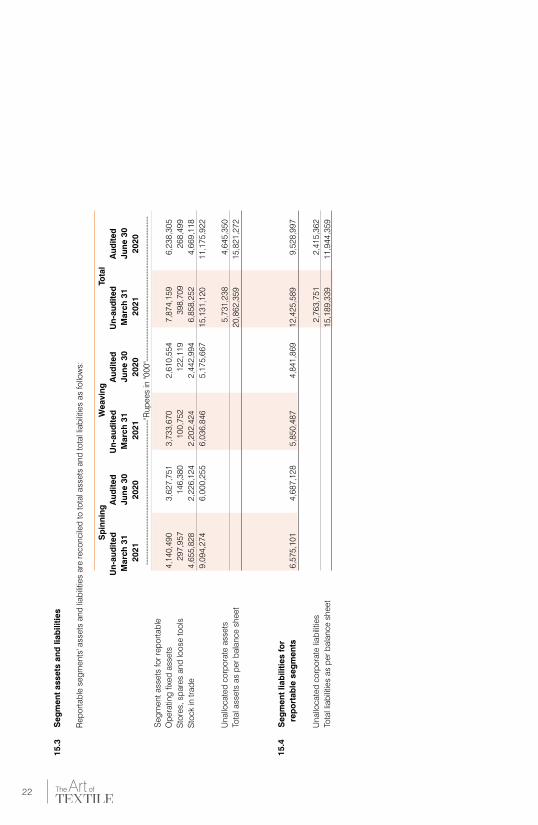
15.3
Se
gm
en
t asse
ts a
nd
lia
bilit
ies
Un
-au
dit
ed
Au
dit
ed
Un
-au
dit
ed
Au
dit
ed
Un
-au
dit
ed
Au
dit
ed
Marc
h 3
1Ju
ne
30
Marc
h 3
1Ju
ne
30
Marc
h 3
1Ju
ne
30
2021
2020
2021
2020
2021
2020
Op
era
ting
fix
ed
ass
ets
4,1
40
,49
0
3,6
27
,75
1
3,7
33
,67
0
2,6
10
,55
4
7,8
74
,15
96
,23
8,3
05
Sto
res,
sp
are
s a
nd
loo
se t
oo
ls2
97
,95
7
14
6,3
80
1
00
,75
2
12
2,1
19
3
98
,70
92
68
,49
9
Sto
ck
in t
rad
e4
,65
5,8
28
2,2
26
,12
42
,20
2,4
24
2,4
42
,99
46
,85
8,2
52
4,6
69
,11
8
9,0
94
,27
4
6,0
00
,25
5
6,0
36
,84
6
5,1
75
,66
7
15
,13
1,1
20
11
,17
5,9
22
Un
allo
ca
ted
co
rpo
rate
ass
ets
5,7
31
,23
84
,64
5,3
50
Tota
l ass
ets
as
per
ba
lan
ce s
heet
20
,86
2,3
59
15
,82
1,2
72
15.4
Se
gm
en
t liab
ilit
ies f
or
rep
ort
ab
le s
eg
me
nts
6,5
75
,10
14
,68
7,1
28
5,8
50
,48
74
,84
1,8
69
12
,42
5,5
89
9,5
28
,99
7
Un
allo
ca
ted
co
rpo
rate
lia
bili
ties
2,7
63
,75
12
,41
5,3
62
Tota
l lia
bili
ties
as
per
ba
lan
ce s
heet
15
,18
9,3
39
11
,94
4,3
59
----
----
----
----
----
----
----
----
----
----
----
----
----
-"R
up
ees
in "
00
0"-
----
----
----
----
----
----
----
----
----
----
----
----
----
Seg
men
t a
ssets
fo
r re
po
rta
ble
Rep
ort
ab
le s
eg
men
ts' a
ssets
an
d li
ab
ilitie
s a
re r
eco
ncile
d t
o t
ota
l ass
ets
an
d t
ota
l lia
bili
ties
as
follo
ws:
Sp
inn
ing
We
avin
gTo
tal
NOTES TO CONDENSED INTERIMFINANCIAL INFORMATION (UN-AUDITED)FOR THE PERIOD ENDED MARCH 31, 2021
Chief Executive
1st Quarterly AccountsFor the period March 31, 2021
23
16 CORRESPONDING FIGURES
16.1
16.2
17 DATE OF AUTHORIZATION
18 GENERAL
Figures have been rounded off to the nearest thousand rupees except as stated otherwise.
In order to comply with the requirements of IAS 34 "Interim financial reporting", the
condensed interim statement of financial position has been compared with the balances of
annual audited financial statements of the preceding financial year, whereas, condensed
interim statement of profit or loss, condensed interim statement of other comprehensive
income, condensed interim statement of changes in equity and condensed interim
statement of cash flows have been compared with the balances of comparable period of
Corresponding figures have been re-arranged and re-classified, wherever necessary, for the
purposes of comparison; however, no significant re-classifications / re-statements have
been made to these condensed interim financial statements.
These condensed interim financial information are authorized for issue on April 27, 2021 by the Board
of Directors of the Company.