Embed Size (px)
Citation preview

The Case for Global Listed Infrastructure
PUB LIC S ECURIT IE S G ROUP i | 3Q 2018 | INFR A S TRUC TUR E
Most of us don’t notice the critical role infrastructure plays in our everyday lives, when in fact, the essential products and services it provides is all around us. For example, we transport energy from the well to end users through a vast network of pipelines. Global commerce depends on a massive transportation system of roads, railroads, marine ports and airports to transport goods around the world. Our cell phones won’t work without wireless towers, or the electricity used to charge batteries and transmit data. These are just a few examples of how infrastructure intersects with everyday life.
1

Although infrastructure is a relatively new asset class, we have watched the allocations of institutional and individual investors grow markedly over the past decade—from about $5 billion invested 2005 to over $100 billion at the end of 2017. In part, we attribute this growth to the attractive historical return profiles of the asset class, which we highlight in the Appendix of this report. As shown in the Appendix and the exhibits of this reportii since inception, the Dow Jones Brookfield Global Infrastructure Composite Index (DJBC) since its July 14, 2008 inception has outperformed the MSCI World Index
on the basis of annual cash flow generation, income and capital appreciation and risk-adjusted returns. The DJBC has also generated higher returns when inflation rose unexpectedly over this time frame.
Inside we define this broadly diversified, $1 trillion investing universe and explore some of the favorable trends and secular growth drivers we see for the asset class. We also share some insights on asset valuations and our approach to portfolio construction, as specialized asset managers with a long history of managing infrastructure portfolios.
E X H I B I T 1 : G R O W T H O F A U M A L L O C AT E D T O G L O B A L I N F R A S T R U C T U R E S E C U R I T I E S
Source: eVestment Alliance LLC as of December 31, 2017.
T A B L E O F C O N T E N T S
How We Define the Global Infrastructure Equity Universe 3
Positive Trends that Bode Well for the Asset class 4
How We Approach the Investment Process 6
Our Closing Perspective: Active Management Matters 7
Appendix: What History Tells Us About the Return Profiles of Infrastructure Equities 8
$ Bi
llion
s
0
20
40
60
80
100
120
2017201620152014201320122011201020092008
THE CASE FOR GLOBAL LISTED INFRASTRUCTURE 2

The market capitalization of the global infrastructure equity universe exceeds $3 trillion on a free-float, market-capitalization-weighted basis. We divide this universe into four main sectors: Energy, Utilities, Transportation and Communications. Although these sectors are made up of very diverse industry groups and business models, they tend to share several fundamental characteristics:
■■ Monopolistic business models with high barriers to entry
■■ Steady demand for the essential goods and services they provide
■■ Pricing that is frequently linked to inflation
Below, we break down this diverse universe by geography, sector and industry group.
G L O B A L L I S T E D I N F R A S T R U C T U R E AT A G L A N C E THE GLOBAL UNIVERSE OF GLOBAL INFRASTRUCTURE EQUITIES IS BROADLY DIVERSIFIED BY GEOGRAPHY, SECTOR AND INDUSTRY GROUP
E X H I B I T 2 : B R O A D R E G I O N A L D I V E R S I F I C A T I O N E X H I B I T 3 : B R O A D S E C T O R D I V E R S I F I C A T I O N
As of June 2018. Source: Brookfield.
Source: Data represent Brookfield's global listed universe as of June 2018.
How We Define the Global Infrastructure Equity Universe
INFRASTRUCTURE EQUITIES—COMPANIES THAT OWN AND OPERATE INFRASTRUCTURE ASSETS—OFFER EXPOSURE TO THE SAME TYPES OF INVESTABLE ASSETS FOUND IN PRIVATE MARKETS. BUT THEY ALSO HAVE THE LIQUIDITY, TRANSPARENCY AND CORPORATE GOVERNANCE FOUND IN PUBLIC MARKETS.
ENERGY17.5%
TRANSPORTATION21.2%
COMMUNICATIONS5.1%
DIVERSIFIED & OTHER9.0%
UTILITIES47.2%
EUROPE15.7%U.K.
3.8%
ASIA 8.8%
AUSTRALIA/N.Z.2.9%
MIDDLE EAST & OTHER5.4% EUROPE
9.7%
U.S.50.8%
LATIN AMERICA
2.8%ENERGY
17.5%
TRANSPORTATION21.2%
COMMUNICATIONS5.1%
DIVERSIFIED & OTHER9.0%
UTILITIES47.2%
EUROPE15.7%U.K.
3.8%
ASIA 8.8%
AUSTRALIA/N.Z.2.9%
MIDDLE EAST & OTHER5.4% EUROPE
9.7%
U.S.50.8%
LATIN AMERICA
2.8%
TRANSPORTS(~90 COMPANIES) ■■ Airports■■ Toll Roads■■ Ports■■ Railroads
ENERGY INFRASTRUCTURE (~120 COMPANIES) ■■ Natural Gas ■■ Crude Oil & Refined Product Pipelines
■■ Liquid Natural Gas Export Storage
UTILITIES (~230 COMPANIES) ■■ Gas■■ Water ■■ Renewables/Electric Generation
■■ Electricity Transmission & Distribution
COMMUNICATIONS (~20 COMPANIES) ■■ Wireless Towers ■■ Broadcast Towers■■ Satellites ■■ Fiber/Wireline Networks
E X H I B I T 4 : A C R O S S S E C T I O N O F I N D U S T R Y G R O U P S
THE CASE FOR GLOBAL LISTED INFRASTRUCTURE 3
C R I T I C A L I N F R A S T R U C T U R E S P E N D I N G C O U L D A P P R O A C H $ 7 0 T R I L L I O N B Y 2 0 3 5
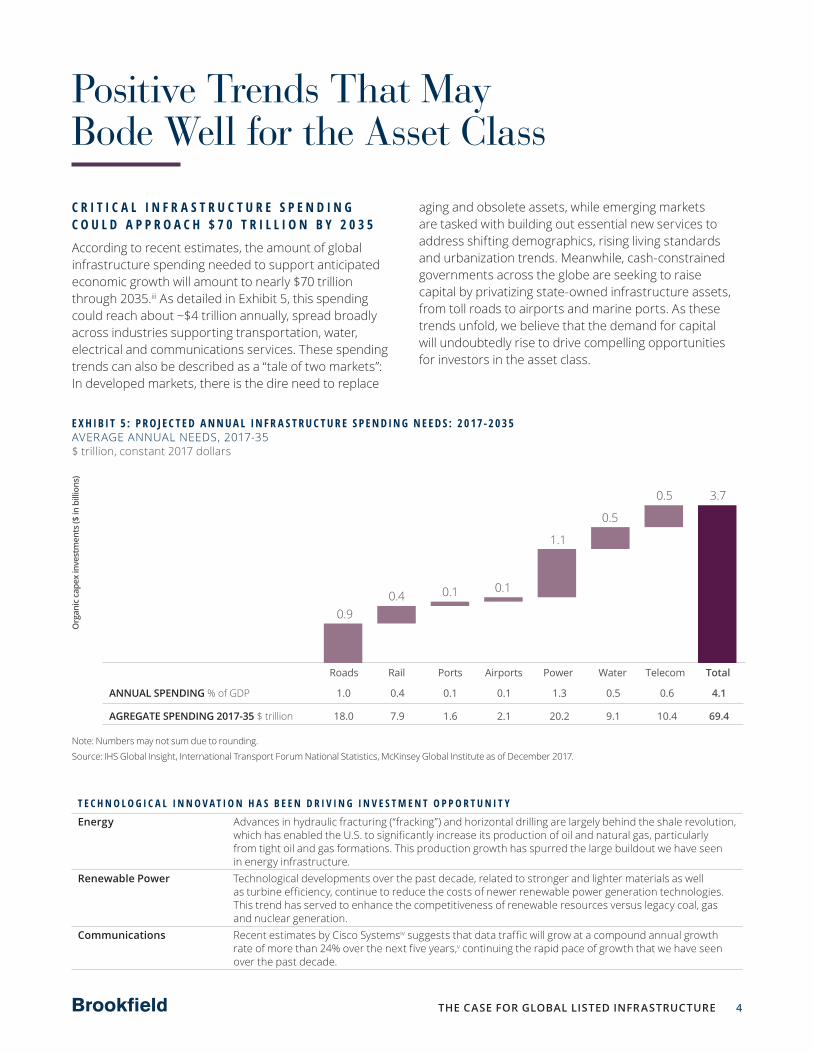
According to recent estimates, the amount of global infrastructure spending needed to support anticipated economic growth will amount to nearly $70 trillion through 2035.iii As detailed in Exhibit 5, this spending could reach about ~$4 trillion annually, spread broadly across industries supporting transportation, water, electrical and communications services. These spending trends can also be described as a “tale of two markets”: In developed markets, there is the dire need to replace
aging and obsolete assets, while emerging markets are tasked with building out essential new services to address shifting demographics, rising living standards and urbanization trends. Meanwhile, cash-constrained governments across the globe are seeking to raise capital by privatizing state-owned infrastructure assets, from toll roads to airports and marine ports. As these trends unfold, we believe that the demand for capital will undoubtedly rise to drive compelling opportunities for investors in the asset class.
E X H I B I T 5 : P R O J E C T E D A N N U A L I N F R A S T R U C T U R E S P E N D I N G N E E D S : 2 0 17-2 0 3 5 AVERAGE ANNUAL NEEDS, 2017-35 $ trillion, constant 2017 dollars
Note: Numbers may not sum due to rounding.
Source: IHS Global Insight, International Transport Forum National Statistics, McKinsey Global Institute as of December 2017.
Org
anic
cap
ex in
vest
men
ts ($
in b
illio
ns)
TotalTelecomWaterPowerAirportsPortsRailRoads
3.70.5
0.5
1.1
0.10.10.40.9
ANNUAL SPENDING % of GDP
AGREGATE SPENDING 2017-35 $ trillion
1.0
18.0
0.4
7.9
0.1
1.6
0.1
2.1
1.3
20.2
0.5
9.1
0.6
10.4
4.1
69.4
Positive Trends That May Bode Well for the Asset Class
T E C H N O L O G I C A L I N N O V A T I O N H A S B E E N D R I V I N G I N V E S T M E N T O P P O R T U N I T Y
Energy Advances in hydraulic fracturing (“fracking”) and horizontal drilling are largely behind the shale revolution, which has enabled the U.S. to significantly increase its production of oil and natural gas, particularly from tight oil and gas formations. This production growth has spurred the large buildout we have seen in energy infrastructure.
Renewable Power Technological developments over the past decade, related to stronger and lighter materials as well as turbine efficiency, continue to reduce the costs of newer renewable power generation technologies. This trend has served to enhance the competitiveness of renewable resources versus legacy coal, gas and nuclear generation.
Communications Recent estimates by Cisco Systemsiv suggests that data traffic will grow at a compound annual growth rate of more than 24% over the next five years,v continuing the rapid pace of growth that we have seen over the past decade.
THE CASE FOR GLOBAL LISTED INFRASTRUCTURE 4

W E B E L I E V E T H A T G L O B A L I N F R A S T R U C T U R E V A L U A T I O N S A R E V E R Y A T T R A C T I V E , R E L A T I V E T O G L O B A L E Q U I T I E S
While the fundamental factors in the previous section are all important considerations, our investment process is primarily focused on the relationship between company share prices to their asset valuations. One commonly used metric used to compare individual company valuations is the ratio of enterprise value to EBITDA (Earnings Before Interest, Taxes, Depreciation and Amortization). We can also use this metric more broadly to evaluate the relative valuations of publicly traded indexes. Below we compare the Dow Jones Global Infrastructure Composite Index and the broader S&P 500 Index on this basis. Notably, at June 30, 2018, the index valuation of infrastructure equities stood at 1.9 standard deviations below its 10-year average, while hovering near its 10-year low.
W H Y W E U S E E V/ E B I T D A R AT H E R T H A N P/ E …
We believe that comparing companies on the basis of EV/EBITDA better accounts for company-to-company differences in i) tax/depreciation regimes across our global asset class, and ii) the varying degrees of financial leverage employed across sectors. Note that, similar to the price-to-earnings ratio,vi the lower the EV/EBITDA measure, the less expensive the price of the equity is, relative to its valuation. As such, we believe the EV/EBITDA comparison in Exhibit 6 below points to the relative attractiveness of global infrastructure equities, versus broad-based global equities.
E X H I B I T 6 : R A T I O O F E V / E B I T D A : G L O B A L L I S T E D I N F R A S T R U C T U R E V S . T H E S & P 5 0 0 I N D E X
Source: Bloomberg as of June 30, 2018. Data compare the ratio of EV/EBITDA between the Dow Jones Brookfield Infrastructure Composite Index and the S&P 500 Index, which is used to represent broad equities. Brookfield has no direct role in the day-to-day management of the Dow Jones Brookfield Composite Index. EBITDA is the company’s earnings before interest, taxes, depreciation and amortization. Enterprise Value (“EV”) is the enterprise value of a company and is calculated by adding the following: the market value of common stock + market value of preferred equity + market value of debt + minority interest – cash and investments. Brookfield Investment Management cannot warrant that EV/EBITDA or yield levels will meet historical percentages shown above. Like U.S. broad equities, the investment objectives of infrastructure equities tend to be focused on income and capital appreciation. Infrastructure securities involve risk, including the full loss of principal. The tax treatment of returns of the asset classes listed above may differ given different tax treatment of income versus capital gain and other factors, such as the capital structure of the investment. Past performance does not guarantee future results. Index performance is not indicative of the performance of a Brookfield investment. To obtain fund performance call 1-855-777-8001 or visit our website, www.Brookfield.com.
1.40%
1.30%
1.50%
1.10%
1.20%
1.00%
0.80%
0.90%
Ratio of EV/EBITDA – DJB Composite Index vs. the S&P 500 IndexAverage
JUL2008
JUL2012
JUL2011
JUL2013
JUL2010
JUL2009
JUL2014
JUL2015
JUL2016
JUL2017
JUL2018
THE CASE FOR GLOBAL LISTED INFRASTRUCTURE 5

B A L A N C E S H E E T S A R E S T R O N G E R T H A N T H E Y ’ V E B E E N I N A D E C A D E
Our research shows that the balance sheets of infrastructure companies have been steadily improving since the July 2008 inception of the Dow Jones Brookfield Global Infrastructure Composite Index. As shown in Exhibit 7, the ratio of total debt-to-capitalization is slightly below the inception-to-date average and significantly lower than
it was in the depths of the global financial crisis. Exhibit 8 shows that companies have been refinancing their debt at lower rates, which has resulted in the lowest interest expense over the same time frame. As a result, we believe these companies are well positioned to finance long-term growth opportunities across the global infrastructure universe.
E X H I B I T 7 : T O TA L D E B T T O M A R K E T C A P I TA L I Z AT I O N (%) E X H I B I T 8 : I N T E R E S T E X P E N S E : (% O F E B I T * )
50
51
52
53
54
55
56
57
201820172016201520142013200820122011201020092008
AVERAGE54.2%
Perc
ent
3.0
3.5
4.0
4.5
5.0
5.5
6.0
201820172016201520142013200820122011201020092008
AVERAGE4.8%
Perc
ent
Source: FactSet from September 30, 2008 (the first quarter-end after the inception of the DJBC) through June 30, 2018. Data reflect historical characteristics of companies comprising the Dow Jones Brookfield Global Infrastructure Composite Index. Brookfield has no day-to-day role in the management of the Dow Jones Brookfield Global Infrastructure Composite Index. See index definitions at the end of this report. * EBIT is earnings before interest and taxes.
Source: Brookfield Investment Management.
Our investment team conducts in-depth, bottom-up fundamental analysis to evaluate each company based on factors such as its equity valuation, management quality and balance sheet strength. Bottom up security
selection is at the heart of our investment process. As highlighted in Exhibit 9 below, we draw from a diverse opportunity set, composed of four sectors each with distinct fundamental drivers.
How We Approach the Investment Process
E X H I B I T 9 : O U R A S S E S S M E N T O F F U N D A M E N T A L G R O W T H D R I V E R S B Y S E C T O R T H E D R I V E R S O F G R O W T H F O R E A C H I N F R A S T R U C T U R E S E C T O R A R E F U N D A M E N TA L LY D I S T I N C T.
UTILITIESENERGY INFRASTRUCTURE TRANSPORTATION COMMUNICATIONS
■■ Gas ■■ Water ■■ Renewables/Electric Generation ■■ Electricity Transmission &
Distribution
■■ Natural Gas, Crude Oil & Refined Products Pipelines
■■ Liquid Natural Gas (“LNG”) Exports ■■ Storage
■■ Airports ■■ Toll Roads ■■ Ports ■■ Railroads
■■ Wireless Towers■■ Broadcast Towers■■ Satellites■■ Fiber/Wireline Networks
WHERE WE SEE OPPORTUNITIES FOR GROWTH
■■ Declining costs of renewable power generation
■■ Adaptation of the transmission & distribution network for greater reliability and growth in renewable power loads
■■ U.S. water infrastructure in dire need of replacement
■■ Massive oil and natural gas volume growth requiring new pipelines
■■ Expanding oil exports in the U.S.■■ Expanding global demand for LNG■■ Widespread conversions from coal
to natural gas■■ Increasing petrochemical
manufacturing in the U.S., as natural gas liquids emerge as a durable low-cost feedstock.
■■ Toll road infrastructure investment in U.S. through public/private partnerships
■■ Increasing air travel in emerging markets (in some cases cheaper than bus travel)
■■ Exponential increase in data consumption and the need for cell tower infrastructure construction/densification
THE CASE FOR GLOBAL LISTED INFRASTRUCTURE 6

2009 2010 2011 2012 2013 2014 2015 2016 2017YTD 2018
GAP BETWEEN TOP & BOTTOM PERFORMER 81 40 47 32 35 30 46 39 48 30
MLPs 76 37 24 33 39 30 14 32 35 6Communications 59 36 20 30 28 29 1 22 25 2Ports 36 27 19 14 26 23 0 18 17 1Diversified 32 23 14 13 23 21 -4 16 12 1Oil & Gas Storage & Transportation 30 17 11 11 19 19 -4 8 12 -3
Rail 30 11 10 9 15 17 -5 6 8 -3Airports 23 10 10 8 13 16 -6 5 2 -3Toll Roads 22 5 9 5 11 14 -23 3 -2 -4Utilities 12 1 -4 5 8 10 -30 -1 -6 -5Electricity Transmission & Distribution 7 1 -9 4 5 5 -31 -7 -7 -10
Water -4 -3 -24 1 -4 0 -33 -8 -13 -24
As we construct portfolios, we are also mindful that infrastructure sectors are subject to very different
macroeconomic sensitivities. Exhibit 10 highlights these relative sensitivities on a sector-by-sector basis.
Our case for global infrastructure is centered on four core categories of companies that provide infrastructure products and services: transportation, energy infrastructure, utilities, and communications. As shown in this report, these groups are composed of diverse industry groups, each with distinct fundamental
characteristics and macroeconomic sensitivities (e.g., economic activity and changes in interest rates and inflation). In our view, these factors underlie the wide dispersion observed in the historical index returns of infrastructure sectors, as highlighted in Exhibit 11 below.
Our Closing Perspective: Active Management Matters
Source: Brookfield as of September 2018. For illustrative purposes only. Investing involves risk. Risks are subject to change without notice. Ratings are the opinions of Brookfield Investment Management and subject to change without notice. Criteria are ranked for each sector on a relative basis, based on our assessment of the historical return profiles we have observed among infrastructure sectors of the Dow Jones Brookfield Global Infrastructure Composite Index and various GICS sectors of the S&P 500 Index.
Source: Bloomberg as of June 30, 2018. Gap between the highest and lowest performance does not necessarily indicate positive performance during the time period. Past performance is no guarantee of future results. Performance as measured by the indexes including: Ports, Airports, Water, Electricity Transmission & Distribution, Communications, Diversified, Toll Roads, and Oil & Gas Storage & Transportation reflect the sector indices of the Dow Jones Brookfield Global Infrastructure Index. MLPs reflect the Dow Jones Brookfield Infrastructure MLP Index. Rail reflects the S&P 500 Rail Index. Utilities reflects the S&P 500 Utilities Index. Performance does not constitute the performance of a Brookfield mutual fund or Composite. Brookfield does not a direct role in the day-to- day management of the Dow Jones Brookfield Global Infrastructure Composite Index. See Appendix for additional disclosures.
INFRASTRUCTURE EQUITIES HAVE VARYING DEGREES OF SENSITIVITY TO MACROECONOMIC FACTORS.
INDUSTRY GROUPECONOMIC SENSITIVITY
INTEREST RATE SENSITIVITY
INFLATION SENSITIVITY
Airports STRONG MEDIUM STRONG
Communications MEDIUM MEDIUM STRONG
Electricity Transmission and Distribution LIMITED STRONG MEDIUM
Energy Infrastructure MEDIUM MEDIUM MEDIUM
Ports STRONG LIMITED MEDIUM
Toll Roads STRONG MEDIUM STRONG
Rails STRONG LIMITED STRONG
MLPs MEDIUM MEDIUM MEDIUM
E X H I B I T 10 : M A C R O E CO N O M I C S E N S I T I V I T Y B Y S E C T O R
E X H I B I T 11 : H I S T O R I C A L LY W I D E D I S P E R S I O N I N A N N U A L S E C T O R R E T U R N S (%) A N N UA L R E T U R N S B Y S E C TO R S ( LO C A L C U R R E N C Y ) .
TOP
PERF
ORM
ERS
BOTT
OM
PER
FORM
ERS
THE CASE FOR GLOBAL LISTED INFRASTRUCTURE 7

In our view, the periodic shifts observed in market leadership—marked by wide gaps between the top-and bottom-performing component of each sector—speak to the importance of choosing an actively managed strategy spread across sectors and geographies. Further supporting the case for active securities selection is the wide dispersion in the returns of companies underlying each sector.
In our view, the current market offers an attractive entry point for investors, based on infrastructure valuations relative to global equities and the favorable industry trends outlined in this report. While some of the companies in these sectors are also found in broad-market equity indexes, overall there is very little overlap—with less than 3% of the MSCI World
M O R E C O N S I S T E N T A N D H I G H E R C A S H F L O W G E N E R A T I O N V E R S U S G L O B A L E Q U I T I E S
Historical index returns point to steady streams of cash flow generated by infrastructure equities, which, since the 2008 inception of the Dow Jones Brookfield Global Infrastructure Composite Index, have outpaced global equities. We believe the stability of these cash flows is structural, as infrastructure characterized by the presence of regulation or long-lived contracts that reduce competition, and in most cases, provide investors with a high degree of transparency throughout the asset's life.
Exhibit 12 compares the historical annual growth of EBITDA (Earnings Before Interest, Taxes Depreciation and Amortization—a commonly used measure of cash-flow-generation capacity) for the Dow Jones Brookfield Global Infrastructure Composite Index versus the MSCI World Index.
Index and S&P 500 Index market capitalizations. Thus, even though the correlations of global infrastructure and global equities are generally high, an allocation to infrastructure investors may serve to diversify the holdings of a traditional portfolio allocated to broad equity and fixed-income securities.
The Appendix that follows summarizes the historical return profiles of infrastructure equities, relative to more broad-based global equities. This analysis over the life of the Dow Jones Brookfield Infrastructure Composite Index shows that infrastructure equities have historically provided more consistent and higher cash flows than more broad-based global equities, with greater income returns, greater capital appreciation and more favorable risk-adjusted returns.vii
Infrastructure equities have a long history of providing attractive investment characteristics. Since the 2008 inception of the Dow Jones Brookfield Global Infrastructure Composite Index, global infrastructure has outperformed global equities on the following dimensions: more consistent and higher cash flow generation, high income returns and capital appreciation, positive sensitivity to inflation, resiliency in periods of rising interest rates and better risk-adjusted returns.
Appendix: What History Tells Us About the Return Profiles of Infrastructure Equities
E X H I B I T 1 2 : A N N U A L E B I T D A G R O W T H G L O B A L I N F R A S T R U C T U R E E Q U I T I E S V S . G L O B A L E Q U I T I E S
-5%
0%
5%
10%
15%
20%
201720162015201420132012201120102009
7.44AVERAGE
6.00AVERAGE
16
9 9 865
75 5
9 88886
-2
42
Global Infrastructure Global Equities
Past performance is no guarantee of future results. Data includes full-year periods beginning in 2009.
Brookfield Investment Management research and estimates; FactSet; S&P Dow Jones Indices; Merrill Lynch Global Quantitative Strategy; MSCI; IBES Estimates Thomson Reuters; Worldscope as of December 31, 2017. Global Infrastructure and Global Equities represent the Dow Jones Brookfield Global Infrastructure Composite Index and MSCI World Index, respectively. Global Infrastructure EBITDA growth is derived using the constituents of the Dow Jones Brookfield Global Infrastructure Composite Index. Brookfield Investment Management cannot warrant that cash flow levels will meet historical percentages shown.
Index performance is shown for illustrative purposes only and does not predict or depict the performance of any investment. The quoted indexes in this chart do not reflect deductions for fees, expenses or taxes. These indexes are unmanaged and cannot be purchased directly by investors. There may be material factors relevant to any such comparison such as differences in the volatility, and regulatory and legal restrictions between the indexes shown and an actively managed investment strategy. See the disclosures for index definitions. Investing in global listed infrastructure involves different risks, including the loss of principal. The tax treatment of returns of the asset classes listed above may differ given different tax treatment of income versus capital gain and other factors, such as the capital structure of the investment. Past performance does not guarantee future results. Index performance is not indicative of fund performance. To obtain fund performance call 1-855-777-8001 or visit our website, www.Brookfield.com.
THE CASE FOR GLOBAL LISTED INFRASTRUCTURE 8

H I G H E R I N C O M E A N D C A P I T A L A P P R E C I A T I O N T H A N G L O B A L E Q U I T I E S
F A V O R A B L E R I S K - A D J U S T E D R E T U R N S
Exhibit 13 shows the capital appreciation realized by infrastructure equities since the inception of the Dow Jones Global Infrastructure Composite Index, which has significantly exceeded that of global equities. Additionally, the income return has also exceeded that of global equities, as fully-built infrastructure assets experience the bulk of capital investment early in their lives and generate substantial free cash flow once they come into service.
We attribute the historically favorable risk/return characteristics of global infrastructure, versus global equities, to the long history of attractive current income characteristics found among infrastructure companies. Exhibit 14 compares the risk/return characteristics of global listed infrastructure to those of equities and bonds since the 2008 inception of the Dow Jones Brookfield Global Infrastructure Composite Index. Notably, listed infrastructure has generated higher total returns than global equities, with lower volatility, as measured by standard deviation. As a result, the Sharpe Ratio of global infrastructure was meaningfully higher than that of global equities.
E X H I B I T 1 3 : H I G H E R I N C O M E A N D C A P I T A L A P P R E C I A T I O N T H A N G L O B A L E Q U I T I E S
E X H I B I T 1 4 : 1 0 - Y E A R R I S K - R E W A R D
Source: Bloomberg for the period from September 30, 2008 through June 30, 2018. Global Equities represented by the MSCI World Index. Global infrastructure Dow Jones Brookfield Global Infrastructure Composite Index. Brookfield has no direct role in the day-to-day management of the Dow Jones Brookfield Global Infrastructure Index or the Dow Jones Brookfield Global Infrastructure Composite Index.
Index performance is shown for illustrative purposes only and does not predict or depict the performance of any investment. The quoted indexes in this chart do not reflect deductions for fees, expenses or taxes. These indexes are unmanaged and cannot be purchased directly by investors. There may be material factors relevant to any such comparison such as differences in the volatility, and regulatory and legal restrictions between the indexes shown and an actively managed investment strategy. See the disclosures for index definitions. Investing in global listed infrastructure involves different risks, including the loss of principal. The tax treatment of returns of the asset classes listed above may differ given different tax treatment of income versus capital gain and other factors, such as the capital structure of the investment. Past performance does not guarantee future results. Index performance is not indicative of fund performance. To obtain fund performance call 1-855-777-8001 or visit our website, www.Brookfield.com.
Source: Bloomberg from September 30, 2008 (the first quarter end from the inception of the Infrastructure Index) through June 30, 2018. Global Equities represented by the MSCI World Index. Global fixed income represented by the Bloomberg Barclays Global Aggregate Index. Global infrastructure represented by the Dow Jones Brookfield Global Infrastructure composite Index. Brookfield has no direct role in the management of the Dow Jones Brookfield Global Infrastructure Composite Index. Risk Free Rate is the ICE BofA Merrill Lynch 3-Month Treasury Index. The quoted indexes within this report do not reflect deductions for fees, expenses or taxes. These indexes are unmanaged and can for not be purchased directly by investors. Index performance is shown for illustrative purposes only and does not predict or depict the performance of any investment. There may be material factors relevant to any such comparison such as differences in the volatility, and regulatory and legal restrictions between the indexes shown and an actively managed investment strategy. See index definitions at the end of this report. Investing in global listed infrastructure involves different risks, including the loss of principal. The tax treatment of returns of the asset classes listed above may differ given different tax treatment of income versus capital gain and other factors, such as the capital structure of the investment. Standard Deviation measures the degree to which an investment’s return varies from its mean return. The higher the standard deviation, the higher the risk. Sharpe Ratio is a measure that indicates the average return minus the risk-free return divided by the standard deviation of return on an investment. The higher the Sharpe Ratio the lower the risk. Past performance does not guarantee future results. Index performance is not indicative of fund performance.
0%3%6%9%
12%15%
GlobalEquities
CapitalAppreciation
Income ReturnGlobal
Infrastructure
6.48%8.21%
2.18%3.62%
0 5 10 15 200
5
10
15
Annu
al To
tal R
etur
n (%
)
Standard Deviation (%)
Global Infrastructure
Global Equities
Global Bonds
Risk-Free Rate
S H A R P E R A T I O S : 9 / 3 0 / 0 8 - 6 / 3 0 / 1 8 MSCI World Index 0.39Bloomberg Barclays Global Aggregate Index 0.42Dow Jones Brookfield Infrastructure Composite Index 0.62
THE CASE FOR GLOBAL LISTED INFRASTRUCTURE 9

M O R E P O S I T I V E S E N S I T I V I T Y T O I N F L A T I O N
Over the long term, our research shows that global infrastructure equities have outperformed broad equity and fixed-income markets in periods of elevated inflation. We illustrate in Exhibit 15 with a study from September 2008 through June 2018, which compares the performance of global equities and global listed infrastructure over periods of unexpected inflation.
We attribute these results, in large part, to the contracted or regulated revenues of infrastructure assets, often with periodic escalators linked to inflation. We calculate that roughly 70% of the companies in our investible universe have inflation indexing built-in to their respective tariff mechanisms. In addition, even though end-user demand tends to be relatively inelastic (given the essential nature of infrastructure products and services), demand has generally risen in periods of rising inflation—particularly when rising prices are spurred by economic growth, job growth and higher consumption
E X H I B I T 1 5 : B E T T E R P E R F O R M A N C E I N P E R I O D S O F U N E X P E C T E D I N F L A T I O N
Source: Bloomberg for the period from September 30, 2008 through June 30, 2018. Greater-than/less-than expected inflation is defined as 4-quarter periods during which Seasonally Adjusted CPI-U was greater-than/less-than the trailing 12-month Survey of Professional Forecasters (SPF) Forecast one year prior. For the period September 30, 2008 through to June 30, 2018, during which there were 10 periods of greater-than-expected Inflation. Global Equities represented by the MSCI World Index. Global infrastructure represented by the Dow Jones Brookfield Global Infrastructure composite Index. Brookfield has no direct role in the day-to-day management of the Dow Jones Brookfield Global Infrastructure Composite Index. The quoted indexes within this report do not reflect deductions for fees, expenses or taxes. These indexes are unmanaged and can for not be purchased directly by investors. Index performance is shown for illustrative purposes only and does not predict or depict the performance of any investment. There may be material factors relevant to any such comparison such as differences in the volatility, and regulatory and legal restrictions between the indexes shown and an actively managed investment strategy. See index definitions at the end of this report. Investing in global listed infrastructure involves different risks, including the loss of principal. The tax treatment of returns of the asset classes listed above may differ given different tax treatment of income versus capital gain and other factors, such as the capital structure of the investment. Past performance does not guarantee future results. Index performance is not indicative of fund performance.
0%5%
10%15%20%25%
GlobalEquities
GlobalInfrastructure
16.18%21.55%
E N D N O T E Si. The Public Securities Group, or Brookfield Investment
Management, is a wholly owned subsidiary of Brookfield Asset Management
ii. See Exhibits 12 through 15 of this report.iii. Source: McKinsey Investment Institute, 2017iv. Cisco Visual Networking Index: Global Mobile Data Traffic Forecast
Update, 2016–2021; updated July 31, 2018.v. As of June 2017vi. A price-to-earnings ratio is the price of a company’s stock divided
by its earnings per share.vii. As evidenced by the exhibits in the Appendix
I M P O R T A N T D I S C L O S U R E S An investsor should consider a Fund’s investment objectives, risks, and charges and expenses carefully before investing or sending money. This and other important information can be found in the Fund’s prospectus. To obtain a prospectus, please call 855-777-8001 or visit our website, www.brookfield.com. Please read the prospectus carefully before investing.Investing in infrastructure involves risk. Principal loss is possible. Infrastructure companies may be subject to a variety of factors that may adversely affect their business, including high interest costs, high leverage, regulation costs, economic slowdown, surplus capacity, increased competition, lack of fuel availability and energy conversation policies. A fund may invest in small and mid-cap companies, which involve additional risks such as limited liquidity and greater volatility.
Investments in foreign securities involve greater volatility and political, economic and currency risks and differences in accounting methods. Investing in emerging markets may entail special risks relating to potential economic, political or social instability and the risks of nationalization, confiscation or the imposition of restrictions on foreign investment. Debt securities rated below investment grade are commonly referred to as “junk bonds” and are considered speculative. Increases in interest rates can cause the prices of Fixed Income securities to decline, and the level of current income from a portfolio of Fixed Income securities may decline in certain interest rate environments. Investments in lower-rated and non-rated securities present a greater risk of loss to principal and interest than higher-rated securities. Some securities held may be difficult to sell, particularly during times of market turmoil. If a fund is forced to sell an illiquid asset to meet redemption, it may be forced to sell at a loss. Investing in MLPs involves certain risks related to investing in the underlying assets of the MLPs and risks associated with pooled investment vehicles. MLPs holding credit-related investments are subject to interest rate risk and the risk of default on payment obligations by debt issuers. The risk of owning an ETF generally reflects the risks of owning the underlying securities the ETF holds. An ETN may be influenced by time to maturity, level of supply & demand for the ETN, volatility and lack of liquidity in the underlying securities’ markets, changes in the applicable interest rates, changes in the issuer’s credit rating and economic, legal, political or geographic events. The use of derivatives involves additional risks, may increase volatility and may not provide the result intended. Concentrating investments in specific sectors or industries may increase volatility. Past performance is no guarantee of future results.
THE CASE FOR GLOBAL LISTED INFRASTRUCTURE 10

Energy infrastructure companies are subject to risks specific to the industry such as fluctuations in commodity prices, reduced volumes of natural gas or other energy commodities, environmental hazards, changes in the macroeconomic or the regulatory environment or extreme weather.
D I S C L O S U R E SBrookfield Investment Management Inc. (the “Firm” ) is a wholly owned subsidiary of Brookfield Asset Management Inc. Opinions expressed herein are current opinions of the Firm, including its subsidiaries and affiliates, and are subject to change without notice. The Firm, including its subsidiaries and affiliates, assumes no responsibility to update such information or to notify client of any changes. Any outlooks, forecasts or portfolio weightings presented herein are as of the date appearing on this material only and are also subject to change without notice. Past performance is not indicative of future performance and the value of investments and the income derived from those investments can fluctuate. Future returns are not guaranteed and a loss of principal may occur. The information in this publication is not, and is not intended as investment advice, an indication of trading intent or holdings or the prediction of investment performance. Views and information expressed herein are subject to change at any time. The Firm disclaims any responsibility to update such views and/or information. This information is deemed to be from reliable sources; however, the Firm does not warrant its completeness or accuracy. This presentation is not intended to, and does not constitute an offer or solicitation to sell or a solicitation of an offer to buy any security, product, investment advice or service (nor shall any security, product, investment advice or service be offered or sold) in any jurisdiction in which the Firm is not licensed to conduct business, and/or an offer, solicitation, purchase or sale would be unavailable or unlawful.
Diversification does not assure a profit nor protect against loss in a declining market. Earnings growth is not representative of the Fund's future performance.
F O R W A R D – L O O K I N G S T A T E M E N T S Information herein contains, includes or is based upon forward-looking statements within the meaning of the federal securities laws, specifically Section 21E of the Securities Exchange Act of 1934, as amended. Forward-looking statements include all statements, other than statements of historical fact, that address future activities, events, or developments, including without limitation, business or investment strategy or measures to implement strategy, competitive strengths, goals, expansion and growth of our business, plans, prospects and references to the future of our success. You can identify these statements by the fact that they do not relate strictly to historical or current facts. Words such as “anticipate,” “estimate,” “expect,” “project,” “intend,” “plan,” “believe,” and other similar words are intended to identify these forward-looking statements. Forward-looking statements can be affected by inaccurate assumptions or by known or unknown risks and uncertainties. Many such factors will be important in determining our actual future results or outcomes. Consequently, no forward-looking statement can be guaranteed. Our actual results or outcomes may vary materially. Given these uncertainties, you should not place undue reliance on these forward-looking statements.
I N D E X D E F I N I T I O N S The Bloomberg Barclays Global Aggregate Index is a market capitalization-weighted index, comprising globally traded investment grade bonds. The index includes government securities, mortgage-backed securities, asset-backed securities and corporate securities to simulate the universe of bonds in the market. The maturities of the bonds in the index are more than one year. The Dow Jones Brookfield Global Infrastructure Composite Index is calculated and maintained by S&P Dow Jones Indices and comprises infrastructure companies with at least 70% of its annual cash flows derived from owning and operating infrastructure assets, including master limited
partnerships (“MLPs”). The Dow Jones Brookfield MLP Index includes MLPS of the Dow Jones Brookfield Infrastructure Composite Index. The firm has no direct role in the day-to-day management of the Dow Jones Brookfield Global Infrastructure Composite Index. Brookfield has no direct role in the day-to-day management of the Dow Jones Brookfield Infrastructure Composite Index or the Dow Jones Brookfield MLP Index. The ICE BofA Merrill Lynch 3-Month U.S. Treasury Bill Index is an unmanaged index representing monthly return equivalents of yield averages of the last 3-month Treasury Bill issues. The MSCI World Index is a free float-adjusted market capitalization weighted index that is designed to measure the equity market performance of developed markets. The S&P 500 Index includes 500 widely held U.S. companies. S&P 500 Rail Index includes railroads in the S&P 500 Index. The S&P Utilities Index comprises those companies included in the S&P 500 that are classified as members of the GICS® utilities sector. It is not possible to invest directly in an index. Debt-to-Capitalization is the amount of debt on a company's balance sheet divided by the total market capitalization of its publicly traded equities. Sharpe ratio is the average return earned in excess of the risk-free rate per unit of volatility or total risk. Standard Deviation is a statistical measure used to quantify the amount of variation or dispersion of a set of data values. Consumer Price Index for All Urban Consumers (CPI-U) measures the changes in the price of a basket of goods and services purchased by urban consumers.
I N D E X P R O V I D E R D I S C L A I M E R Brookfield Investment Management Inc. does not own or participate in the construction, or day-to-day management of the indices referenced in this document. The index information provided is for your information only and does not imply or predict that a Brookfield Investment Management Inc. product will achieve similar results. This information is subject to change without notice.
The Indices referenced in this document do not reflect any fees, expenses, sales charges, or taxes. It is not possible to invest directly in an index. The index sponsors permit use of their indices and related data on an “As Is” basis, makes no warranties regarding same, does not guarantee the suitability, quality, accuracy, timeliness, and/ or completeness of their index or any data included in, related to, or derived therefrom, assumes no liability in connection with the use of the foregoing. The index sponsors have no liability for any direct, indirect, special, incidental, punitive, consequential, or other damages (including loss profits). The index sponsors do not sponsor, endorse, or recommend Brookfield Investment Management Inc. or any of its products or services.
Quasar Distributors, LLC is the distributor of Brookfield Investment Funds and Brookfield Investment Management Inc. is the Investment Adviser.
C O N T A C T U STelephone: 1-855-777-8001 Email: [email protected] Or visit our website at www.brookfield.com© 2018 Brookfield Investment Management Inc.
© 2018 BROOKFIELD INVESTMENT MANAGEMENT INC. INVESTMENT PRODUCTS: NOT FDIC INSURED | MAY LOSE VALUE | NOT BANK GUARANTEED
THE CASE FOR GLOBAL LISTED INFRASTRUCTURE 11