Embed Size (px)
Citation preview

3D video visualization employing waveletmultilevel decomposition
Eduardo Ramos-Diaz* and Volodymyr PonomaryovNational Polytechnic Institute of Mexico, ESIME-Culhuacan, Mexico City, 04430, Mexico
*Corresponding author: [email protected]
Received 25 April 2011; revised 12 July 2011; accepted 13 July 2011;posted 27 September 2011 (Doc. ID 146447); published 4 November 2011
This study analyzed the implementation and performance of a framework that can be efficiently appliedto three-dimensional (3D) video sequence visualization. The proposed algorithm is based on wavelets andwavelet atomic functions used in the computation of disparity maps. The proposed algorithm employswavelet multilevel decomposition and 3D visualization via color anaglyphs synthesis. Simulations wererun on synthetic images, synthetic video sequences, and real-life video sequences. Results shows that thisnovel approach performs better in depth and spatial perception tasks compared to existingmethods, bothin terms of objective criteria such as quantity of bad disparities and similarity structural index measureand the more subjective measure of human vision. © 2011 Optical Society of AmericaOCIS codes: 100.7410, 330.4150, 110.3010, 110.4155.
1. Introduction
The design of an appropriate technique in the esti-mation of the disparity maps, which can enhance anumber of well-found disparities of an image or avideo sequence, is a fundamentally important andchallenging problem in the different applications. Adisparity map serves as a valuable source of infor-mation in various areas, such as three-dimensional(3D) visualization and modeling, robotic vision andnavigation, etc. In the literature, different techni-ques for disparity map estimation, such as opticalflow, matching techniques, and others, are proposed.Differential methods designed by Lucas and Kanade(L&K) and Horn and Schunck are explained in theliterature for optical flow techniques [1,2]. The dis-parity estimation can be performed using differentsimilarity measure, maximizing the normalizedcross-correlation function or minimizing the sum ofsquared difference (SSD) between matching imagesor frames [1,2]. One recent approach namedGEEMSF[3] employs the criterion of the minimum global errorenergy. Another proposed framework employs stereocorrespondence estimation based on wavelets and
multiwavelets techniques [4], where the wavelettransform (WT) is used to estimate the disparity map.The WT modulus is estimated from the vertical andhorizontal detail components, and the approximationcomponent is used to normalize this estimation.Finally, the normalized cross correlation is employedas a similarity metric.
Many techniques exist to visualize 3D information,such as polarized lens, active vision, anaglyph, etc.Anaglyph produces 3D perception when users viewthe 3D objects through spectacles with red and bluefilters, the red filter is placed in the left position.Anaglyph synthesis simply replaces the red channelin the first image with the red channel of the secondimage [5]. In this paper, we propose an efficientmethod to reconstruct a 3D video sequence from atwo-dimensional (2D) video sequence acquired by amoving camera. The algorithm uses wavelets orwavelets and wavelet atomic functions (WAFs) forthe disparity map estimation. Anaglyph synthesisis selected to display 3D information, because it doesnot require extra hardware and can be implementedon a standard display. This novel approach performssufficiently well at creating depth and spatial percep-tion in 3D images and video sequences, and it doesnot require intensive computational operations.
0003-6935/11/326084-08$15.00/0© 2011 Optical Society of America
6084 APPLIED OPTICS / Vol. 50, No. 32 / 10 November 2011

The rest of this paper is organized as follows:Section 2 presents the proposed framework, Section 3discusses simulation results, and Section 4 concludesthe paper.
2. Proposed Framework
The proposed approach includes the following stages:2D color video sequence decomposition, color compo-nent separation of each image, disparity map compu-tation from stereo pairs using WAF for the waveletmultilevel decomposition procedure, disparity mapimprovement via dynamic range (DM), anaglyphsynthesis applying nearest neighbor interpolation(NNI), and finally, visualization of a 3D video se-quence. A block diagram of the proposed algorithmis presented in Fig. 1.
Later, we explain in detail the principal 3Dreconstruction stages.
A. Disparity Map Computation
We propose using stereo correspondence based on awavelet technique with multilevel decomposition toestimate the disparity map. This technique is basedon the discrete WT (DWT) that usually is employedin a standard form with filter banks [6]. The WT isdefined as follows [4]:
Wi ¼ jWij expðjΘiÞ; ð1Þ
jWij ¼ ðjDh;ij2 þ jDv;ij2 þ jDd;ij2Þ12; ð2Þ
where jWij is the wavelet modulus on a chosen de-composition level i,Dh;i,Dv;i, andDd;i are the horizon-tal, vertical, and diagonal detail components on alevel i, and the phase Θi is defined as follows:
Θi ¼�
αi if Dh;i > 0π − αi if Dh;i < 0 ; αi ¼ tan−1ðDv;i=Dh;iÞ:
ð3Þ
Once the DWT is computed for each pair of thecolor neighbor frames extracted from the 2D videosequence input, a disparity map can be formed usingnormalized cross correlation:
CORiðx; yÞ ¼X
ða;bÞ∈Q
Wi;leftða; bÞ ·W�i;rightðxþ a; yþ bÞ� P
a;b∈QjWj2i;leftða; bÞ ·
Pa;b∈Q
jWj2i;rightðxþ a; yþ bÞ�1
2
; ð4Þ
where Wi;left and Wi:right are the wavelets for the leftand right images in each level i, and Q represents asliding processing window. The CORiðx; yÞ values re-present the similarity measures for each decomposi-tion level performed in the estimation of the finaldisparity map.
WAFs have already demonstrated successful per-formance when used in windowing during radarprocessing, recognition of medical images, speech re-construction, image processing, and multiple othertechnologies [7–9]. The use of WAFs in 3D visualiza-tion should provide accurate disparity map estima-tion and may improve 3D visualization. This paperinvestigates the most common wavelet families,including Daubechies, Symlets, Biorthogonal, andCoiflets.
We present the WAFs, starting with the basicatomic functions (AFs) ðup; f upN ;upm; πmÞ used asthe mother functions in wavelet design. The WAFwith unit norm has the following form [9,10]:
ψpθðxÞ ¼
expjπx hpθ ðxÞ
‖hpθðxÞ‖
; ð5Þ
where the function hpθ ðxÞ is determined as follows:
hpθ ðxÞ ¼
12p
Xðp−1Þ=2k¼0
Ckp
�θ�xþ p − 2k
2
�
þ θ�x −
p − 2k2
��odd p; ð6Þ
hpθ ðxÞ ¼
12p
" Xðp−2Þ=2k¼0
Ckp
�θ�xþ p − 2k
2
�
þ θ�x −
p − 2k2
��þ Cp=2
p θðxÞ#
even p; ð7Þ
Fig. 1. Block diagram of the proposed algorithm.
10 November 2011 / Vol. 50, No. 32 / APPLIED OPTICS 6085

for a chosen AF θðxÞand the number of zero momentsp for a WAF.
The basic AF upðxÞ is generated by the infinity-to-one convolutions of rectangular impulses with vari-able length of duration 2−k, according to the followingFourier transform:
upðxÞ ¼ 12π
Z∞
−∞
ejuxY∞k¼1
sinðu · 2−kÞu · 2−k
du: ð8Þ
The AF upmðxÞ, used below, is the generalization ofthe WAF upðxÞ and is defined as follows:
upmðxÞ ¼12π
Z∞
−∞
ejuxY∞k¼1
sin2�
muð2mÞk
�mu
ð2mÞk sin�
uð2mÞk
� du;
m ¼ 1; 2; 3… ð9Þ
The AF f upNðxÞ, which is also employed in thispaper, is defined as f upNðxÞ ¼ θNðxÞ � upð2xÞ ¼θN−1ðxÞ � upðxÞ and can be presented as the followingFourier transform:
f upNðxÞ ¼12π
Z∞
−∞
ejux
0B@sin
�u2
�u2
1CA
N Y∞k¼1
sinðu · 2−kÞu · 2−k
du:
ð10Þ
Finally, another AF πmðxÞ applied in this paper canbe presented using the following inverse Fouriertransform:
πmðtÞ ¼12π
Z∞
−∞
eixtΠmðtÞdt; ΠmðxÞ ¼Ymk¼1
�sinð2m − 1Þω=ð2mÞk þP
mν¼2ð−1Þν sinð2m − 2νþ 1Þω=ð2mÞν
�ð3m − 2Þω=ð2mÞk :
ð11Þ
Detailed definitions and properties of thesefunctions can be found in [9].
B. WAF Performance in Multilevel Decomposition
The wavelet decomposition procedure that uses sev-eral decomposition levels (from one to four) to en-hance the quality of the depth maps, is used. TheDWT and inverse DWT are usually employed usingfilter bank techniques for a scheme with only twofilters: low pass (LP) HðzÞ (decomposition) and ~HðzÞ(reconstruction), and high pass (HP)GðzÞ (decomposi-tion) and ~GðzÞ (reconstruction), where GðzÞ ¼ zHð−zÞand ~GðzÞ ¼ z−1Hð−zÞ. Figures 2(a) and 2(b) show thefrequency response levels for classical wavelets and
WAF for LP and HP decomposition filters, demon-strating that WAFs exhibit significantly betterfrequency selection performance than classical wave-lets (Biorthogonal and Coiflets). This improvement infrequency selection potentially facilitates better ap-proximation quality.
The projection angle θ between the synthesis andanalysis subspaces Va and ~Va is defined as follows:
cos θ ¼ inf g∈~Va
‖Pag‖L2
‖g‖L2
. This quantity is scale indepen-
dent, and it is possible to compare the performance ofthe biorthogonal projection ~Pa with the optimal leastsquares solution Pa for a given approximationspaceVa [9]:∀g ∈ L2, ‖g − Pag‖L2 ≤ ‖g − ~Pag‖L2 ≤ 1
cos θ‖g − Pag‖L2 . The biorthogonal projector will be essen-tially as good as the optimal (orthogonal) projector, ifthe value of cos θ is close to 1. This cosine is found asr ¼ essinf f∈½0;0:5�j~r12ðf Þj using the spectral coherence
function: j~r12ðf Þj ¼ jP
∞
k¼−∞~φ1ðf−kÞ~φ2ðf−kÞjffiffiffiffiffiffiffiffiffiffiffiffiffiffiffiffiffiffiffiffiffiffiffiffiffiffiffiffiP
∞
k¼−∞j~φ1ðf−kÞj2
p ffiffiffiffiffiffiffiffiffiffiffiffiffiffiffiffiffiffiffiffiffiffiffiffiffiffiffiffiP∞
k¼−∞j~φ2ðf−kÞj2
p ≤ 1
[11]. The computed values of the cosine projectionhave confirmed significantly better approximationfor WAF in comparison with classical wavelets:cos θ ¼ 09995 (fup4), cos θ ¼ 0:9997 (π6), cos θ ¼0:9967 (Bio1.3), cos θ ¼ 0:9964 (Coif3). The dispersionof the approximation for any function g according tothe estimation g is given as σ2g−g ¼ hjg − gj2i, and the
relative error is δ2 ¼ σ2g−g
σ2g¼ 2½1 − r�, where r is the
correlation coefficient equal to the cosine projection.It is easy to observe that r ¼ 0:9997 (for the WAF)can potentially produce relative rms error δ of2.45%. On the other hand, for classical wavelets
(r ¼ 0:9967), the relative rms error is about 8.15%.The computed values of cos θ indicate that the WAFsprovide a superior, near-ideal approximation in com-parison with classical wavelets.
C. Disparity Map Algorithm Implementation
The proposed algorithm (see Fig. 3) computes wave-lets Wi at four decomposition levels for each pair ofimages (left and right) or neighboring frames of vi-deos. Next, CORi is used to calculate the disparitymaps on each level in similar manner. In order to ob-tain the disparity map at the first stage (DMs3), theNNI between the disparity map for the fourth leveldecomposition (DM4) and disparity map for the third
6086 APPLIED OPTICS / Vol. 50, No. 32 / 10 November 2011
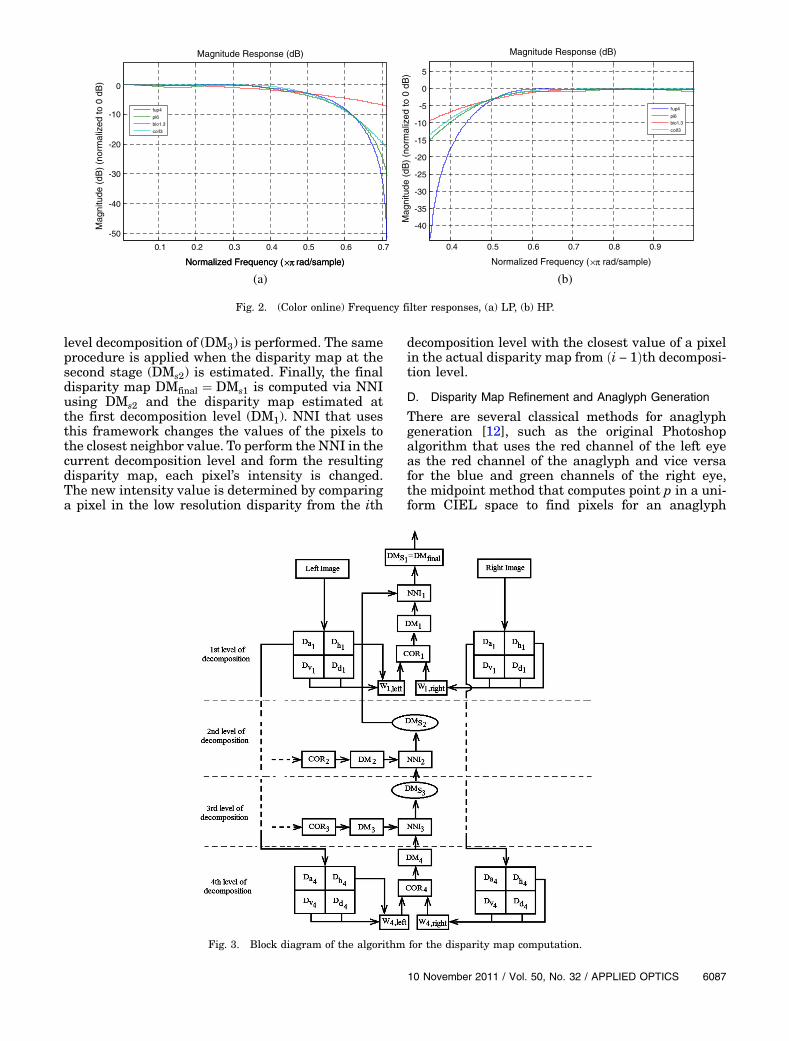
level decomposition of (DM3) is performed. The sameprocedure is applied when the disparity map at thesecond stage (DMs2) is estimated. Finally, the finaldisparity map DMfinal ¼ DMs1 is computed via NNIusing DMs2 and the disparity map estimated atthe first decomposition level (DM1). NNI that usesthis framework changes the values of the pixels tothe closest neighbor value. To perform the NNI in thecurrent decomposition level and form the resultingdisparity map, each pixel’s intensity is changed.The new intensity value is determined by comparinga pixel in the low resolution disparity from the ith
decomposition level with the closest value of a pixelin the actual disparity map from ði − 1Þth decomposi-tion level.
D. Disparity Map Refinement and Anaglyph Generation
There are several classical methods for anaglyphgeneration [12], such as the original Photoshopalgorithm that uses the red channel of the left eyeas the red channel of the anaglyph and vice versafor the blue and green channels of the right eye,the midpoint method that computes point p in a uni-form CIEL space to find pixels for an anaglyph
Fig. 3. Block diagram of the algorithm for the disparity map computation.
0.1 0.2 0.3 0.4 0.5 0.6 0.7
-50
-40
-30
-20
-10
0
Normalized Frequency (×π rad/sample)Normalized Frequency (×π rad/sample)
Mag
nitu
de (
dB)
(nor
mal
ized
to 0
dB
)
Magnitude Response (dB)
fup4
pi6
bio1.3
coif3
0.4 0.5 0.6 0.7 0.8 0.9
-40
-35
-30
-25
-20
-15
-10
-5
0
5
Normalized Frequency (×π rad/sample)
Mag
nitu
de (
dB)
(nor
mal
ized
to 0
dB
)
Magnitude Response (dB)
fup4
pi6bio1.3
coif3
(a) (b)
Fig. 2. (Color online) Frequency filter responses, (a) LP, (b) HP.
10 November 2011 / Vol. 50, No. 32 / APPLIED OPTICS 6087

generation, and the Dubois method, which employs aspecial matrix transformation to synthesize a newanaglyph. All of these methods used to generateanaglyphs can produce ghosting effects and colorlosses [13,14].
DM compression permits retaining the depth or-dering information, reducing ghosting effects inthe anaglyph’s nonoverlapping areas [15,16]. There-fore, the DM reduction of the disparity map valuescan be employed to enhance map quality and mini-mize drawback effects. Using the Pth law transfor-mation for DM compression [15], the originaldisparity map D is formed as follows:
Dnew ¼ a ·DP; ð12Þwhere Dnew is the new disparity map pixel value, 0 <a < 1 is a normalizing constant, and 0 < P < 1. Inthe present framework, the NNI is applied at theanaglyph generation stage.
3. Simulation Results
In the simulation experiments, different syntheticimages in .png format, such as Aloe, Venus,Lampshade, Wood1, Flowerpots, and Baby1(370 × 417 pixels), are used to obtain quantitativemeasurements. The synthetic images were takenfrom the Middlebury stereo datasets [17]. Of theabundant synthetic images from which to choose,those used in the simulation experiments were se-lected for their different features, such as color,shapes, and number of objects in the scene. In addi-tion, two CIE format color video sequences (250frames, 288 × 352 pixels) were selected from ArizonaState University’s YUV video sequences for testing:Coastguard for its video sequence of a particular boatmovement and Flowers for its video sequence of rightto left camera movement [18]. Last, real-life video se-quence Video Test (200 frames, 240 × 360 pixels) wasrecorded in order to apply the proposed framework toa real scenario with a moving truck.
A. Disparity Map Results
In the disparity map simulation results presentedhere, the CORi values were calculated in a slidingwindow with size 5 × 5 pixels. DM compression is ap-plied to all algorithms with parameters a ¼ P ¼ 0:5.The L&K algorithm is implemented following [1].The SSD algorithm is implemented according to[2], and the GEEMSF framework is designed follow-ing [3]. The wavelet technique is developed similar to[4], where we use different wavelet families, such asCoiflets, Daubechies, Biorthogonal and Symlets, andthe proposed M-WAF techniques based on the AFs(up, fup and π) at four levels of the decomposition.
Quantity of bad disparities (QBD) [4] and similar-ity structural index measure (SSIM) [19] are used asquantitative metrics justifying the selection of thebest disparity map algorithm in the 3D video se-quence visualization. To compute the selected me-trics, the ground truth for each stereo pair and thedisparity map estimated are employed. The groundtruth images were obtained from the Middleburywebsite [17]. For this implementation, all the groundtruth images were resized to 370 × 427 pixels.
The QBD values have been calculated for differentsynthetic images as follows:
QBD ¼ 1N
Xx;y
jdEðx; yÞ − dGðx; yÞj2; ð13Þ
whereN is the total number of pixels in an image or aframe, dE is the estimated disparity, and dG is theground truth disparity.
The standard qualitymetrics used in the past, suchas MSE, are being replaced by novel metrics, such asSSIM, because they better approximate human sub-jectivity [20]. When applying the SSIM algorithm torange images, three similarity components of SSIMare luminance, contrast, and structure. These simi-larity components find their counterparts in therange domain as depth, surface roughness, and 3D
Table 1. QBD and SSID Metrics Values for Different Synthetic Stereo Pairs
Image LyK SSD GEEMSF WF Bio6.8 WAF π6 M-WAF π6
AloeSSIM 0.3983 0.6166 0.3017 0.9267 0.9232 0.9232QBD 0.1121 0.4722 0.919 0.0297 0.013 0.0111VenusSSIM 0.199 0.432 0.2145 0.5979 0.4604 0.6947QBD 0.3084 0.1428 0.2013 0.1694 0.193 0.1091
Lampshade1SSIM 0.0861 0.632 0.3124 0.7061 0.6897 0.7619QBD 0.243 0.28 0.341 0.2072 0.2017 0.1426
Wood1SSIM 0.1089 0.7142 0.7051 0.9367 0.9448 0.9448QBD 0.1316 0.2376 0.21 0.1258 0.118 0.0919
Flower potsSSIM 0.1576 0.65 0.539 0.6411 0.6501 0.6501QBD 0.3813 0.243 0.2859 0.2401 0.2397 0.2397Baby1SSIM 0.1884 0.7511 0.7143 0.7385 0.7187 0.7506QBD 0.305 0.1416 0.281 0.157 0.1513 0.1401
6088 APPLIED OPTICS / Vol. 50, No. 32 / 10 November 2011

Fig. 4. Disparity maps obtained using M-WAF π6 for synthetic images (a) Aloe, (b) Venus, (c) Lampshade1, and (d) Wood1, respectively.
Fig. 5. (Color online) Synthesized anaglyphs using M-WAF π6 in (a) Aloe, (b) Venus, (c) Lampshade1, and (d) Wood1 images.
10 November 2011 / Vol. 50, No. 32 / APPLIED OPTICS 6089

structure. The SSIM index is highly sensitive to de-gradation in the spatial structure of image luminance.
The SSIM metric values are defined as follows:
SSIMðx; yÞ ¼ ½lðx; yÞ� · ½cðx; yÞ� · ½sðx; yÞ�; ð14Þwhere the parameters l, c, and s are calculated asfollows:
lðx; yÞ ¼ 2μXðx; yÞμYðx; yÞ þ C1
μ2Xðx; yÞ þ μ2Yðx; yÞ þ C1; ð15Þ
cðx; yÞ ¼ 2σXðx; yÞσYðx; yÞ þ C2
σ2Xðx; yÞ þ σ2Yðx; yÞ þ C2; ð16Þ
sðx; yÞ ¼ σXYðx; yÞ þ C3
σXðx; yÞ þ σYðx; yÞ þ C3; ð17Þ
where X is the estimated image, Y is the groundtruth image, μ and σ are the mean value and stan-dard deviation for X or Y images, and C1 ¼ C2 ¼C3 ¼ 1. Parameter lðx; yÞ represents the luminancesimilarity, cðx; yÞ characterizes the contrast similar-ity and, finally, sðx; yÞ is the structural similarityas justified in [19].
Table 1 shows the results for QBD and SSIM simi-larity metrics for different algorithms employed inthe disparity map reconstruction for several syn-thetic images. The global optimum values for QBDand SSIM are determinated by using the multilevelWAF (M-WAF) π6 technique, followed by the WAF π6technique. Figure 4 shows the visual perception re-sults for the disparity maps reconstructed from thesynthetic images.
In Table 1 and Fig. 4, one can see that, in general,M-WAFs present better depth perception results incomparison with different classic Wavelet familiesand other techniques. The analysis of Table 1 andFig. 4 confirms that the M-WAF π6 technique pro-duces the best qualitative and visual results in thedisparity map reconstruction.
B. Anaglyph Synthesis Results
Once the disparity map is reconstructed, the pro-posed techniques are tested in order to obtain ana-glyphs for synthetic images and video sequences.Here, the anaglyph synthesis is performed accordingto the standard procedure explained in [15]. As onecan see in Fig. 5, anaglyphs synthesized using theproposed technique perform sufficiently well atachieving 3D perception in all cases, and they alsominimize ghosting and loss of color.
Inaddition,weapplied theproposedmethod (Fig. 1)to perform the 3D visualization employing a 2D videosequence.The left and right imagesof a stereopair areformed from the neighboring frames. We experimen-ted with different color video sequences downloadedfrom a website [17] and the color videos recorded ofa common scenario. Several generated anaglyphsare presented in Fig. 6. For the video sequences, wehave no information about ground truth for DM.Therefore, we only use subjective visual perceptionto estimate thequality of 3Ddepthandspatial percep-tion of a frame for a given sequence.
Figures 5 and 6 contain synthetic images andframes of video sequences with 3D perception. Theeffect can be observed using spectacles with blueand red filters.
4. Conclusions
This study analyzed the performance of different 3Dreconstruction methods. In general, the best objec-tive and subjective results are observed when WAFsare used in the disparity map reconstruction forvideo sequences with different types of move-ments against other analyzed techniques. Numeroussimulations for different color video sequencesconfirm the quality of the depth and spatial percep-tion of the synthesized 3D video sequences. The
Fig. 6. (Color online) Synthesized anaglyphs using: M-WAF π6 in(a) Coastguard, (b) Flowers, and (c) Video Test, respectively.
6090 APPLIED OPTICS / Vol. 50, No. 32 / 10 November 2011

developed framework can be applied to any color vi-deo sequence without any additional information,creating 3D perceptions with greater depth and spa-tial perception qualities than previous techniques.
The authors thank the National Polytechnic Insti-tute of Mexico and the Consejo Nacional de Ciencia yTecnología (project 81599) for their support of thiswork.
References1. J. L. Barron, D. J. Fleet, S. Beauchemin, and T. Burkitt, “Per-
formance of optical flow techniques,” in Conference on Compu-ter Vision and Pattern Recognition (IEEE, 1992), pp. 236–242.
2. D. Fleet and A. Jepson, Measurement of Image Velocity(Kluwer, 1992).
3. B. B. Alagoz, “Obtaining depth maps from color images byregion based stereo matching algorithms,” OncuBilimAlgorithm and Systems Labs 8, 1–12 (2008).
4. A. Bhatti and S. Nahavandi, 2008 Stereo Vision (I-Tech,2008).
5. E. Dubois, X. Huang, “3D reconstruction based on a hybriddisparity estimation algorithm,” in International Conferenceon Image Processing (IEEE, 2006), pp. 1025–1028.
6. Y. Meyer, Ondelettes (Hermann, 1991).7. C. Juarez, V. Ponomaryov, J. Sanchez, and V. Kravchenko,
“Wavelets based on atomic function used in detection andclassification of masses in mammography,” in Lecture Notesin Artificial Intelligence (Springer, 2008), Vol. LNAI 5317,pp. 295–304.
8. V. Ponomaryov and E. Ramos, “3D video sequence reconstruc-tion algorithms implemented on a DSP,” Proc. SPIE 7871,78711D (2011).
9. V. Kravchenko, H. Meana, V. Ponomaryov, 2009 AdaptiveDigital Processing of Multidimensional Signals with Applica-tions (FizMatLit, 2009). Available at http://www.posgrados.esimecu.ipn.mx/.
10. Y. Gulayev, V. Kravchenko, and V. Pustoviot, “A new class ofWA-systems of Kravchenko-Rvachev functions,” Dokl., Math.75, 325–332 (2007).
11. M. Unser and A. Aldroubi, “A general sampling theorem fornonideal acquisition devices,” IEEE Trans. Signal Process.42, 2915–2925 (1994).
12. W. Sanders and D. McAllister, “Producing anaglyphsfrom synthetic images,” Proc. SPIE 5006, 348–358 (2003).
13. I. Ideses and L. Yaroslavsky, “Three methods that improvethe visual quality of color anaglyphs,” J. Opt. A 7, 755–762(2005).
14. P. Yaroslavsky, J. Campos, M. Espínola, and I. Ideses, “Redun-dancy of stereoscopic images: experimental evaluation,” Opt.Express 13, 10895–10907 (2005).
15. I. Idesses, L. Yaroslavsky, and B. Fishbain, “3D fromcompressed 2D video,” Proc. SPIE 6490, 64901C (2007).
16. I. Idesses and L. Yaroslavsky, “A method for generating 3D vi-deo from a single video stream,” in VMV (Aka GmbH, 2002),pp. 435–438.
17. Middlebury College, “Middlebury stereo datasets,” http://vision.middlebury.edu/stereo/data.
18. Arizona State University, “YUV video sequences,” http://trace.eas.asu.edu/yuv/index.html.
19. W. S. Malpica and A. C. Bovik, “Range image quality assess-ment by structural similarity,” in IEEE International Confer-ence on Acoustics, Speech and Signal Processing (IEEE, 2009),pp. 1149–1152.
20. Z. Wang and A. C. Bovik, “Mean squared error: love it or leaveit? A new look at signal fidelity measures,” IEEE SignalProcess. Mag. 26, 98–117 (2009).
10 November 2011 / Vol. 50, No. 32 / APPLIED OPTICS 6091


![Autumn 2005 Instrumentation ViewPoint. - CORE · Autumn 2005 Instrumentation ViewPoint. 31 ... A. Multilevel decomposition. Fast wavelet ... And Machine Intell. 1989 [6]](https://img.dokumen.tips/doc/110x75/5b34599d7f8b9a330e8bfd1f/autumn-2005-instrumentation-viewpoint-core-autumn-2005-instrumentation-viewpoint.jpg)