Embed Size (px)
Citation preview
3D segmentation of forest structure using an adaptive mean shift based procedure
ANTÓNIO FERRAZ †‡§, FRÉDÉRIC BRETAR †¶, STÉPHANE JACQUEMOUD ‡, GIL GONÇALVES §, LUISA PEREIRA |
† Institut Géographique National, Laboratoire MATIS, Saint Mandé, France
‡ Institut de Physique du Globe de Paris, Géophysique spatiale et planétaire, Paris, France
§ Instituto de Engenharia de Sistemas e Computadores de Coimbra, Portugal
¶ Laboratoire des Ponts et Chaussées, Rouen, France
| Escola Superior de Tecnologia e Gestao de Agueda, Universidade de Aveiro, Portugal
Abstract
Plant communities display a vertical structure based on the size and growth pattern of the dominant
species. To a large extent, this pattern, called vertical stratification, depends on the climatic zone.
Vertical structure analysis consists in detecting the number of layers and their limits within a forest
stand. So far, there is a lack of robust approaches applied to airborne laser scanning (ALS) data that
properly segment the different strata of forests having complex structures. In this study, we propose
a procedure to characterize vertical forest stratification based on the mean shift (MS) algorithm. The
MS is a non-linear filter that searches for local density maxima (modes). It is a non-parametric and
unsupervised approach, which only requires a single criterion, the kernel bandwidth. Since the
forest point cloud is a multi-modal distribution, the MS is used to find the modes which are
supposed to be the barycenters of vegetation features. Once achieved, the modes are grouped
together according to height range and the corresponding ALS points are assigned to each
vegetation strata. Due to their complex pattern, using a single scale over the whole space is not
recommended for the analysis of such environments. On this basis, the modes are computed using a
variable kernel bandwidth according to the forest pattern. To depict such a pattern, we propose a
new technique that segments the main forest layers at the plot level: overstory, understory, and
surface vegetation. The procedure has been carried out on 45 plots of a Portuguese forest mainly
composed of eucalyptus (Eucalyptus globulus) and pine (Pinus pinaster) trees that can be strongly
populated by understory and surface vegetation.
Email: [email protected]
1. Introduction
Forest and woodland display simple single-storied structures or more complex multi-storied
structures. Dominant and codominant trees form the overstory layer. Subdominant trees still have
access to light but do not occupy the upper canopy. The understory layer generally grows in the
shadow underneath the uppermost layer. It is made of suppressed trees, juvenile trees, and tall
shrubs. The surface layer is immediately above the ground. Small shrubs and herbaceous plants
characterize it. All these layers may have different density, thickness, and water content. Vertical
stratification consists in detecting the presence or not of the different layers within a forest stand
and in estimating their limits. It is known to play a crucial role in the distribution of fuels, and
consequently, in fire behaviour, habitat quality, microclimatic conditions, carbon storage, etc.
Many authors showed the potential of multi-echo airborne laser scanning (ALS) data to compute
digital terrain models (DTM) over vegetated areas, or to extract forest variables (Hyyppa et al.,
2008). However, most studies focus on the canopy layer, which does not fully characterize
heterogeneous forests such as Mediterranean ecosystems. Only a few are interested in the vertical
segmentation of forest structures. Zimble et al. (2003) and Maltamo et al. (2005) characterize forest
plots as single-storied or multi-storied by analysing the height distribution of vegetation hits. Riano
et al. (2003) approach vertical forest stratification by applying clustering techniques directly to the
3D raw ALS data. As pointed out by these authors, the cluster algorithm works well when there are
only two structures, but it fails in the presence of more complex structures. Morsdorf et al. (2010)
discriminate vegetation strata over treated plots applying a supervised cluster analysis on a two-
dimensional feature space. The latter is spanned by the height and the intensity of the ALS points.
This study takes advantage of the fact that the vegetation layers are unispecies. Some authors used
intensity values to discriminate trees (Holmgren and Persson, 2004; Kim et al., 2009). They assume
that the ALS points corresponding to trees of the same species and age class have similar values.
However, the layers seldom display such a property. Moreover, due to calibration problems
(unknown instrument specifications) and uncertain interpretation of the digital numbers obtained by
the instruments (fuzziness caused by the vegetation itself), using echoes intensity for ALS
vegetation studies remains a challenge.
Among the ALS studies that focus on canopy layers, emphasis is often placed on tree height
and/or crown width. Very few studies try to assess the vertical component of the topmost layer
(Holmgren and Persson, 2004; Barilotti et al., 2008; Popescu and Zhao, 2008). They usually deal
with the crown base height by analysing the vertical profile of the laser hits within a single crown
with different techniques. Usually, individual crowns are delineated from the canopy height model
(CHM) by image segmentation. The main disadvantage of such a method is that the dominated and
smaller trees are invisible in the CHM. Thus, mapping the overstory vertical component at larger

scales is highly dependent on plot homogeneity. Other authors try to figure out the nature of the bi-
storied or multi-storied overstory by means of tree-based approaches. Reitberger et al. (2009) apply
a sophisticated method based on normalized cut segmentation to depict dominated trees. Despite
good performance, it is highly site-dependent since several empirical parameters are involved.
In this work, we propose a new mean shift (MS) based procedure to segment forest. Since its
reformulation by Comaniciu and Meer (2002), the MS algorithm has been mainly applied to image
segmentation. The processing of unstructured ALS point clouds using it was first proposed by
Melzer (2008) to extract power lines. It is a non-linear filter that searchs for local density maxima
(modes) and, unlike other methodologies, that requires no prior geometrical or statistical
knowledge. Since the point cloud is a multi-modal distribution, the MS is used to find the ALS
modes that are supposed to be the vegetation features barycenters. A global mode corresponds to a
forest layer, such as the overstory, while a local mode points out a tree crown or a shrub. The only
parameter used by the MS technique precisely relies on this concept of scale. The area inside which
the modes (the kernel bandwidth) are calculated is of crucial importance. In the following, we first
study the impact of the kernel bandwidth on the data set, and then propose a procedure that permits
forest stratification that takes into account scaling effects.
2. Material and methods
2.1 Study area
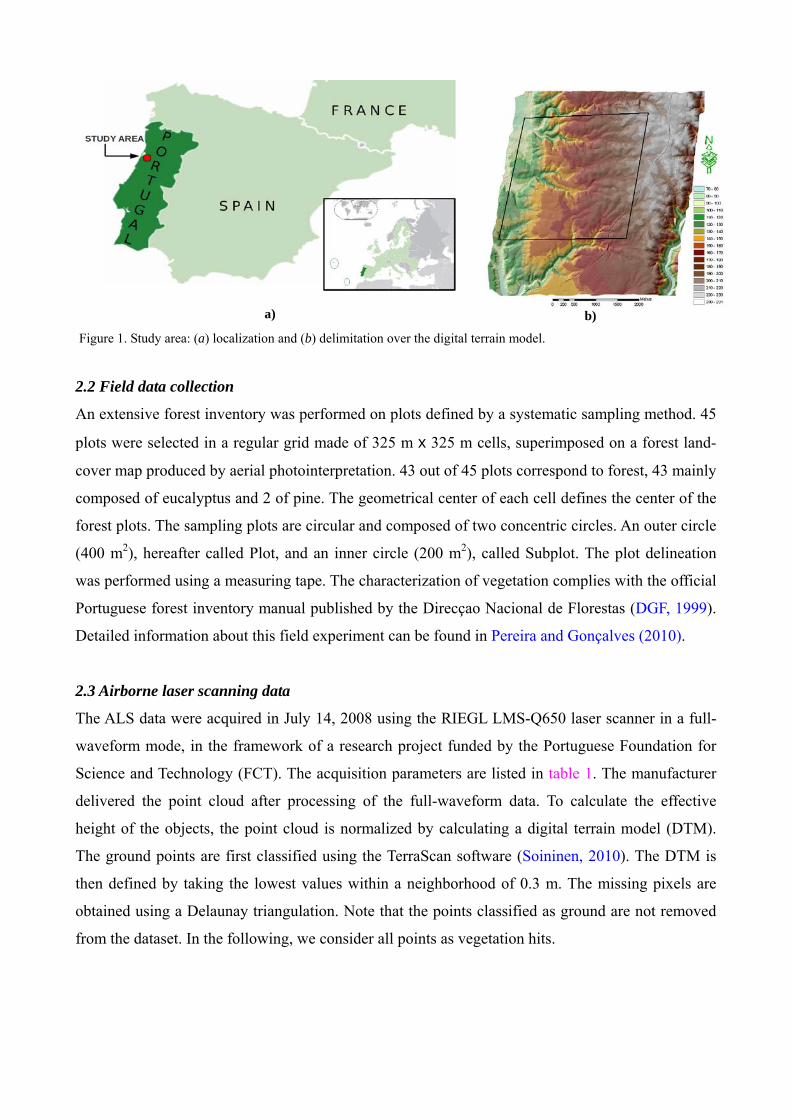
The study area is located in north-west Portugal (40°36' N, 8°25' W), nearby the city of Águeda
(figure 1(a)). The selected area covers 900 ha at an altitude ranging from 70 m to 220 m, with
gentle to steep slopes (figure 1(b)). The landscape is predominantly composed of woodlands
dominated by eucalyptus (Eucalyptus globulus) with some stands of pine (Pinus pinaster). One also
finds shrublands as well as agricultural fields, and a few built-up areas. The eucalyptus stands
correspond to regular and irregular plantations, the management of which is mainly done by short
rotations of about 10-12 years to feed the pulp and paper industry. In spite of a limited extension,
the study area is composed of various eucalyptus stands in terms of age and growth (plantation,
coppice or mixed). The forest stands can be also populated by understory and surface vegetation. In
such cases, these strata are mainly composed of juvenile trees (eucalyptus, pine, acacia, and oak),
gorse (Ulex europaeus), tree heath (Erica arborea), carqueja (Pterospartum tridentatum L. Willk),
fern, and herbaceous plants.
a) b)
Figure 1. Study area: (a) localization and (b) delimitation over the digital terrain model.
2.2 Field data collection
An extensive forest inventory was performed on plots defined by a systematic sampling method. 45
plots were selected in a regular grid made of 325 m x 325 m cells, superimposed on a forest land-
cover map produced by aerial photointerpretation. 43 out of 45 plots correspond to forest, 43 mainly
composed of eucalyptus and 2 of pine. The geometrical center of each cell defines the center of the
forest plots. The sampling plots are circular and composed of two concentric circles. An outer circle
(400 m2), hereafter called Plot, and an inner circle (200 m2), called Subplot. The plot delineation
was performed using a measuring tape. The characterization of vegetation complies with the official
Portuguese forest inventory manual published by the Direcçao Nacional de Florestas (DGF, 1999).
Detailed information about this field experiment can be found in Pereira and Gonçalves (2010).
2.3 Airborne laser scanning data
The ALS data were acquired in July 14, 2008 using the RIEGL LMS-Q650 laser scanner in a full-
waveform mode, in the framework of a research project funded by the Portuguese Foundation for
Science and Technology (FCT). The acquisition parameters are listed in table 1. The manufacturer
delivered the point cloud after processing of the full-waveform data. To calculate the effective
height of the objects, the point cloud is normalized by calculating a digital terrain model (DTM).
The ground points are first classified using the TerraScan software (Soininen, 2010). The DTM is
then defined by taking the lowest values within a neighborhood of 0.3 m. The missing pixels are
obtained using a Delaunay triangulation. Note that the points classified as ground are not removed
from the dataset. In the following, we consider all points as vegetation hits.

Table 1. ALS acquisition parameters.
ALS sensor RIEGL LMS-Q5600
Wavelength 1064 nm
Scan angle 45°
Pulse rate 150 kHz
Effective measurement rate 75 kHz
Beam divergence 0.5 mrad
Ground speed 46.26 m/s
Flying height above the terrain 640 m
Swath 479 m
Sidelap 70%
Single run density 3.3 pt/m2
Expected final density 9.9 pt/m2
Distance between lines 150m
Spot diameter 30cm
2.4 Adaptive mean shift
The mean shift (MS) is a non-linear filter based on the Parzen window kernel that looks for local
density maxima (modes) in a set of data samples (Comaniciu and Meer, 2002). The solution of the
algorithm iteratively converges towards the local maximum:
( )1t+ t th,G+m←X X X
(1)
where t denotes the number of iterations, h the kernel bandwidth, and , ( )h Gm X is the so-called
mean shift vector defined by:
( )
2
1
2
1
.n
ii
i=
ni
i=
h,G
gh
=
gh
m
−
−−
⎛ ⎞⎜ ⎟⎝ ⎠⎛ ⎞⎜ ⎟⎝ ⎠
∑
∑
X XX
X XX X
(2)
1,...,i n=X are the n ALS data points in a three-dimensional space and ( )g X is the derivative of the
Epanechnikov kernel ( )k X :
( ) ( )21
0
k,dck
−=⎧⎪⎨⎪⎩
XX
if inside the unit sphere if outside
(3)
Comaniciu and Meer (2002) proved that the MS algorithm converges on a stationary point. It can
easily be extended to a distance-based segmentation technique, grouping together all the modes that

are closer than a certain distance r∈ . The MS segments are then retrieved by aggregation of the
basins of attraction of the corresponding convergence points. In the following, we set 2r h= for all
experiments. The choice of the kernel bandwidth h is critical because it strongly impacts on the
results. A small kernel width leads to several distinct modes (small basins of attraction, more and
smaller objects), while a large kernel width aggregates small structures into larger ones (small
number of modes with large basins of attraction). The determination of an optimal value of h is
actually a major challenge for an efficient MS segmentation. As far as the vertical component is
concerned, the forest layer depth increases with height. Typically, scrubby vegetation strata are
thinner than mature tree layers. The optimal value of h that allows a proper segmentation of the
shrubs may fragment a tall tree into several segments (lower branches, top foliage, etc.). Figure 2(a)
results from a segmentation with 1 mh = . While the surface vegetation has a coherent shape, the
higher features are oversegmented. Increasing h improves the overstory segmentation, but it may
cause merging between close small vegetation features. For instance, if 4 mh = (figure 2(b)) the
denser surface vegetation will attract the sparse understory, causing an undersegmentation of the
scene. Thus, using a single scale over the entire space is not recommended for the analysis of forest
environments. As far as the MS technique is concerned, several statistical approaches deal with the
scale selection (Comaniciu, 2003, Huang and Zhang, 2008; Bo et al., 2009). Regarding the task
dependent applications the kernel bandwidth can be provided by the user (Comaniciu and Meer,
2002). Here it is calculated as a function of the height range: overstory, understory, and surface
vegetation.
a)
b)
Figure 2. Mean shift segments over Subplot 30 using (a) 2 1 mr h= = and (b) 2 4 mr h= = .
A height frequency histogram usually shows that forest plots are characterized by two dense zones:
the overstory and the ground. A third zone may arise when dense understory is present. In this
respect, we apply the MS segmentation technique to compute the basins of attraction of the two

denser zones by calculating the two main modes of the ALS point cloud. Since we study the vertical
profile at the plot level, the influence of the horizontal coordinates is removed in the computation.
Thus, for planimetric distances, the kernel bandwidth is set to the plot diameter. The vertical
extension of the kernel is defined as the value that forces the ALS points to converge towards two
modes only. To calculate such a bandwidth, we set the initial kernel bandwidth to 1 m and
increment it by 1 m at each iteration until the MS algorithm accomplishes only two modes. The
borderline between the basins of attraction defines the overstory height threshold.
We consider that forest plots in which the 95% height percentile is lower than 5 m are composed
of a maximum of two layers. However, in plots with taller trees, a third layer may coexist. In such a
case, the understory height threshold is set to 1 m. This assumption and its consequences are
discussed below. Some results are presented in figure 3 using height frequency histograms.
a)
b)
c)
d)
e)
f)
g)
Figure 3. Forest stratification of seven plots. The results are illustrated by a height frequency histogram. (a) Subplot 30; (b) Plot 2; (c) Plot 23; (d) Plot 12; (e) Plot 46; (f) Plot 17; (g) Plot 3. The different colors define the strata delimitations. The histograms are limited to 400 points; for bins over that value, the real frequency value is given.

The initial solution of the segmentation at the plot level is then refined at a thinner scale to get a
better discrimination of forest strata. The MS is reapplied with a modulation of the kernel
bandwidth. Because vegetation features, e.g. the eucalyptus crowns, are not spherical we adopt two
different metrics for planimetric and height distances. The horizontal component is kept constant to
1 m while the vertical component of the bandwidth is empirically set to 0.66 times the overstory
amplitude (difference between the highest and the lowest bin of the topmost distribution) and to 0.5
times the understory amplitude. As for the surface vegetation, the bandwidth is set to 1 m in all
directions.
2.5 Adaptive mean shift procedure
The procedure to detect strata works iteratively from the bottom to the top of the forest structure, by
adapting the kernel bandwidth within the defined height ranges (figure 3). First, the 5% height
percentile, 1lw = , of the data points ( , , )i i i ix y z=X is calculated. The adaptive kernel bandwidth, h ,
is set to a value ranging within the heights defined in section 2.4. Therefore, the modes
( , , )i i i ix y z=X for each ALS point, iX , are computed using the corresponding value of h . All
modes that are closer than r are grouped together creating MS segments, p∈C . The forest layer,
1l=F (figure 4(b)), is a set of iX for which the corresponding MS segments are closer than 1ls = from
1lw = . The ALS assigned points are not taken into account to further calculations. This step improves
the segmentation by removing the influence of the lower layers, which are usually denser
PROCEDURE
REPEAT
1: i i l 0.05z , w = P∀ ∈ X
*2: lim ti i it,
→∞∀ =X X X → equation (1)
{ }2 23: 1,...i p i i up
, = | u = n r∈
∀ ∀ − ≤X X X XC
{ }2 24: l i i p i l ll
p, = | z w s∈
∀ ∃ ∈ − ≤X XF C
{ }5: i i i i l, =∀ ∉X X X X F → removal of the assigned points
*6: i = ∅X → reinitialize modes
UNTIL 0n =
than the higher. When two regions with different densities are adjacent, the points of the sparser
region are likely to be shifted towards the denser one (figure 2(b)). In the second iteration the 5%
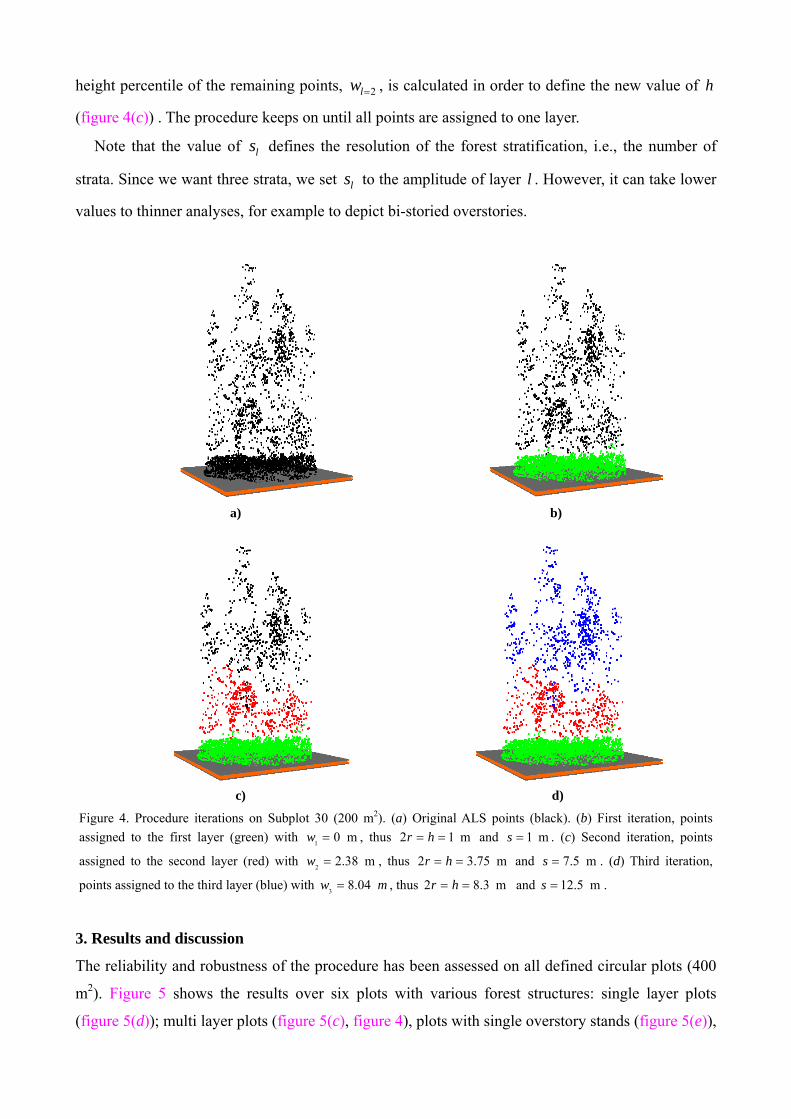
height percentile of the remaining points, 2lw = , is calculated in order to define the new value of h
(figure 4(c)) . The procedure keeps on until all points are assigned to one layer.
Note that the value of ls defines the resolution of the forest stratification, i.e., the number of
strata. Since we want three strata, we set ls to the amplitude of layer l . However, it can take lower
values to thinner analyses, for example to depict bi-storied overstories.
a)
b)
c)
d) Figure 4. Procedure iterations on Subplot 30 (200 m2). (a) Original ALS points (black). (b) First iteration, points assigned to the first layer (green) with 1 0 mw = , thus 2 1 mr h= = and 1 ms = . (c) Second iteration, points
assigned to the second layer (red) with 2 2.38 mw = , thus 2 3.75 mr h= = and 7.5 ms = . (d) Third iteration,
points assigned to the third layer (blue) with 3 8.04w m= , thus 2 8.3 mr h= = and 12.5 ms = .
3. Results and discussion
The reliability and robustness of the procedure has been assessed on all defined circular plots (400
m2). Figure 5 shows the results over six plots with various forest structures: single layer plots
(figure 5(d)); multi layer plots (figure 5(c), figure 4), plots with single overstory stands (figure 5(e)),

plots composed of different stands (figure 5(f)), juvenile plots (figure 5(a)) and adult stands (figure
5(d)). Plot 2, Subplot 30 and Plot 12 (respectively, figure 5(a) and figure 4 and figure 5(c)) are
characterized by a denser surface vegetation (mean height of about 1.3 m, 1.5 m and 1 m,
respectively) while Plot 23 (figure 5(b)) is populated by moderate surface vegetation (mean height
of about 0.40 m) with some species 1 m tall.
a)
b)
c)
d)
e)
f)
Figure 5. Results of the MS-based procedure over five eucalyptus plots and one pine plot. The surveyed tree metrics are also displayed. (a) Plot 2; (b) Plot 23; (c) Plot 12; (d) Plot 46; (e) Plot 17; (f) Plot 3. The plots have, respectively, mean age of 3, 6, 13, 60, 10 and 3 years.

Figures 4 and 5 show that the original points progressively converge by means of the MS algorithm,
producing coherent segments at least along the vertical component. It can be visually assessed that
are well assigned to layers. Only two strata are retrieved both in figures 5(a) and 5(d). In Section
2.4, only two segments were defined for juvenile plots (figure 3(a)) while three segments were
expected for adult stands. However, figure 5(d) shows that only two strata have mushroomed from
the procedure. Due to the lack of understory (this plot only has trunk reflections beneath the
overstory), the 5% height percentile at the second iteration equals 9.25 m. Figure 3(e) shows that
the kernel bandwidth at the second iteration is directly set to one of the overstory stratum. All ALS
hits lying on the tree stem were then assigned to the overstory. Thus, by applying our approach, the
number of layers retrieved is inherent to the forest pattern. Moreover, it provides a fuzzy
stratification of the forest where different layers can interpenetrate. It is a more realistic result than a
simple stratification only based on height thresholds (figures 4 and 5). Although the surface
vegetation height threshold was initially set to 1 m, the procedure is able to figure out the shape of
this layer. In figures 4 and 5(a), points up to 2 m height are classified as surface vegetation. A
similar analysis can be done for the upper strata. Moreover, the global framework can provide multi
layer segmentation. For instance, by setting ls to half the forest layer amplitude, the forest plot can
be stratified with a thinner resolution (single-storied and bi-storied). The post-processing of each
layer derived from a coarser analysis is certainly a field to investigate.
4. Conclusion
In this paper, we explore the MS potential to segment vegetation features. Additionally, a
unsupervised and non parametric approach is proposed to extract forest layers. It is carried out in
three dimensions providing genuine 3D segments. Thus, the procedure is able to compute large
areas at the thinner resolution. The only parameter that needs to be defined (the kernel bandwidth)
is here adapted as a function of the forest pattern. To analyse such pattern, we introduce a technique
that stratifies forest at the plot level by computing the basins of attraction of the two denser zones.
Since the MS applies to a joint space (spatial and attributes), additional attributes of the ALS points
(intensity, number of echoes, etc.) may be introduced in the calculation of the MS vector.
Additionally, the analysis of different kernel functions and metrics may help to better fit the tree
crowns aiming at a thinner forest stratification but also at a better fit the tree crowns in single tree
extraction. In the near future, we pretend to validate our procedure using forest inventory data
acquired in the frame of the FCT project.

References
Barilotti, A., Sepic, F. and Abramo, E., 2008, Automatic detection of dominated vegetation under canopy using Airborne Laser Scanning data. In Proceedings of the International Conference Silvilaser 2008, 17-19 September 2008, Edinburgh, UK, pp. 134-143. Bo, S., Ding, L., Li, H., Di, F. and Zhu, C., 2009, Mean Shift-based clustering analysis of multispectral remote sensing imagery. International Jounal of Remote Sensing, 30, pp. 817-827. Comaniciu, D. and Meer P., 2002, Mean shift: A robust approach toward feature space analysis. IEEE Transactions on Pattern Analysis and Machine Intelligence, 24, pp. 603-619. Comaniciu, D., 2003, An Algorithm for Data-Driven Bandwidth Selection. IEEE Transactions on Pattern Analysis and Machine Intelligence, 25, pp. 281-288. DGF, 1999, Manual de instruções para o trabalho de campo do inventario florestal nacional. Direcção Geral das Florestas, Lisboa. Holmgren, J., and Persson, A., 2004, Identifying species of individual trees using airborne laser scanner. Remote Sensing of Environment, 90, pp. 415-423. Huang, X. and Zhang, L., 2008, An adaptive mean-shift analyses approach for object extraction and classification from urban hyperspectral imagery. IEEE transactions on Geoscience and Remote Sensing, 46, pp. 4173-4185. Hyyppa, J., Hyyppa, H., Leckie, D., Gougeon, F., Yu X. and Maltamo, M., 2008, Review of methods of small-footprint airborne laser scanning for extracting forest inventory data in boreal forests. International Journal of Remote Sensing, 29, pp. 1339-1366. Kim, S., McGaughey R. J., Andersen, H.-E., Schreuder. G., 2009, Tree species differentiation using intensity data derived from leaf-on and leaf-off airborne laser scanner data. Remote Sensising of Environment, 113, pp.1575-1586. Maltamo, M., Packalén, P., Yu, X., Eerikainen, K., Hyyppa J. and Pitkanen, J., 2005, Identifying and quantifying structural characteristics of heterogeneous boreal forest using laser scanner data. Forest Ecology and Management, 216, pp. 41-50. Melzer, T., 2008, Non-parametric segmentation of als point clouds using mean shift. Journal of Applied Geodesy, 13, pp. 159-170.
Morsdorf, F., Mårell, A., Koetz, B., Cassagne, N., Pimont, F., Rigolot, E., Allgöwer, B., 2010, Discrimination of vegetation strata in a multi-layered Mediterranean forest ecosystem using height and intensity information derived from airborne laser scanning. Remote Sensing of Environment, 114, pp. 1403-1415. Pereira, L. and Gonçalves G., 2010, Accuracy of a DTM derived from full-waveform laser scanning data under unstructured eucalypt forest: A case study. In Proceedings of The XXIV FIG International Congress, 11-16 April 2010, Sidney, Australia, pp. . Popescu, S. and Zhao, K., 2008, A voxel-based lidar method for estimating crown base height for deciduous and pine trees. Remote Sensing of Environment, 112, pp. 767-781. Reitberger, J., Schnorr Cl., Krzystek, P. and Stilla U., 2009, 3D Segmentation of single trees exploiting full waveform LIDAR data. ISPRS Journal of Photogrammetry and Remote Sensing, 64, pp. 561- 574. Riano, D., Meier, E., Allgower B., Chuvieco E. and Ustin, S., 2003, Modeling airborne laser scanning data for the spatial generation of critical forest parameters in fire behaviour modeling. Remote Sensing of Environment, 86, pp. 177-186. Soininen, A., 2010, TerraScan User's guide. Available online at: http://www.terrasolid.fi/en/users_guide/terrascan_users_guide (Accessed 24/07/2010).

Zimble, D., Evans, D., Carlson, G., Parker, R., Grado, S. and Gerard, P., 2003, Characterizing vertical forest structures using small-footprint airborne LiDAR. Remote Sensing of Environement, 87, pp. 171-182.