Embed Size (px)
Citation preview

International Journal of Computer Engineering and Applications, Volume XI, Issue XII, Dec. 17, www.ijcea.com ISSN 2321-3469
Swati R. Maurya and Ganesh M. Magar 243
3D RECONSTRUCTION OF HILLS OF SANJAY GANDHI
NATIONAL PARK REGION FROM DIGITAL RASTER
ELEVATION DATA
Swati R Maurya1, Ganesh M Magar2 1Department of Computer Science, S. K. Somaiya College of ASC, Vidyavihar(E), Mumbai, Maharashtra,
India, 400077 2P.G. Department of Computer Science, S. N. D. T Women’s University, Santacruz (E), Mumbai,
Maharashtra, India, 400049
ABSTRACT:
Reconstruction and modeling of large geospatial features such as terrain and mountains are vital in study and planning of ecological infrastructure. This includes wild animal habitat, urban and civic planning. Identifying zone of influence of natural infrastructures such as forest, hills, and mountains has the valuable contribution. Wildlife safety and tracking activities can be better monitored and executed if visualization and simulation of the affected region are available. This paper presents a geostatistical approach for reconstructing and visualization of hills of the region around Sanjay Gandhi National Park, Borivali, India from raster data and identifies the zone of immediate influence of wildlife to adjacent urban regions. Reconstruction of 3D geospatial hills and mountains has been achieved from raster image data of 30m resolution obtained from satellite imagery. Contour list of the lower reach of wildlife over these mountains is identified, extracted, georeferenced and finally integrated together with the constructed 3D hills. Additionally, hydrological sources in the nearby area are also identified and saved for virtual modeling and visualization purpose. It is shown that bilinear and cubic convolution based interpolation is more suitable than nearest neighbor estimates for raster data of test region. The results are physically verified with known ground truth values and also validated with google maps in a georeferenced environment. The accuracy of around 97.13% has been obtained for the reconstructed hill region.
Keywords: 3D Reconstruction, Visualization, Geostatistical Modelling, Digital Elevation Model
[1] INTRODUCTION
Modeling and visualization of large natural features on the earth have interesting
applications and can be achieved in many ways. These natural features include mountains and

3D RECONSTRUCTION OF HILLS OF SANJAY GANDHI NATIONAL PARK REGION FROM
DIGITAL RASTER ELEVATION DATA
Swati R. Maurya and Ganesh M. Magar 244
hills, terrain blocks, forest and hydrological regions. Terrain analysis and landform recognition
[1] has emerged as an important area of reconstruction and visualization. Many of the wildlife
conservation projects have been concentrated on forest hills and mountains. This requires
developing knowledge about its geographical distribution to enable better planning purposes.
This knowledge can be more useful if these geographical features can be visualized in the 3D
interactive environment. This motivates the development and research for reconstructing 3D
structures in the georeferenced environment. Among several types of data set used in
reconstruction activities, popular ones include point clouds from LiDAR [2], [3] systems,
photogrammetry [4] and raster data obtained from satellites. Raster data includes digital
elevation models (DEMs) [5], ASCII grids and orthoimages describing geographical
information that includes surface elevations.
Airborne LiDAR and photogrammetry based data competes each other for specific
application but they have different approach. While point clouds have provided the opportunity
for 3D reconstruction with a good level of details, it suffers for performance reasons due to the
high level of complexity in processing large count of point data in them. Similarly, the second
approach is the use of photogrammetry which requires multiple samples of images of the same
object/feature and needs establishing correspondences before generating point clouds for
mapping and texturing. The third approach is extracting 3D information contained in raster data
such as satellite images. While the textural details of reconstructed features obtained from raster
images are as good as those obtained from photogrammetry but it offers a simpler and efficient
way for reconstruction of large features. This motivates to develop a framework for
reconstructing 3D forest hills and mountains including foot-hills of the national park as the
habitat of preserved wildlife. Approximating the zone of wild life reach for safety reasons is
also realized and method for the same has to be developed.
[2] RELATED WORK
Reconstruction of natural and man-made objects have gained much attention due to its
wide scope in emerging applications across domains. Reconstruction of heritage structures[6],
forest areas [7] and terrain models are some prime areas of reconstruction and visualization
research activities. Reconstruction and visualization of heritage structures
and archaeological features can be easily achieved using LiDAR mapping [8], [9] and
photogrammetry [10]. However, large landscapes including those involving forests and
mountains are challenging due to large coverage area and requirement of survey and data
gathering efforts. Airborne LiDAR is a good way to gather data about it. However it is not
always cost effective due to acquisition setup and data processing efforts at later stages. Raster-
based methods of reconstruction of the large natural geographical feature are the preferable
method. Reconstruction of natural features such as terrain and mountain range has increasing
interest of researchers
The study of 3D Terrain Visualization techniques [11], [12] suggests the usefulness of
remote sensing and raster data such as DEMs in landscape modeling and terrain reconstruction
[13]. Reconstruction attempts of mountain Taishan [14] and Polish Tatra Mountains [15] also
exhibit the use of DEM (SRTM) and digitalized vector data for three-dimensional
reconstruction. Software tools and libraries [16] with custom spatial processing pipeline can
help in generating interesting results. Investigation reveals that reconstruction of mountain
ranges with reference to wildlife habitat has limited attempts and need more focused work. This
International Journal of Computer Engineering and Applications, Volume XI, Issue XII, Dec. 17, www.ijcea.com ISSN 2321-3469
Swati R. Maurya and Ganesh M. Magar 245
paper attempts to develop a framework to reconstruct and model mountains of Sanjay Gandhi
National Park region using raster images. It also assesses the physical proximities of wildlife
influence at the foothills and nearby forest region based on distance criterion and dwelling
possibilities.
[3] EXPERIMENTAL DATA
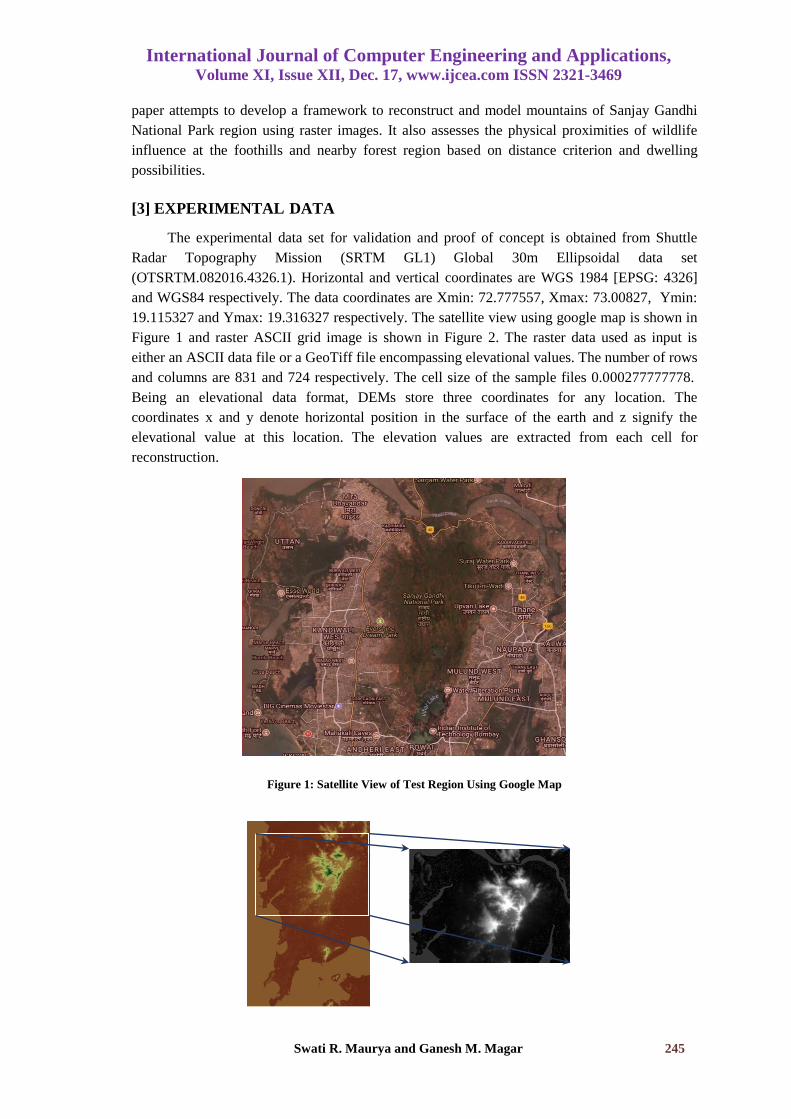
The experimental data set for validation and proof of concept is obtained from Shuttle
Radar Topography Mission (SRTM GL1) Global 30m Ellipsoidal data set
(OTSRTM.082016.4326.1). Horizontal and vertical coordinates are WGS 1984 [EPSG: 4326]
and WGS84 respectively. The data coordinates are Xmin: 72.777557, Xmax: 73.00827, Ymin:
19.115327 and Ymax: 19.316327 respectively. The satellite view using google map is shown in
Figure 1 and raster ASCII grid image is shown in Figure 2. The raster data used as input is
either an ASCII data file or a GeoTiff file encompassing elevational values. The number of rows
and columns are 831 and 724 respectively. The cell size of the sample files 0.000277777778.
Being an elevational data format, DEMs store three coordinates for any location. The
coordinates x and y denote horizontal position in the surface of the earth and z signify the
elevational value at this location. The elevation values are extracted from each cell for
reconstruction.
Figure 1: Satellite View of Test Region Using Google Map
3D RECONSTRUCTION OF HILLS OF SANJAY GANDHI NATIONAL PARK REGION FROM
DIGITAL RASTER ELEVATION DATA
Swati R. Maurya and Ganesh M. Magar 246
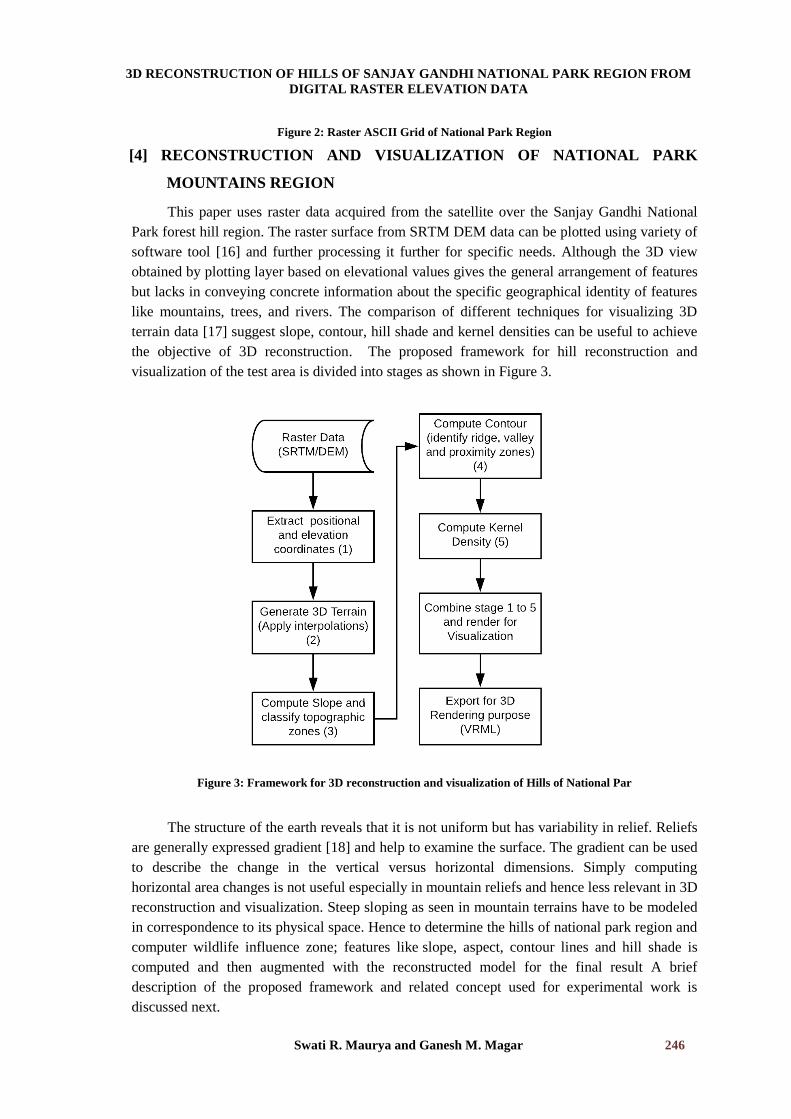
Figure 2: Raster ASCII Grid of National Park Region
[4] RECONSTRUCTION AND VISUALIZATION OF NATIONAL PARK
MOUNTAINS REGION
This paper uses raster data acquired from the satellite over the Sanjay Gandhi National
Park forest hill region. The raster surface from SRTM DEM data can be plotted using variety of
software tool [16] and further processing it further for specific needs. Although the 3D view
obtained by plotting layer based on elevational values gives the general arrangement of features
but lacks in conveying concrete information about the specific geographical identity of features
like mountains, trees, and rivers. The comparison of different techniques for visualizing 3D
terrain data [17] suggest slope, contour, hill shade and kernel densities can be useful to achieve
the objective of 3D reconstruction. The proposed framework for hill reconstruction and
visualization of the test area is divided into stages as shown in Figure 3.
Figure 3: Framework for 3D reconstruction and visualization of Hills of National Par
The structure of the earth reveals that it is not uniform but has variability in relief. Reliefs
are generally expressed gradient [18] and help to examine the surface. The gradient can be used
to describe the change in the vertical versus horizontal dimensions. Simply computing
horizontal area changes is not useful especially in mountain reliefs and hence less relevant in 3D
reconstruction and visualization. Steep sloping as seen in mountain terrains have to be modeled
in correspondence to its physical space. Hence to determine the hills of national park region and
computer wildlife influence zone; features like slope, aspect, contour lines and hill shade is
computed and then augmented with the reconstructed model for the final result A brief
description of the proposed framework and related concept used for experimental work is
discussed next.
International Journal of Computer Engineering and Applications, Volume XI, Issue XII, Dec. 17, www.ijcea.com ISSN 2321-3469
Swati R. Maurya and Ganesh M. Magar 247
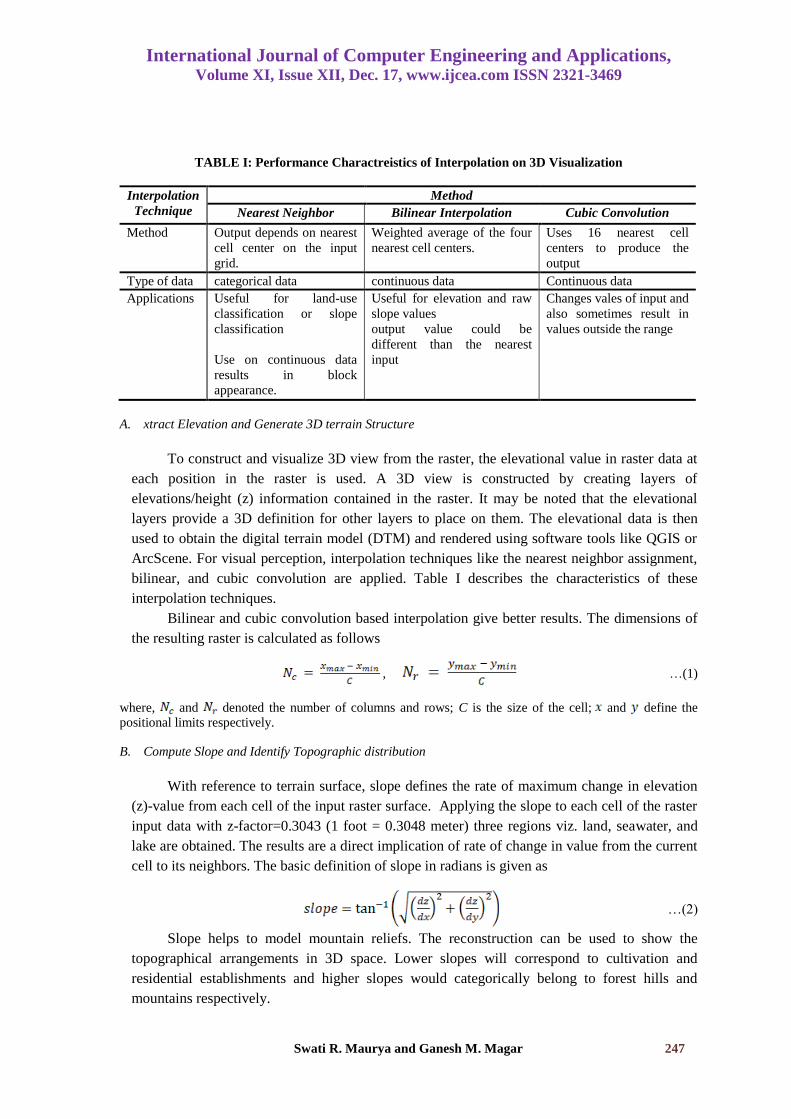
TABLE I: Performance Charactreistics of Interpolation on 3D Visualization
Interpolation
Technique
Method
Nearest Neighbor Bilinear Interpolation Cubic Convolution
Method Output depends on nearest
cell center on the input
grid.
Weighted average of the four
nearest cell centers.
Uses 16 nearest cell
centers to produce the
output
Type of data categorical data continuous data Continuous data
Applications Useful for land-use
classification or slope
classification
Use on continuous data
results in block
appearance.
Useful for elevation and raw
slope values
output value could be
different than the nearest
input
Changes vales of input and
also sometimes result in
values outside the range
A. xtract Elevation and Generate 3D terrain Structure
To construct and visualize 3D view from the raster, the elevational value in raster data at
each position in the raster is used. A 3D view is constructed by creating layers of
elevations/height (z) information contained in the raster. It may be noted that the elevational
layers provide a 3D definition for other layers to place on them. The elevational data is then
used to obtain the digital terrain model (DTM) and rendered using software tools like QGIS or
ArcScene. For visual perception, interpolation techniques like the nearest neighbor assignment,
bilinear, and cubic convolution are applied. Table I describes the characteristics of these
interpolation techniques.
Bilinear and cubic convolution based interpolation give better results. The dimensions of
the resulting raster is calculated as follows
, …(1)
where, and denoted the number of columns and rows; C is the size of the cell; and define the positional limits respectively. B. Compute Slope and Identify Topographic distribution
With reference to terrain surface, slope defines the rate of maximum change in elevation
(z)-value from each cell of the input raster surface. Applying the slope to each cell of the raster
input data with z-factor=0.3043 (1 foot = 0.3048 meter) three regions viz. land, seawater, and
lake are obtained. The results are a direct implication of rate of change in value from the current
cell to its neighbors. The basic definition of slope in radians is given as
…(2)
Slope helps to model mountain reliefs. The reconstruction can be used to show the
topographical arrangements in 3D space. Lower slopes will correspond to cultivation and
residential establishments and higher slopes would categorically belong to forest hills and
mountains respectively.
3D RECONSTRUCTION OF HILLS OF SANJAY GANDHI NATIONAL PARK REGION FROM
DIGITAL RASTER ELEVATION DATA
Swati R. Maurya and Ganesh M. Magar 248
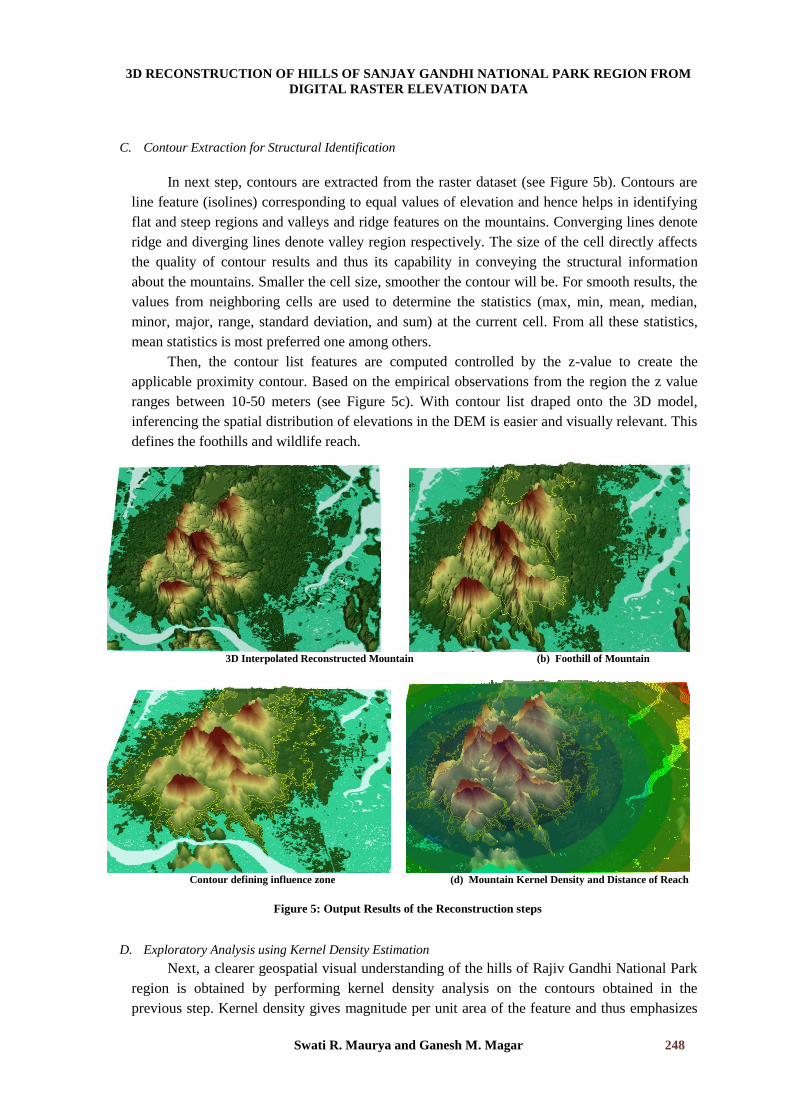
C. Contour Extraction for Structural Identification
In next step, contours are extracted from the raster dataset (see Figure 5b). Contours are
line feature (isolines) corresponding to equal values of elevation and hence helps in identifying
flat and steep regions and valleys and ridge features on the mountains. Converging lines denote
ridge and diverging lines denote valley region respectively. The size of the cell directly affects
the quality of contour results and thus its capability in conveying the structural information
about the mountains. Smaller the cell size, smoother the contour will be. For smooth results, the
values from neighboring cells are used to determine the statistics (max, min, mean, median,
minor, major, range, standard deviation, and sum) at the current cell. From all these statistics,
mean statistics is most preferred one among others.
Then, the contour list features are computed controlled by the z-value to create the
applicable proximity contour. Based on the empirical observations from the region the z value
ranges between 10-50 meters (see Figure 5c). With contour list draped onto the 3D model,
inferencing the spatial distribution of elevations in the DEM is easier and visually relevant. This
defines the foothills and wildlife reach.
D. Exploratory Analysis using Kernel Density Estimation
Next, a clearer geospatial visual understanding of the hills of Rajiv Gandhi National Park
region is obtained by performing kernel density analysis on the contours obtained in the
previous step. Kernel density gives magnitude per unit area of the feature and thus emphasizes
3D Interpolated Reconstructed Mountain (b) Foothill of Mountain
Contour defining influence zone (d) Mountain Kernel Density and Distance of Reach
Figure 5: Output Results of the Reconstruction steps
International Journal of Computer Engineering and Applications, Volume XI, Issue XII, Dec. 17, www.ijcea.com ISSN 2321-3469
Swati R. Maurya and Ganesh M. Magar 249
the relative geospatial positioning of the hill region under investigation. In other words, kernel
density estimators provide locally weighted averaging of the distribution. With the test dataset,
for density calculations, the planar method is used rather than geodesic method. This is due to
the fact that the data set under evaluation represents local area and a projection with relatively
correct distance and area measures. Quartic function based kernel[19] is implemented. The
default search radius (or bandwidth) for computing the features (mountain region) in a
neighborhood around it is defined as follows.
… (3)
where denotes standard distance, denotes median distance and n corresponds to the
number of points or the sum of population field.
E. Draping and Exporting for Rendering
The final reconstructed 3D surface can be further draped with the satellite image on the 3D
reconstructed surface to provide the realistic feel of the mountain region of the national park.
The draped image when exaggerated can show the small details more appropriately. The final
result is exported for rendering and interactive visualization into VRML format for the
independent viewing experience. Custom operations and interaction can be easily performed on
VRML model in user friendly manner and thus more useful.
[5] RESULTS AND DISCUSSION
Based on the framework (see Figure 3) and the experimental results, there are several
interesting observations. For visual efficiency neighbor assignment, bilinear and cubic
convolutions are applied and the reconstructed terrain models are evaluated for visual efficiency
and processing time. The nearest neighbor assignment is faster but suffers from visual
smoothness and results in the spatial error of the order of one-half the cell size. Bilinear
interpolation generates smooth surface (see Figure 4b) by obtaining the new cell value by using
the weighted distance average of four adjacent cell centers. Cubic convolution uses 16 nearest
input cell centers to fit the curve to generate the new values. Although the result obtained by
cubic interpolation was less distorted than the result obtained using nearest neighbor techniques,
but it takes more time to process. Also in some cases, outlier points are generated which is
undesired.
Computing slope helped in delineating surface into mountain, planar and water regions. A
high rate of change in gradient denotes mountain and thus helps in culling away the ground and
other less relevant regions. The ground truth verification shows the convergence of accuracy
between to 96% to 98% with the exception of some isolated foothill region. Zonal identification
contour based on elevation and slope helped in identifying wildlife reach at the foothills.
Finally, the use of kernel density (see Figure 5d) highlighted different topographical zone and
hence can relate to the degree of interference with urban infrastructure. The central concentric
zone defines the safe zone for wildlife with least interference while the outer zone concentrates
flat region suitable for human establishments. Some of the other observations are highlighted
next.
A. Data sources and related problems:
3D RECONSTRUCTION OF HILLS OF SANJAY GANDHI NATIONAL PARK REGION FROM
DIGITAL RASTER ELEVATION DATA
Swati R. Maurya and Ganesh M. Magar 250
High-resolution Data requirements: The reconstructed output using raster samples at 30m resolution successfully explains the geographical structure of mountains. However higher resolution (1m resolution) of remotely sensed data and greater sampling density will improve the results matching with the ground truth.
Mapping problems: Geometric distortion is experienced in output when remote sensed and aerial photographs are used for modeling mountainous region. Distortions are high around high relief region. However, it can be overcome using shadow matching.
B. Ground truth validation issue: Measuring ground truth for such larger area is challenging.
Global Positioning System (GPS) was used to physically verify known positions of the mountain region. The accuracy of around 94 % is observed for well-defined establishments. The error of 17m to 125m was observed around high slopes.
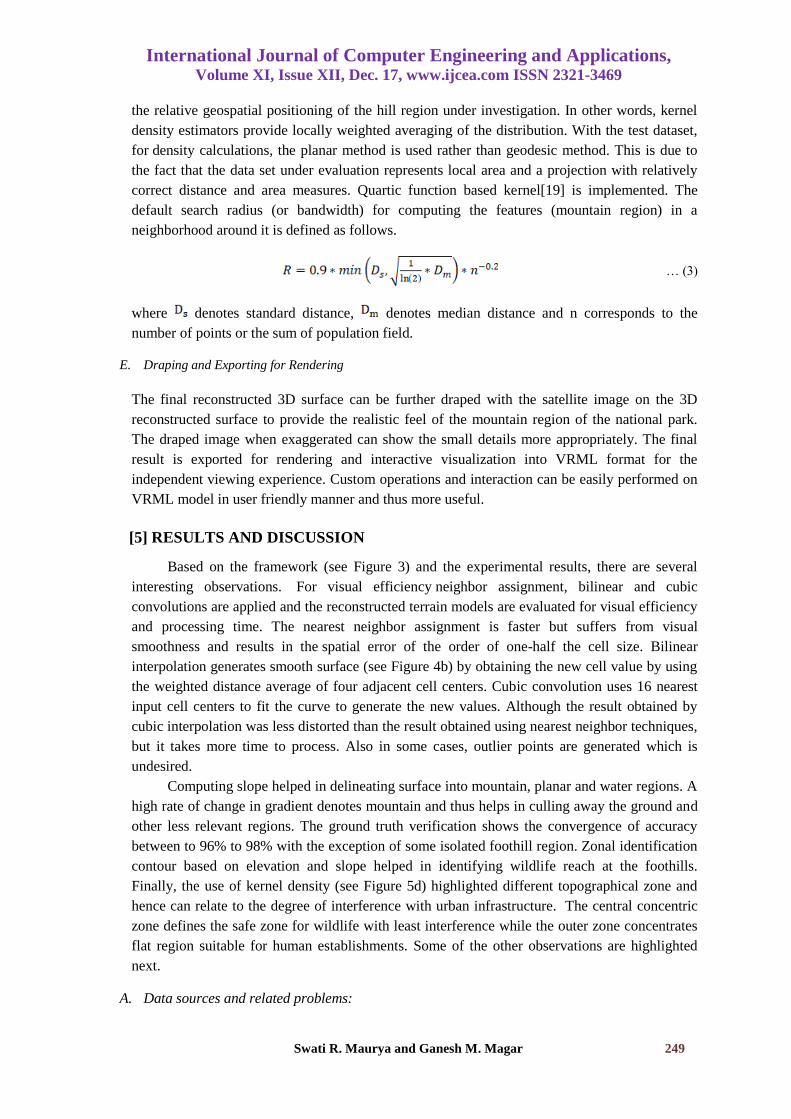
The final reconstructed and recognized mountain regions of Sanjay Gandhi National Park region is
shown in Figure 6.
(a) 3D Solid Model of Reconstructed Mountain (b) 3D Mesh Model of Reconstructed Mountain
Figure 6: Reconstruction Results of National Park Region
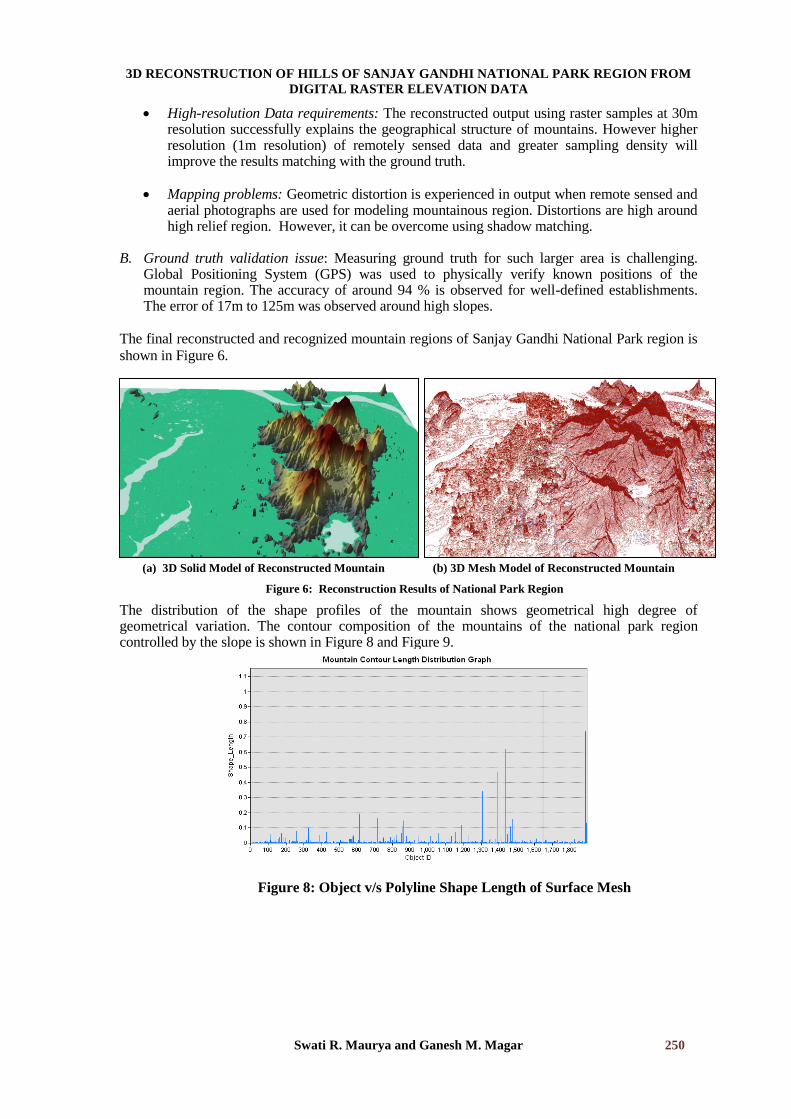
The distribution of the shape profiles of the mountain shows geometrical high degree of geometrical variation. The contour composition of the mountains of the national park region controlled by the slope is shown in Figure 8 and Figure 9.
Figure 8: Object v/s Polyline Shape Length of Surface Mesh
International Journal of Computer Engineering and Applications, Volume XI, Issue XII, Dec. 17, www.ijcea.com ISSN 2321-3469
Swati R. Maurya and Ganesh M. Magar 251
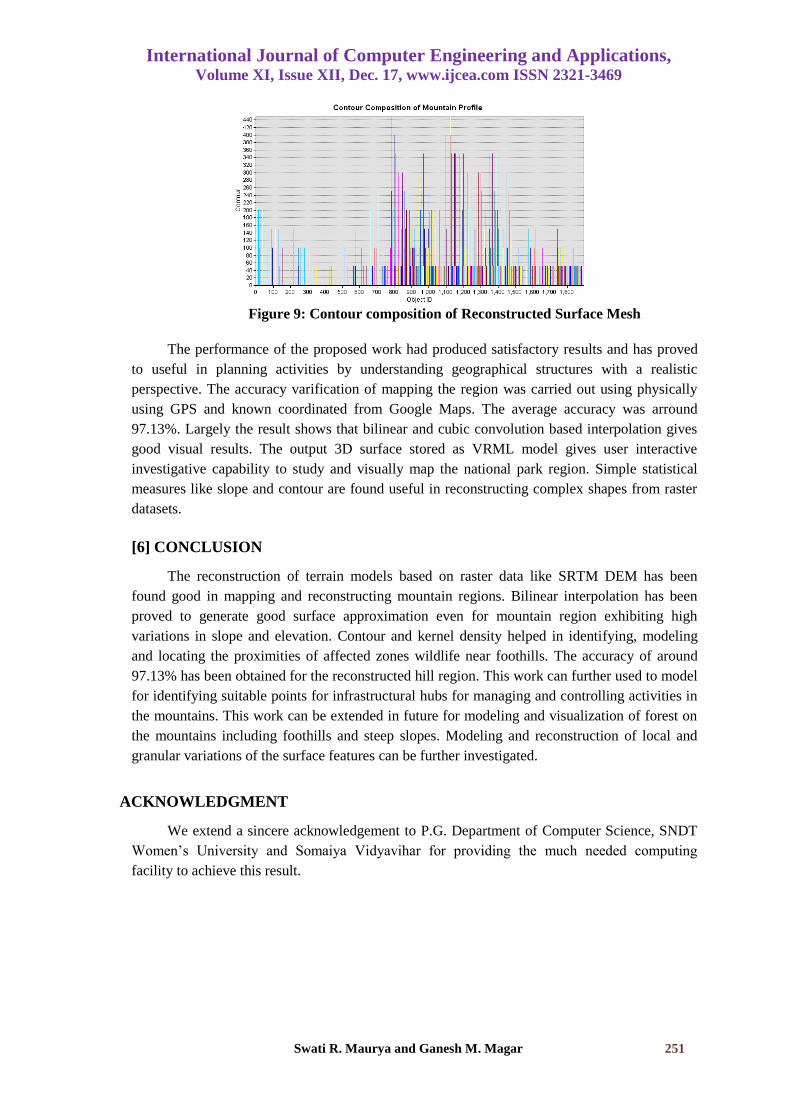
Figure 9: Contour composition of Reconstructed Surface Mesh
The performance of the proposed work had produced satisfactory results and has proved
to useful in planning activities by understanding geographical structures with a realistic
perspective. The accuracy varification of mapping the region was carried out using physically
using GPS and known coordinated from Google Maps. The average accuracy was arround
97.13%. Largely the result shows that bilinear and cubic convolution based interpolation gives
good visual results. The output 3D surface stored as VRML model gives user interactive
investigative capability to study and visually map the national park region. Simple statistical
measures like slope and contour are found useful in reconstructing complex shapes from raster
datasets.
[6] CONCLUSION
The reconstruction of terrain models based on raster data like SRTM DEM has been
found good in mapping and reconstructing mountain regions. Bilinear interpolation has been
proved to generate good surface approximation even for mountain region exhibiting high
variations in slope and elevation. Contour and kernel density helped in identifying, modeling
and locating the proximities of affected zones wildlife near foothills. The accuracy of around
97.13% has been obtained for the reconstructed hill region. This work can further used to model
for identifying suitable points for infrastructural hubs for managing and controlling activities in
the mountains. This work can be extended in future for modeling and visualization of forest on
the mountains including foothills and steep slopes. Modeling and reconstruction of local and
granular variations of the surface features can be further investigated.
ACKNOWLEDGMENT
We extend a sincere acknowledgement to P.G. Department of Computer Science, SNDT
Women’s University and Somaiya Vidyavihar for providing the much needed computing
facility to achieve this result.

3D RECONSTRUCTION OF HILLS OF SANJAY GANDHI NATIONAL PARK REGION FROM
DIGITAL RASTER ELEVATION DATA
Swati R. Maurya and Ganesh M. Magar 252
REFERENCES
[1] C. Schillaci, A. Braun, and J. Kropáček, “Terrain analysis and landform recognition,” Terrain
analysis and landform recognition and geography. British Society for Geomorphology, pp.1–18,
2015.
[2] X. Liu, W. Meng, J. Guo, and X. Zhang, “A Survey on Processing of Large-Scale 3D Point
Cloud,” Springer, Cham, 2016, pp. 267–279.
[3] M. Berger et al., “State of the Art in Surface Reconstruction from Point Clouds,” Proc.
Eurographics 2014, Eurographics Stars, pp. 161–185, 2014.
[4] R. Saleri et al., “UAV photogrammetry for archaeological survey: The Theaters area of Pompeii,”
in 2013 Digital Heritage International Congress (DigitalHeritage),2013,pp.497–502.
[5] S. S. K. Pratibha P. Shingare, “Review on Digital Elevation Model,” Int. J. Mod. Eng. Res., vol. 3,
no. 4, pp. 2412–2418, 2013.
[6] M. Calin, G. Damian, T. Popescu, R. Manea, B. Erghelegiu, and T. Salagean, “3D Modeling for
Digital Preservation of Romanian Heritage Monuments,” Agric. Agric. Sci. Procedia, vol. 6, pp.
421–428, Jan. 2015.
[7] S. R. Maurya and G. M. Magar, “Segmentation and Visualization of Airborne Sparse Forest
LiDAR Data using Region Growing Approach,” Int. J. Comput. Appl., vol. 156, no. 5, pp. 16–22,
2016.
[8] M. M. Shanoer and F. M. Abed, “Evaluate 3D laser point clouds registration for cultural heritage
documentation,” Egypt. J. Remote Sens. Sp. Sci., Dec. 2017.
[9] B. Stular, Z. Kokalj, K. Stof, O. Stir, and L. Nuninger, “Visualization of lidar-derived relief models
for detection of archaeological features,” 2012.
[10] G. Karauğuz, Ö. Çorumluoğlu, İ. Kalaycı, and İ. Asri, “3D Photogrammetric model of Eflatunpinar
monument at the age of Hittite empire in Anatolia,” J. Cult. Herit., vol. 10, no. 2, pp. 269–274,
Apr. 2009.
[11] X. Jia and Q. Guo, “The Preliminary Study on 3D Terrain Visualization,” in Emerging Research in
Web Information Systems and Mining, Springer, Berlin, Heidelberg, 2011, pp. 178–184.
[12] C. M. Ruzínoor, A. R. M. Shariff, A. R. Mahmud, and B. Pradhan, 3D Terrain Visualisation for
GIS: A Comparison of Different Techniques. Springer-Verlag Berlin Heidelberg, 2011.
[13] Y. M. Huang and C.-J. Chen, “3D Fractal reconstruction of terrain profile data based on digital
elevation model,” Chaos, Solitons & Fractals, vol. 40, no. 4, pp. 1741–1749, May 2009.
[14] R. Yang, Z. Chang, and T. Xue, “3D Terrain visualization for Mountain Taishan,” in Proceedings
2011 IEEE International Conference on Spatial Data Mining and Geographical Knowledge
Services, 2011, pp. 285–290.
[15] N. Kolecka, “True-3D Imaging of Mountainous Regions: Case Study from the Polish Tatra
Mountains,” Springer, Berlin, Heidelberg, 2013, pp. 565–577.
[16] M. N. Favorskaya and L. C. Jain, “Software Tools for Terrain and Forest Modelling,” Springer,
Cham, 2017, pp. 69–109.
[17] D. M. Córdova-Esparza, J. J. Gonzalez-Barbosa, J. B. Hurtado-Ramos, and F. J. Ornelas-
Rodriguez, “A panoramic 3D reconstruction system based on the projection of based on the
projection of patterns,” Int. J. Adv. Robot. Syst., vol. 11, no. 1, 2014.
[18] S. E. Stead, “Estimation Of Gradients From Scattered Data,” The Rocky Mountain Journal of
Mathematics, vol. 14. Rocky Mountain Mathematics Consortium, pp. 265–279, 1984.
[19] H. Läuter, “Silverman, B. W.: Density Estimation for Statistics and Data Analysis. Chapman
& Hall, London – New York 1986, 175 pp., £12.—,” Biometrical J., vol. 30, no. 7, pp. 876–
877, Jan. 1988.