Embed Size (px)
Citation preview

Acta Geodyn. Geomater., Vol. 8, No. 4 (164), 377–388, 2011
3D MONITORING OF ACTIVE FAULT STRUCTURES IN THE KRUPNIK-KRESNA SEISMIC ZONE, SW BULGARIA
Nikolai DOBREV
Geological Institute, Bulgarian Academy of Sciences, Acad. G. Bonchev, bl. 24, Sofia 1113, Bulgaria Corresponding author‘s e-mail: [email protected] (Received March 2011, accepted June 2011) ABSTRACT The present paper concerns long-term 3D monitoring of active fault structures in the Krupnik-Kresna seismic zone, SWBulgaria with the use of extensometers TM71. The purpose is to establish the real rates of fault movements in the mostseismically active area in Bulgaria. Three points were installed (B6 on Krupnik Fault, and K5 and K12 on Struma Fault),which indicate a recent activity. The fault movements are characteristic with “calm” periods, linear slips, accelerations andsudden displacements. Different regimes of dynamics have been established corresponding to different periods. The greatestdynamics is found at monitoring point B6 along Krupnik Fault: for the whole period of observation the trends are calculatedas left lateral slip with 1.88 mm/a and a thrusting with 1.59 mm/a with high correlation coefficients. Co-seismicdisplacements from local and distant earthquakes were recorded. The significant impact was from M=7.4, 17 August, 1999,Izmit Earthquake, Turkey, showing a shortening of 8.34 mm, a right-lateral slip of 5.09 mm and a thrusting of 0.96 mm. Afterthat, for a short period of time the regime of movement on fault was changed. Movements on the Struma system reveal lowerrates. Both points show left-lateral movements, 0.28 mm/a at K5 and 0.09 mm/a at K12, and thrusting with 0.11 mm/a at K5and 0.72 mm/a at K12. KEYWORDS: 3D monitoring, active faults, co-seismic displacements, Krupnik-Kresna seismic zone, SW Bulgaria
Therefore, a project for integrated studies for clarifying the dynamics of this region by means of three-dimensional precise extensometers started in the 1980's. These included installation of three monitoring points in especially selected sites of the two fault structures. In recent years, GPS monitoring of local and regional network has been held. The temporary results confirmed the previous conclusions obtained by Milev et al. (1984). Furthermore, the most intense tectonic movements in Bulgaria have been established just in this area. It is GPS point No 16 showing a rate of 6.9 mm/a, which is the highest one in the country(Dobrev et al., 2005). The latest GPS measurementsshow uplift of Pirin Horst with 2 mm/a and movements along the western part of Krupnik Fault to North direction at 3 mm/a (Georgiev et al., 2007).
Until now, data concerning the results of measurements referred to different periods of observing the monitoring points have been published (Avramova-Tacheva et al., 1984; Dobrev and Košťák, 2000; Dobrev, 2005; and others). Influences of local and regional seismicity are established at the gauges. They concern both co-seismic effects (Dobrev and Košťák, 2000, and others.) and some pre-seismic effects (Shanov, 1993; Shanov and Dobrev, 1997; Košťák et al., 2007). The latest full results concern different periods – until May 1999 (Dobrev and Košťák, 2000) and until November 2004 (Dobrev, 2005).
INTRODUCTION Struma and Krupnik fault zones are the most
prominent tectonic structures in SouthwesternBulgaria. In the Simitli graben, they intersect eachother almost perpendicularily. This place is characterized by intense seismicity – the epicenter area of the strongest earthquake in Bulgaria is locatedhere. On 4 April 1904, two strong earthquakesoccurred within an interval of 23 minutes – at 10:02 and 10:25 GMT, with reported magnitudes 7.2 for the first one and 7.8 for the second one (Karnik, 1968;Christoskov and Grigorova, 1968). Exactly thesestructures are connected with the intense dynamics in this part of Bulgaria. Over 50 % of the earthquakesregistered annually throughout the country are concentrated just here (Botev and Glavcheva, 2003).
Contemporary dynamics in SW Bulgaria isa subject of discussion, different opinions andhypotheses. This creates high interest in establishingthe real values of movements in the region, as well asthe relationships between tectonic movements andlocal and regional seismicity.
Due to this reason, instrumental monitoring oftectonic movements started in 1950’s by geodetic observations over a local geodetic network in theSimitli graben and some benchmarks located alongthe railway trace Sofia-Thessaloniki (Milev et al., 1984). The first results found highly variable verticalvelocities reaching at some places up to 3.4 mm/a.

N. Dobrev
378
Long-term measurements showed that there wereinfluences of earthquakes with epicentres located inNE part of the Simitli graben (around the intersectionof Krupnik and Predela Faults) on the movements atpoint B6 (Dobrev et al., 2003). For example, it wasfound that during the seismic activity in Predela Faultthe movements in point B6 stop or decrease.
Several events have happened since mid-1999 onwards, which have been detected by monitoringpoints in that research area. These are a number ofearthquakes occurring in several Balkan countriessouth and southeast of the research area. One of themis the Izmit Earthquake of 1999 that caused seriousdisplacements at the monitoring gauge. At the sametime there is an almost constant weak local seismicactivity. All this shows the need for continuingobservation and analysis of the new results as well asthe accompanying factors influencing on themovements (seismic activity, etc.).
TECTONICAL AND GEOLOGICAL SETTING
In regional aspect, the research area is located inthe eastern part of the Balkan Peninsula, north of theAegean arch and area of rotation of North AnatolianFault to Central Greece (Fig. 1). This area is subjectedto the extensional regime in the direction of N-S (Mercier, 1981; McClusky et al., 2000; Kotzev et al.,2001, 2006, and others). The tectonic setting in SW Bulgaria and mainly in the area of research has beenstudied by Zagorchev (1970, 1992, etc.), Moskovskiand Georgiev (1970) and others.
According to the tectonic division of the territoryof Bulgaria, the research area is situated within theMorava-Rhodope structural zone, in its western part(Dabovski et al., 2002). The monitoring points are located in two interesting tectonic structures – Simitligraben and the flanked from south Kresna Horst(Fig. 2).
Simitli graben is defined by two parallelantithetic structures – Krupnik Fault and GradevoFault, forming a common Krupnik-Gradevo faultsystem with a general orientation of 40°. The mainactivity is along the Krupnik fault. It surrounds the Simitli graben in the south. It follows a direction from20-40° to 80-90°. The fault has a clear normal fault mechanism with a slight left-lateral component (determined by the slickensides). Tranos et al. (2006)found a long east-west oriented fault zone giving thename Kochani-Krupnik-Bansko rupture zone. Thiszone crosses the recent territories of Bulgaria andFYR of Macedonia. Its total length is estimated to exceed 100 km. They connect it with the strong 1904seismic sequence.
The activation of the Krupnik fault started duringthe Miocene times (~13 Ma). Basing on geologicaland morphological data, the slip-rate along the faultfor this period is estimated from 0.15 mm/a (Meyer etal., 2002) to 0.35 mm/a (Ganas et al., 2005).
The northern Gradevo fault is unclear on thesurface. Due to this reason, its role is incorrectly
Fig. 1 Simplified tectonic map of the eastern Mediterranean with research area (adapted from McClusky et al., 2000, and Kotzev et al., 2006 ). Grey quadrangle shows the research area. Arrows show observed direction of motion relative to Eurasia. Hatching shows the South Balkan extensional region (SBER). Shaded area indicates the suprasubduction extensional region. NAF is North Anatolian Fault. Solid lines are normal faults, locally with showed down-throw displacement. Lines with triangles are thrust faults. Relative strike-slip displacement is shown with open arrows. Countries: AL, Albania; BG, Bulgaria; SR, Serbia; GR, Greece; MK, FYR of Macedonia; RO, Romania; TR, Turkey.
ignored by many authors, and omitted in some publications (for example, Meyer et al., 2002). However, it is clearly exhumed in an outcrop at3-4 km E of Simitli Town. Also, it was found in boreholes drilled to search for coal and other mineral resources in the 1960's and 1970's (Dobrev, 1999).
Struma fault zone is a bundle of parallel faultsfollowing direction 150-170°. It is a long structurewhich starts from the territory of Serbia and can be traced to Halkidiki Peninsula, Greece (Zagorchev, 1992). On the territory of SW Bulgaria it defines the contemporary bed of Struma River. The Struma fault zone intersects the Simitli Graben dividing it into two parts. Going to the South into the Kresna Horst, the Struma zone is forming Kresna Gorge, whose depth

3D MONITORING OF ACTIVE FAULT STRUCTURES IN THE KRUPNIK-KRESNA ….
379
Fig. 2 Simplified sketch of the research area. The map shows the main tectonicstructures, faults and observation points. The main faults are as follows: KF,Krupnik Fault; GF, Gradevo Fault; SF, Struma Fault Zone; WPF, West Pirin Fault (mostly reverse); PrF, Predela Fault; WBF, West Brezhani Fault. Ticksindicate downthrown block, teeth indicate upthown block. The monitoringpoints localities are shown, KKB is the Seismic Station Krupnik..
fault it is much greater in depth. By geophysical profiling it was found to be more than 1500 m (Dobrev, 1999).
SEISMICITY
The research area is situated within the mostseismically active area in Bulgaria. Here are the epicenters of many strong earthquakes that occurred inrecent centuries. The last strongest events occurred on April 4, 1904, as it was mentioned above. The main shock affected a large region in recent territories of Bulgaria, FYR of Macedonia and Serbia (Dobrev and Petrov, 2007). Insufficient data concerning these two strong events give rise to different interpretations as to their magnitude, seismic surface deformations, fault activation structures, etc. Therefore estimates of their magnitudes and scope of ruptures vary widely (Ranguelov et al., 2000). Despite wide assessments of their characteristics, these earthquakes are among the most impressive of the Balkan Peninsula (Gutenberg
exceeds 500 m. The contemporary activity of this faultwas recently debated. Most of the researchers have supposed that it was fossilized in late Neogene(personal communication and unpublished data).
The area is relatively well studied in geologicalterms. The geological structure was clarified because of the many boreholes drilled in the research area inthe 1960’s – 1980’s.
The Simitli graben is filled by Neogenesediments (Maeotian and Pontian-Dacian): mainlyslightly lithified sandstones and clayey sands(Marinova and Zagorchev, 1990). The flanked frameis built by Praecambrian metamorphic rocks, mainly gneisses and amphibolites. Kresna Gorge and thesouthern flanked framework of the graben are built bygranite of two types – with Palaeozoic and Upper Cretaceous age.
The graben is characterized by remarkable depth: the drilling data has reached a depth of about 1100 min the central part, but in the south near the Krupnik

N. Dobrev
380
structures, which are located parallel to the Krupnik-Gradevo fault system, northward from the Simitli graben and continuing to the southwest in the territoryof FYR of Macedonia.
INSTRUMENTAL MONITORING
The aim of conducted monitoring is to understand the recent movements along the main structures that are connected with the strongest seismic and tectonic activity in the research area. Establishment of extremely slow movements requiresuse of highly sensitive equipment, durable to externalclimatic influences and providing opportunities forlong-term monitoring. It is the three-dimensionalextensometer TM71 developed in the Czech Republicby Dr. Blahoslav Košťák (Košťák, 1991).
It works on the principle of mechanical interference - moiré, which records displacement as a fringe pattern on superposed optical grids mechanically connected with the opposite walls or crack faces. Due to this principle, which completely avoids any electrical transmissional means, the gauge displays an extremely large long-term stability, and infallible performance under hard outdoor conditions. Practically, it means that values recorded during periods of decades can be well compared. Results will then be provided as displacements on structural planes
and Richter, 1954; Shebalin et al., 1974; Ambraseys,2001; Papadimitriou et al., 2006; Tranos et al., 2006,2008, and others).
There is some historical information about otherstrong earthquakes before, like the one of 7 January1895 (M=5.1), on 6 December, 1866 (M>6?), recentlyproved to have not been in the study area (Glavcheva,1999, 2004) and the disastrous 4 September, 1896earthquake (Watzof, 1902; Shebalin et al., 1974). For the period of monitoring in the area of the Simitligraben and its vicinity (1982-2010) over 200earthquakes with a magnitude M≥3 have beenregistered (Fig. 3). However, the area was imposed on the influence of neighboring foci, for example fromthe Mesta graben (30 km East of the research area), from FYR of Macedonia (Valandovo), from Centraland Northern Greece and even from Turkey. Only forthe last 5 years, in our neighboring countries more than 30 earthquakes with magnitude M≥5 have beenregistered (according to data of EuropeanMediterranean Seismological Centre, Strasbourg).
In Figure 3 it is obvious that the frequentnowadays seismicity is concentrated N and NW ofSimitli graben. A part of these earthquakes isoriginated in a depth range from 2 to 5 km (acc. toEMSC data) that is difficult to be connected with theKrupnik Fault. It shows presence of other active fault
Fig. 3 Seismicity map of Simitli Graben and adjacent area for period 1982-2010. Black circles show epicenters with magnitudes M≥3. Data is taken from Solakov and Simeonova (1993), Ranguelov et al. (2001) withadditions from Geophysical Institute – BAS, and EMCS, Strassbourg.

3D MONITORING OF ACTIVE FAULT STRUCTURES IN THE KRUPNIK-KRESNA ….
381
Table 1 Orientation of the spatial axes of monitoring points in SW Bulgaria (after Avramova-Tacheva et al.,1984; Košták and Avramova-Tacheva, 1988; Dobrev et al., 2003).
Monitoring point No.
Coordinates +X horizontal zone extension or shortening
+Y horizontal shear movement along the fault (fissure) direction
+Z vertical movement
local fault direction
K5 23.155° E 41.840° N
SW block to 225° (extension)
SW block to 135° (sinistral slip)
subsidence of the SW block (probably reverse slip)
150°
B6 23.170° E 41.864° N
Neogene basin to 290° (extension)
Neogene basin to 200° (sinistral slip)
subsidence of the Neogene basin (normal slip)
20°
K7 23.135° E 41.845° N
The northern block to 350°
The northern block to 260°
subsidence of the northern block
260°
K12 23.157° E 41.833° N
SW block to 240° (extension)
SW block to 150° (dextral slip)
reverse movements (or subsidence of the SW block)
150°
monitoring points in detail. The frequency of observation is once monthly or bimonthly, as well as after any stronger earthquake or other event that occurred in the area of study. The orientations of spatial axes at all monitoring points are given in Table 1.
The monitoring point K5 (No. 5 in Bulgaria) is installed in a single tectonic structure connected with the Struma fault zone which is oriented N-S (Table 1). At this locality, the fault represents a zone 2.5 m wide filled by broken and crushed granite material. This fault can be traced on southwards where it is evident. The last field studies established that the fault at this site is dipped to NEE, i.e. the meaning of vertical movements should be changed as it is given in Table 1 (see Z-axis).
The next monitoring point (No. 6, B6 or Brezhani 6) was arranged at the Krupnik fault. The measuring system bridges the contact between the Praecambrian amphibolites and the Neogene coarse-grained sediments. A special trench exposes the contact of fault zone, whose width is 3.4 m at that point (Avramova-Tacheva et al., 1984; Avramova-Tacheva and Košťák, 1995).
Monitoring point K7 (No.7 or Kroupnik 7) was installed on a fissure that appeared during the strong earthquakes of 1904 and located on the steep slope 700 m SE from the village of Kroupnik. The extensometer operated till the beginning of 1994. The full results were published by Dobrev and Košťák (2000).
in mm, and time trends derived as rates in mm peryear under hard field conditions in a prolongedoperation. The accuracy of instrument is 0.05-0.0125 mm in all three space co-ordinates and 3.2 x 10⁻⁴ rad in angular deviations. Temperature effects inthe system including holders are eliminatednumerically, while such effects upon the rock are noteliminated in the data and are observable in climaticcyclic variations.
The data are obtained in three Cartesiancoordinates, calculated from recorded interferencepatterns. They represent differential movementsaccording to Table 1. It is always: X - horizontal, across the contact, Y - horizontal slip, and Z - vertical displacement. The movements are relative betweenthe two sides, presented in graphs as displacements ofthe lower block on the slope to the opposite one,although the interpolation must consider themovement at both sides. The gauge is used for regularmonitoring of slow displacements along active faults,landslide fissures and rock deformations.
In 1982-1983, three extensometers for three-dimensional monitoring of fault movements were installed in SW Bulgaria: these are K5 (in Struma Fault inside the Kresna Gorge), B6 (Krupnik faultnear Brezhani Village), and K7 (near Krupnik Village- in seismogravitational cracked slope deformation). The last point K12 (in Struma Fault inside the KresnaGorge) was installed in 2003. Avramova-Tacheva et al. (1984) and Dobrev and Košťák (2000) have already described the present situation of the

N. Dobrev
382
The last point K12 (No.12 or Kresna 12) for 3Dmonitoring was installed in November 2003. Theselected fault is an element of Struma Fault zone andit is located inside the Kresna Gorge. Until present,only initial reports have been published concerningthe period 2003-2004 (Dobrev, 2005; Dobrev andAvramova-Tacheva, 2007).
RESULTS MONIRORING POINT B6, BREZHANI VILLAGE, KRUPNIK FAULT
Until present, several interpretations have been made on the movements along this fault at point B6.
The amplitudes are obvious for the X axis - they are about 2-4 mm and vary due to the big length ofholders (Table 2). It is difficult to determine the realamplitude value because of the dynamics of movement. In the other two directions (Y and Z), the amplitudes tend to 0.
For the whole period of observation (1982-2010), it is established that the general movements are as follows: extension 1.15 mm/a (correlationR2=0.76), left-lateral slip of 1.88 mm/a (R2=0.94), anda reverse slip of –1.59 mm/a (R2=0.95). Concerninghorizontal movements, varying periods of shorteningand extension at fault are established. Thedeformation accumulated so far is impressive. Theamount of total displacement is 86.81 mm at the endof 2010. It is well expressed in Figure 4. In the shortterm periods, there are several months’ periods withvariable velocities. These are cycles of accelerationand reduction of movements, sometimes changing ofthe movement direction, and sharp displacements(Fig. 5). Some of the sharp movements have a co-seismic origin, however anomalies in movementshave been established before earthquakes located tothe South of the research area, i.e. in Greece (Shanov,1993; Shanov and Dobrev, 1997).
The last detailed analysis by Dobrev and Košťák (2000) concerned the period up to May 1999 just before the strong Izmit (Kocaeli) Earthquake, Turkey,17.08.1999, M=7.4. Despite the great distance fromthe epicenter (600 km) some major displacementswere established. It was found that the movementshad fluctuation character along the fault. These were
Table 2 Data for measured seasonal amplitudes and average temperatures at monitoring points.
Point No.
Average yearly temperature
Average seasonal amplitudes Full length of holders
tmean t X Y Z L °C °C mm mm mm m
K5 17.0 34.5 1.0-1.2 00.4-0.5 00.7 2.52 K12 14.2 27.8 0.30-0.35 00.30 <0.1 0.73 B6 12.6 22.5 ≥2 ~0 ~0 2.02
Fig. 4 A photograph of monitoring point B6. The left-lateral displacement of steel holders is obvious.
so intense that the apparatus was seriously damaged. The average resulting displacements during seismic vibrations were calculated as follows:
ΔX=–8.34 mm (shortening)
ΔY=–5.09 mm (right-lateral slip)
ΔZ=–0.96 mm (thrusting)
It may be noticed that the Krupnik fault, which is usually left-lateral, is doing a right-lateral slip after the earthquake (and short time after it, the right-lateralmovement continues). Nearly a half an year later, the left-lateral movements restored again. Effects on the movements at this point due to subsequent AthensEarthquake (07.09.1999, M=6.0) have not been established.
Since August 1999, four stages of themovements have been established (Table 3). For the last 10 years, however, it has been noticed that the dynamics of the movements in the Y-axis is decreasing with increasing in the velocity along

3D MONITORING OF ACTIVE FAULT STRUCTURES IN THE KRUPNIK-KRESNA ….
383
established. The general movements are as follows: extension 0.10 mm/a (R2=0.58), left-lateral slip of 0.28 mm/a (R2=0.78), and a subsidence of SW block (probably reverse) of 0.11 mm/a (R2=0.62).
Since 1998, the rate of movement is left-lateralranging from 0.4 to 0.8 mm per year. Minimum values of X, Y and Z are mainly during the summer period (June-July). In 2006, there was an anomaly – stable trends without the typical seasonal sinusoid-like fluctuations. This was the period of intense local seismic activity from February to June-July 2006 (Table 4). Similar anomalies we noticed in the following year when increased seismicity was also reported. During this period the seismic fault reacted
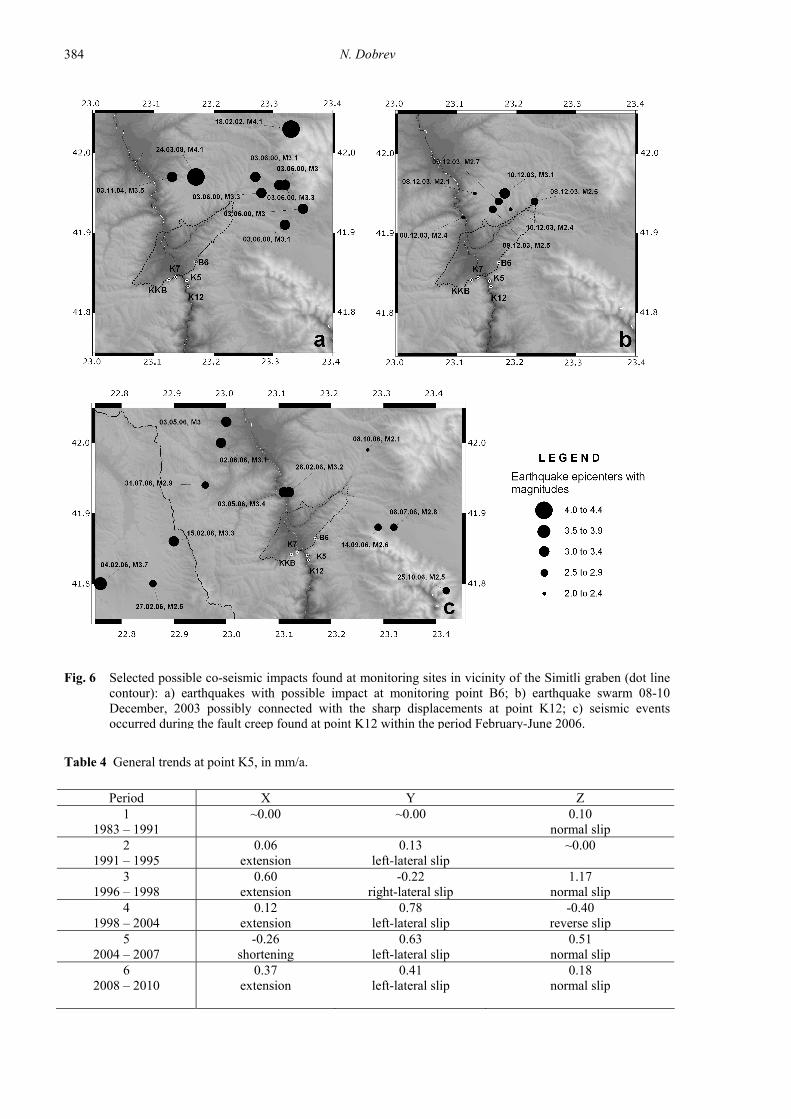
Z-axis. Some latest relationships between localseismicity and the sharp displacements are shown inFigure 6a. It is clear that the seismic events that influenced the movements on faults, with epicenterslocated at north and NE parts the flanked frame of the Simitli graben.
MONITORING POINT K5 – KRESNA GORGE, STRUMA FAULT ZONE
This point is characteristic with high amplitudesdue to the direct atmospheric impact on the gauge(Table 2, Fig. 7).
For the whole period (1982-2010), a general direction of extension of the zone has been
Fig. 5 Diagram of displacements found at B6 with earthquake impacts and periods of movements (see Table 3). Table 3 General trends at point B6, in mm/a.
Period X Y Z
1 1982 - Aug. 1999
+1.02 extension
+2.61 left-lateral slip
-1.91 reverse slip
2 28.08.1999 – 17.02.2000
-11.61 shortening
-4.60 right-lateral slip
6.83 normal slip
3 17.02.2000 – 29.12.2004
+1.84 extension
+3.03 left-lateral slip
-1.91 reverse slip
4 19.01.2005 – 27.02.2009
+0.94 extension
~0.00
-3.04
reverse slip 5
13.03.2009 – 02.12.2010 -0.39
shortening +1.71
left-lateral slip -7.23
reverse slip
N. Dobrev
384
Fig. 6 Selected possible co-seismic impacts found at monitoring sites in vicinity of the Simitli graben (dot linecontour): a) earthquakes with possible impact at monitoring point B6; b) earthquake swarm 08-10 December, 2003 possibly connected with the sharp displacements at point K12; c) seismic events occurred during the fault creep found at point K12 within the period February-June 2006.
Table 4 General trends at point K5, in mm/a.
Period X Y Z 1
1983 – 1991 ~0.00
~0.00
0.10
normal slip 2
1991 – 1995 0.06
extension 0.13
left-lateral slip ~0.00
3
1996 – 1998 0.60
extension -0.22
right-lateral slip 1.17
normal slip 4
1998 – 2004 0.12
extension 0.78
left-lateral slip -0.40
reverse slip 5
2004 – 2007 -0.26
shortening 0.63
left-lateral slip 0.51
normal slip 6
2008 – 2010
0.37 extension
0.41 left-lateral slip
0.18 normal slip

3D MONITORING OF ACTIVE FAULT STRUCTURES IN THE KRUPNIK-KRESNA ….
385
Fig. 7 Diagram of displacements found at Point K5 with periods of movements (see Table 4).
The second period of acceleration is established from October 2008 to January 2009. About a year before this creep, there was a high seismicity N and NW of the research area. The strongest event had magnitude M=4.1.
In Sept. 2009 a small jump is recorded, whichcannot be explained. There was a shallow earthquakeM=2.9 (11 Oct. 2009) with the approximatecoordinates NE of Kresna Gorge (close to point B6).At the other 2 axes (X and Y) the movements arefairly constant, with characteristic low amplitude of seasonal temperature fluctuations.
The whole monitoring period 2003-2010 is characteristic by extension of zone of 0.08 mm/a (R2=0.30), left-lateral slip of -0.09 mm/a (R2=0.26), and a reverse slip of 0.72 mm/a (R2=0.68).
DISCUSSION AND CONCLUSION
The 3D monitoring shows the present activity on the observed faults at the three observation points. The movements are not permanent, “calm” periods are observed, with linear slips, accelerations and sudden displacements. Strong geodynamics of the region does not allow to distinguish clearly the effects of many earthquakes. The instrument is sensitive and reacts to most of the earthquakes. Mainly, the sharp displacements are co-seismic. There are also effects from more distant seismic events - eg IzmitEarthquake, Turkey, 17.08.1999.
The most intense movements are along the Krupnik Fault. They were clearly expressed in directions Y and Z, where velocities calculated for the entire observation period (1982-2010) are 1.88 mm/aleft lateral slip and –1.59 mm/a thrusting. The sharp
with "shrinkage" and varying slips: left-lateral and right-lateral at Y-axis, and reverse slip at Z-axis.
MONITORING POINT K12 – KRESNA GORGE, STRUMA FAULT ZONE
Here the amplitudes are with low values becausethe instrument is located in the dank space (a narrowcreek) where there is a poor climatic impact (Table 2, Fig. 8).
Seven periods of movement are distinguished(Table 5). In the first period some sharp displacementsat Y- and Z-axes are established. Movements ofa sharp left displacement (ΔY=–3.34 mm) and a thrusting (ΔZ=–3.79 mm) have been recorded,which coincide with the earthquake swarm between 8and 10 December 2003. Then several earthquakes ofmagnitude M= 2.1–3.5 were recorded in the researcharea (Fig. 6b). From January to October 2006 therewas an interesting period of vertical movement on thefault. This is a typical creep, initially starting witha slow movement (0.91 mm/a) from January to lateMay, and after that begins an acceleration of the motion with constant velocity ~7 mm/a. Interesting is the stable velocity of this creep. During this periodthere is a hard seismic activity, starting from earlyFebruary to early June 2006 in the west and northwestof the Struma fault zone. These are earthquakes in the territories of Bulgaria and FYR of Macedonia(Fig. 6c). The strongest of them occurred in FYR ofMacedonia with M=3.7. As it is seen in this figure, aSW-NE orientation of the epicenters of the localearthquakes is obvious following direction ~20-30°. Other events have been registered at this period northof Simitli and in Pirin Mts.

N. Dobrev
386
Table 5 General trends at point K12, in mm/a.
Period X Y Z
1 29.12.2003 – 14.01.2006
-0.19 normal slip
2a 14.01.2006 – 31.05.2006
2b
31.05.2006 – 04.10.2006
0.91 reverse slip 6.99 reverse slip
3 04.10.2006 – 20.10.2008
0.13 reverse slip
4 20.10.2008 – 26.01.2009
2.64 reverse slip
5 26.01.2009 – 25.09.2009
-0.26 normal slip
6 25.09.2009 – 29.01.2011
0.08 extension
-0.09 left-lateral slip
0.08 reverse slip
Fig. 8 Diagram of the displacements found at K12 with periods of movements (see Table 5).
quiet periods in seismic terms. However, as it is shown in Figure 6a, some earthquakes occurred in theNE from the graben have caused sudden slips at B6.
Some movements of shortening of fault zone andthrusting have been established, coinciding with the GPS measurements on monitoring located on the horst above B6. These movements have confirmed the movement of the horst to W-NW direction (Dobrev et
displacements occur frequently and are closely relatedto local seismicity. They are established on the basisof coincidences between seismic events and sharpmovements. A second type of relationship (alreadyestablished by Dobrev et al., 2003) is of weak earthquakes located NE from B6 (around the contactzone of Predela Fault and Krupnik Fault). The acceleration of movements is during the relatively

3D MONITORING OF ACTIVE FAULT STRUCTURES IN THE KRUPNIK-KRESNA ….
387
quakes in Bulgaria after 1900. Bull. Geophys. Inst., BAS, 12, 79–105, (in Bulgarian).
Dabovski, C., Boyanov, I., Zagorchev, I., Nikolov, T., Sapounov, I., Khrischev, K. and Yanev, Y.: 2002, Structure and Alpine evolution of Bulgaria. Geologica Balcanica, 32, 2–4, 9–15.
Dobrev, N.: 1999, Geological hazard processes in the Simitli graben. PhD Thesis, Geological Institute, BAS, Sofia. 181 pp., (in Bulgarian).
Dobrev, N.: 2005, Registered movements along active faults in SW Bulgaria. Rev. Bulg. Geol. Soc., 66, 1-3, 115–124, (in Bulgarian, English abstract).
Dobrev, N. and Avramova-Tacheva, E.: 2007, 3D Monitoring of active faults and slope movements in Bulgaria included in COST 625 Project. Acta Geodyn. Geomater., 4, No. 1 (145), 39–51.
Dobrev, N. and Petrov P.: 2007, Terrain effects caused by 1904 Krupnik Earthquake. - In: Proc. of International Project "Seismo-Hydrogeological Vulnerability of the Environment and Society in the Balkan Region", Second Meeting, 22-26 November 2006, Sofia.
Dobrev, N., Georgiev, I. and Košťák, B.: 2005,Extensometric and GPS monitoring of recent tectonic movements in the Simitli graben, SW Bulgaria, Geodesy, BAS, 17, 98–107.
Dobrev, N., Glavcheva, R., Frangov, G. and Shanov, S.: 2003, Observation of fault movements in SW Bulgaria and the impact of the local seismicity. Rep. National Conf. On Preventive Works Earthquakes And Landslides, Sofia, 10 Dec. 2003, 75–87, (in Bulgarian).
Dobrev, N.D. and Košťák, B.: 2000, Monitoring tectonic movements in the Simitli Graben, SW Bulgaria. Engineering Geology, Elsevier, 57 (3-4), 179–192.
Ganas A., Shanov S., Drakatos G., Dobrev N., Sboras S., Tsimi C., Frangov G. and Pavlides S.: 2005, Active fault segmentation in southwest Bulgaria and Coulomb stress triggering of the 1904 earthquake sequence. Journal of Geodynamics, 40, 2-3, 316–333.
Georgiev, I., Dimitrov, D., Belijashki, T., Pashova, L., Shanov, S. and Nikolov, G.: 2007, Geodetic constraints on kinematics of southwestern Butgaria from GPS and levelling data. DOI: 10.1144/SP291.7 Geological Society, London, Special Publications 2007, 291, 143–157.
Glavcheva, R.: 2004, State-of-the-art of the historical earthquake investigation in Bulgaria. Annals of Geophysics, 47, 2/3, 705–721.
Glavcheva, R.: 1999, Arguments for removing from the catalogues the strong 1866 earthquake in the Struma valley. Proc. Symp. "Geodynamical investigations, connected with the 1904 earthquakes in the Krupnik-Kresna area”, Blagoevgrad, 77–84, (in Bulgarian).
Gutenberg, B. and Richter, C.: 1954, Seismicity of the Earth and Associated Phenomena. Princeton University Press, 310 pp.
Karnik, V.: 1968, Seismicity of the European area. Publ. Academia Praha, Part 1, 116–122.
Košťák, B. and Avramova-Taceva, E.: 1988, A method for contemporary displacement measurement on a tec-tonic fault. Journal of Geodynamics 10, 115–125.
Košt’ák, B., Cacoń, S., Dobrev, N.D., Avramova-Tačeva, E., Fecker, E., Kopecký, J., Petro, L., Schweitzer, R. and Nikonov, A.A.: 2007, Observations of tectonic microdisplacements in Europe in relation to the Iran 1997 and Turkey 1999 earthquakes. Izvestiya Physics
al., 2005). All this shows that at present the graben isunder pressure from E direction (ie from Pirin Mts).
The observations on the Struma fault zoneundeniably indicate recent activity, although at a lo-wer magnitude than those measured along the Krupnik Fault. This fault zone is less influenced bylocal seismicity. The seismic activity in 2006 and2007 had an influence on both observation points. While the reaction at K5 is expressed by mutual slip(in Y-axis), the movements in K12 are mainly alongthe Z-axis. The fault creep in 2006 at point K12 seemsto be connected with activation of fault structures NWof the graben (Fig. 6c). The SW-NE orientation of theepicenters of the local earthquakes is obvious. In allprobability, point K12 is sensitive mainly toearthquakes located in NW direction, but impact fromearthquakes with epicenters located in Pirin Mts.should not be excluded.
The frequent seismicity N of Simitli graben andthe shallow depth range of a part of the localearthquakes, shows probable active fault structuresparallel to the Krupnik-Gradevo fault system. To bemore complete this study, it is necessary a further search for opportunities to expand the monitoringsystem in the direction north of the graben.
ACKNOWLEDGEMENTS
Thе present study was implemented in theframes of COST 625 Project, and thanking tofinancial support from the Ministry of Education,Youth and Science of Bulgaria within frames ofcooperation projects NZ-1316 and BIn-09/11. The author is grateful for E. Valova, V. Valov, E. Botev, B. Ranguelov, I. Georgiev and D. Dimitrov from theNational Institute of Geophysics, Geodesy andGeography of BAS, and S. Shanov, R. Nankin and P. Ivanov from the Geological Institute of BAS fortheir assistance in maintenance of monitoring. I thank R. Glavcheva and two anonymous reviewers forconstructive reviews and helpful remarks. REFERENCES Ambraseys, N.N.: 2001, The Kresna earthquake of 1904 in
Bulgaria. Annali di Geofisica, 44 (1), 95–117. Avramova-Tacheva, E., Vrablyanski, B. and Košták, B.:
1984, An attempt to detect recent movements alongseismogenic faults. Review of the BulgarianGeological Society, XLV, part 3, 276–288, (in Bulgarian).
Avramova-Tacheva, E.B. and Košťák, B.: 1995, Localthree-dimensional extensiometric measurements forthe determination of displacements in the Krupnikfault zone, Bulgaria. Acta Montana IRSM ASCR, Ser.A, No.8 (97), 87–98.
Botev, E. and Glavcheva, R.: 2003, On seismiccircumstances in Bulgaria during 1997-2002. Rep. National Conf. On Preventive Works at Earthquakes and Landslides, Sofia, 10 Dec. 2003, 56-64, (in Bulgarian).
Christoskov, L. and Grigorova, E.: 1968,. Energetic andspace-time characteristics of the destructive earth-

N. Dobrev
388
Ranguelov, B., Rizhikova, S. and Toteva, T.: 2001, The earthquake (M 7.8) source zone (south-west Bulgaria). Prof.Marin Drinov Publ. House, Bulgarian Academy of Sciences, Sofia, 279 pp.
Shanov, S.: 1993, Medium-time earthquake prediction based on tectonic fault zone displacement data. Acta Montana, Praha, Series A, No.4 (90), 52–62.
Shanov, S.B. and Dobrev, N.D.: 1997, Impact of the seismic processes on the movements along the Kroupnik fault zone (SW Bulgaria). Comptes rendus de l'Academie bulgare des Sciences, 6, 95–98.
Shebalin, N., Karnik, V. and Hadzievski, D. (eds): 1974, Catalogue of earthquakes. UNDP/UNESCO survey seismicity of the Balkan region, Printing Office of the University Cyril and Methodius, Skopje.
Solakov D. and Simeonova S., eds.: 1993, Bulgaria Catalogue of earthquakes. 1981-1990. Geoph. Inst. Bulg. Acad. Sci., 39 pp.
Tranos, M.D., Kachev, V.N. and Mountrakis, D.M.: 2008, Transtensional origin of the NE-SW Simitli basin along the Strouma (Strymon) Lineament, SW Bulgaria. Journal of Geological Society London, 165, 2, 499–510, DOI: 0.1144/0016-76492007-089.
Tranos, M.D., Karakostas, V.G., Papadimitriou, E.E., Kachev, V.N., Ranguelov, B.K., Gospodinov, D.K.: 2006, Major active faults of SW Bulgaria: implications of their geometry, kinematics and the regional active stress regime. Journal of Geological Society, London, Special Publications 260, 671–687.
Watzof, S.: 1902, Tremblements de terre en Bulgarie observés pendant le XIX-ème siècle. Institut météorologique central, Sofia, Imprimerie de l’Etat. 96, (in Bulgarian, Summary in French).
Zagorcev, I.: 1970, On the tectonic movements in a part of South-west Bulgaria. Bull. of the Geophysical Institute, Bulg. Acad. of Sci., Series Geotectonics 19, 141–152, (in Bulgarian).
Zagorchev, I.: 1992, Neotectonic development of the Struma (Kraištid) Lineament, southwest Bulgaria and northern Greece. Geological Magazine, 129, 2, 197–222.
of the Solid Earth, Springer, Moscow, 43, no. 6, 503–516.
Košták, B.: 1991, Combined indicator using moirétechnique. Proc. 3rd Int. Symp. Field Measurements inGeomechanics, Oslo, 53–60.
Kotzev, V., Nakov, R., Burchfiel, B. C., King, R. andReilinger, R.: 2001, GPS study of active tectonics inBulgaria: results from 1996 to 1998. Journal ofGeodynamics 31, 189–200.
Kotzev, V., Nakov, R., Georgiev, Tz., Burchfiel, B.C. andKing, R.W.: 2006, Crustal motion and strainaccumulation in western Bulgaria. Tectonophysics413, 127–145.
Marinova, R. and Zagorchev, I.: 1990, Geological map ofBulgaria, scale 1: 100000. Sheet Razlog. MTS,Troyan.
McClusky, S., Balassanian, S., Barka, A., Demir, C.,Erginav, S., Georgiev, I., Gurkan, O., Hamburger, M.,Hurst, K., Kahle, H., Kastens, K., Kekelidze, G., King,R., Kotzev, V., Lenk, O., Mahmoud, S., Mishin, A.,Nadarya, M., Ouzounis, A., Paradissis, D., Peter, Y.,Prilepin, M., Reilinger, R., Sanli, I., Seeger, H.,Tealeb, A., Toksoz, M.N. and Veis, G.: 2000, GlobalPositioning System constraints on plate kinematicsand dynamics in the eastern Mediterranean andCaucasus. J. Geophys. Res. 105, 5695–5719.
Mercier, J.L.: 1981, Extensional-compressional tectonics associated with the Aegean Arc: Comparison with theAndean Cordillera of south Peru-north Bolivia, Philos.Trans. R. Soc. London, Ser. A, 300, 337–355.
Meyer, B., Armijo, R. and Dimitrov, D.: 2002, Activefaulting in SW Bulgaria: possible surface rupture ofthe 1904 Struma earthquakes. Geophysical J.International, 148 (2), 246–255.
Milev, G., Vrablyanski, B. and Simeonova, R.: 1984, Recentmovements along Kresna Gorge and Krupnik Fault.In: Zagorchev, I., Mankov, S. and Bozhkov, I. (eds),Problems of the geology in SW Bulgaria, Sofia,Technica, 72–79, (in Bulgarian).
Moskovski, S. and Georgiev, A.: 1970, On the Structure ofthe structure of the Kresna Gorge Region. An. SofiaUniv., Geology, 95–112, (in Bulgarian).
Papadimitriou, E, Karakostas, V., Tranos, M., Ranguelov,B. and Gospodinov, D.: 2006, Static stress changesassociated with normal faulting earthquakes in SouthBalkan area. International Journal of Earth Sciences(Geol. Rundsch.), DOI: 10.1007/s00531-006-0139-x.
Ranguelov B., van Eck T., Papadopoulos G., Pavlides S., Shanov S. and Schenk V.: 2000, Initial data for themagnitude reevaluation of the strong earthquakesduring 1904 in Kresna-Kroupnik Zone (SW Bulgaria),Geodynamic Investigations on the Territory ofBulgaria. Investigations of the Krupnik-KresnaRegion Related to the 1904 Earthquake. Reports ofGeodesy. Warsaw University of Technology, No 4(49), 51–55.