Embed Size (px)
Citation preview
HAL Id: hal-00655795https://hal-mines-paristech.archives-ouvertes.fr/hal-00655795
Submitted on 17 May 2013
HAL is a multi-disciplinary open accessarchive for the deposit and dissemination of sci-entific research documents, whether they are pub-lished or not. The documents may come fromteaching and research institutions in France orabroad, or from public or private research centers.
L’archive ouverte pluridisciplinaire HAL, estdestinée au dépôt et à la diffusion de documentsscientifiques de niveau recherche, publiés ou non,émanant des établissements d’enseignement et derecherche français ou étrangers, des laboratoirespublics ou privés.
3D MHD modelling of low current-high voltage dcplasma torch under restrike mode
Alexandre Lebouvier, Clarisse Delalondre, François Fresnet, FrançoisCauneau, Laurent Fulcheri
To cite this version:Alexandre Lebouvier, Clarisse Delalondre, François Fresnet, François Cauneau, Laurent Fulcheri. 3DMHD modelling of low current-high voltage dc plasma torch under restrike mode. Journal of PhysicsD: Applied Physics, IOP Publishing, 2012, 45 (2), pp.25204-25212. �10.1088/0022-3727/45/2/025204�.�hal-00655795�

3D MHD modelling of the glidarc behaviour of a low current – high voltage DC plasma torch
Journal of Physics D: Applied Physics
1/13
3D MHD modelling of low current – high voltage DC plasma
torch under restrike mode
A Lebouvier1,2
, C Delalondre3, F Fresnet
2, F Cauneau
1 and L Fulcheri
1,4
1Center for Energy and Processes – MINES ParisTech, Rue Claude Daunesse, 06904
Sophia Antipolis, France 2Technocentre Renault, DREAM/DELT’A, 78288 Guyancourt, France.
3EDF R&D, MFEE Department, 6 quai Watier, 78400 Chatou, France.
E-mail: [email protected]
Abstract. We present in this paper a MHD modelling of the gliding arc behaviour of a DC
plasma torch operating with air under low current and high voltage conditions. The low current
leads to instabilities and difficulties to simulate the process because the magnetic field is not
sufficient to constrict the arc. The model is 3D, time-dependent and the MHD equations are
solved in using CFD software Code_Saturne®
. Although the arc is definitively non-LTE, the
LTE assumption is considered as a first approach. The injection of air is tangential. A hot gas
channel reattachment model has been used to simulate the restriking process of the arc root.
After the description of the model, the most appropriate electrical voltage breakdown
parameter has been selected in comparing with experimental results. A typical operating point
is then studied in details and shows the helical shape of the arc discharge in the nozzle.
Finally, the mass flow rate and the current have been varied in the range 0.16 – 0.5 gs-1
and 100
– 300 mA, respectively, corresponding to typical glidarc operating points of our experimental
plasma torch. The model shows good consistency with experimental data in terms of: global
behaviour, arc length, mean voltage and glidarc frequency.
1. Introduction
The non-thermal atmospheric pressure discharges take more and more interest due to their potential
applications in many domains such as: hydrogen production [1], gas treatment, surface finishing,
ozone generation [2], etc. In order to improve the processes, in scope to industrialization, the physical
and chemical mechanisms occurring in this type of torch have to be understood. These phenomena are
complex and the literature on magnetohydrodynamic (MHD) modelling of atmospheric pressure direct
current (DC) plasma torch operating at low current is very poor. At low current, the magnetic field is
very low and does not constrict sufficiently the arc column to stabilize it and leads to physical
instabilities which are difficult to simulate.
For several years, the Center for Energy and Processes (CEP) study the plasma-assisted conversion of
heavy hydrocarbons like diesel fuel [3], gasoline [4], ethanol [5], both experimentally and numerically
[6-8]. More recently, the CEP has developed a non-reactive MHD model of his low current – high
voltage rotating arc reactor to investigate the quasi-continuous behaviour of the arc discharge
operating with air [9]. However, in rotating arc reactors, the arc behaviour can be similar to a gliding
arc reactor [10] in certain conditions of current and mass flow rate due to the stretching of the arc
column.
The glidarc is characterized by the restriking of the arc.
It often, but not always, corresponds to a shortening of the arc: the distance between the anode and the
cathodic arc root becomes shorter and thermodynamically more favourable. This phenomenon appears
when the arc voltage reaches a threshold set by the intrinsic characteristics of: the arc, the flow, the
4To whom correspondence should be addressed: [email protected]

3D MHD modelling of the glidarc behaviour of a low current – high voltage DC plasma torch
Journal of Physics D: Applied Physics
2/13
geometry and/or the power source. To mimic this behaviour, the restrike mode is generally simulated
by a short circuit model. Different models have been proposed to simulate the short circuit. Trelles et
al [11] have developed a conducting channel reattachment model and Baudry et al [12-14] a hot gas
reattachment model. Both models are based on the overcome of a specific value of the electric field, in
the direction normal to the anode surface in the first model, and in the arc fringes in the second model.
Trelles et al imposes a high electrical conductivity in a cylindrical channel which connects the arc to
the anode surface. The second model will be detailed in the next section.
The aim of this study is to develop a numerical model of a non-thermal plasma torch under glidarc
mode and to compare the main characteristics of the arc with experimental data. In the first part of this
paper, the main characteristics of the model are described. In the second part, the most appropriate
electric field threshold has been determined in comparing with experimental data obtained with the
experimental test bench developed in ref. [3]. The results are detailed for a reference case and then the
influence of the mass flow rate and the electric current are investigated.
2. Mathematical model
The model presented below has already been detailed in ref. [9] for the study of the quasi-continuous
mode of the low current plasma torch with an axial injection. We will emphasize in this paper the
main characteristics of the model. Comparing with the previous MHD model, this model has been
improved with an inlet vortex profile and a restriking model.
2.1. Assumptions
The three-dimensional model studied is based on the following main assumptions:
‐ The plasma is considered as a single continuous fluid (Air) and at Local Thermodynamic
Equilibrium (LTE).
‐ The gas is treated as incompressible and expandable. The thermodynamic properties and
transport coefficients depend only on the temperature, the pressure effects can be neglected.
‐ The gas flow is laminar and time-dependent.
‐ Gravitational effects are taken into account (-x direction).
‐ As the torch is not water-cooled, the thermal losses are neglected at the electrodes.
The maximum Reynolds number in a cell of the torch is 2500. Inside the plasma, with the high
temperatures at stake, the flow can be considered laminar. In using the method defined by Sinkevic et
al. [15], the Reynolds number varies from 800 close to the inlet to 400 close to the cathode outlet.
These Reynolds number values are in line with the results of Freton et al. [16].
The LTE assumption is commonly assumed for high power density plasmas. This hypothesis is a
strong assumption, which has been proven to imply significant discrepancies in the arc behaviour and
characteristics e.g. in the arc voltage drop [11]. For low current plasma, the non-equilibrium effects
are even more significant and this hypothesis is generally not correct. Nevertheless, this assumption
has been considered in a preliminary phase to overcome the numerical issues linked with the low
current modelling. The objective of this study was to get the general behaviour of the plasma under
restrike mode. It would obviously be interesting to develop a more complex NLTE model to take into
account the nonequilibrium effects.
2.2. Governing equations
Considering the above-mentioned assumptions, the time-dependent fluid conservation set of equations
can be written as follows:
Mass conservation
0)(
v
t
(1)
where and v
are the mass density and the velocity vector.
Energy conservation equation
3D MHD modelling of the glidarc behaviour of a low current – high voltage DC plasma torch
Journal of Physics D: Applied Physics
3/13
rad
p
SEJhC
vht
h
(2)
where h, , Cp, J
, E
and Srad are the gas enthalpy, the thermal conductivity, the specific heat, the
current density vector, the electric field vector and the radiation losses, respectively. The term Srad is a
radiation source term depending only on temperature and calculated from the net emission coefficient
at atmospheric pressure taken from ref. [17].
Momentum equation
gBJpvv
t
v
)(
(3)
Where
, B
and g
are the shear stress tensor, the magnetic field vector and the gravity acceleration.
The term BJ
represents the Lorentz’ forces acting on the flow. Assuming the Ohm’s law
approximation and the global neutrality, the set of Maxwell’s equations is defined by the following
equations:
EJ
(4)
E (5)
0 = ) (
(6)
A =
B (7)
J = ) ( 0
A (8)
where , A
and 0 are the electrical conductivity, the vector potential and the vacuum permeability,
respectively. h, , Cp, , and the dynamic viscosity for air depend on temperature and are taken
from ref. [18] at atmospheric pressure. The pressure variations in the torch are lower than 150 Pa
around the atmospheric pressure, so the gas flow is considered incompressible and the pressure effects
can be neglected without introducing significant errors.
The coupled Navier-Stokes and Maxwell’s equations are solved using the CFD software
Code_Saturne® V2.0.1 [19], developed by EDF R&D and based on the SIMPLEC algorithm and a fully
implicit solution of equations. The time step is set to 10 s. The calculation have been realized on a
Dell PowerEdge R510 server for 3000 time steps corresponding to a numerical time of 30 ms. The
calculation lasts about 30 hours on 4 processors.
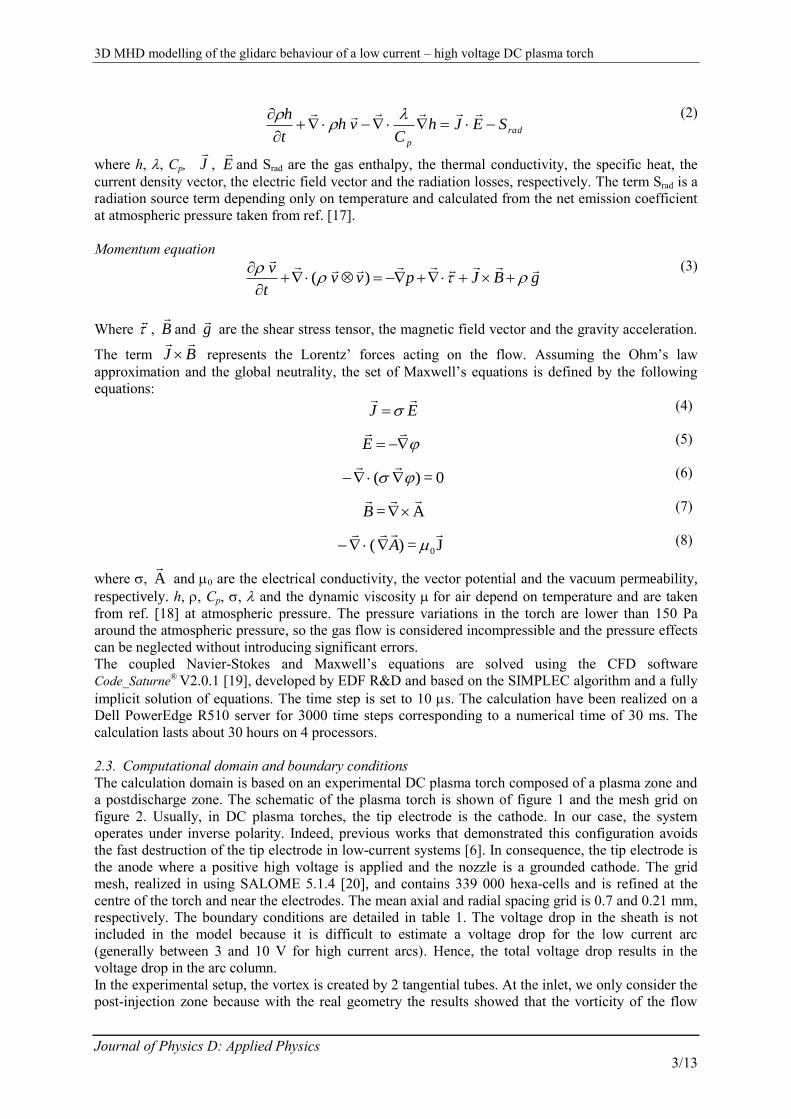
2.3. Computational domain and boundary conditions
The calculation domain is based on an experimental DC plasma torch composed of a plasma zone and
a postdischarge zone. The schematic of the plasma torch is shown of figure 1 and the mesh grid on
figure 2. Usually, in DC plasma torches, the tip electrode is the cathode. In our case, the system
operates under inverse polarity. Indeed, previous works that demonstrated this configuration avoids
the fast destruction of the tip electrode in low-current systems [6]. In consequence, the tip electrode is
the anode where a positive high voltage is applied and the nozzle is a grounded cathode. The grid
mesh, realized in using SALOME 5.1.4 [20], and contains 339 000 hexa-cells and is refined at the
centre of the torch and near the electrodes. The mean axial and radial spacing grid is 0.7 and 0.21 mm,
respectively. The boundary conditions are detailed in table 1. The voltage drop in the sheath is not
included in the model because it is difficult to estimate a voltage drop for the low current arc
(generally between 3 and 10 V for high current arcs). Hence, the total voltage drop results in the
voltage drop in the arc column.
In the experimental setup, the vortex is created by 2 tangential tubes. At the inlet, we only consider the
post-injection zone because with the real geometry the results showed that the vorticity of the flow
3D MHD modelling of the glidarc behaviour of a low current – high voltage DC plasma torch
Journal of Physics D: Applied Physics
4/13
was too strong and leads to a very disturbed plasma arc and the extinction of the arc. A vortex has
been implemented in the post-injection zone with an axisymetrical parabolic profile. The ratio between
tangential and axial velocities is set to 0.4 in the whole study which is the maximum vorticity allowing
to obtain the convergence of the model. Experimentally, the ratio is close to 1.5.
An initial hot channel is defined at the first time step with a low inflow for 50 iterations. Then, a
velocity slope is applied for the following 150 time steps to reach the nominal mass flow.
Figure 1. Schematic of the plasma torch.
Figure 2. Computational grid of the plasma torch.
Table 1. Boundary conditions of the 3D MHD model.
Inlet Outlet Walls Anode Cathode
Vi (ms-1
) Vortex profile 0
n
Vi 0 0 0
T (K) 600 0
n
T 0
n
T 0
n
T 0
n
T
φ (V) 0
n
0
n
0
n
φ(n)
0
p (Pa) 0
z
p 1.013 × 10
5 0
n
p 0
n
p 0
n
p
Ai (T.m) 0
n
Ai 0 0
n
Ai 0
n
Ai 0
n
Ai
2.4. Arc reattachment model
We have used for this study the hot gas column reattachment model developed by Baudry et al [12-
14]. The stretching of the arc column leads to an increase of the voltage drop, and therefore the electric
field, between the arc column fringes and the cathode surface. The breakdown occurs when the
electric field overcomes a specified threshold value of the electric field, named Eb, in a cell of the
computational mesh. If several cells are detected, the cell where the electric field is the highest is
selected. When the critical value Eb is reached in the boundary layer of the arc column, the boundary
conditions on the cathode potential are modified to force the new arc root to connect to the closest
point of the cathode. The short circuit is imposed in creating a 1.6 mm diameter 6000 K channel for 30
time steps between the arc column fringe and the cathode wall at the location where the electric field
3D MHD modelling of the glidarc behaviour of a low current – high voltage DC plasma torch
Journal of Physics D: Applied Physics
5/13
threshold value has been overcome. This temperature corresponds to an electrical conductivity of 95.4
S.m-1
. The parameter Eb has a significant influence on both the glidarc frequency and the voltage drop
amplitude [21]. In our case, the breakdown electric field has been evaluated from experimental data. In
order to hale the new arc root to attach at the breakdown location, a zero potential is imposed at the
cathode 0.8 mm around the breakdown location, and a null-flux elsewhere. The new cathodic arc root
is authorized to be attached between 2 mm downstream the anode tip and 1 mm upstream the cathode
exit. This allows getting the hot channel fully inside the cathode and not interfering with the current
readjustment. The anodic arc root remains always attached to the centre of the anode.
3. Results and discussion
For this study, we have focused on the comparison with experimental data. The main parameters used
to compare the model and the experiments are the mean voltage and the glidarc appearance frequency.
Moreover, experimental photographs allow comparing the plasma plume length.
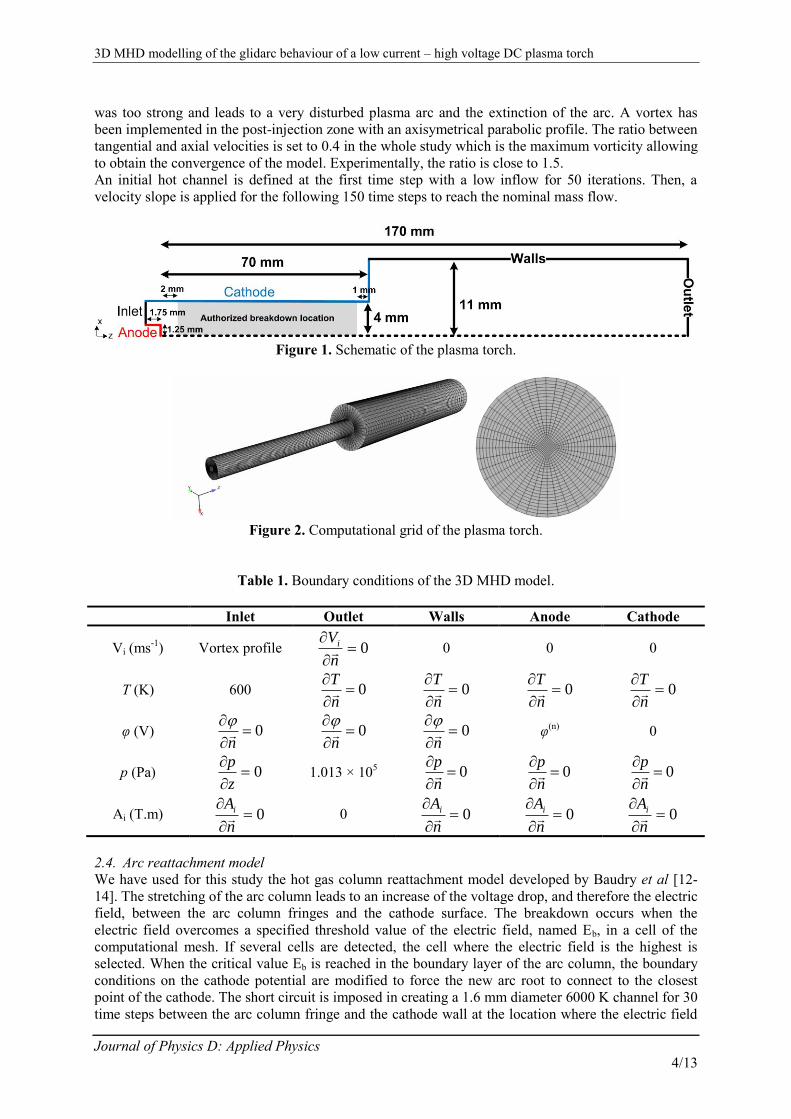
The study has been realized in a typical range of mass flow rate and current allowing the appearance
of the glidarc behaviour of the arc. This range is showed on figure 3. The quasi-continuous regime is
similar to the takeover mode of high current torch defined by a quasi-periodic fluctuation of the
voltage drop and the movement of the arc root. The glidarc regime, appearing with low current plasma
torches, has a similar behaviour of the restrike mode of high current plasma torches which is
characterized by high voltage drop amplitude, voltage fluctuations and an unstable arc motion [21].
The arc initiates at the shortest interelectrode distance where the electric field is the highest. Then, the
arc root slides on the cathode, blown by the inlet flow until it reached a certain length and
extinguishes. The extinction of the arc is followed by a short circuit upstream where the arc
attachment is more favourable. The filamentary domain corresponds to a streamer-like discharge
remaining located close to the anode and defined by high frequency (> 2 kHz) [4].
In the parametric study, the current has been varied from 100 to 300 mA and the mass flow rate from
0.16 to 0.5 gs-1
. If not otherwise specified, the reference case is used: I= 250 mA, Qair = 0.32 gs-1
, Eb =
3 kV.mm-1
, S = 0.4.
Figure 3. Arc transitions and range of study based on experimental data. (■) Quasi-continuous –
glidarc transition. (•) Glidarc – filamentary transition.
3.1. Determination of Eb value
The Paschen’ law in air at atmospheric pressure and room temperature estimates the order of
magnitude of Eb at 3.6 kV.mm-1
[22]. At 600 K, we can estimate the breakdown voltage to 2.5 kV.mm-
1. The Paschen’ law is determined for a static system, without flow, in a plate-plate configuration in a
dry air. In a real case, the breakdown voltage can vary significantly with the flow rate, the geometry,
the humidity and the electrodes. In order to determine the most appropriate Eb parameter, an
investigation has been realized on this parameter and then compared to the experimental data. For I =
250 mA and Qair = 0.32 gs-1
, the experimental mean voltage is 1550 V and the glidarc frequency 156

3D MHD modelling of the glidarc behaviour of a low current – high voltage DC plasma torch
Journal of Physics D: Applied Physics
6/13
Hz. We can observe on figure 4 and figure 5 that an Eb value of 3.106 V.m
-1 is the most appropriate for
our study with a mean voltage drop of 1600 V and a glidarc frequency of 202 Hz. This value of Eb will
be used in the rest of the paper. The value of Eb can probably be dependent of the mesh quality and
will be investigated in a further study. At this stage of development, we cannot match the exact glidarc
frequency. This is probably a consequence of the non-equilibrium effects and the absence of anodic
and cathodic sheaths.
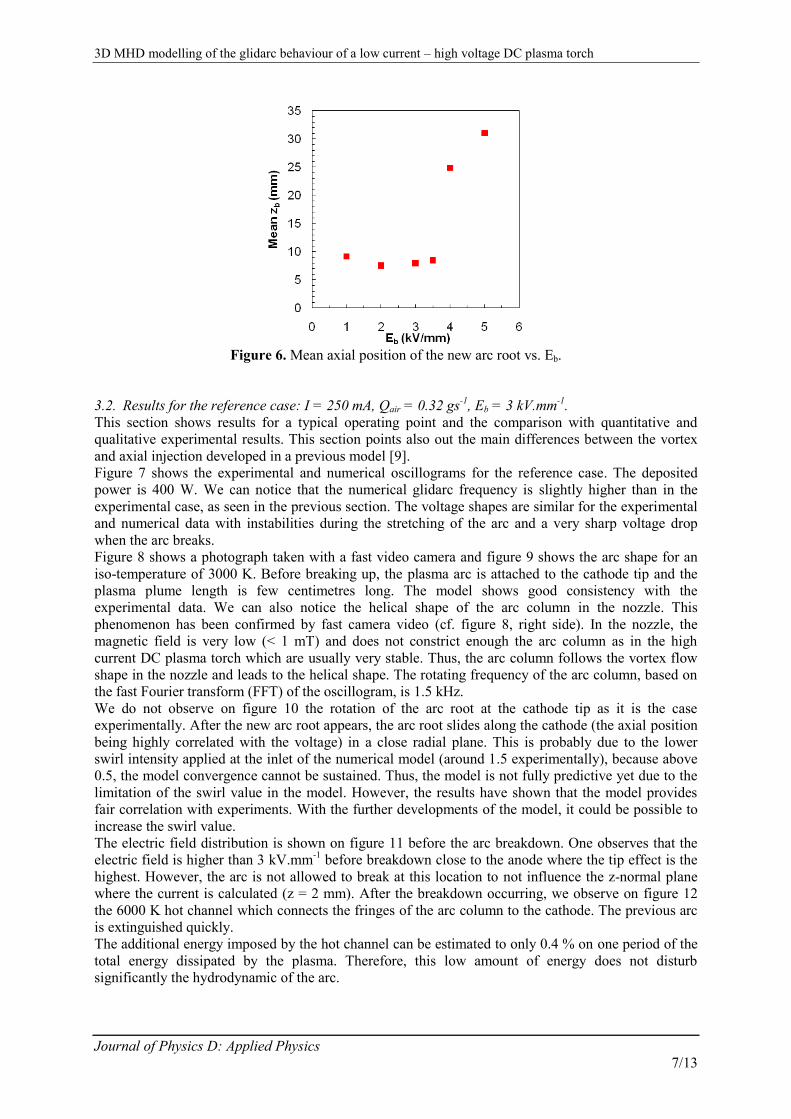
We can observe on both figures that the higher the Eb, the higher the mean voltage, but the glidarc
frequency passes through a minimum value at Eb = 3 kV.mm-1
. Indeed, below 3 kV.mm-1
, the higher
Eb, the lower the glidarc frequency, because the arc needs more time to reach the critical electric field
value. Above 3 kV.mm-1
, another phenomenon appears. The new arc root attachment is more
downstream as shown on figure 6. The breakdown no longer appears close to the tip electrode but in
the middle of the nozzle. As a result, the voltage drop is lower, the new breakdown appears sooner,
and the mean voltage drop is higher. This highlights the fact that the arc attachment is not necessarily
appearing at the shortest interelectrode distance but can depend on the arc shape or charge
accumulation, for example.
Figure 4. Influence of Eb on glidarc frequency. I = 250 mA. Qair = 0.32 g.s
-1.
Figure 5. Influence of Eb on mean voltage drop.
3D MHD modelling of the glidarc behaviour of a low current – high voltage DC plasma torch
Journal of Physics D: Applied Physics
7/13
Figure 6. Mean axial position of the new arc root vs. Eb.
3.2. Results for the reference case: I = 250 mA, Qair = 0.32 gs-1
, Eb = 3 kV.mm-1
.
This section shows results for a typical operating point and the comparison with quantitative and
qualitative experimental results. This section points also out the main differences between the vortex
and axial injection developed in a previous model [9].
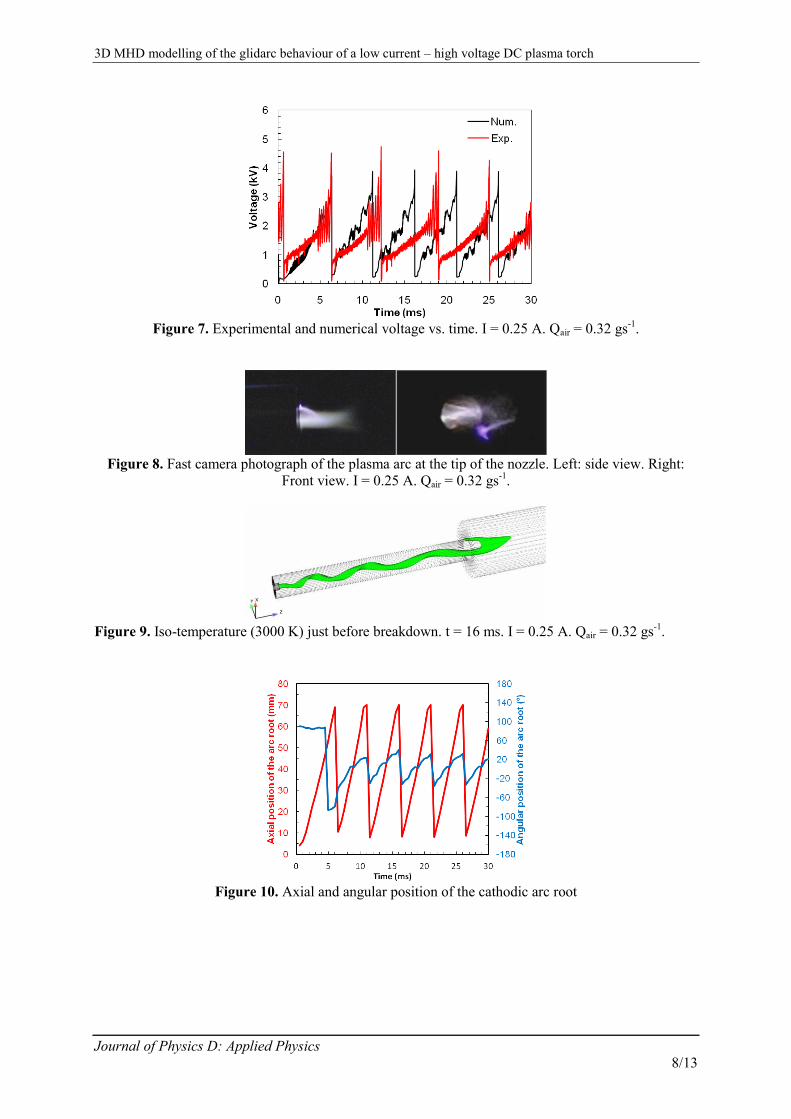
Figure 7 shows the experimental and numerical oscillograms for the reference case. The deposited
power is 400 W. We can notice that the numerical glidarc frequency is slightly higher than in the
experimental case, as seen in the previous section. The voltage shapes are similar for the experimental
and numerical data with instabilities during the stretching of the arc and a very sharp voltage drop
when the arc breaks.
Figure 8 shows a photograph taken with a fast video camera and figure 9 shows the arc shape for an
iso-temperature of 3000 K. Before breaking up, the plasma arc is attached to the cathode tip and the
plasma plume length is few centimetres long. The model shows good consistency with the
experimental data. We can also notice the helical shape of the arc column in the nozzle. This
phenomenon has been confirmed by fast camera video (cf. figure 8, right side). In the nozzle, the
magnetic field is very low (< 1 mT) and does not constrict enough the arc column as in the high
current DC plasma torch which are usually very stable. Thus, the arc column follows the vortex flow
shape in the nozzle and leads to the helical shape. The rotating frequency of the arc column, based on
the fast Fourier transform (FFT) of the oscillogram, is 1.5 kHz.
We do not observe on figure 10 the rotation of the arc root at the cathode tip as it is the case
experimentally. After the new arc root appears, the arc root slides along the cathode (the axial position
being highly correlated with the voltage) in a close radial plane. This is probably due to the lower
swirl intensity applied at the inlet of the numerical model (around 1.5 experimentally), because above
0.5, the model convergence cannot be sustained. Thus, the model is not fully predictive yet due to the
limitation of the swirl value in the model. However, the results have shown that the model provides
fair correlation with experiments. With the further developments of the model, it could be possible to
increase the swirl value.
The electric field distribution is shown on figure 11 before the arc breakdown. One observes that the
electric field is higher than 3 kV.mm-1
before breakdown close to the anode where the tip effect is the
highest. However, the arc is not allowed to break at this location to not influence the z-normal plane
where the current is calculated (z = 2 mm). After the breakdown occurring, we observe on figure 12
the 6000 K hot channel which connects the fringes of the arc column to the cathode. The previous arc
is extinguished quickly.
The additional energy imposed by the hot channel can be estimated to only 0.4 % on one period of the
total energy dissipated by the plasma. Therefore, this low amount of energy does not disturb
significantly the hydrodynamic of the arc.
3D MHD modelling of the glidarc behaviour of a low current – high voltage DC plasma torch
Journal of Physics D: Applied Physics
8/13
Figure 7. Experimental and numerical voltage vs. time. I = 0.25 A. Qair = 0.32 gs
-1.
Figure 8. Fast camera photograph of the plasma arc at the tip of the nozzle. Left: side view. Right:
Front view. I = 0.25 A. Qair = 0.32 gs-1
.
Figure 9. Iso-temperature (3000 K) just before breakdown. t = 16 ms. I = 0.25 A. Qair = 0.32 gs
-1.
Figure 10. Axial and angular position of the cathodic arc root

3D MHD modelling of the glidarc behaviour of a low current – high voltage DC plasma torch
Journal of Physics D: Applied Physics
9/13
Figure 11. Electric field distribution before breakdown in a radial cross section.
Figure 12. Iso-volume (2000 to 6000 K) coloured by temperature showing a new arc attachment just
after the 30 time steps where the hot channel is imposed.
3.3. Influence of the current
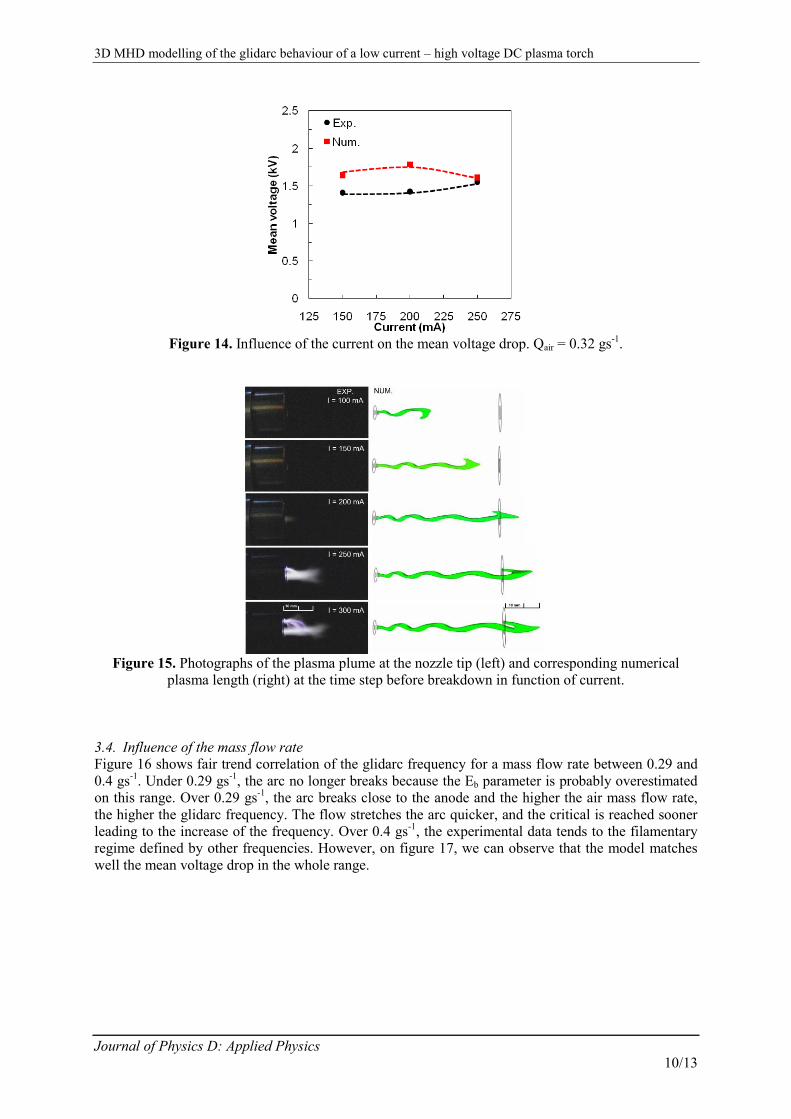
The influence of the low current applied is shown on figure 13 and figure 14 in terms of glidarc
frequency and mean voltage drop. Concerning the glidarc frequency, the results are very close from
experimental data and the trends are similar under 250 mA. For 300 mA, the point does not follow the
experimental trend. For this specific point, the mean axial position of breakdown is higher than the
other cases (13 mm). We can observe experimentally that the higher the current, the lower the glidarc
frequency. For I = 300 mA, the experimental glidarc frequency is very low because we are close to the
glidarc – quasi-continuous transition. The model shows a fair estimation of the mean voltage drop.
On figure 15, the experimental photographs show that under 200 mA, the arc plume stays in the
nozzle. For I = 200 mA, the arc plume goes out slightly like in the model and over 200 mA, the arc
plume is around 20 mm long. The model estimates pretty well the arc length. For I = 300 mA, we
observe experimentally that there is a unique arc root but several streamer-like arcs connecting the arc
root to the arc column, which cannot be observed in the model.
Figure 13. Influence of the electrical current on the glidarc frequency. Qair = 0.32 gs
-1.
3D MHD modelling of the glidarc behaviour of a low current – high voltage DC plasma torch
Journal of Physics D: Applied Physics
10/13
Figure 14. Influence of the current on the mean voltage drop. Qair = 0.32 gs
-1.
Figure 15. Photographs of the plasma plume at the nozzle tip (left) and corresponding numerical
plasma length (right) at the time step before breakdown in function of current.
3.4. Influence of the mass flow rate
Figure 16 shows fair trend correlation of the glidarc frequency for a mass flow rate between 0.29 and
0.4 gs-1
. Under 0.29 gs-1
, the arc no longer breaks because the Eb parameter is probably overestimated
on this range. Over 0.29 gs-1
, the arc breaks close to the anode and the higher the air mass flow rate,
the higher the glidarc frequency. The flow stretches the arc quicker, and the critical is reached sooner
leading to the increase of the frequency. Over 0.4 gs-1
, the experimental data tends to the filamentary
regime defined by other frequencies. However, on figure 17, we can observe that the model matches
well the mean voltage drop in the whole range.

3D MHD modelling of the glidarc behaviour of a low current – high voltage DC plasma torch
Journal of Physics D: Applied Physics
11/13
Figure 16. Influence of the air mass flow rate on the glidarc frequency. I = 250 mA.
Figure 17. Influence of the air mass flow rate on the mean voltage drop. I = 250 mA.
Looking at the mean voltage trend vs. mass flow rate, we can infer that the plasma plume length
decreases with the mass flow rate. This is confirmed by experimental photographs shown on figure 18.
This phenomenon is well-known and is due to the Reynolds number which increases with the flow
velocity. The laminar plasma discharges are usually longer than transient or turbulent ones. We also
observe that for low mass flow rates, the plasma column is very stable does not have a helical shape.
Figure 18. Photographs of the plasma plume at the nozzle tip (left) and corresponding plasma length
(right) at the time step before breakdown in function of the air mass flow rate.

3D MHD modelling of the glidarc behaviour of a low current – high voltage DC plasma torch
Journal of Physics D: Applied Physics
12/13
Even if the LTE is assumed, the model shows good agreement because the Eb parameter is calibrated
on experimental data. With a non-equilibrium model, this value of Eb will probably be different. Thus,
the Eb parameter can be used as a « fitting » parameter.
4. Conclusions and perspectives
A previous MHD model operating with a very low current has been modified to take into account the
inlet vortex profile and the restrike mode behaviour. First, a critical breakdown electric field of 3
kV.mm-1
supplies good correlation with experimental data in terms of mean voltage drop and glidarc
frequency. For a reference case (I = 250 mA, Qair = 0.32 gs-1
), the results show a helical shape of the
arc column due to the vortex injection. The rotation frequency of the arc column is around 1500 Hz
and leads to instabilities in the numerical voltage oscillograms. Fast camera photograph have
confirmed the helical shape of the arc column inside the nozzle. The magnetic field is too low to
constrict the arc column which follows the flow shape. The model estimates well the plasma plume
length.
Then, a parametric study has been realized on current and mass flow rate and shows fair correlation
with experimental data for the predicted glidarc frequency, mean voltage drop and arc length.
In a further stage of development of our model, a non-LTE will be considered to simulate the non-
equilibrium effects in low current DC plasma torches. It has been demonstrated by Trelles et al that
with a non-LTE, no reattachment process is needed to simulate the steady and/or takeover mode [11]
but it will be required for the restrike mode to get more accurate results [21].
Acknowledgments
The authors gratefully acknowledge Renault for their financial support and EDF R&D for their
technical support.
References
[1] Petitpas G, Rollier J D, Darmon A, Gonzalez-Aguilar J, Metkemeijer R and Fulcheri L 2007 A
comparative study of non-thermal plasma assisted reforming technologies Int. J. Hydrogen Energy 32
2848–67
[2] Fridman A, Chirokov A and Gutsol A 2005 Non-thermal atmospheric pressure discharges J. Phys.
D, Appl. Phys. 38 R1
[3] Lebouvier A, Fresnet F, Fabry F, Boch V, Rohani V, Cauneau F and Fulcheri L 2011 Exhaust gas
fuel reforming of Diesel fuel by non-thermal arc discharge for NOx trap regeneration application
Energy Fuels 25 1034–44
[4] Rollier J D, Gonzalez-Aguilar J, Petitpas G, Darmon A, Fulcheri L and Metkemeijer R 2008
Experimental Study on Gasoline Reforming Assisted by Nonthermal Arc Discharge Energy Fuels 22
556–60
[5] Petitpas G, Gonzalez-Aguilar J, Darmon A and Fulcheri L 2010 Ethanol and E85 reforming
assisted by a non-thermal arc discharge Energy Fuels 24 2607–13
[6] Rollier J D, Petitpas G, Gonzalez-Aguilar J, Darmon A, Fulcheri L and R. Metkemeijer 2008
Thermodynamics and kinetics analysis of gasoline reforming assisted by arc discharge Energy Fuels
22 1888–93
[7] Gonzalez-Aguilar J, Petitpas G, Lebouvier A, Rollier J D, Darmon A and Fulcheri L 2009 Three
stages modeling of n-octane reforming assisted by a nonthermal arc discharge Energy Fuels 23 4931–
6 [8] Lebouvier A, Cauneau F and Fulcheri L 2011 2D axisymmetric coupled computational fluid
dynamics–kinetics modeling of a nonthermal arc plasma torch for diesel fuel reforming Energy Fuels
accepted for publication
[9] Lebouvier A, Delalondre C, Fresnet F, Boch V, Rohani V, Cauneau F and Fulcheri L 2011 Three-
dimensional unsteady MHD modeling of a low current - high voltage non-transferred DC plasma torch
Operating with air IEEE Trans. Plasma Sci. 39 1889-99 [10] Czernichowski A 1994 Gliding arc - Applications to engineering and environment control Pure
Appl. Chem. 66 1301–10
3D MHD modelling of the glidarc behaviour of a low current – high voltage DC plasma torch
Journal of Physics D: Applied Physics
13/13
[11] Trelles J P, Heberlein J V R and Pfender E 2007 Non-equilibrium modelling of arc plasma
torches J. Phys. D, Appl. Phys. 40 5937–52
[12] Moreau E, Chazelas C, Mariaux G and Vardelle A 2006 Modeling the restrike mode operation of
a DC plasma spray torch J. Therm. Spray Tech. 15 524–30
[13] Baudry C, Vardelle A and Mariaux G 2005 Numerical modeling of a DC non-transferred plasma
torch: Movement of the arc anode attachment and resulting anode erosion High Temp. Mat. Proc. 9 1–
15
[14] Chazelas C, Moreau E, Mariaux G and Vardelle A 2006 Numerical modelling of arc behaviour in
a DC plasma torch High Temp. Mat. Proc. 10 393–406
[15] Sinkevich O A, Chikunov S E, Glazkov V V and Isakaev E Kh 2002 Boundaries of stability of
the plasma flow in cylindrical channels TPP 7 Thermal Plasma Processes (Strasbourg, France) (Under
press in the Progress in Plasma Processing of Materials 2002 published by Begell house, Inc, New
York)
[16] Freton P, Gonzalez J J, Camy Peyret F and Gleizes A 2003 Complementary experimental and
theoretical approaches to the determination of the plasma characteristics in a cutting plasma torch J.
Phys. D, Appl. Phys. 36 1269–83
[17] Naghizadeh-Kashani Y, Cressault Y and Gleizes A 2002 Net emission coefficient of air thermal
plasmas J. Phys. D, Appl. Phys. 35 2925–34
[18] D’Angola A, Colonna G, Gorse C and Capitelli M 2008 Thermodynamic and transport properties
in equilibrium air plasmas in a wide pressure and temperature range Eur. Phys. J. D 46 129–50
[19] Archambeau F, Mechitoua N and Sakiz M, 2004 Code Saturne: a finite volume code for the
computation of turbulent incompressible flows International Journal on Finite Volumes 1
[20] http://www.salome-platform.org/
[21] Trelles J P, Chazelas C, Vardelle A and Heberlein J V R 2009 Arc Plasma Torch Modeling J.
Therm. Spray Tech. 18 728–52
[22] Naidu M S and Kamaraju V 1995 High voltage engineering, 2nd
Edition, MacGraw Hill


![CHAP04. PLASMA DISPLAY PANEL - …121C771E4C273B84482… · PLASMA DISPLAY PANEL ... ¾역학적: 전자기력의발생[MHD 발전, plasma propulsion] ¾화학적: ... PDP의효율의개선방향](https://img.dokumen.tips/doc/110x75/5b8e444b09d3f2a0138d3e3c/chap04-plasma-display-panel-121c771e4c273b84482-plasma-display-panel-.jpg)