Embed Size (px)
Citation preview
Research Journal of Applied Sciences, Engineering and Technology 3(4): 344-355, 2011ISSN: 2040-7467© Maxwell Scientific Organization, 2011Received: March 16, 2011 Accepted: April 16, 2011 Published: April 20, 2011
Corresponding Author: Baydaa Hussain Maula, School of Civil Engineering, Harbin Institute of Technology, China344
3D FEM Numerical Simulation of Seismic Pile-supported Bridge StructureReaction in Liquefying Ground
Baydaa Hussain Maula, Ling XianZhang, Tang Liang and Xu PengjuSchool of Civil Engineering, Harbin Institute of Technology, China
Abstract: This study examines the establishment of liquefied ground pile-soil-bridge seismic interactionanalysis of three-dimensional finite element analysis method for the simulation of liquefied ground shakingtable test of pile-soil seismic interaction analysis, undertake OpenSees finite element based numericalsimulation platform, for the shaking table test based on two-phase saturated porous media, Comparativenumerical and experimental results, detailed test pile dynamic response of bridge structure and dynamicproperties, especially liquefaction pore pressure, liquefaction of pile foundation and the dynamic response ofthe free field. Finite element method can reasonably predict the site of pore pressure, dynamic response; despitethe conventional beam element simulation of pile, pile dynamic response can still accurately simulated.
Key words: Pile-soil-interaction, openseespl, liquefaction, numerical method, experimental method, shakingtable test
INTRODUCTION
Bridge foundation liquefaction response seismicshaking table test exists time-consuming, costly and othershortcomings. Therefore, the numerical simulation canwell be considered because of the effects of soil bodyfluids, soil nonlinearity and pile - soil relativedisplacement caused by the near-field pore pressureresponse, is widely used in liquefied ground pile - theissue of land seismic interaction analysis. Shaking tabletest and finite element analysis has been carried outcombining post liquefaction-land seismic interactionanalysis is an effective means. Three-dimensional shakingtable test has obvious geometric features to simplify theanalysis of two-dimensional problem will undoubtedlybring great error; this issue has aroused widespreadacademic attention. Therefore, the University ofCalifornia, Berkeley, developed an object-oriented goal-oriented finite element Earthquake EngineeringSimulation Platform OpenSees (Yang et al., 2004). Forshaking table test the establishment of numerical analysismodel for the liquefied ground pile - soil seismicinteraction analysis, based on Biot dynamic theory, usingup the finite element form of the formula, consider thedeformation of water and soil particles relationshipbetween the simulation for the two-phase saturatedmedium sand, the choice of multi-yield surfaceconstitutive model for simulation of plastic clay, sand,piles using beam - column element simulation, pile-soil
interaction volume effect can be considered by the rigidconnection handling, piles of liquefied ground - landseismic interaction analysis of three-dimensional finiteelement numerical simulation method, (Biot andWillis, 1957).
NUMERICAL MODEL METHOD APPROACHFOR SATURATED SAND
First described Biot effective stress soil and soil-water coupling concept, the mathematical formula ofsaturated dynamic characteristics of porous mediastatements, made pursuant to a variety of time-domainanalysis of finite element method (Biot and Willis, 1957).Simplified two-phase saturated sand material, based ondifferent assumptions and by the finite element methodnumerical dispersion formula Biot theory as a simplifiedform of three major, (Elgamal, 2007; Smith, 1993),specifically for: up form, uU or uw form and upU form.Where, u is the displacement of soil particles, p is porepressure, U is the displacement of water, w is inaccordance with Darcy's law to determine the averagerelative displacement. up form of neglect, the averagerelative acceleration of the water, but experience showsthat this form of numerical simulation well static,consolidation and most of the dynamic load (lowfrequency) input dynamic properties of saturated sandunder the (Zienkiewicz et al., 1990). up in the form of themain methods for solving fully implicit numerical method
Res. J. Appl. Sci. Eng. Technol., 3(4): 344-355, 2011
345
(Parra, 1996), explicit up implicit method(Zienkiewicz et al., 1987) and implicit-implicit alternatingmethod (Cervera et al., 2006). Caught up in the form ofsoil particles and pore pressure changes, is the simplestform. This form of neglect of pore water and soildifferences in particle acceleration, the compressibility ofwater. This study established in the form of saturated sandusing up a finite element numerical model. up theory offorms can refer to the literature (Ahmed, 1994) up formsof basic assumptions are as follows:
C sand is fully saturatedC space density of water remains the sameC the porosity does not change over timeC of soil particles can not be compressedC water compressible and isothermal processC water flow velocity gradient is small and can be
neglected for allC relative to the acceleration of soil water particles can
be ignored (for the low frequency range)C consider the continuum of soil ( Enter the ball longer
than soil porosity and particle large)C small strain and neglect rotationC did not give the initial strain
Motion equation of saturated soil: The equation ofmotion that saturated soil, such as type (1):
(1)σ ρ ρij j i iii b, − + = 0
where,Fij - soil total stressui- Soil particle displacement matrixbi - Unit volume force quality
The total density D of saturated soil is defined as Eq. (2):
(2)( )ρ ρ ρ= + −n nf s1
where,Ds The density of soil particlesDf water densityn porosity
Water movement equations; Eq. (3):
(3)( )kg
ii b ii npKf
i f i f i i i ifρ
ρ ρ ρ− + + − =,&
0
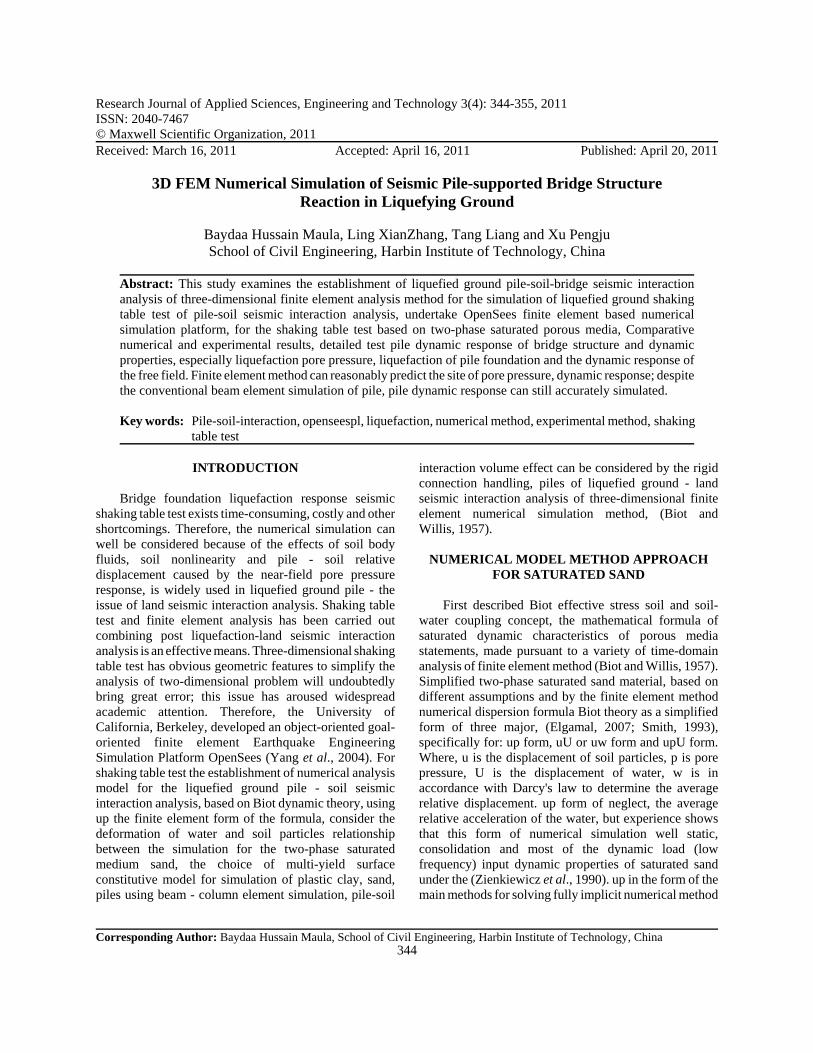
(a) Principal stress space
(b) Deviatory plane
Fig. 1: Conical yield surfaces in principal stress space anddeviatory plane
Chan on the importance of this research was, for the roleof particle acceleration can be neglected. Therefore, theflow of water conservation equation simultaneousequations of motion expressed as Eq. (4):
(4)( )kg
b ii npKf
i f i i i ifρ
ρ ρ+ + − =,&
0
where, Changes in volume strain increment vectorKf Bulk modulus of waterK permeabilityg Acceleration of gravityp pore pressure
RESULTS AND DISCUSSION
The constitutive model of soil: Test simulation forundrained saturated sand material. The constitutive modelof saturated sand with more yield figurines of soilconstitutive model simulation (Yang, 2000), shown inFig. 1. The model is based on more than the initial yieldfigurines theory (Prevost model theory framework), the
Res. J. Appl. Sci. Eng. Technol., 3(4): 344-355, 2011
346
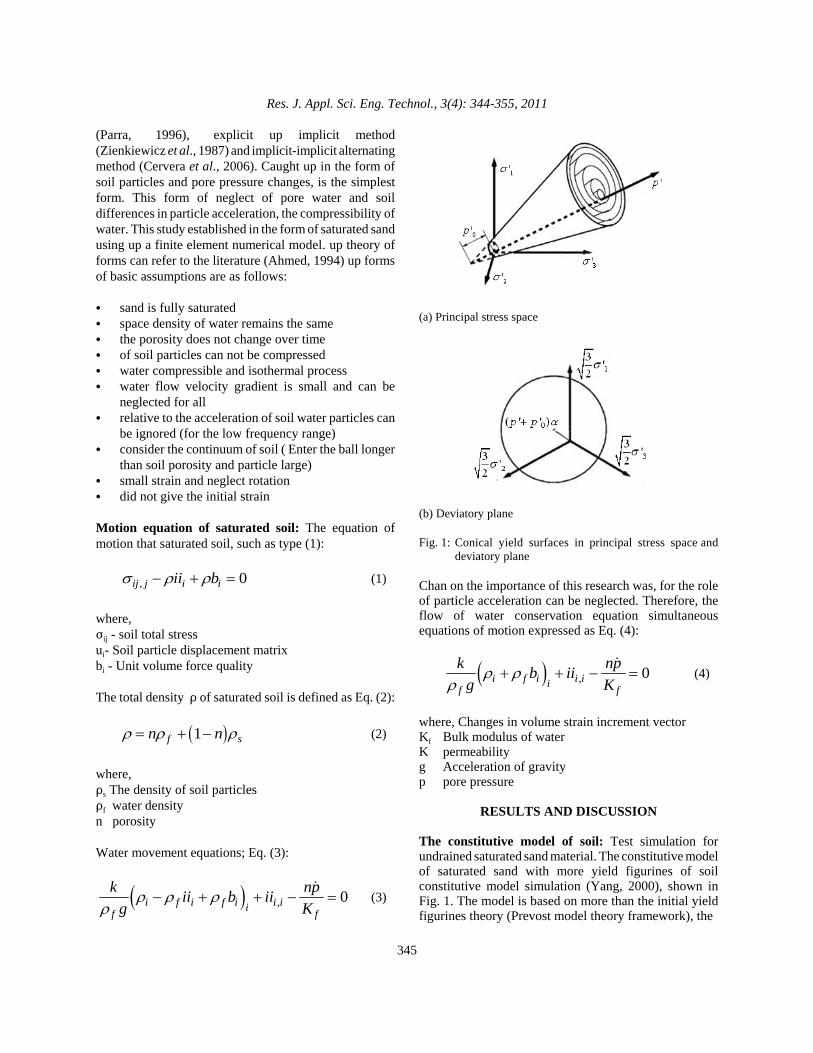
(a) Shear stress-shear strain response
(b) Effective confinement-shear stress response
Fig. 2: Relationship among shear stress, effective confinementand shear strain in constitutive model
yield surface to simulate a multi-lag response of sandcirculation (Iwan et al., 1967), especially given theliquefaction caused by medium sand, sand compactioncycle cumulative effect of permanent shear strain(Yang et al., 2002), shown in Fig. 2, and the introductionof appropriate loading - unloading simulation flow rule ofsand under cyclic loading input coupling effect of partialvolume strain (expansion sand contraction and expansioncharacteristics of the ideal plastic), to reproduce theexperimental observation Enter the large sand undercyclic shear loads was the expansion of the trend andcyclic shear stiffness and strength increase (cycle-slipmechanism of flow) phenomenon. Models into a newhardening of criteria, including four:
C To comply with conventions of classical plasticity,elastic deformation is linear and isotropic, are derivedfrom all non-linear and anisotropic plasticdeformation
C The yield functions including hydrostatic pressurealong the main line and has a vertex of the conesurface in stress space. The formation of many multi-figurines of the same yield surface vertices, the mostout of the failure surface; The kinematic hardeningrule
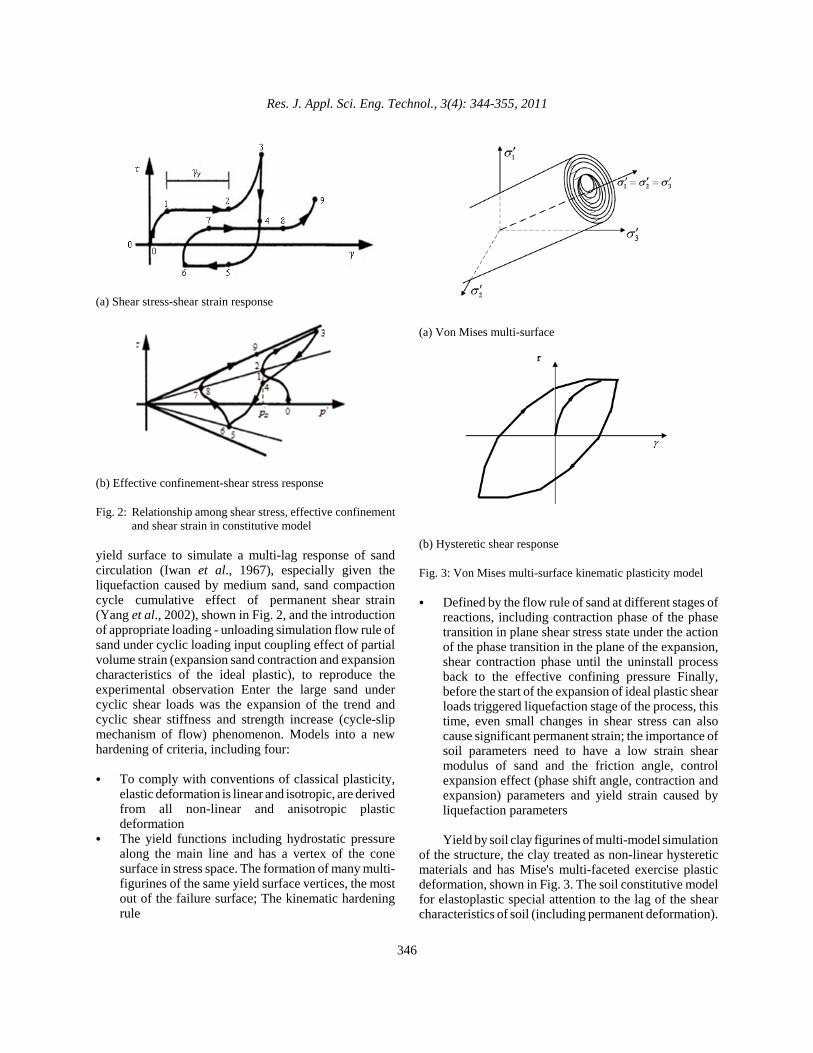
(a) Von Mises multi-surface
(b) Hysteretic shear response
Fig. 3: Von Mises multi-surface kinematic plasticity model
C Defined by the flow rule of sand at different stages ofreactions, including contraction phase of the phasetransition in plane shear stress state under the actionof the phase transition in the plane of the expansion,shear contraction phase until the uninstall processback to the effective confining pressure Finally,before the start of the expansion of ideal plastic shearloads triggered liquefaction stage of the process, thistime, even small changes in shear stress can alsocause significant permanent strain; the importance ofsoil parameters need to have a low strain shearmodulus of sand and the friction angle, controlexpansion effect (phase shift angle, contraction andexpansion) parameters and yield strain caused byliquefaction parameters
Yield by soil clay figurines of multi-model simulationof the structure, the clay treated as non-linear hystereticmaterials and has Mise's multi-faceted exercise plasticdeformation, shown in Fig. 3. The soil constitutive modelfor elastoplastic special attention to the lag of the shearcharacteristics of soil (including permanent deformation).
Res. J. Appl. Sci. Eng. Technol., 3(4): 344-355, 2011
347
Table 1: Parameters for constitutive model of sandParameters Loose sand Medium sand China medium sand Dense sand Density (kg/m3) 1700 1900 2000 2100Reference to low-strain shear modulusG0 (kPa, PT = 80 kPa) 5.5×10⁴ 7.5×10⁴ 1.0×10⁵ 1.3×10⁵
Reference bulk modulusB0 (kPa, PT = 80 kPa) 1.5×10⁵ 2.0×10⁵ 3.0×10⁵ 3.9×10⁵
N (°) Peak shear strain 29 33 37 40gmax (PT = 80kPa) 0.1 0.1 0.1 0.1Reference mean effective confining pressurePT (kPa) 80 80 80 80np Stress-related parameters 0.5 0.5 0.5 0.5Initial void ratio 0.85 0.7 0.55 0.45
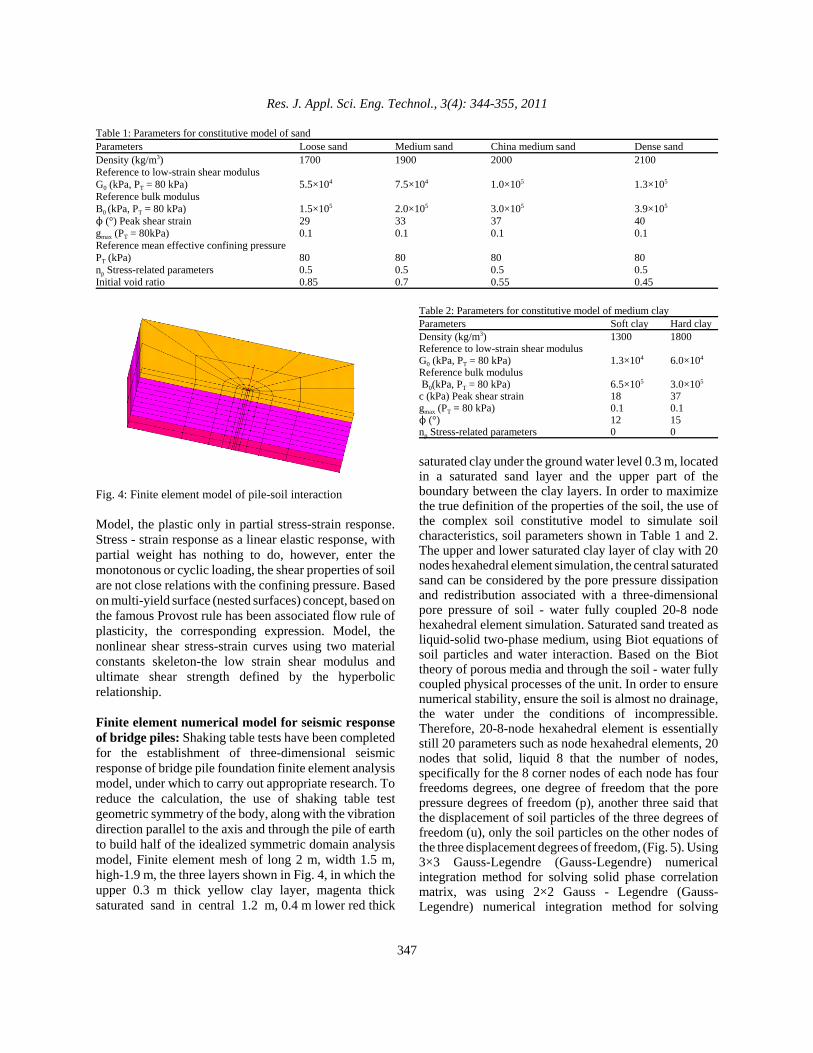
Fig. 4: Finite element model of pile-soil interaction
Model, the plastic only in partial stress-strain response.Stress - strain response as a linear elastic response, withpartial weight has nothing to do, however, enter themonotonous or cyclic loading, the shear properties of soilare not close relations with the confining pressure. Basedon multi-yield surface (nested surfaces) concept, based onthe famous Provost rule has been associated flow rule ofplasticity, the corresponding expression. Model, thenonlinear shear stress-strain curves using two materialconstants skeleton-the low strain shear modulus andultimate shear strength defined by the hyperbolicrelationship.
Finite element numerical model for seismic responseof bridge piles: Shaking table tests have been completedfor the establishment of three-dimensional seismicresponse of bridge pile foundation finite element analysismodel, under which to carry out appropriate research. Toreduce the calculation, the use of shaking table testgeometric symmetry of the body, along with the vibrationdirection parallel to the axis and through the pile of earthto build half of the idealized symmetric domain analysismodel, Finite element mesh of long 2 m, width 1.5 m,high-1.9 m, the three layers shown in Fig. 4, in which theupper 0.3 m thick yellow clay layer, magenta thicksaturated sand in central 1.2 m, 0.4 m lower red thick
Table 2: Parameters for constitutive model of medium clayParameters Soft clay Hard clayDensity (kg/m3) 1300 1800Reference to low-strain shear modulusG0 (kPa, PT = 80 kPa) 1.3×10⁴ 6.0×10⁴
Reference bulk modulus B0(kPa, PT = 80 kPa) 6.5×10⁵ 3.0×10⁵
c (kPa) Peak shear strain 18 37gmax (PT = 80 kPa) 0.1 0.1N (°) 12 15np Stress-related parameters 0 0
saturated clay under the ground water level 0.3 m, locatedin a saturated sand layer and the upper part of theboundary between the clay layers. In order to maximizethe true definition of the properties of the soil, the use ofthe complex soil constitutive model to simulate soilcharacteristics, soil parameters shown in Table 1 and 2.The upper and lower saturated clay layer of clay with 20nodes hexahedral element simulation, the central saturatedsand can be considered by the pore pressure dissipationand redistribution associated with a three-dimensionalpore pressure of soil - water fully coupled 20-8 nodehexahedral element simulation. Saturated sand treated asliquid-solid two-phase medium, using Biot equations ofsoil particles and water interaction. Based on the Biottheory of porous media and through the soil - water fullycoupled physical processes of the unit. In order to ensurenumerical stability, ensure the soil is almost no drainage,the water under the conditions of incompressible.Therefore, 20-8-node hexahedral element is essentiallystill 20 parameters such as node hexahedral elements, 20nodes that solid, liquid 8 that the number of nodes,specifically for the 8 corner nodes of each node has fourfreedoms degrees, one degree of freedom that the porepressure degrees of freedom (p), another three said thatthe displacement of soil particles of the three degrees offreedom (u), only the soil particles on the other nodes ofthe three displacement degrees of freedom, (Fig. 5). Using3×3 Gauss-Legendre (Gauss-Legendre) numericalintegration method for solving solid phase correlationmatrix, was using 2×2 Gauss - Legendre (Gauss-Legendre) numerical integration method for solving

Res. J. Appl. Sci. Eng. Technol., 3(4): 344-355, 2011
348
1 2
34
5 6
78
9
10
11
12
13
14
15
16
17
18
19
20
Table 3: Physical properties of test pileMaterial E (×103 MPa) I (m4) IXX (m4) density (kg/m3) Shear modulus (MPa) Compressive strength (Mpa)RC 8.24 4.91×10⁻⁶ 9.82×10⁻⁵ 2350 2.9×10³ 5.5
(a) Element DOF number
(b) Distribution of element node DOF
Fig. 5: Solid-fluid coupled 20-8 node brick element
water-related matrix. Reinforced concrete pile length 2.52m, 0.82 m long above the surface, with diameter of 0.1 m,density 2350 kg/m3, elastic modulus 8.24 103 MPa,flexural rigidity 40.5 kN.m2. Numerical model, acentralized top-quality point applied to the simulation ofthe upper part of the bridge pile structure (test the qualityof the block). Pile into a series of simulated beam theorybased on linear elastic beam-column element, thedefinition of the pile section properties. The beam elementcan not simulate the effect of the pile geometry, given thegeometry of the pile on the pile-soil interaction systemsignificantly affected within the pile of soil is dug out ofthe node of post node and the link between the soil pilediameter effects into account. This rigid connectionelement simulation of pile-soil interaction. Rigid Linkorder to achieve the use of OpenSees pile-soil interaction
of physical processes. In order to test the correctness ofthe numerical model, finite element model is assumed tobe rigid base, direct input measured the vibration tablevibration table acceleration time history records.
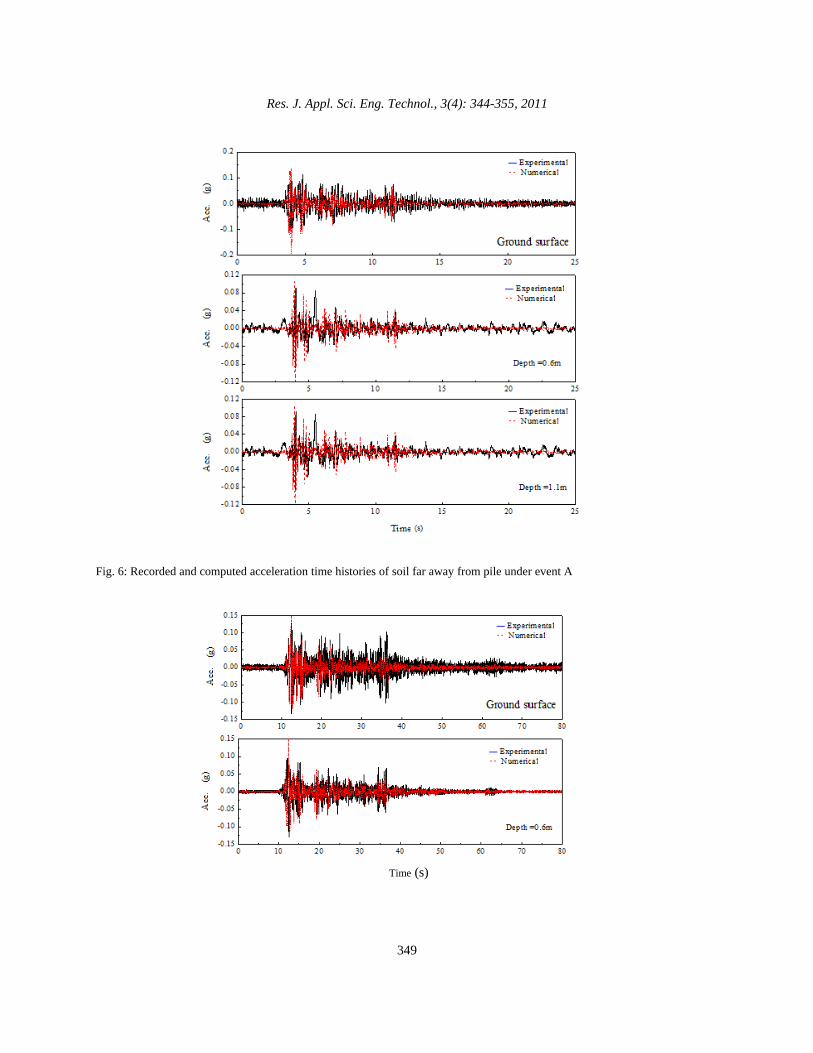
Reinforced concrete pile length 2.52 m, above thesurface long 0.82 m, pile diameter 0.1 m, (Table 3). Pileinto a series of simulated beam theory based on linearelastic beam-column element. In order to test thecorrectness of the numerical model, finite element modelis assumed to be rigid base; direct input measured thevibration table vibration table acceleration time historyrecords. For shaking table test, based on the Open Seessimulation platform, using the modeling approach toestablish liquefied ground pile-soil-bridge seismicinteraction of three-dimensional finite element numericalmodel, direct input test conditions in the actual numericalmodel as a base incentive, by comparing the test andcalculated pile and soil liquefaction numerical model ofdynamic response test to verify the numerical model toestablish the accuracy and reliability. Earthquake inputconditions were: compression 0.15 g El Centro wave(event A) and 0.15 g El Centro wave (event B). Figure 6and 7 are given events A, B enter the far-field soil (fromthe pile 60 cm). A input events, the test value andestimated values showed that the sand layer accelerationgradually decreases from bottom to top, to have weakenedthe role of input ground motion, peak acceleration is farbottom soil pile area did not change significantly, but atthe surface Acceleration has been enlarged, soil test valueacceleration time history is almost consistent with thenumerical value, almost the same magnitude. Event Binput, the bottom layer acceleration gradually increased,and with the sand hole pressure is increased, thenumerical value is slightly larger than the experimentalvalue taken by shaking table experiment; relative event A,the soil in event B greater acceleration response may bedeveloped as result of soil liquefaction.
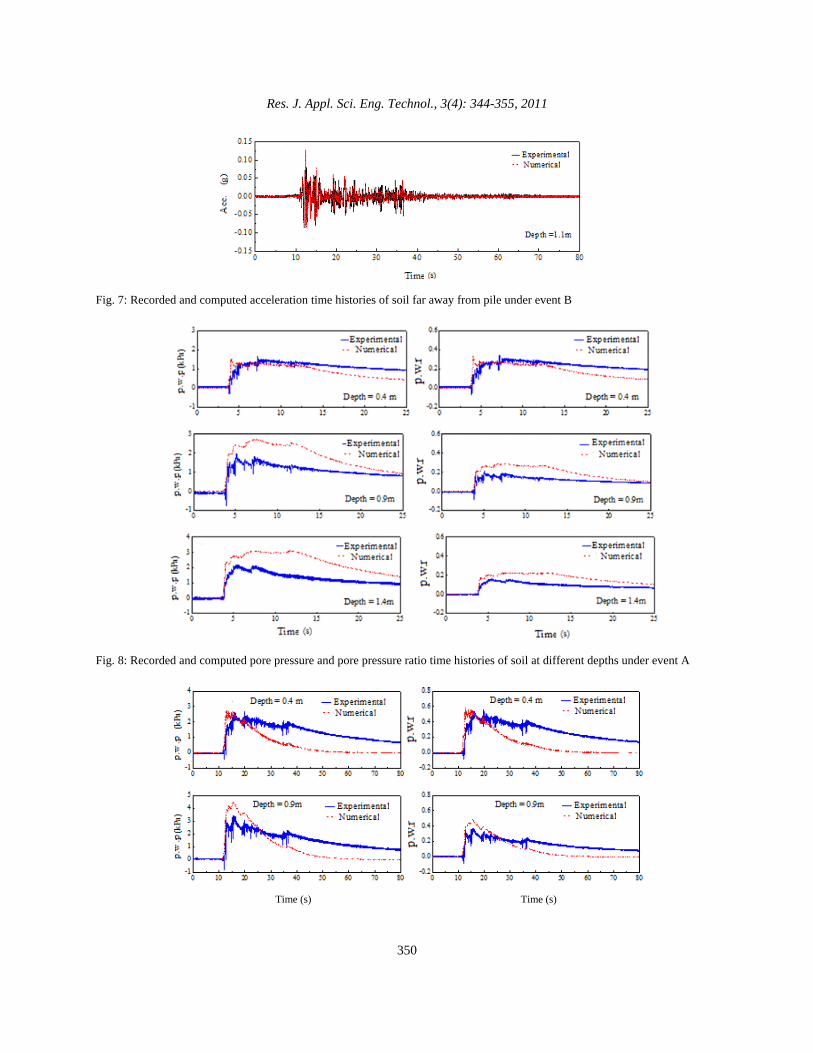
Sand pore water pressure in the simulation for theliquefaction of pile - soil interaction analysis is essential.Therefore, it is necessary to sand pore pressure based ontest reactions in numerical models of reliabilityevaluation. Sand pile zone taking into account the recentpile may be significantly affected, especially selected porepressure response to far-field sand liquefaction as a spacepower on characteristics of the object of verificationaccuracy event A and B input, the far-field sand porepressure and pore pressure ratio time history testnumerical and experimental, respectively, shown inFig. 8 and 9; soil pore water pressure in the two test,
Res. J. Appl. Sci. Eng. Technol., 3(4): 344-355, 2011
349
Fig. 6: Recorded and computed acceleration time histories of soil far away from pile under event A
Time (s)
Res. J. Appl. Sci. Eng. Technol., 3(4): 344-355, 2011
350
Fig. 7: Recorded and computed acceleration time histories of soil far away from pile under event B
Fig. 8: Recorded and computed pore pressure and pore pressure ratio time histories of soil at different depths under event A
Time (s) Time (s)
Res. J. Appl. Sci. Eng. Technol., 3(4): 344-355, 2011
351
Fig. 9: Recorded and computed pore pressure and pore pressure ratio time histories of soil at different depths under event B
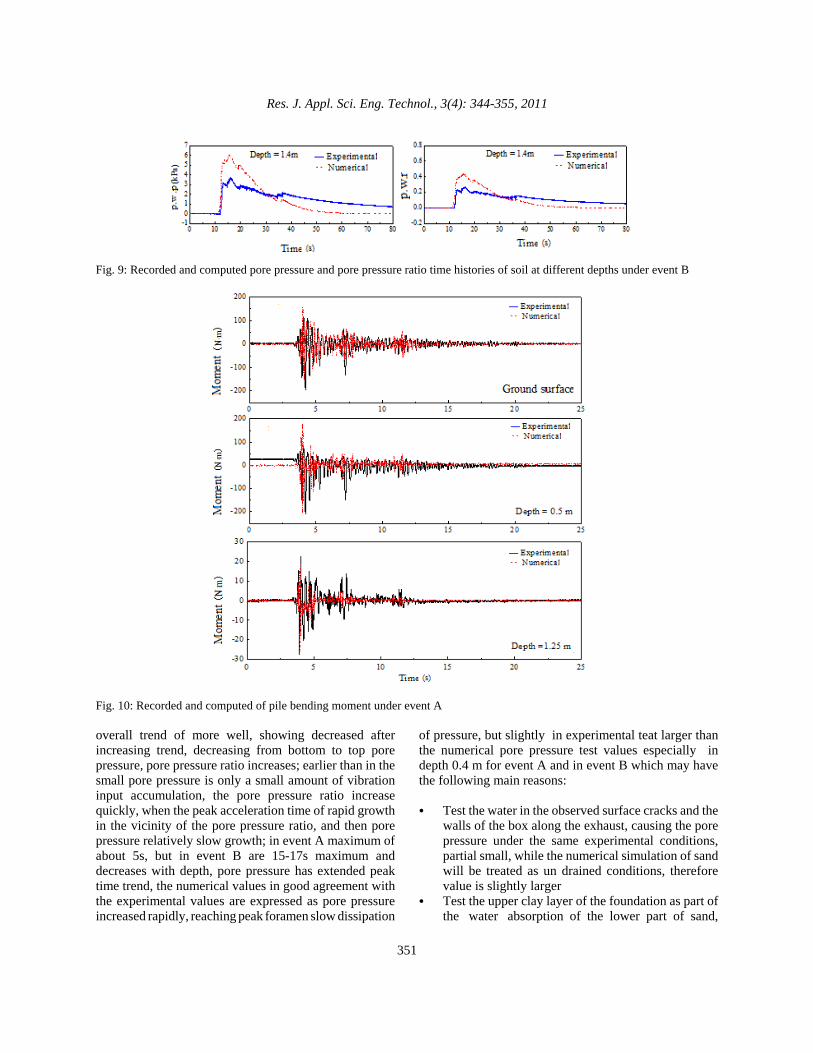
Fig. 10: Recorded and computed of pile bending moment under event A
overall trend of more well, showing decreased afterincreasing trend, decreasing from bottom to top porepressure, pore pressure ratio increases; earlier than in thesmall pore pressure is only a small amount of vibrationinput accumulation, the pore pressure ratio increasequickly, when the peak acceleration time of rapid growthin the vicinity of the pore pressure ratio, and then porepressure relatively slow growth; in event A maximum ofabout 5s, but in event B are 15-17s maximum anddecreases with depth, pore pressure has extended peaktime trend, the numerical values in good agreement withthe experimental values are expressed as pore pressureincreased rapidly, reaching peak foramen slow dissipation
of pressure, but slightly in experimental teat larger thanthe numerical pore pressure test values especially indepth 0.4 m for event A and in event B which may havethe following main reasons:
C Test the water in the observed surface cracks and thewalls of the box along the exhaust, causing the porepressure under the same experimental conditions,partial small, while the numerical simulation of sandwill be treated as un drained conditions, thereforevalue is slightly larger
C Test the upper clay layer of the foundation as part ofthe water absorption of the lower part of sand,
Res. J. Appl. Sci. Eng. Technol., 3(4): 344-355, 2011
352
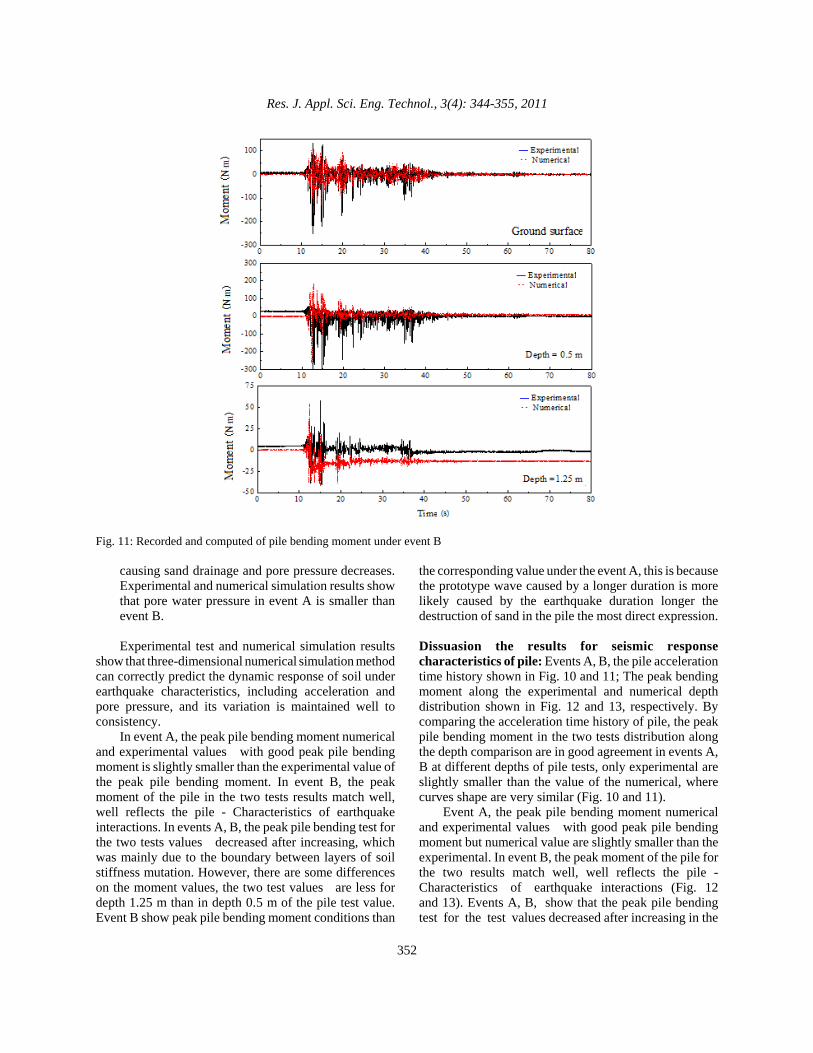
Fig. 11: Recorded and computed of pile bending moment under event B
causing sand drainage and pore pressure decreases.Experimental and numerical simulation results showthat pore water pressure in event A is smaller thanevent B.
Experimental test and numerical simulation resultsshow that three-dimensional numerical simulation methodcan correctly predict the dynamic response of soil underearthquake characteristics, including acceleration andpore pressure, and its variation is maintained well toconsistency.
In event A, the peak pile bending moment numericaland experimental values with good peak pile bendingmoment is slightly smaller than the experimental value ofthe peak pile bending moment. In event B, the peakmoment of the pile in the two tests results match well,well reflects the pile - Characteristics of earthquakeinteractions. In events A, B, the peak pile bending test forthe two tests values decreased after increasing, whichwas mainly due to the boundary between layers of soilstiffness mutation. However, there are some differenceson the moment values, the two test values are less fordepth 1.25 m than in depth 0.5 m of the pile test value.Event B show peak pile bending moment conditions than
the corresponding value under the event A, this is becausethe prototype wave caused by a longer duration is morelikely caused by the earthquake duration longer thedestruction of sand in the pile the most direct expression.
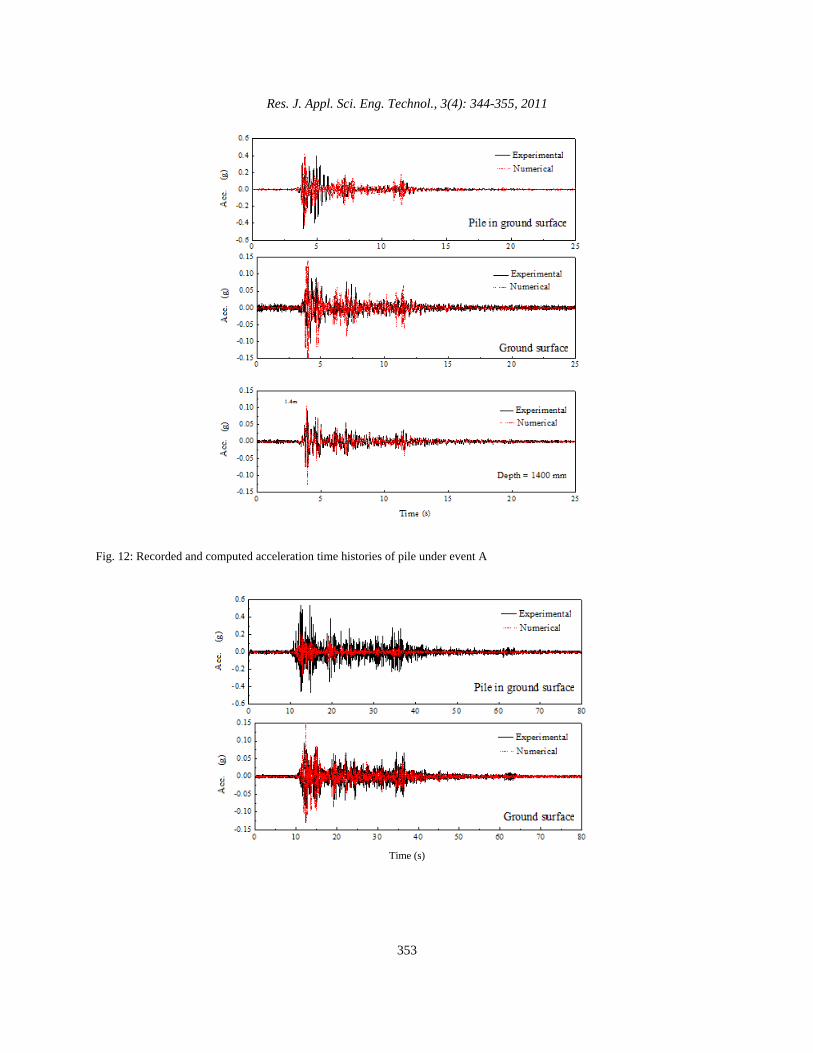
Dissuasion the results for seismic responsecharacteristics of pile: Events A, B, the pile accelerationtime history shown in Fig. 10 and 11; The peak bendingmoment along the experimental and numerical depthdistribution shown in Fig. 12 and 13, respectively. Bycomparing the acceleration time history of pile, the peakpile bending moment in the two tests distribution alongthe depth comparison are in good agreement in events A,B at different depths of pile tests, only experimental areslightly smaller than the value of the numerical, wherecurves shape are very similar (Fig. 10 and 11).
Event A, the peak pile bending moment numericaland experimental values with good peak pile bendingmoment but numerical value are slightly smaller than theexperimental. In event B, the peak moment of the pile forthe two results match well, well reflects the pile -Characteristics of earthquake interactions (Fig. 12and 13). Events A, B, show that the peak pile bendingtest for the test values decreased after increasing in the
Res. J. Appl. Sci. Eng. Technol., 3(4): 344-355, 2011
353
Fig. 12: Recorded and computed acceleration time histories of pile under event A
Time (s)
Res. J. Appl. Sci. Eng. Technol., 3(4): 344-355, 2011
354
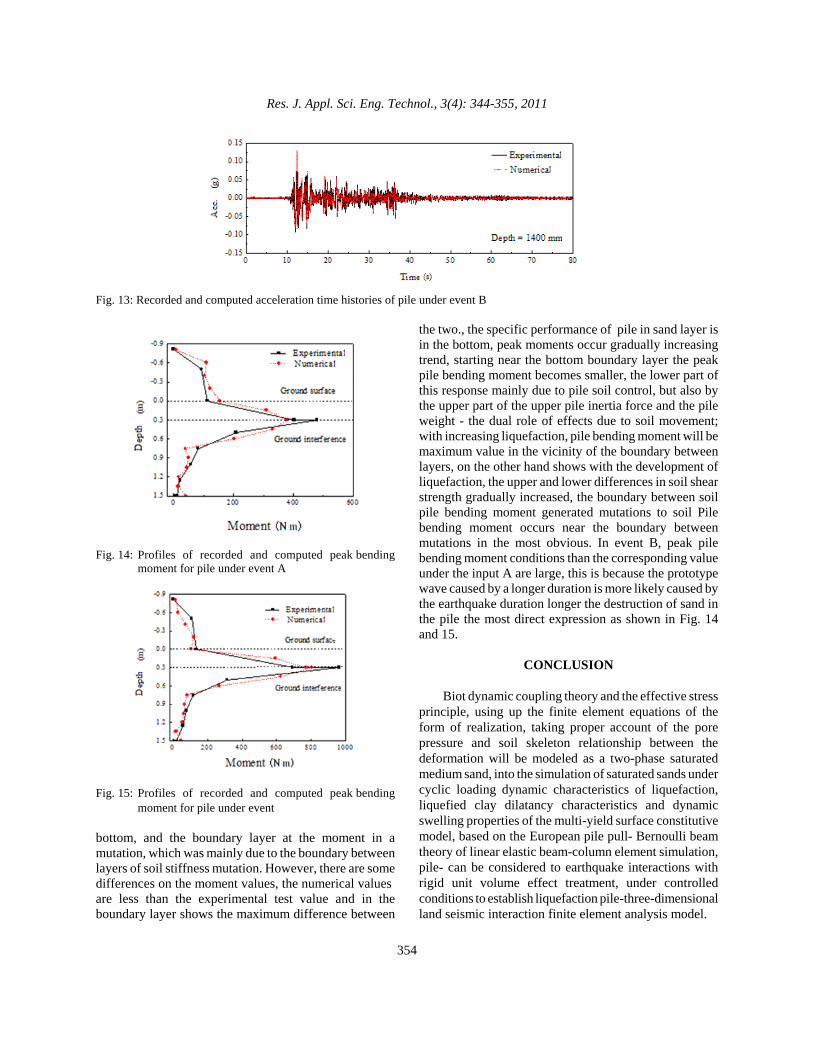
Fig. 13: Recorded and computed acceleration time histories of pile under event B
Fig. 14: Profiles of recorded and computed peak bendingmoment for pile under event A
Fig. 15: Profiles of recorded and computed peak bendingmoment for pile under event
bottom, and the boundary layer at the moment in amutation, which was mainly due to the boundary betweenlayers of soil stiffness mutation. However, there are somedifferences on the moment values, the numerical values are less than the experimental test value and in theboundary layer shows the maximum difference between
the two., the specific performance of pile in sand layer isin the bottom, peak moments occur gradually increasingtrend, starting near the bottom boundary layer the peakpile bending moment becomes smaller, the lower part ofthis response mainly due to pile soil control, but also bythe upper part of the upper pile inertia force and the pileweight - the dual role of effects due to soil movement;with increasing liquefaction, pile bending moment will bemaximum value in the vicinity of the boundary betweenlayers, on the other hand shows with the development ofliquefaction, the upper and lower differences in soil shearstrength gradually increased, the boundary between soilpile bending moment generated mutations to soil Pilebending moment occurs near the boundary betweenmutations in the most obvious. In event B, peak pilebending moment conditions than the corresponding valueunder the input A are large, this is because the prototypewave caused by a longer duration is more likely caused bythe earthquake duration longer the destruction of sand inthe pile the most direct expression as shown in Fig. 14and 15.
CONCLUSION
Biot dynamic coupling theory and the effective stressprinciple, using up the finite element equations of theform of realization, taking proper account of the porepressure and soil skeleton relationship between thedeformation will be modeled as a two-phase saturatedmedium sand, into the simulation of saturated sands undercyclic loading dynamic characteristics of liquefaction,liquefied clay dilatancy characteristics and dynamicswelling properties of the multi-yield surface constitutivemodel, based on the European pile pull- Bernoulli beamtheory of linear elastic beam-column element simulation,pile- can be considered to earthquake interactions withrigid unit volume effect treatment, under controlledconditions to establish liquefaction pile-three-dimensionalland seismic interaction finite element analysis model.
Res. J. Appl. Sci. Eng. Technol., 3(4): 344-355, 2011
355
By shaking table tests to verify and assess the testpile liquefied ground under controlled conditions - landseismic interaction analysis model and calculation methodof three-dimensional accuracy and precision. numericalcalculation, for such complex issues, including the pile -soil contact nonlinear, the process of soil liquefaction andthe drastic change bit and the large deformation of soilbox binding effect of such boundary conditionssimultaneously, we need to simulate the situation is morecomplicated. However, a reasonable calculation of theselected parameters, the numerical method can predict thedifferent types of sand pile bridge site and the dynamiccharacteristics of the finite element method shows highreliability, can better handle Soil strongly nonlinear, non-linear pile-soil contact and the computational domainboundary conditions and other advantages
ACKNOWLEDGMENT
The research projects were funded by MajorResearch Plan of National Natural Science Foundation ofChina (No. 90815009), National Natural ScienceFoundation of China (No. 50378031 and 50178027) andWestern Transport Construction Technology Projects (No.2009318000100) and was implemented in State KeyLaboratory for Disaster Reduction in Civil Engineering inChina. These supporters are gratefully acknowledged.Also the writers would like to thank the laboratory testclerks for their vigorous support.
REFERENCES
Ahmed, R.M., 1994. Numerical analysis of seismicallyinduced deformations in saturated granular soil strata.Ph.D. Dissertation, Rensselaer Polytechnic Institute,pp: 11-32.
Biot, M.A. and D.G. Willis, 1957. The elastic coefficiectsof the theory of consolidation. J. Appl. Mech., 1(24):594-601.
Cervera, M., J. Oliver and R. Faria, 2006. Seismicevaluation of concrete dams via continuum damagemodels. Earthq. Eng. Struct. D., 24(9): 1225-1245.
Elgamal, A., 2007. Nonlinear modeling of large-scaleground-foundation-structure seismic response. J.Earthq. Technol., 44(2): 325-339.
Iwan, W.D., 1967. On a class of models for the yieldingbehavior of continuous and composite systems. J.Appl. Mech., 34: 612-617.
Parra, E., 1996. Numerical modeling of liquefaction andlateral ground deformation including cyclic mobilityand dilation response in soil systems. Ph.D.Dissertation, Rensselaer Polytechnic Institute,pp: 85-101.
Smith, I.M., 1993. Overview of nmerical predictions inthe VELACS project. Proceedings of theVerifications of Numerical Predictions for theAnalysis of soil Liquefaction, 2: 1321-1338.
Yang, Z., 2000. Numerical modeling of earthquake siteresponse including dilation and liquefaction. Ph.D.Dissertation, Depatment of Civil Engineering andEngineering Mechanics,Columbia University, NewYork, NY, pp: 47-59.
Yang, Z. and A. Elgamal, 2002. Influence of permeabilityon liquefaction-induced shear deformation. J. Eng.Mech., 128(7): 720-729.
Yang, Z., J. Lu and A. Elgamal, 2004. A web-basedplatform for computer simulation of seismic groundresponse. Adv. Eng. Sofrware, 35(5): 249-259.
Zienkiewicz, O.C., D.K. Paul and A.H.C. Chan, 1987.Numerical solution for the total response of saturatedporous media leading to liquefaction and subsequentconsolidation. Numeta 87 Conference, Swansea, pp:6-10.
Zienkiewicz, O.C., A.H.C. Chan and M. Pastor, 1990.Static and dynamic behavior of soils: A Rationalapproach to quantitative solutions: I. fully saturatedproblems. P. Roy. Soc. Lond., A, Math., 429:285-309.