Embed Size (px)
Citation preview

*Corr. Author’s Address: University of Zaragoza, Campus Rio Ebro, C/ Maria de Luna 3, 50018, Zaragoza, Spain, [email protected] 467
Strojniški vestnik - Journal of Mechanical Engineering 66(2020)7-8, 467-478 Received for review: 2020-05-25© 2020 Journal of Mechanical Engineering. All rights reserved. Received revised form: 2020-07-01DOI:10.5545/sv-jme.2020.6784 Original Scientific Paper Accepted for publication: 2020-07-14
3D FE Modelling of Machining Forces during AISI 4140 Hard Turning
Tzotzis, A. – García-Hernández, C. – Huertas-Talón, J.L. – Kyratsis, P.Anastasios Tzotzis1,* – César García-Hernández1 – José-Luis Huertas-Talón1 – Panagiotis Kyratsis2
1University of Zaragoza, Department of Design and Manufacturing Engineering, Spain 2University of Western Macedonia, Department of Product and Systems Design Engineering, Greece
Hard turning is one of the most used machining processes in industrial applications. This paper researches critical aspects that influence the machining process of AISI 4140 to develop a prediction model for the resultant machining force-induced during AISI 4140 hard turning, based on finite element (FE) modelling. A total of 27 turning simulation runs were carried out in order to investigate the relationship between three key parameters (cutting speed, feed rate, and depth of cut) and their effect on machining force components. The acquired numerical results were compared to experimental ones for verification purposes. Additionally, a mathematical model was established according to statistical methodologies such as the response surface methodology (RSM) and the analysis of variance (ANOVA). The plurality of the simulations yielded results in high conformity with the experimental values of the main machining force and its components. Specifically, the resultant cutting force agreement exceeded 90 % in many tests. Moreover, the verification of the adequacy of the statistical model led to an accuracy of 8.8 %.Keywords: AISI 4140 turning, machining forces, 3-dimensional finite element modelling, response surface methodology
Highlights• A 3D FE model has been established for the hard turning of AISI 4140.• In addition, a statistically based prediction model for the resultant machining force has been developed.• Through RSM and ANOVA, the effect of the cutting parameters on the machining force components and their relationship were
investigated.• The numerical results were in complete accordance with the experimental ones; the relative error was estimated within the
range of -10 % to 12 % for most of the cases.• The prediction model offered an accuracy of 8.8 %.
Similar studies have been conducted to examine the generated chip morphology and cutting forces via 2D modelling for homologous materials [10] to [12], but this model has several restrictions that limit its field of application. In contrast, the constant advancement of computational resources resulted in the emergence of 3D modelling, which does not have the limitations of 2D models. Therefore, FE modelling in three dimensions can help researchers to study several aspects of machining at a greater extent. Tool wear analysis and temperature distribution on the cutting tip of tools has been studied extensively [13] to [15], as well as the prediction of the cutting forces and residual stresses, and the optimization of the machining conditions [16] to [18]. Three-dimensional modelling is also used for investigation purposes on the turning of hardened steels; in most cases, the results are experimentally validated. Guo and Liu [19] established a geometric model and a general practical, explicit 3D FE model to analyse the hard turning of AISI 52100; the model predictions provide reasonable accuracy for several cutting results. Later, Özel et al. [20] utilized 3D FE modelling to predict chip formation, forces, temperatures, and tool wear during hard turning of AISI 4130 with polycrystalline
0 INTRODUCTION
Hard turning is a cost-effective machining operation since it can reduce finish grinding of parts and, in some cases, eliminate it. The term “hard turning” refers to the turning operation of hardened steel with hardness between 58 and 62 HRC [1]. Additionally, hardened steel is an essential work material in industrial applications. Therefore, many researchers developed an increased interest in the investigation of hard turning and similar machining processes [2] to [6]. One of the latest advances in machining studies is the implementation of the finite element method (FEM) with the aid of specialized software.
In recent years, the 2D orthogonal cutting finite element (FE) model have proved to be a valuable tool for many researchers. Klocke et al. [7] simulated the high-speed orthogonal turning of AISI 1045 steel using commercial software. Yen et al. [8] developed a methodology to predict the tool wear evolution and tool life in orthogonal cutting using FEM simulations. Arrazola et al. [9] employed a 2D FE model with the use of arbitrary Langrangian Eulerian (ALE) formulation for prediction purposes of the serrated chip during AISI 4140 machining.
Strojniški vestnik - Journal of Mechanical Engineering 66(2020)7-8, 467-478
468 Tzotzis, A. – García-Hernández, C. – Huertas-Talón, J.L. – Kyratsis, P.
cubic boron nitride (PcBN) tools. Lian et al. [21] proposed a structural model for soft/hard composite-coated textured (SHCCT) tools and confirmed it with a three-dimensional numerical simulation. The proposed model was applied to AISI 1045 hard turning and was analysed via orthogonal experiments for different coating thickness, material, and ratios of the soft/hard coatings. Magalhães et al. [22] aimed to provide a better understanding of the mechanical and thermal loads involved in cutting, with respect to the variation of the tool’s edge discretization. To do so, they prepared numerical simulations of AISI 5115 steel hard turning using finite element analysis (FEA).
The advent of more advanced inserts, such as PcBN, polycrystalline diamond (PCD), chemical vapour deposition (CVD) and ceramics, lead to more efficient machining and overall to better quality finished parts. In particular, ceramic tools are preferred when machining hardened steels; therefore, the analysis of hard turning with ceramics and the effects of various conditions is a research area that can benefit from the implementation of FEM. Hu and Huang [1] and [14] researched the influence of tool shape and cutting angles on the contact stresses, sliding speed, and temperature with the aid of 3D FEM and experimental testing; they also established a new type of tool life model for nano-ceramic tools, which includes several parameters. Moreover, they studied the effects of cutting speed on the high-speed turning of AISI 1013 with ceramics by using similar methodologies.
An adequate number of solely experimental research studies can be found in the literature, related to the hard turning of steel; however, the implementation of FEM in such studies remains limited, especially during the investigation of the modern standardized turning inserts. In the present paper, the components of the turning force-induced during the hard turning of AISI 4140 is examined with respect to several combinations of cutting speed, feed, and depth of cut. The study has been carried out with the aid of a commercially available finite model analysis (FEA) software (DEFORM3D™). In addition to the established FE model, a prediction model for the main machining force based on statistical methods has been developed. Furthermore, both the FE model and the statistical prediction model were validated via comparison with equivalent experimental results that are available in the literature [23].
1 METHODOLOGIES
1.1 Experimental Layout
The experimental values [23] used in this study were acquired with the aid of a three-component dynamometer, (Kistler 9257B) and a standard data acquisition system which includes a charge amplifier, a data acquisition card (A/D2855A3), and the appropriate software (DynoWare 2825A1-1). The turning experiments were performed with the aid of a universal lathe type SN 40C and the tool-holder PCBNR2525M12. The chemical composition of the material being studied (AISI 4140) in wt%, is as follows: C 0.43, Mn 0.79, Si 0.24, S 0.024, Cu 0.025, Al 0.029, Ti 0.004, Nb 0.001, Ni 0.022, Cr 1.10, Mo 0.19, Va 0.005, Sn 0.002, and Fe in balance. In addition, the chemical composition of the used ceramic tool (CNGA120408) is 70 % Al2O3 and 30 % TiC.
1.2 CAD-Based Layout
A CAD-based setup of the turning experiments was realized in SolidWorks™ 2018 in order to acquire an overview of the process and extract the necessary information that was used to build a simplified 3D FE model. The tool of this study is comprised of a tool-holder and a conventional turning insert with ISO designation numbers PCBNR2525M12 and CNGA120408, respectively. A cylindrical bar with a diameter of 72 mm served as the workpiece. In addition, the selected material for the workpiece is AISI 4140 steel, whereas the insert is an uncoated ceramic. The angles related to the cutting process are from the tool-holder and insert geometry. Hence, the lead angle is 75°, and both the rake and inclination angle are negative with a value of −6°.
Fig. 1a depicts a schematic of the tool-workpiece setup along the machining forces: Ft stands for the tangential force, Fr is the radial force, and finally Fa is the developed feed force. In contrast, Fig. 1b shows the most important dimensions of the insert. The CNGA-ceramic family are 80° rhombic inserts used for machining hardened steel.
The cutting conditions applied in the present research include three levels of cutting speed (80 m/min, 115 m/min, 150 m/min), feed (0.08 mm/rev, 0.11 mm/rev, 0.14 mm/rev) and depth of cut (0.10 mm, 0.20 mm, 0.30 mm). Thus, the total number of simulation tests that were carried out, based on the unique factor level combinations, is twenty-seven.

Strojniški vestnik - Journal of Mechanical Engineering 66(2020)7-8, 467-478
4693D FE Modelling of Machining Forces during AISI 4140 Hard Turning
Table 1 summarizes the factors, and their levels that are found in the present study.
Table 1. Process conditions of the turning FE model
Level Vc [m/min] f [mm/rev] ap [mm]I 80 0.08 0.10II 115 0.11 0.20III 150 0.14 0.30
1.3 3D FE Model Setup
Commercially available FEA software was used (DEFORM3D™ ver. 12) to perform the simulation tests of the 3D turning process without making any assumptions that are associated with the orthogonal cutting conditions [24]. The tests were performed on a desktop PC with six-core CPU 3.60 GHz, 16 GB RAM and SSD technology hard drive. With the given specifications, the completion time for the simulations with a feed value of 0.14 mm/rev, 0.11 mm/rev and 0.08 mm/rev was about 6 hours, 10 hours and 18 hours accordingly. This difference in time is due to the fact that the mesh size of the workpiece varied from test to test.
In order to achieve the aforementioned reasonable simulation times, an effort to simplify the problem was made. For example, only a small area of the workpiece was used, instead of the entire cylindrical model. Specifically, the workpiece was converted to a circular arc with a diameter of 72 mm and an angle of 45° (Fig. 2a). In addition, the workpiece was generated with an already cut surface based on the depth of cut
(Fig. 2c). The specified geometry constitutes the analysis domain of the problem.
1.3.1 Tool – Workpiece Interface Definition
Both the model of the insert and the model of the simplified workpiece were designed in SolidWorks™. The first was designed according to the ISO 13399 (see Fig. 1b), whereas the latter was designed with respect to the depth of cut, the corner radius of the tool and the diameter of the cylindrical steel bar. Both models were saved in STL file format and then imported to the analysis software for the development of the FE model. The tool was modelled as rigid and meshed with approximately 50,000 tetrahedral elements. Moreover, the mesh was refined locally by applying a size ratio of 4:1 close to the cutting tip, as shown in Fig. 2b, because this area of the insert is in contact with the uncut surface of the workpiece. the workpiece was modelled to have plastic behaviour, and its mesh size varied between roughly 90,000 and 140,000 elements. This variance occurred due to the size of the minimum triangular element which depends on the value of feed; the size of the minimum element was fixed to 25 % of the feed for all cases [24]. Additionally, a more dense mesh with a size ratio of 7:1 was applied to the section of the workpiece where contact with the tool is present. Fig. 2c illustrates the section of the workpiece and the formation of the mesh.
Since chip formation in turning is a process in which large deformations, strains and high temperatures develop, an adaptive remeshing method was implemented. The used method involves local
Fig. 1. CAD models of a) the cylindrical workpiece, and b) the CNGA120408 insert

Strojniški vestnik - Journal of Mechanical Engineering 66(2020)7-8, 467-478
470 Tzotzis, A. – García-Hernández, C. – Huertas-Talón, J.L. – Kyratsis, P.
remeshing with the default interference depth, strain and strain rate distribution so that more elements can be generated in the area of interest. The goal of the implementation of this method is to improve the simulation time and the geometry of the formed chip.
Next, the necessary boundary conditions were defined. The workpiece was fixed so that the velocity of the nodes in X and Z axis was equal to zero, as shown in Fig. 2a. The tool was also allowed to follow the trajectory as dictated by the cutting direction (Fig. 2a). Furthermore, the boundary conditions for the heat exchange with the environment were attributed to all surfaces of the workpiece. The default values of heat transfer coefficient for both convection and conduction were used. According to DEFORM3D™ manual [24], the default value for the heat transfer coefficient via convection is 0.02 N/(s×mm×°C) for dry cutting and via conduction is 45 N/(s×mm×°C).
1.3.2 Tool–Workpiece Material Modelling
In this study, the material modelling for the hard-turning of AISI 4140 was realized with the Johnson-Cook plasticity model, which is widely used to approximate machining processes that are followed by large deformations and high temperatures. The relationship between the constitutive parameters is described by Eq. (1) [18].
� ��
�� � � �
�
�� ��
��
�
��
�
��
�
��
�
���
�
�
A B CT TT T
n
m
m
1 1
0
0
0
ln .
(1)
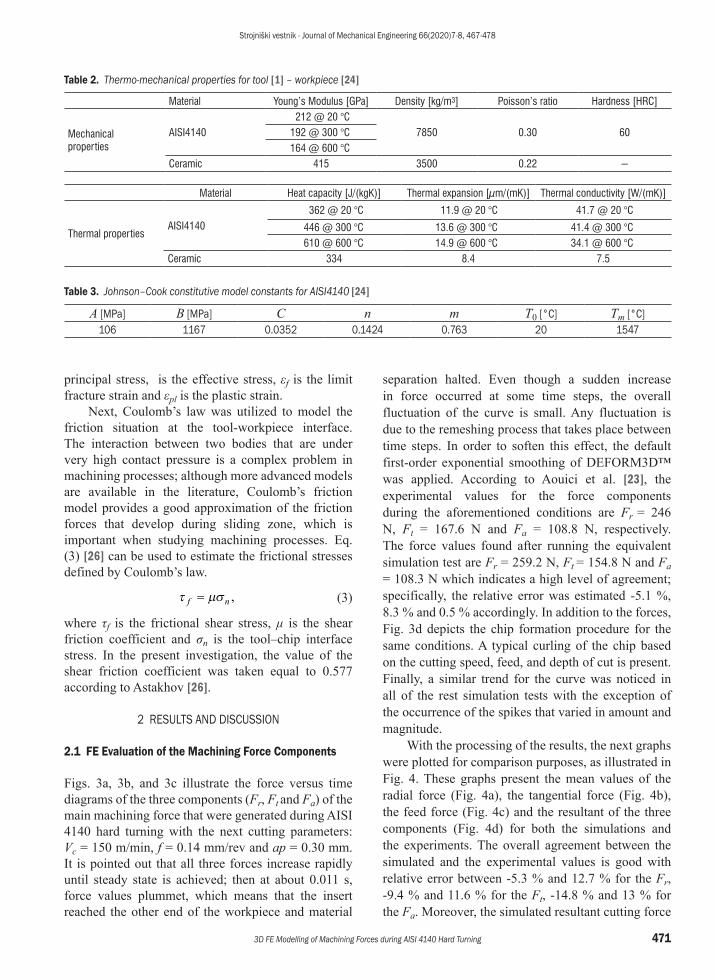
In the given equation, σ denotes the equivalent stress, A is the initial yield stress, B is the strain hardening modulus, C is the strain rate dependence coefficient, ε is the plastic strain, n is the strain hardening exponent, m is the thermal softening coefficient, is the plastic strain rate, whereas is the reference plastic strain rate, T is the reference temperature, T0 is the ambient temperature, and finally Tm is the melting temperature of the workpiece material. The most important thermo-mechanical properties of AISI 4140 and ceramic tool material are presented in Table 2. The elastic modulus, the thermal expansion, the thermal conductivity and the heat capacity of the workpiece material are all temperature dependent, thus their values were expressed as a function of temperature f (Temp). Additionally, the Johnson-Cook model constants are included in Table 3. The properties and the model constants for the steel are available in the software’s library. For the simulation tests that are discussed in this paper, a reference strain rate of 1/s was employed.
The phenomenon of the material separation that takes place during turning was approximated with the employment of the normalized Cockroft-Latham damage model, which can be expressed by Eq. (2) [25]. In this expression, the maximum principal stress is normalized by the effective stress.
D dc pl
f
� ���
��
max ,
0
(2)
where Dc represents the material constant in the fracture criterion, σmax is the maximum tensile
Fig. 2. a) The FE model setup, b) the meshed insert, and c) the analysis domain
Strojniški vestnik - Journal of Mechanical Engineering 66(2020)7-8, 467-478
4713D FE Modelling of Machining Forces during AISI 4140 Hard Turning
separation halted. Even though a sudden increase in force occurred at some time steps, the overall fluctuation of the curve is small. Any fluctuation is due to the remeshing process that takes place between time steps. In order to soften this effect, the default first-order exponential smoothing of DEFORM3D™ was applied. According to Aouici et al. [23], the experimental values for the force components during the aforementioned conditions are Fr = 246 N, Ft = 167.6 N and Fa = 108.8 N, respectively. The force values found after running the equivalent simulation test are Fr = 259.2 N, Ft = 154.8 N and Fa = 108.3 N which indicates a high level of agreement; specifically, the relative error was estimated -5.1 %, 8.3 % and 0.5 % accordingly. In addition to the forces, Fig. 3d depicts the chip formation procedure for the same conditions. A typical curling of the chip based on the cutting speed, feed, and depth of cut is present. Finally, a similar trend for the curve was noticed in all of the rest simulation tests with the exception of the occurrence of the spikes that varied in amount and magnitude.
With the processing of the results, the next graphs were plotted for comparison purposes, as illustrated in Fig. 4. These graphs present the mean values of the radial force (Fig. 4a), the tangential force (Fig. 4b), the feed force (Fig. 4c) and the resultant of the three components (Fig. 4d) for both the simulations and the experiments. The overall agreement between the simulated and the experimental values is good with relative error between -5.3 % and 12.7 % for the Fr, -9.4 % and 11.6 % for the Ft, -14.8 % and 13 % for the Fa. Moreover, the simulated resultant cutting force
Table 2. Thermo-mechanical properties for tool [1] – workpiece [24]
Material Young’s Modulus [GPa] Density [kg/m3] Poisson’s ratio Hardness [HRC]
Mechanical properties
AISI4140212 @ 20 °C
7850 0.30 60192 @ 300 °C164 @ 600 °C
Ceramic 415 3500 0.22 −
Material Heat capacity [J/(kgK)] Thermal expansion [μm/(mK)] Thermal conductivity [W/(mK)]
Thermal propertiesAISI4140
362 @ 20 °C 11.9 @ 20 °C 41.7 @ 20 °C
446 @ 300 °C 13.6 @ 300 °C 41.4 @ 300 °C610 @ 600 °C 14.9 @ 600 °C 34.1 @ 600 °C
Ceramic 334 8.4 7.5
Table 3. Johnson–Cook constitutive model constants for AISI4140 [24]
A [MPa] B [MPa] C n m T0 [°C] Tm [°C]106 1167 0.0352 0.1424 0.763 20 1547
principal stress, is the effective stress, εf is the limit fracture strain and εpl is the plastic strain.
Next, Coulomb’s law was utilized to model the friction situation at the tool-workpiece interface. The interaction between two bodies that are under very high contact pressure is a complex problem in machining processes; although more advanced models are available in the literature, Coulomb’s friction model provides a good approximation of the friction forces that develop during sliding zone, which is important when studying machining processes. Eq. (3) [26] can be used to estimate the frictional stresses defined by Coulomb’s law.
� ��f n� , (3)
where τf is the frictional shear stress, μ is the shear friction coefficient and σn is the tool–chip interface stress. In the present investigation, the value of the shear friction coefficient was taken equal to 0.577 according to Astakhov [26].
2 RESULTS AND DISCUSSION
2.1 FE Evaluation of the Machining Force Components
Figs. 3a, 3b, and 3c illustrate the force versus time diagrams of the three components (Fr, Ft and Fa) of the main machining force that were generated during AISI 4140 hard turning with the next cutting parameters: Vc = 150 m/min, f = 0.14 mm/rev and ap = 0.30 mm. It is pointed out that all three forces increase rapidly until steady state is achieved; then at about 0.011 s, force values plummet, which means that the insert reached the other end of the workpiece and material

Strojniški vestnik - Journal of Mechanical Engineering 66(2020)7-8, 467-478
472 Tzotzis, A. – García-Hernández, C. – Huertas-Talón, J.L. – Kyratsis, P.
Fig. 3. a), b) and c) FE model sample results for turning forces, and d) chip formation
Fig. 4. Comparison between simulated and experimental turning forces

Strojniški vestnik - Journal of Mechanical Engineering 66(2020)7-8, 467-478
4733D FE Modelling of Machining Forces during AISI 4140 Hard Turning
is in accordance with the estimated experimental one with a relative error of about -9.1 % to 9.4 %
It can also be observed that the dominant of the three components is the radial force which eventually affects the resultant cutting force the most (Fig. 4d), in contrast to the effect of the feed force, which is subtle. Furthermore, the resultant cutting forces are of the same magnitude with those found in the work of Gaitonde et al. [27] during the turning of AISI D2 at the same cutting conditions and similar ceramic tools (CC650WG). Additionally, it was found that any increase in the feed rate boosts the cutting forces considerably. Aouici et al. [23] and [28] presented results close to those available in this investigation, for turning of AISI 4140 and AISI D3 steel respectively, with similar cutting tools (CC6050) and identical cutting conditions. In contrast, it is noted that increasing the cutting speed usually leads to a decrease in all three force components (Fr, Ft and Fa). Finally, the depth of cut has the greatest influence on cutting forces, which is reported as well in the literature [23], [28] and [29]. Specifically, the cutting forces increase significantly as the cutting insert goes deeper into the material. The findings of this study are discussed in detail in Section 2.2.
2.2 Modelling of the Resultant Cutting Force Based on Statistical Methods
After the completion of the 27 simulation runs, it is concluded that the increased percentage of agreement between the experimental and the numerical values is preserved throughout the testing (see Table 3). Thus, a statistical model is feasible so that future experiments for different depths of cut and similar machining conditions can be minimized. The RSM was employed in this study to develop the proposed statistical model for prediction purposes of the main cutting force during AISI 4140 hard turning. RSM is a well-established methodology that is often used to optimize process conditions or determine the interaction between multiple factors. Additionally, it provides concise presentation of results. This methodology was successfully utilized in many studies related to machining processes such as turning and drilling [4], [15] and [30] to [32]; therefore, it was selected for the current work. Based on the parameters involved (see Table 1) and the number of simulation runs, a full factorial design with three factors was realized. Because the relationship between the variables and the output in this study is anticipated to be non-linear, the regression model can be described with a second-order polynomial, as seen in Eq. (4). This polynomial
includes linear, quadratic, and interactive terms: Y is the output of the model, thus the main machining force, in this case, Xi are the coded values (cutting speed, feed and depth of cut) and bi are the vectors that contain the regression coefficients.
Y b b X b X b X b X b X
b X b X X b X X b X X
� � � � � �
� � � �0 1 1 2 2 3 3 4 1
25 2
2
6 32
7 1 2 8 1 3 9 2 3.. (4)
Eq. (5) presents the complete statistical model for the resultant machining force based on the aforementioned formula and the data of the verified FE model (see Table 3).
F V f ap
V f apmain � � � � �
� � � �
112 2 0 566 820 422 1
0 0007421860
2125
20
. . .
. ..
. ,
67
0 708 3124
VfVap fap� � (5)
where Fmain is the resultant machining force in N, V is the cutting speed in m/min, f is the feed in mm/rev and ap is the depth of cut in mm.
The design of experiments (see Table 3) contains the estimation of the resultant cutting force for all 27 combinations of machining parameters, derived from the experiments [23], the simulations and the statistical model. The comparison of these results shows an increased correlation. Specifically, the highest level of agreement between the numerical values and the experimental ones is observed in the test number 26 (relative error 0.2 %), whereas the lowest in test number 19 (relative error 12.4 %). Between the values obtained from the regression model and the numerical values, test number 19 yielded an agreement of almost 100 %. In contrast, the lowest level of accordance (91.2 %) was found to be in the first test. Eventually, for the comparison case between the statistical values and the experimental ones, a high correlation is highlighted with a mean absolute percentage error of approximately 4.6 %. Furthermore, the best level of agreement (99.6 %) was achieved in the second test, whereas the worst (86.6 %) in the first one. By observing Table 3 and the charts of Fig. 4, the following statements can be made for the FE model:• The radial force is the dominant of the three
components.• Higher values of feed rate affect all forces, but
the tangential force is affected the most due to the increase of the sheared chip region.
• The depth of cut has a strong impact on all machining forces as anticipated; as the tool cuts deeper in the material, the tool-workpiece contact length increases. For instance, the main cutting force increases approximately 43.6 % (from

Strojniški vestnik - Journal of Mechanical Engineering 66(2020)7-8, 467-478
474 Tzotzis, A. – García-Hernández, C. – Huertas-Talón, J.L. – Kyratsis, P.
223.4 N to 320.7 N) for the same conditions (Vc = 150 m/min, f = 0.14 mm/rev) and an increase in depth of cut from 0.20 mm to 0.30 mm.
• Lastly, as cutting speed rises, the turning forces decrease in most cases, so does the main cutting force. For example, at ap = 0.30 mm, f = 0.14 mm/rev and Vc = 150 m/min, 115 m/min and 80 m/min the resultant force is equal to 320.7 N, 301.5 N and 284.5 N respectively. The primary reason for this tendency is that an increase in temperature at the shear plane region, resulting in the plastic softening of the deformation zone which ultimately lowers the shear strength of the material.Fig. 5 illustrates the relative error percentage
between the values of resultant machining force derived from the regression model and the experiments, as well as between the regression model and the simulations. The graph indicates that both lines follow a similar trend with the exception of two
points (tests number 6 and 19) where more abrupt increase in experimental values occurred.
Fig. 5. Relative error comparison between simulations and experiments
Moreover, the maximum error was found to be -13.4 % and -8.8 % for the regression versus
Table 3. Main machining force comparison between experimental, simulated and statistical values
Std OrderCutting parameters Fmain [N]
Vc [m/min] f [mm/rev] ap [mm] Experiments FE model Regression model
1 80 0.08 0.10 59.9 56.9 51.92 115 0.08 0.10 67.5 69.0 73.63 150 0.08 0.10 76.0 79.5 92.04 80 0.11 0.10 76.3 73.9 67.25 115 0.11 0.10 91.5 89.7 88.36 150 0.11 0.10 92.4 99.6 106.07 80 0.14 0.10 94.2 88.4 80.88 115 0.14 0.10 97.5 102.2 101.19 150 0.14 0.10 121.3 119.5 118.1
10 80 0.08 0.20 116.1 118.2 128.511 115 0.08 0.20 134.3 142.8 159.612 150 0.08 0.20 152.2 163.1 187.413 80 0.11 0.20 154.2 164.1 146.314 115 0.11 0.20 172.2 178.4 176.815 150 0.11 0.20 186.5 189.2 203.816 80 0.14 0.20 177.3 189.7 162.417 115 0.14 0.20 208.6 206.1 192.118 150 0.14 0.20 227.3 223.4 218.519 80 0.08 0.30 189.8 207.7 207.620 115 0.08 0.30 225.7 232.1 248.121 150 0.08 0.30 238.0 249.6 285.322 80 0.11 0.30 244.6 250.2 227.923 115 0.11 0.30 264.1 266.2 267.724 150 0.11 0.30 267.7 281.2 304.225 80 0.14 0.30 282.3 284.5 246.426 115 0.14 0.30 300.9 301.5 285.527 150 0.14 0.30 316.9 320.7 321.3

Strojniški vestnik - Journal of Mechanical Engineering 66(2020)7-8, 467-478
4753D FE Modelling of Machining Forces during AISI 4140 Hard Turning
experiments and the regression versus simulations, respectively (test number 1 for both cases). In contrast, the lowest value of error was determined to be -0.4 % (test 2) for the regression versus experiments and close to zero (test 19) for the regression versus simulations. Finally, the mean absolute percentage error was estimated 2 % for the regression versus simulations case and 4.6 % for the regression versus experiments case.
2.3 Validation of the Statistical Model
Due to the number of independent variables taken into account in current research, the validity of the fit was analysed with ANOVA. A standard confidence level of 95 % was used for all intervals throughout the analysis, which revealed a successful fit of the model with an adjusted R-squared of 99.72 %. Furthermore, according to the significance level of 0.05 and to Table 4 the terms that contribute the most to the model are the ap and the f×ap with a p-value equal to 0.000, as well as the constant with p = 0.005. Last but not least, V×ap and f have great impact on the model with p-values of 0.060 and 0.089 respectively, even though are higher than 0.05. The sum of squares and the degrees of freedom for the analysis are included in Table 4. With the total sum of squares which is the sum of squared deviations due to each of the nine factors and the sum of squares attributed to the error, it is possible to determine the dispersion of data points. In addition, the mean square is the ratio of the sum of squares to the degree of freedom and the f-value is
the ratio of the mean square of the regression model to the mean square of residual error. Lastly, the fact that the p-value of the regression was estimated 0.000 indicates the very high correlation of the model and eliminates the probability of yielding unusual results.
With the validation of goodness of fit, a residual analysis was performed to check the accuracy of the model. The graphs that are illustrated in Fig. 6 proves that the model has very good accuracy. In particular, the normal probability plot (Fig. 6a) shows a normality in the distribution of the residuals with no serious departures from the straight line. Additionally, the residuals versus the fitted values (Fig. 6b) indicate a constant variance of the residuals since they are almost evenly scattered on both sides of the reference line. The overall normality is present in the residuals versus the order graph also (Fig. 6d). It is observed that there are no systematic faults, and the residuals are independent of one another. Eventually, the normality in the distribution of the error percentages can be displayed in the error histogram (Fig. 6c) and proved by the fit line.
The analysis of the developed prediction model was carried out with the aid of 3D response surface plots for visualizing the data gathered from Fig. 4 and Table 3. That is, the combined effect of the machining conditions and the depth of cut on the generated radial, tangential and feed forces were investigated. Fig. 7 illustrates the plotted 3D surfaces for each depth of cut value based on the polynomial solutions. The cutting speed and the feed are the input parameters of the polynomial with values within the investigated range,
Table 4. ANOVA results for the main machining force
Source Degree of freedom Sum of squares Mean square f-value p-valueRegression 9 165668 18407.6 1012.4 0.000
Residual error 17 309 18.2Total 26 165977
R-sq (adj) = 99.72 %
Term PE Coefficient SE Coefficient f-value p-valueConstant −112.8 35.1 −3.19 0.005
V 0.566 0.359 1.58 0.134
f 820 455 1.80 0.089
ap 422.1 92.9 4.55 0.000
V2 −0.00074 0.00142 −0.52 0.609
f2 −1860 1934 −0.96 0.350
ap2 125 174 0.72 0.482
V×f −0.67 1.17 −0.57 0.574
V×ap 0.708 0.352 2.01 0.060
f×ap 3124 410 7.61 0.000

Strojniški vestnik - Journal of Mechanical Engineering 66(2020)7-8, 467-478
476 Tzotzis, A. – García-Hernández, C. – Huertas-Talón, J.L. – Kyratsis, P.
hence 80 m/min to 150 m/min for cutting speed (step of 10 m/min) and 0.08 mm/rev to 0.14 mm/rev for feed (step of 0.01 mm/rev). According to Fig. 7 it is concluded that: • The depth of cut affects the resultant machining
force significantly; as the depth of cut increases, so does the force.
• Similarly, higher values of feed have a great impact on the main machining force.
• Eventually, even though higher cutting speeds result in lowering the machining force, the effect is limited.
Fig. 7. 3D plots of the Fmain for each depth of cut
Conclusively, six extra simulation runs were accomplished to further validate the prediction model of Fmain by utilizing randomly selected conditions
from within the range of the data employed in this study, forming the following sets: I, II and III with Vc = 100 m/min, f = 0.12 mm/rev and ap = 0.15 mm, 0.25 mm and 0.30 mm respectively. IV, V and VI with Vc = 130 m/min, f = 0.10 mm/rev and ap = 0.15 mm, 0.25 mm and 0.30 mm respectively. The results are presented in Table 5, in which it is highlighted that the relative error is low for all cases.
Table 5. Confirmation of prediction model for Fmain
SetSimulated
Fmain [N]
Predicted
Fmain [N]Relative error
[%]
I 147.8 133.6 −9.61II 239.3 225.3 −5.85III 260.4 272.2 4.53IV 140.5 130.4 −7.19V 233.8 218.0 −6.76VI 248.9 262.8 5.58
3 CONCLUSIONS
In this study, the development of a 3D FE model, as well as a prediction model for the main machining force induced during hard turning of AISI 4140, were presented. A series of 27 3D simulations were conducted under different conditions of cutting speed and feed in addition to the three different depths of cut. The obtained numerical results were validated via experimental values that are available in the literature,
Fig. 6. Residual analysis graphs: a) probability plot, b) residuals versus fitted values, c) error histogram, and d) residuals versus order

Strojniški vestnik - Journal of Mechanical Engineering 66(2020)7-8, 467-478
4773D FE Modelling of Machining Forces during AISI 4140 Hard Turning
and it was observed that are in high agreement that surpasses 90 % in most of the runs. The accuracy (8.8 %) and goodness of fit of the statistical model, dictate that both the developed models (FE and statistical) can securely predict the resultant machining forces when applied within the scope of this study. In conclusion, the following remarks are pointed out:• Higher values of depth of cut and feed rate
significantly increase machining forces, especially the depth of cut is the factor that effects Fmain the most. Specifically, according to the simulated values of Fmain (see Table 3), an average increase of about 104 % in the resultant cutting force is observed when the depth of cut changes from 0.10 mm to 0.20 mm. The equivalent shift from 0.20 mm to 0.30 mm amplifies Fmain by approximately 50 %.
• Similarly, when feed changes from 0.08 mm/rev to 0.11 mm/rev and from 0.11 mm/rev to 0.14 mm/rev, the resultant cutting force gains an increase of about 24 % and 16 % respectively.
• In contrast, the generated forces decrease as cutting speed increases; however, the changes induced by cutting speed are trivial compared to the ones caused by the depth of cut and feed. The average percentage of decrease observed in Fmain, is estimated at approximately 10 % when cutting speed shifts from 150 m/min to 115 m/min. Additionally, as the value of Vc lowers from 115 m/min to 80 m/min, the Fmain decreases ny about 13 % on average.
• The factors that have great impact on the statistical model based on the significance level are: ap, f×ap, constant, V×ap and f.
4 REFERENCES
[1] Hu, H.-J., Huang, W.-J. (2014). Tool life models of nano ceramic tool for turning hard steel based on FEM simulation and experiments. Ceramics International, vol. 40, no. 7, Part A, p. 8987-8996, DOI:10.1016/j.ceramint.2014.01.095.
[2] Davim, J.P., Figueira, L. (2007). Machinability evaluation in hard turning of cold work tool steel (D2) with ceramic tools using statistical techniques. Materials & Design, vol. 28, no. 4, p. 1186-1191, DOI:10.1016/j.matdes.2006.01.011.
[3] Asiltürk, I., Akkuş, H. (2011). Determining the effect of cutting parameters on surface roughness in hard turning using the Taguchi method. Measurement, vol. 44, no. 9, p. 1697-1704, DOI:10.1016/j.measurement.2011.07.003.
[4] Mia, M., Dhar, N.R. (2016). Response surface and neural network based predictive models of cutting temperature in hard turning. Journal of Advanced Research, vol. 7, no. 6, p. 1035-1044, DOI:10.1016/j.jare.2016.05.004.
[5] Quiza, R., Figueira, L., Davim, J.P. (2008). Comparing statistical models and artificial neural networks on predicting the tool wear in hard machining D2 AISI steel. International Journal of Advanced Manufacturing Technology, vol. 37, no. 7-8, p. 641-648, DOI:10.1007/s00170-007-0999-7.
[6] Gaitonde, V.N., Karnik, S.R., Figueira, L., Davim, J.P. (2011). Performance comparison of conventional and wiper ceramic inserts in hard turning through artificial neural network modeling. International Journal of Advanced Manufacturing Technology, vol. 52, no. 1-4, p. 101-114, DOI:10.1007/s00170-010-2714-3.
[7] Klocke, F., Raedt, H.-W., Hoppe, S. (2001). 2D-FEM simulation of the orthogonal high speed cutting process. Machining Science and Technology, vol. 5, no. 3, p. 323-340, DOI:10.1081/MST-100108618.
[8] Yen, Y.-C., Söhner, J., Weule, H., Schmidt, J., Altan, T. (2002). Estimation of tool wear of carbide tool in orthogonal cutting using FEM simulation. Machining Science and Technology, vol. 6, no.3, p. 467-486, DOI:10.1081/MST-120016256.
[9] Arrazola, P.J., Villar, A., Ugarte, D., Marya, S. (2007). Serrated chip prediction in finite element modeling of the chip formation process. Machining Science and Technology, vol. 11, no. 3, p. 367-390, DOI:10.1080/10910340701539882.
[10] Agmell, M., Ahadi, A., Ståhl, J.-E. (2013). The link between plasticity parameters and process parameters in orthogonal cutting. Procedia CIRP, vol. 8, p. 224-229, DOI:10.1016/j.procir.2013.06.093.
[11] Yameogo, D., Haddag, B., Makich, H., Nouari, M. (2017). Prediction of the cutting forces and chip morphology when machining the Ti6Al4V alloy using a microstructural coupled model. Procedia CIRP, vol. 58, p. 335-340, DOI:10.1016/j.procir.2017.03.233.
[12] Wan, L., Wang, D., Gao, Y. (2015). Investigations on the effects of different tool edge geometries in the finite element simulation of machining. Strojniški vestnik - Journal of Mechanical Engineering, vol. 61, no. 3, p. 157-166, DOI:10.5545/sv-jme.2014.2051.
[13] Attanasio, A., Ceretti, E., Rizzuti, S., Umbrello, D., Micari, F. (2008). 3D finite element analysis of tool wear in machining. CIRP Annals, vol. 57, no. 1, p. 61-64, DOI:10.1016/j.cirp.2008.03.123.
[14] Hu, H.-J., Huang, W.-J. (2013). Effects of turning speed on high-speed turning by ultrafine-grained ceramic tool based on 3D finite element method and experiments. International Journal of Advanced Manufacturing Technology, vol. 67, no. 1-4, p. 907–915, DOI:10.1007/s00170-012-4535-z.
[15] Malakizadi, A., Gruber, H., Sadik, I., Nyborg, L. (2016). An FEM-based approach for tool wear estimation in machining. Wear, vol. 368-369, p. 10-24, DOI:10.1016/j.wear.2016.08.007.
[16] Arisoy, Y., Özel, T. (2015). Prediction of machining induced microstructure in Ti-6Al-4V alloy using 3-D FE-based simulations: Effects of tool micro-geometry, coating and cutting conditions. Journal of Materials Processing Technology, vol. 220, p. 1-26, DOI:10.1016/j.jmatprotec.2014.11.002.
[17] Vijayaraghavan, V., Garg, A., Gao, L., Vijayaraghavan, R., Lu, G. (2016). A finite element based data analytics approach for modeling turning process of Inconel 718 alloys. Journal of

Strojniški vestnik - Journal of Mechanical Engineering 66(2020)7-8, 467-478
478 Tzotzis, A. – García-Hernández, C. – Huertas-Talón, J.L. – Kyratsis, P.
Cleaner Production, vol. 137, p. 1619-1627, DOI:10.1016/j.jclepro.2016.04.010.
[18] Rami, A., Kallel, A., Sghaier, S., Youssef, S., Hamdi, H. (2017). Residual stresses computation induced by turning of AISI 4140 steel using 3D simulation based on a mixed approach. International Journal of Advanced Manufacturing Technology, vol. 91, no. 9-12, p. 3833-3850, DOI:10.1007/s00170-017-0047-1.
[19] Guo, Y. B. and Liu, C. R. (2002). 3D FEA modeling of hard turning. Journal of Manufacturing Science and Engineering, vol. 124, no. 2, p. 189-199, DOI:10.1115/1.1430678.
[20] Özel, T., Karpat, Y., Srivastava, A. (2008). Hard turning with variable micro-geometry PcBN tools. CIRP Annals, vol. 57, no. 1, p. 73-76, DOI:10.1016/j.cirp.2008.03.063.
[21] Lian, Y.-S., Mu, C.-L., Liu, M., Chen, H.-F., Yao, B. (2019). Three-dimensional numerical simulation of soft/hard composite-coated textured tools in dry turning of AISI 1045 steel. Advances in Manufacturing, vol. 7, no. 2, p. 133-141, DOI:10.1007/s40436-019-00249-2.
[22] Magalhães, F.C., Ventura, C.E.H., Abrão, A.M., Denkena, B. (2020). Experimental and numerical analysis of hard turning with multi-chamfered cutting edges. Journal of Manufacturing Processes, vol. 49, p. 126-134, DOI:10.1016/j.jmapro.2019.11.025.
[23] Aouici, H., Elbah, M., Yallese, M.A., Fnides, B., Meddour, I., Benlahmidi, S. (2016). Performance comparison of wiper and conventional ceramic inserts in hard turning of AISI 4140 steel: analysis of machining forces and flank wear. International Journal of Advanced Manufacturing Technology, vol. 87, no. 5-8, p. 2221-2244, DOI:10.1007/s00170-016-8567-7.
[24] Scientific Forming Technologies Corporation. DEFORM V11.3 (PC) (2016). Documentation. SFTC, Columbus.
[25] Mirghasemi, S.M., Eivani, A.R., Seyedein, S H., Jafarian, H.R. (2018). A comparison between routine vs. normalized Cockroft-Latham fracture criteria for prediction of fracture during equal channel angular pressing. Engineering
Fracture Mechanics, vol. 199, p. 721-729, DOI:10.1016/j.engfracmech.2018.07.016.
[26] Astakhov, V.P. (2006). Tribology of Metal Cutting, Elsevier, Amsterdam.
[27] Gaitonde, V.N., Karnik, S.R., Figueira, L., Davim, J.P. (2009). Analysis of machinability during hard turning of cold work tool steel (type: AISI D2). Materials and Manufacturing Processes, vol. 24, no. 12, p. 1373-1382, DOI:10.1080/10426910902997415.
[28] Aouici, H., Bouchelaghem, H., Yallese, M.A., Elbah, M., Fnides, B. (2014). Machinability investigation in hard turning of AISI D3 cold work steel with ceramic tool using response surface methodology. International Journal of Advanced Manufacturing Technology, vol. 73, p. 1775-1788, DOI:10.1007/s00170-014-5950-0.
[29] Lalwani, D.I., Mehta, N.K., Jain, P.K. (2008). Experimental investigations of cutting parameters influence on cutting forces and surface roughness in finish hard turning of MDN250 steel. Journal of Materials Processing Technology, vol. 206, no. 1-3, p. 167-179, DOI:10.1016/j.jmatprotec.2007.12.018.
[30] Çiçek, A., Kıvak, A., Samtaş, T., Çay, G. (2012). Modelling of thrust forces in drilling of AISI 316 stainless steel using artificial neural network and multiple regression analysis. Strojniški vestnik - Journal of Mechanical Engineering, vol. 58, no. 7-8, p. 492-498, DOI:10.5545/sv-jme.2011.297.
[31] Efkolidis, N. García-Hernández, C., Huertas-Talón, J.L., Kyratsis, P. (2018). Modelling and prediction of thrust force and torque in drilling operations of Al7075 using ANN and RSM methodologies. Strojniški vestnik - Journal of Mechanical Engineering, vol. 64, no. 6, p. 351-361, DOI:10.5545/sv-jme.2017.5188.
[32] Tzotzis, A., García-Hernández, C. Huertas-Talón, J.L., Kyratsis, P. (2020). FEM based mathematical modelling of thrust force during drilling of Al7075-T6. Mechanics & Industry, vol. 21, no. 4, p. 1-14, DOI:10.1051/meca/2020046.