Embed Size (px)
Citation preview

3D Computer Vision for Tooth Restoration
CONTENTS
1 Introduction 1
2 Manual and semi–automatic tooth reconstruction 2
3 Tooth Reconstruction by Computer Vision 4
4 Feature Detection from Occlusal Surfaces (5) 6
5 Automatic Tooth Restoration via Image Warping 95.1 Feature detection . . . . . . . . . . . . . . . . . . . . . . . . . . . . . . . . . . . . . . . . . . . . . . . . . . . 95.2 Feature Matching . . . . . . . . . . . . . . . . . . . . . . . . . . . . . . . . . . . . . . . . . . . . . . . . . . . 105.3 Image Warping and Height Adjustment . . . . . . . . . . . . . . . . . . . . . . . . . . . . . . . . . . . . . . . 115.4 Results . . . . . . . . . . . . . . . . . . . . . . . . . . . . . . . . . . . . . . . . . . . . . . . . . . . . . . . . . 12
6 Tooth Surface Representation 126.1 Active Measurement . . . . . . . . . . . . . . . . . . . . . . . . . . . . . . . . . . . . . . . . . . . . . . . . . 136.2 Surface Fitting . . . . . . . . . . . . . . . . . . . . . . . . . . . . . . . . . . . . . . . . . . . . . . . . . . . . 136.3 Data Fusion . . . . . . . . . . . . . . . . . . . . . . . . . . . . . . . . . . . . . . . . . . . . . . . . . . . . . . 156.4 Results . . . . . . . . . . . . . . . . . . . . . . . . . . . . . . . . . . . . . . . . . . . . . . . . . . . . . . . . . 15
7 Conclusion 15
Source: /home/paulus/text/papers/tooth/mia/RCS/miapaper.tex,vRev.: 1.4

Medical Image Analysis (13th January 1998) volume 1.4, number wolf, pp 1–18c
�Oxford University Press
3D Computer Vision for Tooth Restoration
D. Paulus1 � , M. Wolf2, S. Meller2 and H. Niemann2
1Lehrstuhl fur Mustererkennung (Informatik 5)Universitat Erlangen–Nurnberg,Martensstr. 3, 91058 Erlangen, Germany
2Bayerisches Forschungszentrum fur Wissensbasierte Systeme (FORWISS)Forschungsgruppe WissensverarbeitungAm Weichselgarten 7, 91058 Erlangen, Germany
Abstract
If a person with carious lesions needs or requests crowns or inlays, these dental fillings have to bemanufactured for each tooth and each person individually. We survey computer vision techniqueswhich can be used to automatize this process. We introduce three particular applications whichare concerned with the reconstruction of surface information. The first one aims at building up adata base of normalized depth images of posterior teeth and at extracting characteristic featuresfrom these images. In the second application, a given occlusal surface of a posterior tooth with aprepared cavity is digitally reconstructed using an intact model tooth from a given data base. Thecalculated surface data can then be used for automatic milling of a dental prosthesis, e.g. from apreshaped ceramic block. In the third application a hand–made provisoric wax inlay or crown canbe digitally scanned by a laser sensor and 3D–copied into a different material such as ceramics.The results are converted to a format required by the CIM system for automatic milling.
Keywords: dental images, teeth, image processing, segmentation, range images, 3D reconstruc-tion, computer vision
Received 06/02/97; revised 09/24/97; accepted 12/05/97
1. INTRODUCTION
The need for automatic tooth restoration systems is currentlyrising due to the growing public awareness of the toxicityof hand–made amalgam fillings and the financial crisis inpublic health care to be observed in may countries. Existingdental chair–site equipment for tooth restoration still requiresa fair amount of precious time and manual contribution ofthe dentist and is currently restricted to smaller inlays and
�Corresponding author
(e-mail: [email protected] work was partially funded by “Deutsche Forschungsgesellschaft”(DFG))
veneers.An integrated “Digitized Dental Office”, as it is now com-
mercially advertised, which allows for a complete automaticmeasurement of cavities and prepared teeth, and which thenautomatically constructs the required inlay or onlay, is stillonly a perspective for the future.
Automatic processing of dental images and automation ofcomplex and time–consuming dental tasks is of particularinterest for computer vision and computer science. This topicoffers a variety of scientific challenges; some of them will bediscussed in the following.
In prosthetic dentistry, the general problem in dental im-ages is to reconstruct or estimate surfaces, even if there is

2 D. Paulus, M. Wolf, S. Meller and H. Niemann
incomplete input data in the images, such as in the case ofcavities which have to be filled and for which the surfacehas to be modeled such that the estimated original shape isapproximated. It is desirable that the machine produces anoutput for the computed data which can be used for automaticmanufacturing, e.g. of an inlay.
Upper Jaw Lower Jaw
4
6
7
8
1
5
6
12 2
33
4
5 5
6
7 7
8 8
7
8
5
3 32 21 1
4 4
6
Figure 1. Upper and lower jaw of a human. Each jaw is divided intoa left and a right half. Each half consists of 8 teeth. 1, 2: incisors, 3:cuspids, 4, 5: bicuspids, 6, 7, 8: molars
We now briefly introduce the medical terminology to beused in the following, and also describe the relevant anatomy.The human jaws and the medical names of the teeth aredepicted in Figure 1. The complete upper surface used forchewing of the back teeth is called the “occlusal surface”.The high points on the occlusal surfaces of the back teeth(posterior teeth or molars) are called “cusps”. The trenchesare called “fissures”. The silver filling traditionally used to fillcavities is called amalgam. Restorations that are used on theocclusal surface of the posterior teeth are called inlays. Inlaysare an alternative to amalgam fillings. The first, second, andthird molars, those are the sixth, seventh and eighth teeth fromthe center of the mouth to the back of the mouth. They are alsocalled back teeth and have 4 or 5 cusps and thus two fissureswhich are approximately orthogonal. The medical descriptionof the cusps for a first upper molar are shown in Figure 2.
In Sect. 2 we survey the work flow in a dental officeand relate the various steps to computer vision and computerscience problems. Industrial solutions already exist for auto-matic manufacturing of tooth restorations made of ceramics.We give some details and restrictions of those technicalsystems which use optical measurements.
The state of the art of those fields of computer vision whichare related to surface reconstruction and that are relevant fordentistry is described in Sect. 3.
The first step of automatization is a CAD–modeling of therestoration. A system for a semi-automatic design of toothrestorations is presented in Sect. 5 based on (Meller, 1996).From a library of digitized intact tooth surfaces the mostsuited model tooth is chosen in order to copy the missingsurface part from it. Before this can be done its shape is
x
z
disto-buccalmesio-buccal
y
disto-palatal
mesio-palatal
Figure 2. Position and description of the cusp tips and the coordinateaxes for an upper molar
fitted to the prepared tooth making use of image warpingtechniques.
A major prerequisite for this approach is a library ofnormalized intact tooth surfaces. In Sect. 4 we propose amethod based on (Wolf, 1994) to build up such a library forposterior teeth and to extract features from the tooth surfaceswhich are appropriate for a data base query.
An alternative step to automatization is the modeling ofa provisional tooth restoration by hand in wax and the auto-matic milling of this restoration from a preshaped block ofceramics. In Sect. 6 we present a system based on (Kuppers,1995): A laser sensor is used to measure 3D–data from inlaymodels moulded in wax by a human operator and the 3D–data are then converted to a commonly used CAD/CIM dataformat. Sect. 7 concludes the contribution.
2. MANUAL AND SEMI–AUTOMATIC TOOTHRECONSTRUCTION
Medical treatment of teeth mostly takes place in the dentist’soffice. In addition to the dentist himself, several people areinvolved in this process. Whereas in the year 1913 such aroom looked as in Figure 3, today only the dentist and anassistant will be in the room with the patient. The followingvision for forthcoming computer applications in dental careillustrates the goals of future developments in this field:
“Imagine a dentist of the year 2000 deciding tomake a crown for a patient. After conventionallypreparing the cavity, an optical imprint of theprepared tooth and the jaw is recorded with aminiature camera and directly sent to the computer.The image data is then transformed into 3D data.The relation to the antagonistic teeth is calculated

3D Computer Vision for Tooth Restoration 3
Figure 3. Dentist department of Leipzig university 1913 (from acatalog of Reiniger, Gebbert & Schall, Erlangen 1913)
and the chewing movement is simulated with thegeometry of the other teeth. A model tooth froma data base is projected into this environment andadapted to the surface of the antagonist. Errors ofthe manual preparation are automatically correctedand the form of the tooth is optimized. After deter-mining the material, a CNC–program is generatedand the crown is ground within a few minutes. Theinsertion of the crown and the inspection can bedone during the same appointment. Only the dentaltechnician is left standing.” (Stoll and Stachniss,1990)
However, although great progress has been done in thisdirection (as we will show in Sect. 2), the dentist’s chair willnot be taken over by robots within the near future. Up to now,computers have only fulfilled administrative tasks in dentalpractices. They are now about to find their way directly intothe work flow of the dentist. Among medical expert systemsproviding decision support for treatment planning, imageprocessing capabilities become more and more important.Today, dentists can already use computer support for anautomatic evaluation of X–ray images, the measurement oftooth root canals (Verdonschot et al., 1990; Youngson et al.,1995), tooth root surfaces or marginal fits of crowns, inlays,marginal leakages (Grieve et al., 1993; Youngson, 1992),assisted reconstruction of fissures (Hirano and Aoba, 1995),diagnosis of approximal caries (Heaven et al., 1994), etc. Incombination with tomographic imaging devices, computersare used for planning of maxillo–facial–surgery (Keeve et al.,
1996), or in combination with X–rays and photographs forplanning of orthodontic surgery (Faulhaber et al., 1996). Inanother application 3D images of wax wavers, based on theabsorption of light by a dispersive medium, are used to detectmalocclusion and other dental abnormalities (Laurendeauet al., 1991).
The restoration of damaged teeth now offers another fieldof work for computers in dental practices. Today, the commonway of reconstructing teeth with carious lesions are hand–made fillings made of amalgam or composite materials, orinlays, onlays and crowns made of gold or ceramics. Thedemand for amalgam fillings is currently decreasing due toits supposed toxicity, whereas tooth–colored restorations be-come more popular. Composite materials can only be appliedto very small defects, but ceramics is suitable for restorationsof various sizes.
The traditional and still common way of manufacturingdental restorations from ceramics takes at least two visitsat the dentist’s. First the tooth is prepared by the dentistfor an inlay insertion. Then negative imprints of the upperand lower jaw are generated. Afterwards, a positive plastermodel of the jaw is modeled by a dental technician —another person involved in the manufacturing process whichmakes the procedure more expensive. In most of the cases,the tooth surface is then manually reconstructed with waxand precisely adjusted to the opposing teeth by simulatingthe movements of the jaw with the help of a so calledarticulator. The provisional wax inlay is then used to form andmanufacture the ceramic inlay. It has to be considered thatthe size of the ceramic inlay shrinks during the firing process.The remaining gap has to be filled with low viscosity lutingmaterials with reduced mechanical properties which decreasethe life–time of the reconstructions. The whole procedurerequires high training skills.
In order to reduce the manual effort, CIM–systems havebeen developed which allow the fabrication and insertionof restorations from ceramics in one appointment. The firsttask to be solved is to replace the conventional hand–madeimpressions by a technical method that generates a 3D–representation of the relevant parts of the tooth in computermemory. We will survey such methods as well as variousforms of representations in Sect. 3. The 3D–representationthen has to be analyzed to design the shape of the restorationto be produced. This process still requires manual interactionsbut it is strongly supported by the computer. The designedshape is converted into a data format suitable for CNC–machines that can grind the inlay from a preshaped block ofceramics within a few minutes.
However, complex solutions which reconstruct the dam-aged occlusal surface from simulated movements of the jawand usage of the opposite teeth for modeling the required

4 D. Paulus, M. Wolf, S. Meller and H. Niemann
surface, are not expected to be available for clinical use withinthe next few years; neither are fully automatic systems to beexpected which require no human interaction or correction.
Dental restorations made of ceramics can be fabricated byCNC–machines in great detail. The question remains how theshape of the restorations can be determined. One possibilityis a CAD–modeling of the restoration on the screen, after theprepared tooth has been scanned.
A system working this way is the CerecR system(Mormann and Brandestini, 1989). An optical imprint of theprepared tooth is taken intraorally with a sensor that producesrange images of the tooth surface (see below, Sect. 3).Whereas the shape of the inlay inside the cavity can becalculated directly from the range data, the chewing surfaceis shaped manually in a CAD system on the screen. The inlaycan then be ground by an NC–machine from a raw block ofceramics. Usually the produced inlay needs some correctionswith a diamond drill to achieve a smooth continuation of theoriginal tooth surface and to fulfill the requirements of thechewing process, which takes precious time and unavoidablyremoves healthy substance from the tooth.
Two other systems have been published as patent descrip-tions, although no physical implementation is known to theauthors yet. Both use affine transformations of a 3D–modeltooth to adapt it to the given tooth and they mainly considerthe production of crowns instead of inlays and onlays for agiven incomplete tooth surface (Rekow, 1993; Duret, 1988a).
Another method is presented in (Gurke, 1997) where adeformable 3D tooth model is adapted to intact model teeth inan energy minimizing process. It is planned to use this modelto restore missing surface parts in future developments.
The system advertised by Andersona promises a completedigital dental office which consists of a camera mountedon a flexible arm, an image analysis system, and a systemfor manufacturing inlays to appear on the market in nearfuture. The camera device uses a LED to light the teethand to capture a 3–D image with an accuracy of 15µm. Aninteractive procedure allows for the in–office fabrication ofinlays, onlays, and bridges.b
Most of these systems are based on a library of modelteeth. Explicitly represented features of tooth surfaces arerequired to choose the best model tooth from such a library.
aAnderson, P. (1996). Digitizing the dental office: Economical 3-D imagingthat could change procedures. Advanced Imaging, pp. 76–77.bDetails on the system and scientific statements about the accuracy and thereliability were not available to the authors at the time of writing.
3. TOOTH RECONSTRUCTION BY COMPUTERVISION
In this section we describe various methods for 3D–measuring of tooth surfaces and different forms of represen-tations. We also sketch directions of further processing ofthe generated data. In the following we only briefly surveythe principles for visual measurements; a more completeoverview is given in e.g. (Faugeras, 1993). A comparison ofdifferent optical and mechanical methods for measurement indentistry can be found in e.g. (Lappe, 1996). Some forms of3D–representations of surfaces are presented; a thoroughfulltreatment of this subject can be found in e.g. (Faugeras, 1993;Stevenson and Delp, 1993)
Methods to gain 3D information from objects exist indifferent forms. Mechanical range sensors (Alcaniz et al.,1996) used intraorally or on a plaster model may outperformoptical devices in accuracy. The focus of this paper arecomputer vision techniques and no attempt is made here tocompare the different methods of data acquisition.
Optical methods can be discriminated as passive and ac-tive processes (Jarvis, 1993): Passive optical sensors recoverdepth or range information from gray–level or color imagesof the teeth. In order to compensate for the loss of informationdue to the projection geometry, several views have to be used.One setup for such sensing is stereo vision. In fact, this isthe only technique of this sensing category which is currentlyused in dental applications, e.g. in (Hellwig et al., 1995).Since two cameras are needed for this approach, an intra–oralapplication is rather complicated. Other disadvantages are therequired calibrated setup and the need of features which haveto be matched in the two stereo images; the latter may bedifficult in images of teeth which have neither texture norprominent line or point features.
Active visual range sensors apply specialized light sourcessuch as different colors, stripes or lines to the object. Depthinformation is calculated by suitable mathematical methods,usually based on triangulation. Laser sensors also belong tothis category of sensors.
For “structured light” and “Moire algorithms”, a stripe pat-tern of known stripe distance is projected onto the surface ofthe tooth with a small parallax angle to an observing camera.Range information is reconstructed from the distortion of thestripes in the projected image (Wahl, 1986). A combinationof holographic and Moire methods applied to tooth surfacesis described in (Duret, 1988b). A very common principle for3–D reconstruction is triangulation where an object is lit bya ray and the reflection is recorded from another viewpoint.From the disparities to a reference position the distance ofthe object is estimated. To allow for accurate measurementof an object, a laser can be used to light a single point

3D Computer Vision for Tooth Restoration 5
which is then moved over the complete object. Since thisrequires scan times of approximately 10 seconds per tooth,an area sensor can be used and several laser rays are usedto light a line. More speed–up is possible using the “phasemeasurement triangulation (PMT)” where the projected pat-tern is modulated in phase and viewed from slightly varyingviewing positions. It can be shown that the phase shift isproportional to the height of the object (Gruber and Hausler,1992). In contrast to Moire methods, the calculation of thedepth of each point does not depend on neighboring pointswhich minimizes measuring errors. This method is used inthe CerecR system (Mormann and Brandestini, 1989). In thissystem a telecentric optical system is used to measure the 3Dsurface of the object. This means that the object is observedfrom infinitum, yielding parallel optic rays and a mappingwithout bias. In order to avoid reflections and to guaranteeclear stripes in the image, the teeth are prepared with titaniumpowder prior to image acquisition. An accuracy in x–, y– andz–direction of approximately 30µm is obtained with scanningtimes of a fraction of a second. The sensor provides intensityand range images with a resolution of 700 � 480 pixels. AnLED is used for lighting in the range of 840 nm. A typicalexample of the images is given in Figure 4. The resolution indepth is approx. 7 � 3 mm if 256 discrete range values are used.
Range images F � � fi j � 0 � i � M � 0 � j � N such as Figure 4 (bot-tom) measured with one of the above mentioned methodsrepresent objects by discrete values at discrete locations:
fi j � f � x0 i ∆x y0 j ∆y ��� (1)
Arithmetic operations on range images like rotation, calcula-tion of derivates, curvatures and so forth, lead to the problemof interpolating to values between these discrete locations.After rotation, for example, of such data the discretizationgrid will no longer be rectangular and the exact values cannot be stored in the form of (1).
One approach is to approximate the range data by trian-gular patches as they are used in computer graphics. Toothreconstruction is one application of the system described in(Hausler and Karbacher, 1997) which uses triangles with apatch size adjusted to the local curvature.
A parametric surface fit of the range data facilitates ananalytic calculation of all desired properties and also requiresless storage than the raw range data or triangles. Especiallyin areas with no abrupt changes, tooth surfaces can thus bedescribed elegantly.
So called NURBS (non–uniform rational B–splines) areoften used for modeling range data, e.g. in (Stoddart et al.,1994). (Farin, 1991) and (Ritter, 1996) propose a new methodbased on curved triangles for an accurate tooth surface model.These two methods are well suited for visualization. The
Figure 4. Input data: gray–level image (top), range image (bottom).The bright areas in the top and bottom of the range image correspondto object points outside the depth range of the camera.
goal in our case is different: the complete 3–D model hasto be used to manufacture an inlay in ceramics using CNC–machines. These devices can be controlled via standardizedinterfaces; one of them is the surface model for the car indus-try by “Verein der Automobilindustrie“ which is commonlyused (VDA–FS (DIN:Deutsches Institut fur Normung e.V.,1992), DIN 66301). This standard defines a data format forthe representation of surfaces for parts of automobiles; thedata format is suited for automatic configuration of produc-tion lines. General parametric polynomials in u and v are usedhere for surface representations with p and q as the maximumorder of u and v:
X � u v � �q
∑k � 0
p
∑j � 0
a jku jvk (2)
Y � u v � �q
∑k � 0
p
∑j � 0
b jku jvk (3)
Z � u v � �q
∑k � 0
p
∑j � 0
c jku jvk � (4)
The syntax defined in the standard is of minor interest here.

6 D. Paulus, M. Wolf, S. Meller and H. Niemann
In (Besl, 1988) the following bivariate polynomials areused with great success for 3–D object recognition in rangeimages
g � n C x y � � ∑i
�j � n
ci jxiy j � n �
4 � (5)
where g approximates the range values at x y coordinates; xand y are computed from the values fi j by a shift to the originand scaling, and the matrix C consists of the coefficients c jkin Eq. 4. Other approaches to surface approximation can befound in e.g. (Solina and Bajcsy, 1990). Generally, range datahas to be clustered to surface patches of varying size whichare then approximated by these polynomials.
When multiple views have to be combined to surfaces (asin e.g. (Soucy and Laurendeau, 1995; Chen and Medioni,1991)), the problem is how to register and fuse these imagesand surfaces. A semi–automatic system for reconstruction oftooth data is described in (Ozaki et al., 1987); reference pointsfor matching have to be marked by a human operator.
In addition to range information, technical devices suchas the CerecR system often also provide intensity images ofthe object. Most well known image processing methods areapplicable for intensity and range images such as filtering,segmentation, etc. which can be found in text books such as(Paulus and Hornegger, 1995).
4. FEATURE DETECTION FROM OCCLUSALSURFACES
In the following we describe our first system for automatictooth restoration. The feasibility of this approach is demon-strated with the first upper molar. For reconstruction of otherkind of teeth, few modifications would have to be doneto adapt the segmentation and normalization process. Thissystem is composed of two parts. The first part is used to builda data base of intact tooth surfaces; the task of the second part(Sect. 5) is concerned with the restoration process.
The range images used in this system were captured withthe CerecR sensor (Sect. 2). We apply a median filter toeliminate noise of the image which result from the projectedgrid. Contour points are detected in the gray–level imagewhich are then connected to contour lines (Sect. 4.0.1). Theenclosed area is used as a mask for the gray–level and rangeimage and separates the tooth data from the background. Inthe range image the central fissure is detected. This line isapproximated by a 2D regression line in the x–y–plane andone in the x–z–plane; the definition of the coordinate axes wasgiven in Figure 2. The maximal elevations on the cusps arelocalized and used for a rotation of the gray–level image andrange data to a normalized position (Sect. 4.0.2). After a final
scaling step features are computed which serve as parametersfor the data base query on tooth surfaces.
Several features were tested for evaluating the robustnessof the segmentation algorithm compared to the results ofhuman evaluation by a dentist.
4.0.1. SegmentationThe aim of the segmentation process in our system is to sepa-rate the tooth from its neighbors and from the background.The Sobel–operator creates an edge image from the inputintensity image. The resulting normalized edge orientationsand edge strength values are used as input for the detectionof line segments based on a hysteresis threshold method(Harbeck, 1996). The hysteresis threshold method starts withhigh and global thresholds. Since line segments in at leastthree corners of the tooth are expected to be sufficient todetermine the entire contour, the image is divided into fourquadrants. If no line segments could be detected in onequadrant, a new line following process with locally adaptedthresholds is performed. All detected line segments are shownin Figure 5. Line segments corresponding to contour lines ofthe adjacent teeth, inside the tooth, as well as line occlusionshave to be discarded. In the next step the remaining linesegments are combined to a closed contour.
For this, the line segments are ordered according to theirposition and curvature; intersections of line segments areresolved. The completion to a closed contour is achievedby dynamic programming. The approach is to find a contourwhich maximizes the sum of the edge strength values inthe gradient image. The number of possible paths betweenthe end of one line and the beginning of another can bereduced by restricting the number of possible transitionswhile searching for the optimal path. This means that in caseof a horizontal gap you always have to move a step forward;steps backwards and transitions up or down are forbidden.This guarantees that all paths between two contour lineshave the same number of pixels, such that the sum of theedge strength values can be used as a measure which can becomputed and compared in a simple and efficient way.
4.0.2. NormalizationFor a dentist it does not cause any problems to distinguishdifferent teeth. Geometric properties like size, shape, numberof cusp tips, etc. are well suited to identify a special tooth. Butthere might exist other not directly evident features which canbe used to identify or even to describe the surface of a toothwith only few parameters. For determining those features andto build up a data base of intact teeth it is helpful to have allteeth in a normalized position. Since the disto–palatal cusp isgenerally the lowest elevation on the molar (cmp. Figure 2),we would like to have this cusp always at the same position

3D Computer Vision for Tooth Restoration 7
Figure 5. Top: Detected line segments, black lines mark validcontours, gray lines mark discarded line segments. For a bettervisualization the line segments have been enlarged. Some segmentsappear to be connected although there is a small gap between thosesegments. Bottom: Closed contour superimposed to the intensityimage
in the image to facilitate feature extraction and comparison.
Figure 6. Position of the deepest points on the central fissure
A parameter which varies little among different imagesin our application, is the camera position relative to the
object. In order to move the image into a reference position,a translation and a rotation in three dimensions is requiredresulting in six parameters.
One possibility is to use three rotational angles γ β αaround x y, and z–axis and three translational vector com-ponents. Three rotational angles are sufficient in our clinicalsetup because the tooth is extracted from the image so thattranslations do not occur. Translation as well as the correctionof distortions resulting from projection can be omitted.
With respect to the reference position, these angles have tobe chosen in such a way that they can be uniquely determinedin any image. The angles should be as small as possible,since otherwise the effort for resampling the range image willbe considerably larger. For setting up a data base this is noproblem, but for a real–time application, as described in thenext section, where the model tooth and the damaged toothhave to be in the same normalized position, this might bea restriction. In our approach, reference information for thenormal position was obtained from the central fissure and theposition of the cusp tips. Whereas the course of the centralfissure is a unique and reliable feature, the position of thecusp tips changes with the age and the abrasion of the tooth.
To determine the two rotational angles β and γ, the courseof the central fissure is searched in the range image andthen approximated by a straight line. The central fissure runsbetween the four major cusps and marks the lowest points onthe occlusal surface. The alignment of the tooth in the x–y–plane is done by its regression line.
A property common to all points on the central fissure isthat no neighboring point is lower. Anatomic knowledge ofthe occlusal surface of the first upper molar guarantees thatthe lowest point is usually located close to the oblique ridgein the middle of the occlusal surface. Another low point islocated on the other side of this ridge. The position of thesetwo points is illustrated in Figure 6. The goal of the first step,detection of the lowest points, is to find one of those points.
For this task we developed a mask operator which eval-uates a measure for every point on the occlusal surface bysumming up the differences of the range values between thecurrent point fx � y and the other points fx
�i � y �
j within the maskof size 11 � 11. The point indicated by the minimum of thesevalues is used as the starting point for the detection of thecentral fissure. The course of the central fissure in the rangeimage is again determined by dynamic programming. In ourapplication, a path inside the occlusal surface is searchedwhich is minimal with respect to the average height.
Searching for a minimal path for every allowed pointinside the occlusal surface yields a two–dimensional arraywhich contains the average height for an optimal path, insense of a minimal height, from the starting point to everypoint inside the valid area. To determine the central fissure
8 D. Paulus, M. Wolf, S. Meller and H. Niemann
which runs across the occlusal surface, the outer points of theallowed area are considered; only those points are possiblestarting and ending points of the central fissure.
The search space is divided into four areas, two horizontaland two vertical each. In each of them, a point is searchedwhich represents the path with the lowest height beginning inthe starting point. If one point is found in each of these foursections, two more or less orthogonal lines can be determinedcorresponding to the two fissures. If less than four points arefound, i.e., if only a starting point for a line is found, theending point is assumed to be in the opposite section and theend point’s position is estimated.
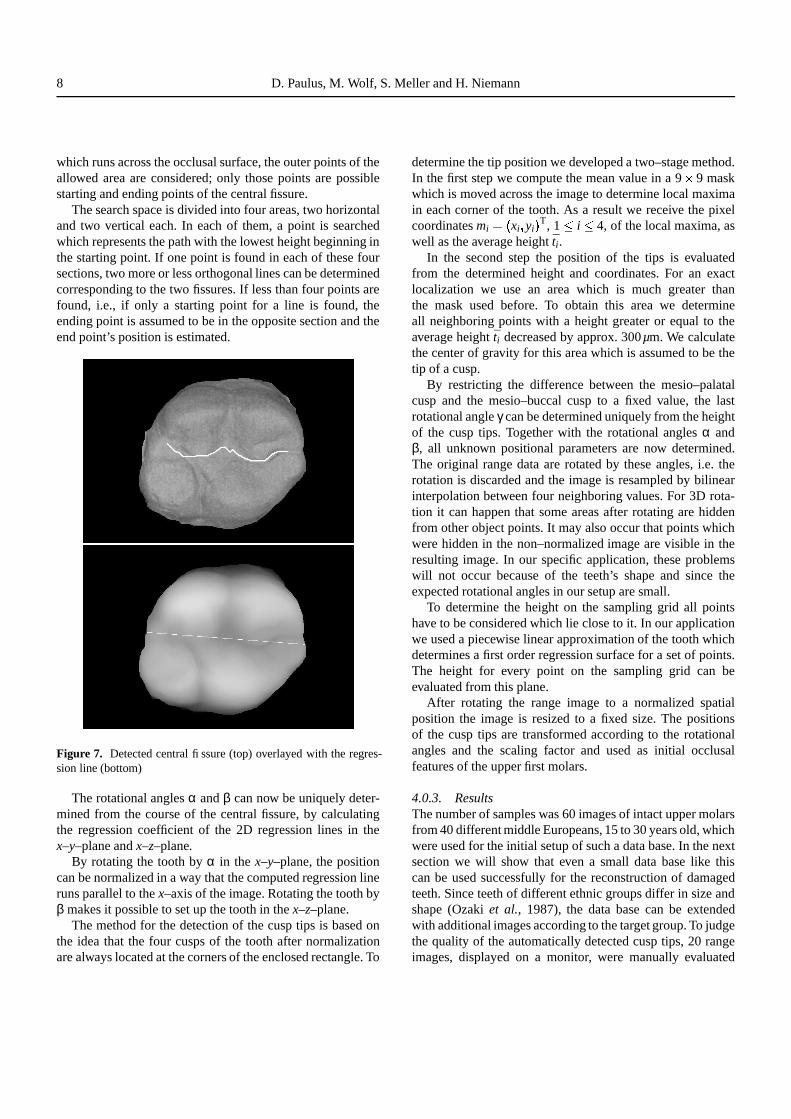
Figure 7. Detected central fissure (top) overlayed with the regres-sion line (bottom)
The rotational angles α and β can now be uniquely deter-mined from the course of the central fissure, by calculatingthe regression coefficient of the 2D regression lines in thex–y–plane and x–z–plane.
By rotating the tooth by α in the x–y–plane, the positioncan be normalized in a way that the computed regression lineruns parallel to the x–axis of the image. Rotating the tooth byβ makes it possible to set up the tooth in the x–z–plane.
The method for the detection of the cusp tips is based onthe idea that the four cusps of the tooth after normalizationare always located at the corners of the enclosed rectangle. To
determine the tip position we developed a two–stage method.In the first step we compute the mean value in a 9 � 9 maskwhich is moved across the image to determine local maximain each corner of the tooth. As a result we receive the pixelcoordinates mi � � xi yi � T, 1
�i
�4, of the local maxima, as
well as the average height ti.In the second step the position of the tips is evaluated
from the determined height and coordinates. For an exactlocalization we use an area which is much greater thanthe mask used before. To obtain this area we determineall neighboring points with a height greater or equal to theaverage height ti decreased by approx. 300µm. We calculatethe center of gravity for this area which is assumed to be thetip of a cusp.
By restricting the difference between the mesio–palatalcusp and the mesio–buccal cusp to a fixed value, the lastrotational angle γ can be determined uniquely from the heightof the cusp tips. Together with the rotational angles α andβ, all unknown positional parameters are now determined.The original range data are rotated by these angles, i.e. therotation is discarded and the image is resampled by bilinearinterpolation between four neighboring values. For 3D rota-tion it can happen that some areas after rotating are hiddenfrom other object points. It may also occur that points whichwere hidden in the non–normalized image are visible in theresulting image. In our specific application, these problemswill not occur because of the teeth’s shape and since theexpected rotational angles in our setup are small.
To determine the height on the sampling grid all pointshave to be considered which lie close to it. In our applicationwe used a piecewise linear approximation of the tooth whichdetermines a first order regression surface for a set of points.The height for every point on the sampling grid can beevaluated from this plane.
After rotating the range image to a normalized spatialposition the image is resized to a fixed size. The positionsof the cusp tips are transformed according to the rotationalangles and the scaling factor and used as initial occlusalfeatures of the upper first molars.
4.0.3. ResultsThe number of samples was 60 images of intact upper molarsfrom 40 different middle Europeans, 15 to 30 years old, whichwere used for the initial setup of such a data base. In the nextsection we will show that even a small data base like thiscan be used successfully for the reconstruction of damagedteeth. Since teeth of different ethnic groups differ in size andshape (Ozaki et al., 1987), the data base can be extendedwith additional images according to the target group. To judgethe quality of the automatically detected cusp tips, 20 rangeimages, displayed on a monitor, were manually evaluated

3D Computer Vision for Tooth Restoration 9
by a dentist, twice. Although humans are not very good atinterpreting 2D displays of 3D images, it is a common wayto mark the specimen on a monitor, because often it is onlypossible to take optical imprints. Additionally the effort ofsetting markers directly on the specimen and extracting thesemarkers automatically from the acquired images is prone toerrors. The average distance of the manually marked positionof the cusp tips was 0 � 1 mm for the same images. Thereforewe used this human reproducible accuracy to compare theresults of an automatic and manual evaluation. In generalthe comparison shows a good correspondence. The averagedistance between the automatic and human evaluation wasapprox. 0.17 mm. In 70% of the cases the distance betweenthe marked tip positions was less than 0 � 1 mm. A comparisonof the results is shown in Figure 8 (Sect. 4.0.3). More detailson this system can be found in (Wolf, 1994; Wolf et al.,1996a; Wolf et al., 1996b).
Figure 8. Comparison of manually (white circle) and automatically(black square) marked cusp tips
5. AUTOMATIC TOOTH RESTORATION VIAIMAGE WARPING
In this section, we present RecOS, (Reconstruction of Oc-clusal Surfacesa) (Meller, 1996), a method that makes use ofan intact chewing surface of a model tooth to determine thechewing surface of an inlay, onlay or crown to be groundby a CNC–machine e.g. from ceramics. The model toothcan be chosen from a data base of range images based onSect. 4. Presently, no fully automatic selection of teeth fromthe model data base exists.
The method uses the technique of image deformation toprovide a congruence between range images of the modeltooth and the prepared tooth such that the missing partaGerman patent no. 19642247
is determined by the deformed model tooth. The imagedeformation is defined by a number of pairs of mutuallycorresponding feature points in both range images. Featureextraction techniques including active contours (Kass et al.,1987) are used to detect these points. A new approach forcontour–matching is proposed to match corresponding fea-ture points of the two different teeth. The goal is to reduce theamount of healthy material which has to be removed when anautomatically manufactured inlay is inserted into the preparedtooth (cmp. Sect. 2).
The steps of our method are described in the followingsections: In order to copy range data from the intact chewingsurface of a model tooth the range images of both teeth aremade congruent by an image deformation of the model tooththat is based on extracted feature points as control points.In Sect. 5.1 we describe the detection of these points; inSect. 5.2 we show the matching of corresponding points inboth images which is a prerequisite of the image deformationin Sect. 5.3. After copying the range data into the cavity, afinal height adjustment of the inlay surface ensures a smoothtransition between inserted and original tooth surface. Resultsare discussed in Sect. 5.4.
5.1. Feature detectionThe detection of the outer contour lines of both teeth asone part of the required control points for the image defor-mation step is performed in two steps. The first step is arough estimation of the centers and outlines of each toothin each range image. A ring–shaped mask with diameterslarge enough to cover the tooth outlines of differently sizedteeth is moved across the gradient image of the range image.The sum of the gradient values within the mask is associatedwith the center pixel. Local maxima in the resulting imageof gradient sums represent possible tooth centers. The localmaxima are detected with a modification of the watershedtransformation (Vincent and Soille, 1991) that reduces thenumber of detected regions by merging lower regions withlocal maxima to higher ones as the algorithm proceeds. Themethod allows to detect even the partly visible neighboringteeth and prepared teeth with a sometimes incomplete outline.From the detected tooth center we cast rays in each directionand select the points with maximal gradient value on the rayas a first estimate for a point on the tooth outline. Figure 9ashows the ring mask at the three detected tooth centerstogether with the contour estimation.
The second step uses the active contour or snake ap-proach (Kass et al., 1987). In our application we chose anumber of N � 200 control points, also called snaxels, todescribe the shape of the outer contour line. Initial snaxelpositions are defined by the contour estimation resultingfrom the first step. During the iterative energy minimization

10 D. Paulus, M. Wolf, S. Meller and H. Niemann
process, the snaxel positions are changed until the sum ofthe gradients along the contour is maximized and the localcurvature is minimized. To define the external energy of thesnakes, noise in the gradient image of the range image isignored by just considering gradient values above a threshold.The gradient image is blurred, inverted and superimposedto the original range image. Therefore, by minimizing thesnaxel values in this image as the external energy, the slopeof the tooth leads naturally into the ditch that is formed by theblurred inverted tooth contour gradient. Thus it is possible toapproximate the tooth outline and to span gaps in the outlineof the prepared tooth caused by a cavity. If necessary, largergaps can be spanned with user support semi–automatically.The contours of the neighboring teeth can be used to definethe crucial approximal contact of the contour. Line crossingsof two neighboring contours cause the concerning snaxelsto be pulled to their tooth center. An example of a detectedoutline is given in Figure 9b where adjacent snaxels areconnected with lines.
After extracting the tooth from the background, charac-teristic feature points in the occlusal surfaces are detected.Typical features of molars are the number and the positionsof the cusp tips as well as the shape of the fissures. Cusp tipsare detected as local maxima with an algorithm similar to theone described in Sect. 4. In addition it can also be applied toincomplete surfaces with missing cusps. Points of the fissurewhich lie on the intersection of the fissure and a straightconnection between two adjacent cusp tips are detected bysearching for local minima on these lines. The positions ofthe inner feature points for a prepared chewing surface areshown in Figure 9c.
5.2. Feature MatchingThe image warping technique to be applied in the followingis based on pairs of control points, in our case contour andcharacteristic feature points of the model tooth and theircorresponding points in the prepared tooth. The problem ofcorrespondence is well–known from stereo–vision or motiondetection (Niemann, 1990). Our solution reduces the 2Dsearch problem to a 1D matching of the sequences of snaxelsobtained from the snake approach of Sect. 5.1. The contoursof two teeth of the same type (e.g. molars) are similar. Thissimilarity can be described by four criteria which are invariantwith respect to scale, translation and rotation. These criteriaare determined for each snaxel yielding four sequences ofmeasured data per tooth (Figure 10):
1. The distance ri from each snaxel to the tooth center M2. The local curvature φi at each snaxel Pi � � xi yi � T,
approximated byφi � γi � γi
�1 with γi � arctan yi
� yi � 1xi
� xi � 1
��������������������������������������������������������������������������������������������������������������������������������������������������������������������������������������������������������������������������������������������������������������������������������������������������������������������������������������������������������������������������������������������������������������������������������������������������������������������������������������������������������������������
(a)
(b)
(c)
Figure 9. Rough estimation of tooth centers and outlines (a) in thegradient image, the refined contour (b) and characteristic featurepoints inside the chewing surface (c).
3. The distance ci of each snaxel to the nearest cusp tip4. The distance di of each snaxel to the nearest detected
fissure point
The aim of the matching process is to determine a mappingof the snaxels maximizing a suited measure of similarity forthe sequences of measured data for the two teeth. The match-ing process is subdivided into two steps. In the first step, thedisplacement that maximizes the similarity of the two contourlines is computed by searching for a displacement jmax =argmax j rab
�j � , where rab
�j � denotes the correlation coefficient
of the sequences of measurement vectors ai bi i � 1 � � � N ofthe prepared tooth and the model tooth contour, respectively.The similarity criterion tab
�j � � ∑N
i � 1 aib �i
�j � mod N can be
interpreted as a vectorial version of the cross–correlationcoefficient known from statistics.
In the second step, we apply a method originating fromspeech recognition, “Dynamic Time Warping” (Niemann,1990), to determine a nonlinear mapping of the contourpoints. This method minimizes the summed up Euclidean

3D Computer Vision for Tooth Restoration 11
Pi � 1
-3
-2
-1
0
1
2
3
4
0 40 60 80 100 120 140 160 180 20020Snaxel index
Normalized measurements
ci (cusp)ri (radius)φi (curvature)
di (fissure)
ri
dici
Pi�
1
M
φiPi
Figure 10. Each snaxel of both teeth is associated with a 4D vector of normalized values. These vectors of both contours are mapped to eachother using cross–correlation and “Dynamic Time Warping”.
distances between measurement vectors of snaxels that aremapped to each other. This minimization can be formulatedas an optimal path search in a 2D search space; the algorithmis illustrated by an 1D signal in Figure 11. In our applicationwe allowed skipping or repeating single positions in themapping of the contours. Minimization over a restricted rangeof possible mappings is achieved by dynamic programming.A result can be seen in Figure 12 where the model toothis visualized inside the prepared tooth and correspondingfeature points are connected with lines.
Afterwards, the characteristic feature points inside theocclusal surfaces are assigned to each other according to themapping of the contour points next to them. In case of featurepoints hidden in the cavity area of the prepared tooth, theassignments are omitted.
5.3. Image Warping and Height AdjustmentThe pairs of control points can now be used to deform therange image of the model tooth to achieve a congruenceof both teeth. A coordinate transformation g : g � x y � �� g1 � x y �� g2 � x y � � is performed where g1 and g2 are cal-culated as scattered data interpolation functions based onthe control points. We use radial base functions known asHardy’s multiquadrics that have been successful applied toimage warping (Ruprecht and Muller, 1993). A resamplingof the range image follows. An example of a range imageof the deformed model tooth is shown in Figure 13a. Thearea in the model tooth corresponding to the cavity can nowbe copied into the prepared tooth. As positions of cusps andfissures have been adjusted in both images by the imagedeformation, the surface relief of the model tooth is very closeto the unknown original one of the prepared tooth. However,an additional height adjustment step is needed, because theimage warping did not change the height values of the modeltooth. The height difference of the deformed model tooth and
1234
0
1234
0
0 1 2 3
Test signal
Reference signal
mapped test signal
slopemax
Figure 11. Nonlinear mapping of an 1D signal: Starting at the lowerleft and ending at the upper right, the warping function defineswhich position of the test signal is to be mapped to which positionof the reference signal. Whereas the mapping of the starting andending position is fixed, each position of the reference signal maybe mapped to the same position as its predecessor, to the nextor to the next position but one of the test signal. E.g. position 2of the reference signal may be mapped to positions 1, 2 or 3 ofthe test signal. In this case the minimum difference of the signalvalues yields a repetition of position 1. A pointer is set back fromthe position yielding the minimum, and only this optimal path isremembered.
the prepared tooth at the cavity edge can be taken as a setof control points for another 2D interpolation. The resultingsurface is an estimation of the difference between the surfacesof the deformed model tooth and the unknown original one.

12 D. Paulus, M. Wolf, S. Meller and H. Niemann
Figure 12. The result of the feature matching process. The innersmaller contour shows the feature points of the model tooth, theouter one belongs to the visible range image of the prepared tooth.Corresponding feature points are connected with lines.
The cavity is filled with height values which result from anaddition of the difference image and the values in the modelimage. The result is a fully restored occlusal surface with asmooth transition between the restored part and the tooth anda natural continuation of the occlusal relief (Figure 13b).
5.4. ResultsOur method was implemented in several modules of theKhoros image processing system (Rasure and Young, 1992).The image warping step takes about 300 seconds when thewhole image is deformed. If the deformation is restrictedto a local area around the cavity, much processing time canbe saved. The height adjustment depending on the size ofthe cavity needs between 150 and 400 seconds. All otherprocessing steps require much less processing time. In orderto evaluate the quality of the achieved results, we testedour approach with the following experiment: In ten rangeimages a dentist manually blackened appropriate areas in therange images to simulate cavities of three different sizes (seeFigure 14). Then the data base of intact model teeth Sect. 4,not including the prepared test teeth, was used to reconstructthe damaged area of the teeth automatically. Afterwards theresults were compared with the original chewing surface.Since a possible tilt of the inserted surface relative to theoriginal surface has been removed by the height adjustmentstep the average height difference between the reconstructedand the original surface part gives a good quality mea-surement of the restoration. Depending on the size of thecavity the mean height difference h � 1
L ∑Li � 1
�zi � f � xi yi � �
between the original surface zi and the computed surfacef � xi yi � was within a range from 0 � 2 mm to 1 � 0 mm, where Ldenotes the number of pixels inside the cavity. In comparisonwith the mean height difference measured on CerecR–inlays(Mormann and Mattiola, 1996) the error could be halved.
Figure 13. The deformed model tooth, the restored tooth surface,and the inlay.
6. TOOTH SURFACE REPRESENTATION
In the systems described in Sect. 4 and in Sect. 5 we usedthe CerecR sensor. We now describe a system based on(Kuppers, 1995; Paulus et al., 1995). which used 3D datacaptured by a high–precision laser sensor (Mehl et al., 1996).These images — together with the transformation data of themoving capturing device — are used to create a 3D rangemap of the object. Surface patches of arbitrary order are fittedto the range data and the object is transformed to normalposition. Surface patches were computed for the range dataas described by various authors (Besl, 1988; Besl, 1990;Solina and Bajcsy, 1990). After resampling of the surfacedata, the images are matched using maximum elevations andderivatives at these locations. A 3D–representation of thesurface is created which is again approximated by patches andrepresented in standard format suited for CNC machines. Wecompare results for dental applications of 2nd and 3rd ordersurface approximations.

3D Computer Vision for Tooth Restoration 13
Figure 14. Range images manually marked with differently sizedcavities
Our approach shows how to obtain high–precision 3DCAD–models of already existing inlay or crown restorationswhich are manually created as wax models by the dentaltechnician (Sect. 2). The chain of automation for tooth re-construction in this system thus starts at a later stage, than inthe two systems described so far.
6.1. Active MeasurementTooth model as well as wax model are scanned outside of themouth to record 3D data. In order to improve the accuracyof the 3D shape measurement and to overcome the prob-lem of shading within the object’s surface, the provisionalrestoration is measured in a two–step approach (Mehl et al.,1996). First, the object is mounted on an actor (computercontrolled gonio stage) and measured at different tilt anglesand rotations around the vertical axis of the tooth with a high–precision laser sensor using the triangulation principle. Byobtaining the profile of a light stripe at the speed of a videoframe of a CCD chip, the 3D–data are acquired within a few
seconds. The partial data sets are combined to one single 3D–data set using the movement information of the actor refinedby matching the partial information using overlapping areas.A second step is necessary due to the inaccuracies of thetranslational information. To select only those points fromthe data set for approximation which are useful for the re-construction, a new test criterion is introduced. Thereby, evenrapid changes in depth can be modeled with high accuracy.The resulting inlay can be manufactured in ceramics by aCNC–machine. The sensor accuracy is 10 µm; the maximumerror for approximation is 4 µm (Mehl et al., 1996).
6.2. Surface FittingOur algorithm for surface approximation by a finite numberof surface patches has four input arguments: a set of 3D–coordinates of possibly scattered points, the size of the rectan-gular area to be approximated � px py � , the minimal distanceξ in z direction which a point belonging to the patch musthave to at least another point in the patch, and the maximaltolerable approximation error δ; i.e. range data does not haveto be provided in a rectangular grid as in (Eq. 1, p. 5).
The size of the patch has to be chosen in such a way that areasonable number of data points can be found inside, in orderto allow for a stable estimation of the surface parameters. If –on the other hand – the size of the patch is large and if manypoints can be found inside this area, the approximation errorfor this patch will be large.
In the first step we divide the x � y space into rectangularboxes of fixed size px � py, and calculate a parametric de-scription from the 3D–values inside these areas using Eq.(5).Depending on the number of samples inside a cube, bivariatepolynomials of varying order are approximated using leastsquare fitting. In our application the maximal ξ has to bechosen for each tooth separately as well as δ. For molars witha patch size of px � py � 100µm a value of δ = 4µm turned outto be a good choice. The resulting neighboring patches differconsiderably in their orientation at the borders (Figure 15, leftshows this effect for the projection on the x–z plane).
In order to smooth transitions between neighboringpatches, approximation of range values considers the samplevalues in parts of the adjacent volumes as shown in Figure 16.In addition to smoothing, this also increases the number ofsample points for the approximation (Figure 17). A higherorder polynomial or a smaller patch size can be chosen whichcan represent even small details in the range image.
Additionally, the patch support px � py is reduced in sizefor areas close to the border of the upper surface, resultingin sizes from 350µm2 down to 70µm2. A “corner test” usesthe values of the reconstructed parametric surface fit at thecorners of the supporting rectangle. If these range value areconsiderably larger (using a threshold) than the maximal z–

14 D. Paulus, M. Wolf, S. Meller and H. Niemann
*
*
*
*
**
*
*
px x
z
****
* ** *
**
∆z � ξ
Figure 15. Patches without smoothing
*
*
*
*
*
extended range for patch
** * *
*
*
* *
*
**
***
*
*
*
y
x
py
defined coordinates px
Figure 16. Range for calculation of surface parameters
coordinate value or smaller than the minimum value, thepatch is marked “undefined”. Only in rare cases this leads toelimination of correct values close to very steep descents.
The following functions were used for judging the approx-imation error in a patch with L 3D–values � xi yi zi � T 1 �
i�
L calculating the differences between sensor data zi and
**
*
*
x
****
* ** *
**
∆z � ξ *
*
*
*
z
Figure 17. Patches with smoothing
computed surface values f � xi yi � :
n fmax � max � �zi � f � xi yi � � 1 �
i�
L � (6)
n f � 1L
L
∑i � 1
�zi � f � xi yi � �
(7)
The error value n fmax is the maximal difference of a rangevalue to the approximating polynomial surface of degree n,the number n f is the mean difference of all range values.
Another function is used to measure the amount of outliers:the value n fδ is the mean difference for the range values whichlie in patches with a surface–fit–error smaller than δ:
P : ��� i �1
�i
�L;
�zi � f � xi yi � ���
δ �n fδ � 1
�P
�P
∑i � P
�zi � f � xi yi � � � (8)
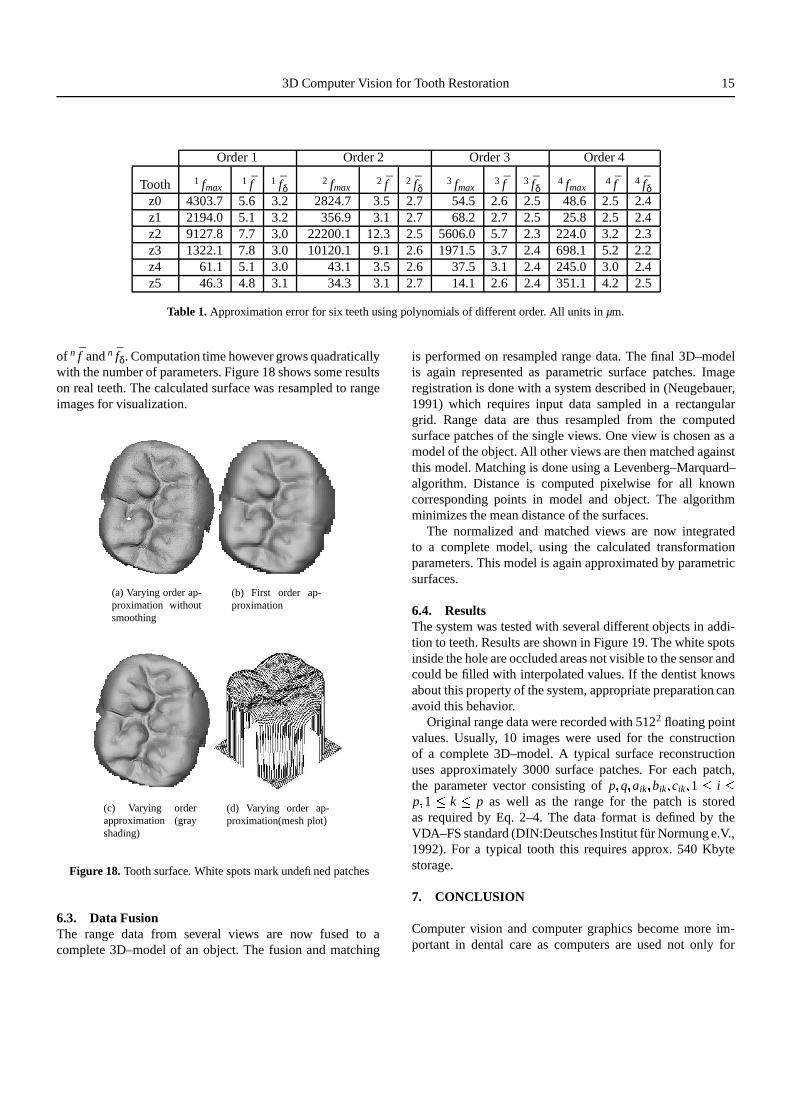
Table 1 lists results for six teeth where in (8) a δ of 4µm ischosen; the small differences between n fδ and n f show thatthe occurrence of large errors is very rare, and the limit of4µm is much smaller than the sensor noise of 10µm. Largevalues of n fmax can be found only at borders of the object andcould be eliminated by the corner test as can be seen from thesmall value of n f .
The best results were obtained with polynomials of degree3 and 4 with a parameter range of 120µm2. The mean approxi-mation error was 2 � 4µm. The error reduction by the use of therestrictions described above is obvious from the differences
3D Computer Vision for Tooth Restoration 15
Order 1 Order 2 Order 3 Order 4
Tooth 1 fmax1 f 1 fδ
2 fmax2 f 2 fδ
3 fmax3 f 3 fδ
4 fmax4 f 4 fδ
z0 4303.7 5.6 3.2 2824.7 3.5 2.7 54.5 2.6 2.5 48.6 2.5 2.4z1 2194.0 5.1 3.2 356.9 3.1 2.7 68.2 2.7 2.5 25.8 2.5 2.4z2 9127.8 7.7 3.0 22200.1 12.3 2.5 5606.0 5.7 2.3 224.0 3.2 2.3z3 1322.1 7.8 3.0 10120.1 9.1 2.6 1971.5 3.7 2.4 698.1 5.2 2.2z4 61.1 5.1 3.0 43.1 3.5 2.6 37.5 3.1 2.4 245.0 3.0 2.4z5 46.3 4.8 3.1 34.3 3.1 2.7 14.1 2.6 2.4 351.1 4.2 2.5
Table 1. Approximation error for six teeth using polynomials of different order. All units in µm.
of n f and n fδ. Computation time however grows quadraticallywith the number of parameters. Figure 18 shows some resultson real teeth. The calculated surface was resampled to rangeimages for visualization.
(a) Varying order ap-proximation withoutsmoothing
(b) First order ap-proximation
(c) Varying orderapproximation (grayshading)
(d) Varying order ap-proximation(mesh plot)
Figure 18. Tooth surface. White spots mark undefined patches
6.3. Data FusionThe range data from several views are now fused to acomplete 3D–model of an object. The fusion and matching
is performed on resampled range data. The final 3D–modelis again represented as parametric surface patches. Imageregistration is done with a system described in (Neugebauer,1991) which requires input data sampled in a rectangulargrid. Range data are thus resampled from the computedsurface patches of the single views. One view is chosen as amodel of the object. All other views are then matched againstthis model. Matching is done using a Levenberg–Marquard–algorithm. Distance is computed pixelwise for all knowncorresponding points in model and object. The algorithmminimizes the mean distance of the surfaces.
The normalized and matched views are now integratedto a complete model, using the calculated transformationparameters. This model is again approximated by parametricsurfaces.
6.4. ResultsThe system was tested with several different objects in addi-tion to teeth. Results are shown in Figure 19. The white spotsinside the hole are occluded areas not visible to the sensor andcould be filled with interpolated values. If the dentist knowsabout this property of the system, appropriate preparation canavoid this behavior.
Original range data were recorded with 5122 floating pointvalues. Usually, 10 images were used for the constructionof a complete 3D–model. A typical surface reconstructionuses approximately 3000 surface patches. For each patch,the parameter vector consisting of p q aik bik cik 1 �
i�
p 1 �k
�p as well as the range for the patch is stored
as required by Eq. 2–4. The data format is defined by theVDA–FS standard (DIN:Deutsches Institut fur Normung e.V.,1992). For a typical tooth this requires approx. 540 Kbytestorage.
7. CONCLUSION
Computer vision and computer graphics become more im-portant in dental care as computers are used not only for

16 D. Paulus, M. Wolf, S. Meller and H. Niemann
Figure 19. Parts of a tooth with a preparation for the restoration of acavity (top left, top right). Finite element graphics (bottom). Whitespots mark undefined patches.
administrative tasks but for diagnosis based on medical im-ages and for the design of dental prostheses as well. Afterintroducing existing systems for automatic tooth restorationwe presented two own systems as further improvements. Alibrary of digitized intact tooth surfaces can be built by imageprocessing methods that extract features from the surfaces; amost suited model surface for a given prepared tooth can beselected by the human operator. Further work is required tofind distance measures of tooth features that can be used toautomatize this selection.
Image warping is used to adapt this model surface to thegiven one to determine the shape of a dental prosthesis. Asan alternative, a provisional wax inlay can be 3D–copied intocomputer memory. In both methods the computed data serveas input for the grinding of the prosthesis from ceramics byCNC–machines. Until now the accurate fit of automaticallycalculated NC–fabricated inlays within the cavity – an issuenot covered by the described methods – is still a problemto be solved. The 3D modeling of the complex chewingprocess of both jaws has not yet been simulated on computers
satisfactorily as well. The dental assistant in contrast can usea physical device for the simulation of the jaw movements.These are issues yet to be solved in future research. Thereforethe second method we described might produce inlays withhigher quality for the moment. But it obviously has a lotof disadvantages compared to the first method: the physicalimprints of the jaws, the time–consuming task of manualmodeling by the dental assistant and the time delay of theinsertion in a second appointment only.
Although the systems shown in the previous sections havenot been fully combined to a common system yet, theyindicate the direction for further research and developmentwhich will improve and speed up dental work. In principle,CNC machines as well as new material for inlays and onlayscan be used in combination with computer vision to build acomplete automatic system in the near future.
In consideration of the ongoing process of automatizationin this area we hope that future developments will still respectthe experience of human experts and may lead to lowercosts for dental restorations and thus enable more people toimproved dental care.
ACKNOWLEDGEMENT
The authors wish to express their thanks to all those whomade the cooperation between engineering and dental clinicssuccessful. These are in particular, M. Pelka and N. Kramerfrom the dental clinics of the University Erlangen–Nurnberg,and K.–H. Kunzelmann of the dental clinics of the UniversityMunchen. Parts of the diploma thesis of Stefan Kuppers wereincluded in our paper; we thank him for his contributionand dedicated work. The images were provided by the dentalclinics of the University Erlangen and University Munchen.
REFERENCES
Alcaniz, M., Chinesta, F., Monserrat, C., Grau, V., and Ram on, A.(1996). An Advanced System for the Simulation and Planning ofOrthodontic Treatments. In H ohne, K.H. and Kikinis, R. (eds),Proceeding of the 4th International Conference on Visualizationin Biomedical Computing ’96, Lecture Notes in Computer Sci-ence 1131. Springer-Verlag, Heidelberg.
Besl, P.J. (1988). Surfaces in Range Image Understanding. Percep-tion Engineering. Springer.
Besl, P. J. (1990). The free–form surface matching problem. InFreemann, H. (ed.), Machine Vision for Three–DimensionalScenes, pp. 25–71, San Diego. Academic Press.
Chen, Y. and Medioni, G. (1991). Object modeling by registrationof multiple range images. In Proc. IEEE Intl. Conf. on Roboticsand Automation, pp. 2724–2729.
DIN:Deutsches Institut f ur Normung e.V. (1992). CNC-Maschinen/Num. Steuerung. Beuth.

3D Computer Vision for Tooth Restoration 17
Duret, F. (1988a). Method of making a prosthesis, especially a dentalprosthesis. Technical report, United States Patent Nr. 4742464.
Duret, F. (1988b). Method of making a prosthesis, especially adental prosthesis. Technical report, United States Patent Nr.4742464.
Farin, G. (1991). NURBS for curve and surface design. PhiladelphiaSociety for Industrial and Applied Mathematics.
Faugeras, O. (1993). Three–Dimensional Computer Vision – AGeometric Viewpoint. MIT Press, Cambridge, Massachusetts.
Faulhaber, D., Ranganath, S., Weierich, P., Sim Heng, O., Kassim,A. A., and Kuen Fui, L. (1996). Registration of lateral X-raysand photos for orthodontic surgery. In ICARCV’96, The FourthInternational Conference on Control, Automation, Robotics andVision, Vol. 2, pp. 768–772, Westin Stamford, Singapore.
Grieve, A. R., Saunders, W. P., and Alani, A. H. (1993). The effectsof dentine bonding agents on marginal leakage of compositerestorations–long-term studies. Journal of Oral Rehabilitation,20(1), 11–18.
Gruber, M. and H ausler, G. (1992). Simple, robust and accuratephase measuring triangulation. Optik, 89, 118–122.
G urke, S. (1997). Generation of Tooth Models for Ceramic DentalRestorations. In The Fourth International Conference on Com-puter Integrated Manufacturing, page to appear, Singapore.
Harbeck, M. (1996). Objektorientierte linienbasierte Segmentierungvon Bildern. Shaker Verlag, Aachen.
H ausler, G. and Karbacher, S. (1997). Reconstruction of smoothedpolyhedral surfaces from multiple range images. In Seidel, H.-P., Girod, B., and Niemann, H. (eds), 3D Image Analysis andSynthesis ’97, pp. 191–198, Erlangen. Infix.
Heaven, T. J., Weems, R. A., and Firestone, A. R. (1994). The useof a computer-based image analysis program for the diagnosis ofapproximal caries from bitewing radiographs. Caries Research,28(1), 55–58.
Hellwig, E., Klimek, J., and Attin, T. (1995). Einfuhrung in dieZahnerhaltung. Urban & Schwarzenberg.
Hirano, Y. and Aoba, T. (1995). Computer–assisted reconstructionof enamel fissures and carious lesions of human premolars.Journal of Dental Research, 74(5), 1200–1205.
Jain, A. K. and Flynn, P. J. (eds) (1993). Three–Dimensional ObjectRecognition Systems, Amsterdam. Elsevier.
Jarvis, R. (1993). Range sensing methods for computer vision. In(Jain and Flynn, 1993), pp. 17–56.
Kass, M., Witkin, A., and Terzopoulos, D. (1987). Snakes: Activecontour models. In Proc. First Int. Conf. on Computer Vision(ICCV), pp. 259–268, London.
Keeve, E., Girod, S., and Girod, B. (1996). Computer–AidedCranofacial Surgery. In Lemke, H. U., Vannier, M. W., Inamura,K., and Farman, A. G. (eds), Computer Assisted Radiology:Proceedings of the International Symposium on Computer andCommunication Systems for Image Guided Diagnosis and Ther-apie (CAR ’96), number 1124 in International Congress Series,pp. 757–763, Paris. Elsevier Science B. V.
K uppers, St. (1995). Generierung eines 3D-Zahnmodels aus 2,5D-Sensordaten. Technical report, Diploma thesis, Lehrstuhl f ur
Mustererkennung (Informatik 5), Universit at Erlangen–N urn-berg, Erlangen.
Lappe, A. (1996). Rechnergestutzte Vermessung von Okklu-salflachen. Ph.D. Thesis, Poliklinik f ur Zahnerhaltung undParadontologie der Friedrich-Alexander-Universit at Erlangen-N urnberg.
Laurendeau, D., Guimond, L., and Poussart, D. (1991). AComputer–Vision Technique for the Acquisition and Processingof 3-D Profiles of Dental Imprints: An Application in Orthodon-tics. Transactions on Medical Imaging, 10(3), 453–461.
Mehl, A., Gloger, W., Kunzelmann, K.-H., and Hickel, R. (1996).Entwicklung eines neuen optischen Oberfl achenmeßger ateszur pr azisen dreidimensionalen Zahnvermessung. DeutscheZahnarztliche Zeitschrift, 23(51).
Meller, S. (1996). Rekonstruktion von Zahnoberfl achen mittelsBilddeformationsmethoden. Technical report, Studienarbeit,University of Erlangen-Nuremberg, Erlangen.
M ormann, W. H. and Brandestini, M. (1989). Die CEREC Com-puter Reconstruction: Inlays, Onlays und Veneers. QuintessenzVerlags-GmbH, Berlin.
M ormann, W. H. and Mattiola, A. (1996). Computer-generatedocclusion of cerec2 inlays and onlays. In CAD/CIM in aestheticdentistry. Quintessence Publishing Co, Inc.
Neugebauer, P. (1991). Feinjustierung von Tiefenbildern zur Ver-messung von kleinen Verformungen. Technical report, Student’sthesis, Lehrstuhl f ur Mustererkennung (Informatik 5), Univer-sit at Erlangen–N urnberg, Erlangen.
Niemann, H. (1990). Pattern analysis and understanding. Springer-Verlag, Berlin, Heidelberg, New York, 2 edition.
Ozaki, T., Kanazawa, E., Sekikawa, M., and Akai, J. (1987). Three–dimensional measurements of the occlusal surface of the uppermolars in australian aboriginals. Australian Dental Journal,32(4), 263–9.
Paulus, D. and Hornegger, J. (1995). Pattern Recognition and ImageProcessing in C++. Advanced Studies in Computer Science.Vieweg, Braunschweig.
Paulus, D., Kunzelmann, K-H., Niemann, H., K uppers, St., andWolf, M. (1995). Automatic CNC program generation fromrange data. In Kaynak, O., Ozkan, M., Bekiroglu, N., and Tunay,I. (eds), Int. Conference on Recent Advances in Mechatronics,Vol. 1, pp. 230–237, Istanbul.
Rasure, J. R. and Young, M. (1992). Open environment for imageprocessing and software development. In Arps, R. B. and Pratt,W. K. (eds), Image Processing and Interchange: Implementationand Systems, pp. 300 – 310, San Jose, CA.
Rekow, D. (1993). Method and apparatus for modeling a dentalprosthesis. United States Patent Nr. 5273429.
Ritter, D. (Juli 1996). Merkmalsorientierte Objekterkennungund -lokalisation im 3–D–Raum aus einem einzelnen 2–D-Grauwertbild und Referenzmodellvermessung mit optischen 3–D–Sensoren. Ph.D. Thesis, Lehrstuhl f ur Optik.
Ruprecht, D. and M uller, H. (1993). Free form deformationwith scattered data interpolation methods. In Farin, G. (ed.),Geometric Modelling (Computing Supplement 8), pp. 267–281.Springer Verlag, Wien.

18 D. Paulus, M. Wolf, S. Meller and H. Niemann
Solina, F. and Bajcsy, R. (1990). Recovery of parametric modelsfrom range images. IEEE Transactions on Pattern Analysis andMachine Intelligence, 12(2), 131–147.
Soucy, M. and Laurendeau, D. (1995). A general approach to theintegration of a set of range views. IEEE Transactions on PatternAnalysis and Machine Intelligence (PAMI), 17(4), 344–358.
Stevenson, R. L. and Delp, E. J. (1993). Three–dimensional surfacereconstruction: Theory and implementation. In (Jain and Flynn,1993), pp. 89–113.
Stoddart, A. J., Hilton, A., and Illingworth, J. (1994). A newdeformable surface. In British Machine Vision Conference(BMVC), pp. 285–294.
Stoll, R. and Stachniss, V. (1990). Computerunterst utzte Technolo-gien in der Zahnheilkunde. Deutsche Zahnarztliche Zeitschrift,45(6), 314–322.
Verdonschot, E. H., Sanders, A. J., and Plasschaert, A. J. (1990). Acomputer–aided image analysis system for area measurement oftooth root surfaces. Journal of Periodontology, 61(5), 275–280.
Vincent, L. and Soille, P. (1991). Watersheds in Digital Spaces: AnEfficient Algorithm Based on Immersion Simulations. IEEETransactions on Pattern Analysis and Machine Intelligence(PAMI), 15(6), 583–598.
Wahl, F. M. (1986). A coded light approach for depth mapacquisition. In Hartmann, G. (ed.), Proceedings 8. DAGM-Symposium, number 125 in Informatik Fachberichte, pp. 12–17,Berlin. Springer.
Wolf, M. (1994). Merkmalextraktion f ur Kaufl achen. Technicalreport, Diploma thesis, Lehrstuhl f ur Mustererkennung (Infor-matik 5), Universit at Erlangen–N urnberg, Erlangen.
Wolf, M., Paulus, D., and Niemann, H. (1996a). Automaticmeasurement of cusps in 2.5D dental images. In Descour, M.and Svetkoff, K. Harding D. (eds), Three-Dimensional and Un-conventional Imaging for Industrial Inspection and Metrology,Vol. 2599, pp. 321–335. The International Society for OpticalEngineering.
Wolf, M., Paulus, D., and Niemann, H. (1996b). AutomatischeNormierung und Vermessung von 2.5D-Aufnahmen des erstenoberen Molars. In Arnolds, B., M uller, H., Saupe, D., andTolxdorff, T. (eds), Digitale Bildverarbeitung in der Medizin, pp.148–153, Freiburg.
Youngson, C. C. (1992). A technique for three-dimensional mi-croleakage assessment using tooth sections. Journal of Den-tistry, 20(4), 231–234.
Youngson, C. C., Nattress, B. R., Manogue, M., and Speirs, A. F.(1995). In vitro radiographic representation of the extent ofvoids within obturated root canals. International EndodonticJournal, 28(2), 77–81.