Embed Size (px)
Citation preview
WWW.ING.COM
ING Group
Annual Report
2008Steering the business through turbulent times


ING Group Annual Report 2008
1
In this report
2.1 Consolidated annual accounts
Consolidated balance sheet 84Consolidated profit and loss account 85Consolidated statement of cash flows 86Consolidated statement of changes in equity 87Accounting policies for the consolidated balance sheet and profit and loss account 89Accounting policies for the consolidated statement of cash flows 106Notes to the consolidated balance sheet 107Additional information to the consolidated balance sheet 139Notes to the consolidated profit and loss account 162Segment reporting 173Notes to the consolidated statement of cash flows 179Risk management 180Capital management 229Subsequent events 236
2.2 Parent company annual accounts
Parent company balance sheet 237Parent company profit and loss account 238Parent company statement of changes in equity 239Accounting policies for the parent company balance sheet and profit and loss account 240 Notes to the parent company balance sheet 241
2.3 Other information
Auditor’s report 245Proposed appropriation of result and Subsequent events 246
2.4 Additional information
Risk factors 247RAROC performance 254Additional Pillar 3 information for ING Bank only 255Financial glossary 275General information 281
1.1 Who we are
Composition of the Boards 2Key figures 3ING at a glance 4Letter to stakeholders 6Information for shareholders 7
1.2 Report of the Executive Board
Strategy 10Financial highlights 13Capital management 16Risk management 20Insurance Europe 25Insurance Americas 28Insurance Asia/Pacific 31Wholesale Banking 34Retail Banking 37ING Direct 40Asset management 43Human resources 47Corporate responsibility 49
1.3 Our governance
Report of the Supervisory Board 52Corporate governance 55 Report of ING Trust Office 67Report of ING Continuity Foundation 69Conformity statement 70Section 404 Sarbanes-Oxley Act 71Remuneration report 73Works councils 83
04/05 07/05 10/05 04/06 07/06 04/07 07/07 01/0801/06 01/07 10/07 04/08 07/08 01/0910/0810/0601/050
50
100
150
200
ING MSCI World Banks MSCI World Insurance
0
2
–2
4
6
8
10
IFRS
05 0806 0704
Net resultin EUR billion
0
2
4
6
8
Total assetsin EUR billion
1,400
1,200
1,000
800
600
400
200
0
IFRS
0804 0705 06
ING Group Annual Report 2008
2
1.1 Who we are
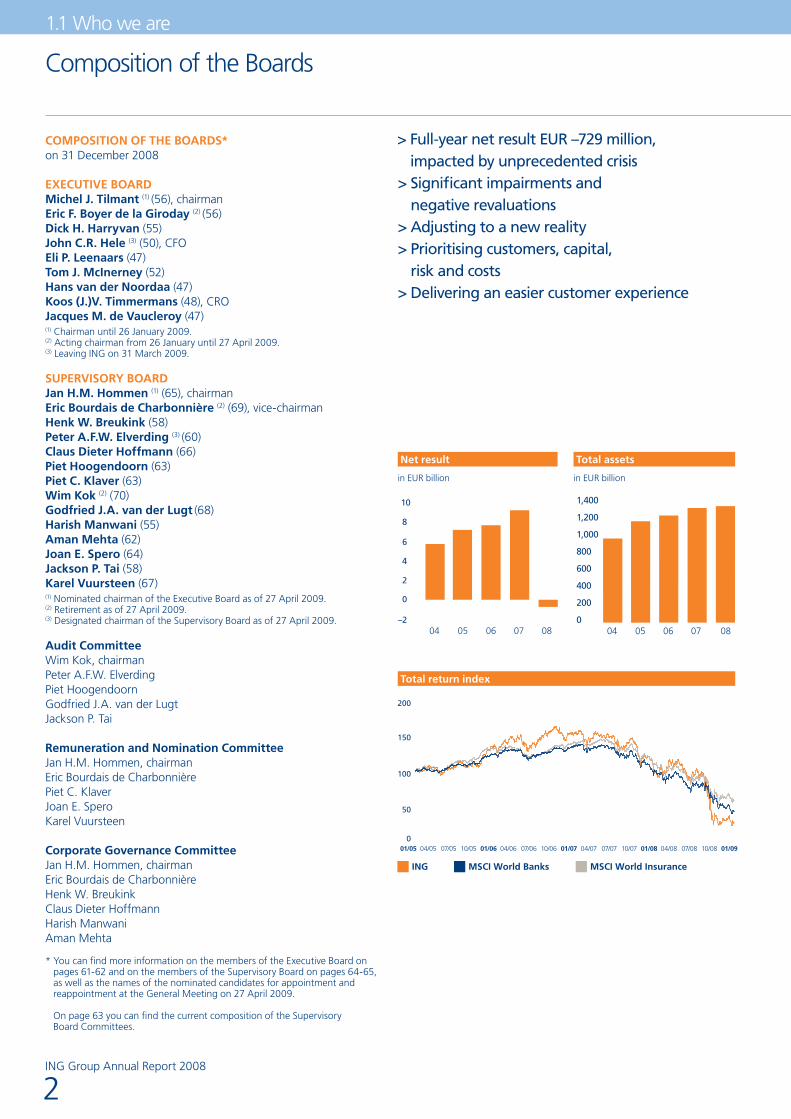
Composition of the Boards
COMPOSITION OF THE BOARDS*on 31 December 2008
EXECUTIVE BOARDMichel J. Tilmant (1) (56), chairmanEric F. Boyer de la Giroday (2) (56)Dick H. Harryvan (55)John C.R. Hele (3) (50), CFOEli P. Leenaars (47)Tom J. McInerney (52)Hans van der Noordaa (47)Koos (J.)V. Timmermans (48), CROJacques M. de Vaucleroy (47)(1) Chairman until 26 January 2009.(2) Acting chairman from 26 January until 27 April 2009.(3) Leaving ING on 31 March 2009.
SUPERVISORY BOARDJan H.M. Hommen (1) (65), chairmanEric Bourdais de Charbonnière (2) (69), vice-chairmanHenk W. Breukink (58)Peter A.F.W. Elverding (3) (60)Claus Dieter Hoffmann (66)Piet Hoogendoorn (63)Piet C. Klaver (63)Wim Kok (2) (70)Godfried J.A. van der Lugt (68)Harish Manwani (55)Aman Mehta (62)Joan E. Spero (64)Jackson P. Tai (58)Karel Vuursteen (67)(1) Nominated chairman of the Executive Board as of 27 April 2009.(2) Retirement as of 27 April 2009.(3) Designated chairman of the Supervisory Board as of 27 April 2009.
Audit CommitteeWim Kok, chairmanPeter A.F.W. ElverdingPiet HoogendoornGodfried J.A. van der LugtJackson P. Tai
Remuneration and Nomination CommitteeJan H.M. Hommen, chairmanEric Bourdais de CharbonnièrePiet C. KlaverJoan E. SperoKarel Vuursteen
Corporate Governance CommitteeJan H.M. Hommen, chairmanEric Bourdais de CharbonnièreHenk W. BreukinkClaus Dieter HoffmannHarish ManwaniAman Mehta
* You can find more information on the members of the Executive Board on pages 61-62 and on the members of the Supervisory Board on pages 64-65, as well as the names of the nominated candidates for appointment and reappointment at the General Meeting on 27 April 2009.
On page 63 you can find the current composition of the Supervisory Board Committees.
> Full-year net result EUR –729 million, impacted by unprecedented crisis
> Significant impairments and negative revaluations
> Adjusting to a new reality> Prioritising customers, capital,
risk and costs> Delivering an easier customer experience
in EUR billion in EUR billion
Net result Total assets
Total return index

ING Group Annual Report 2008
3
Key Figures
Key figures (on a total basis)
2008 2007 2006 2005 2004
Income (in EUR million)Insurance operations 54,851 62,208 59,642 57,403 55,614Banking operations 11,731 14,602 14,195 13,848 12,678Total income (1) 66,291 76,587 73,621 71,120 68,171
Operating expenses (in EUR million)Insurance operations 5,422 5,515 5,275 5,195 4,746Banking operations 10,303 9,967 9,087 8,844 8,795Total operating expenses 15,725 15,481 14,362 14,039 13,541
Addition to loan loss provision Banking operations (in EUR million) 1,280 125 103 88 465
Result before tax (in EUR million)Insurance result before tax –1,635 6,533 4,935 3,978 4,322Banking result before tax 148 4,510 5,005 4,916 3,418Total result before tax –1,487 11,043 9,940 8,894 7,740Taxation –721 1,534 1,907 1,379 1,709Minority interests –38 267 341 305 276Net result –729 9,241 7,692 7,210 5,755
Figures per ordinary share (in EUR) Basic earnings –0.36 4.32 3.57 3.32 2.71Earnings – after attribution to non-voting equity securities (2) –0.56 4.32 3.57 3.32 2.71Dividend 0.74 1.48 1.32 1.18 1.07Shareholders’ equity (in parent) 8.55 17.73 17.78 16.96 12.95
Balance sheet (in EUR billion)Total assets 1,332 1,313 1,226 1,159 964Total equity 29 40 41 38 28Shareholders’ equity (in parent) 17 37 38 37 28Core Tier-1 securities 10
Capital ratiosING Group debt/equity ratio 13.5% 9.5% 9.0% 9.4% 10.2%Insurance capital coverage ratio 256% 244% 274% 255% 204%Insurance debt/equity ratio 8.8% 13.6% 14.2% 13.4% 14.3%Bank Tier-1 ratio 9.32% 7.39% 7.63% 7.32% 6.92%
Market capitalisation (in EUR billion) 15 60 74 65 49
Key performance indicatorsNet return on equity (ROE) –2.1% 24.2% 23.5% 26.6% 25.4%Net result change –108% 20% 7% 25% n.a.
InsuranceValue of new life business (in EUR million) 924 1,113 807 805 632Internal rate of return (life) 13.9% 14.3% 13.3% 13.2% 12.1%Combined ratio (non-life) 97% 97% 91% 95% 94%
BankingCost/income ratio 87.8% 68.3% 64.0% 63.9% 69.4%RAROC after tax 1.2% 19.9% 19.7% 22.6% 14.5%
Assets under management (in EUR billion) 551 643 600 547 492
Employees (FTEs year-end) 124,661 124,634 119,801 116,614 112,195(1) Including inter-company eliminations.(2) Including impact coupon to Dutch State (EUR 425 million with regard to EUR 10 billion).
ING Group Annual Report 2008
4
1.1 Who we are
ING at a glance
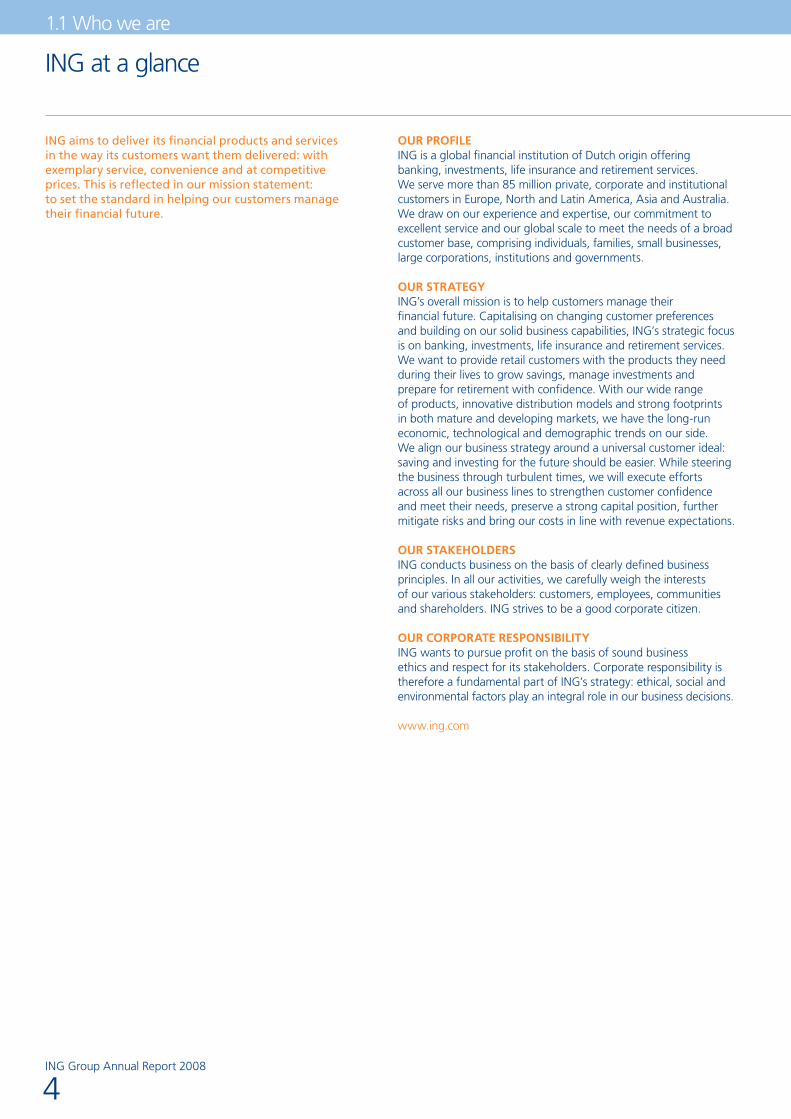
ING aims to deliver its financial products and services in the way its customers want them delivered: with exemplary service, convenience and at competitive prices. This is reflected in our mission statement: to set the standard in helping our customers manage their financial future.
OUR PROfileING is a global financial institution of Dutch origin offering banking, investments, life insurance and retirement services. We serve more than 85 million private, corporate and institutional customers in Europe, North and Latin America, Asia and Australia. We draw on our experience and expertise, our commitment to excellent service and our global scale to meet the needs of a broad customer base, comprising individuals, families, small businesses, large corporations, institutions and governments.
OUR StRategyING’s overall mission is to help customers manage their financial future. Capitalising on changing customer preferences and building on our solid business capabilities, ING’s strategic focus is on banking, investments, life insurance and retirement services. We want to provide retail customers with the products they need during their lives to grow savings, manage investments and prepare for retirement with confidence. With our wide range of products, innovative distribution models and strong footprints in both mature and developing markets, we have the long-run economic, technological and demographic trends on our side. We align our business strategy around a universal customer ideal: saving and investing for the future should be easier. While steering the business through turbulent times, we will execute efforts across all our business lines to strengthen customer confidence and meet their needs, preserve a strong capital position, further mitigate risks and bring our costs in line with revenue expectations.
OUR StakehOldeRSING conducts business on the basis of clearly defined business principles. In all our activities, we carefully weigh the interests of our various stakeholders: customers, employees, communities and shareholders. ING strives to be a good corporate citizen.
OUR CORPORate ReSPOnSibilityING wants to pursue profit on the basis of sound business ethics and respect for its stakeholders. Corporate responsibility is therefore a fundamental part of ING’s strategy: ethical, social and environmental factors play an integral role in our business decisions.
www.ing.com

ING Group Annual Report 2008
5
Underlying result before tax*in EUR million
ing bUSineSS lineS
* Excluding Corporate Lines Insurance and Banking.
Is a market leader in life insurance and retirement services in the Netherlands and Belgium, and operates life insurance, retirement services and asset management in Hungary, Poland, Czech Republic, Slovakia, Bulgaria, Romania, Russia, but also in Spain, Greece and Turkey. In almost all countries in Europe ING has built its life insurance operations from scratch. This entry strategy has been successful.
Insurance Europe2008 6512007 1,840
Provides insurance, investment, retirement and asset management products and services in the region. ING is ranked third in the defined contribution segment of the US retirement services market as measured by assets. We are also a leading pension company in a number of Latin American countries, including Mexico, Chile and Peru.
Insurance Americas2008 –5342007 2,062
Conducts life insurance and asset/wealth management activities in the region. ING is the region’s second-largest international life insurer in nine countries. ING has strong positions in Australia, New Zealand, Japan, Hong Kong, Malaysia and South Korea, and has a growing presence in the high-growth markets of China, India and Thailand.
Insurance Asia/Pacific2008 1162007 576
Conducts operations for corporations and other institutions. The primary focus of ING’s wholesale banking business is on the Netherlands, Belgium, Poland and Romania, where it offers a full range of products, from cash management to corporate finance. Elsewhere, it takes a more selective approach to clients and products. Wholesale Banking also manages ING Real Estate, the world’s largest real estate investment manager.
Wholesale Banking2008 6092007 2,059
Offers retail banking services in the Netherlands, Belgium, Poland, Romania, Turkey, Ukraine, India, Thailand and China. Private Banking is offered in the Netherlands, Belgium, Luxembourg, Switzerland and various countries in Asia and Central Europe. Mid Corporate Clients in the home markets (the Netherlands, Belgium, Poland and Romania), which were formerly part of Wholesale Banking, are now also part of Retail Banking.
Retail Banking2008 1,6912007 2,402
Operates direct retail banking activities in Australia, Canada, France, Germany and Austria, Italy, Spain, the United Kingdom and the United States. The main products offered are savings accounts and mortgages, and, increasingly, also mutual funds and payment accounts.
ING Direct2008 –1,1252007 530
ING Group Annual Report 2008
6
1.1 Who we are
Letter to stakeholdersSteering the business through turbulent times
Dear stakeholder,
2008 has been a much more challenging year for ING than was anticipated in February, when we announced a sharpened strategy and were still planning for growth. The magnitude of the crisis has left few companies untouched, and for ING 2008 has been marked by government support and disappointing financial results.
For several years ample liquidity and low interest rates fuelled an economic upturn. The burst of the bubble in real estate markets, especially in the United States, triggered a rapid decline in asset prices. As a result, financial institutions that had been heavily financed with debt had to sell assets to support their liquidity position. The result was a vicious circle of deleveraging, which created a strong, further downward pressure on equities, corporate bonds, real estate and private equity. This culminated in a wave of bank failures, solvency problems, government bailouts and (partial) nationalisation of a number of financial institutions, with significant implications for everyone, including fundamentally healthy companies.
For ING, the immediate consequence was a need to increase our capital position and ratios. International market expectations of capital levels had changed practically overnight, also against the backdrop of capital injections into financial institutions by the US and UK governments. The Dutch government responded to the market turmoil by establishing a facility for healthy financial institutions that needed extra capital. Given the exceptional circumstances, and our desire to find a quick, sizeable and proactive solution, we decided to use this facility for a EUR 10 billion capital strengthening agreement. We are grateful that the Dutch government appreciates the importance of a strong financial sector, and the role of ING in it, and has taken measures to boost the confidence in the sector and the stability of the financial system. The government’s involvement brings with it an increased need for ING to be responsive to the interests of Dutch society.
The sharp market deterioration resulted in significant impairments and negative revaluations across most asset classes, eroding our profit in 2008, resulting in our first ever annual loss. Our commercial performance remained satisfactory. That said, our results in 2008 are clearly disappointing for our customers, shareholders, employees and management alike.
We are fortunate and thankful for the continued loyalty of our customers, but the crisis has understandably damaged trust in our industry. For the entire sector, including ING, our clients’ confidence is our licence to operate. Our customers entrust us with their deposits and savings, expecting ING to carefully manage their money and invest it in a sensible way. Our business principles, the backbone of our approach to corporate responsibility, give us guidance on our responsibilities towards our customers as well as on such matters as the environment and human rights. These principles are the basis upon which customer confidence, and consequently, investor confidence in ING is built.
In January 2009, Michel Tilmant stepped down from his position as CEO of ING. We want to use this opportunity to thank Michel for his hard work over the last five years. Michel has given a lot to ING as CEO, transforming ING into a more focused organisation.
Jan Hommen will succeed Michel Tilmant as chairman of the Executive Board upon approval of his appointment to the Executive Board by the annual General Meeting on 27 April 2009. Peter Elverding has been appointed as Jan Hommen’s successor as chairman of the Supervisory Board. Wim Kok and Eric Bourdais de Charbonnière will retire from the Supervisory Board on that same day. Patrick Flynn will be nominated for appointment to the Executive Board to succeed John Hele as CFO. John Hele will leave the company on 31 March 2009. On behalf of our colleagues in the Executive Board and Supervisory Board we wish to express our gratitude and appreciation for the contribution Wim Kok, Eric Bourdais de Charbonnière and John Hele have made to ING.
On behalf of both the Executive Board and Supervisory Board, we also want to express our sincere thanks to our employees. Their efforts to demonstrate to customers every day that we take our responsibility to them very seriously are at the heart of this company.
2009 has started off as a challenging year, with the global economy in recession and a further deterioration of financial markets. In January, we announced an Illiquid Assets Back-up Facility by the Dutch State, which strongly reduces the risks in our portfolio. Furthermore, we are confronting the crisis head-on by preserving our capital base, reducing risk and bringing costs in line with the operating environment. In concurrence with the Illiquid Assets Back-up Facility, we announced measures to reduce costs including a 6% reduction of our workforce.
With regard to the future of the financial industry, we expect more modesty in scope and risk profile, greater impact of supervision and regulation, as well as higher capital requirements.
In this first phase of recovery, stabilising the company and restoring credibility are key. ING will concentrate on the basics, reducing the complexity of products and services. For the longer term, improving the fundamentals of our business and the commercial processes are high on the agenda. We will look at our business with fresh eyes to apply further focus and build a coherent set of strong businesses, and seek new ways of doing business so we can come through this crisis stronger and smarter.
Good things can come from challenging situations. We are steering the business through these turbulent times, focusing on today’s priorities with the discipline that these exceptional times require.
Jan HommenChairman of the Supervisory Board and CEO designate
Eric Boyer de la GirodayActing CEO, member of the Executive Board
ING Group Annual Report 2008
7
Information for shareholders
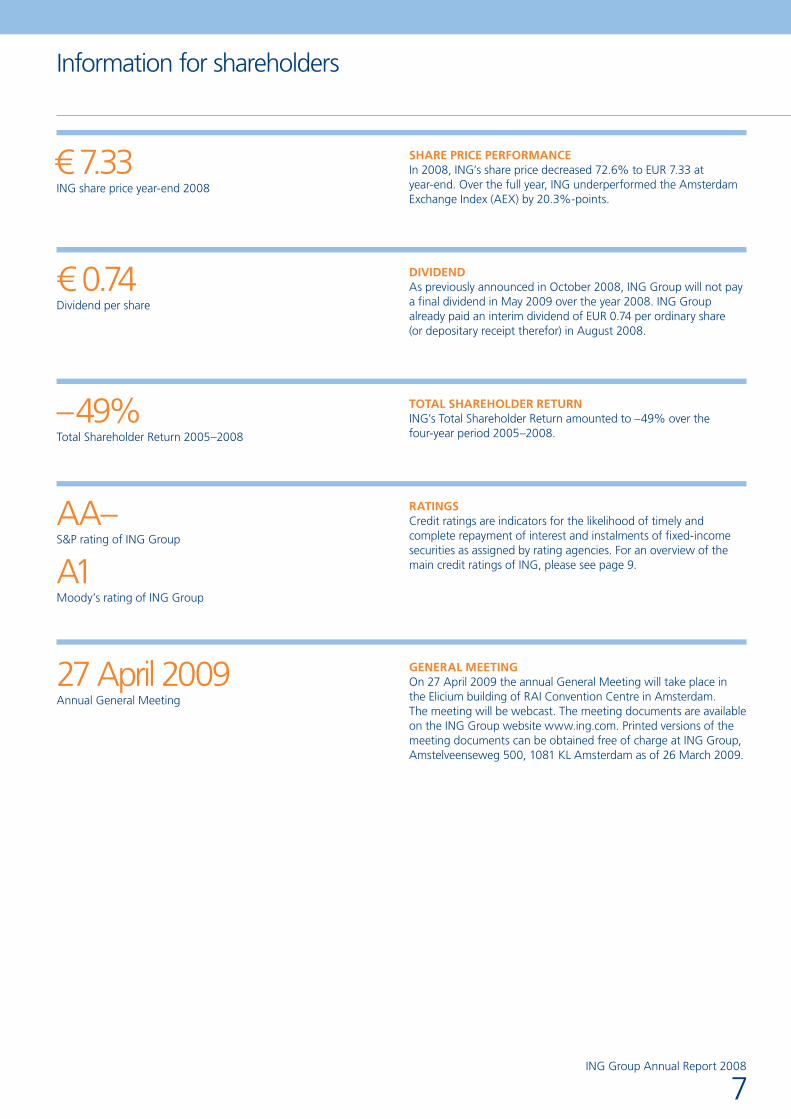
SHARE PRICE PERFORMANCEIn 2008, ING’s share price decreased 72.6% to EUR 7.33 at year-end. Over the full year, ING underperformed the Amsterdam Exchange Index (AEX) by 20.3%-points.
DIVIDENDAs previously announced in October 2008, ING Group will not pay a final dividend in May 2009 over the year 2008. ING Group already paid an interim dividend of EUR 0.74 per ordinary share (or depositary receipt therefor) in August 2008.
TOTAL SHAREHOLDER RETURNING’s Total Shareholder Return amounted to –49% over the four-year period 2005–2008.
RATINGSCredit ratings are indicators for the likelihood of timely and complete repayment of interest and instalments of fixed-income securities as assigned by rating agencies. For an overview of the main credit ratings of ING, please see page 9.
GENERAL MEETINGOn 27 April 2009 the annual General Meeting will take place in the Elicium building of RAI Convention Centre in Amsterdam. The meeting will be webcast. The meeting documents are available on the ING Group website www.ing.com. Printed versions of the meeting documents can be obtained free of charge at ING Group, Amstelveenseweg 500, 1081 KL Amsterdam as of 26 March 2009.
27 April 2009Annual General Meeting
€ 0.74Dividend per share
€ 7.33ING share price year-end 2008
–49%Total Shareholder Return 2005–2008
AA–S&P rating of ING Group
A1Moody’s rating of ING Group

ING Group Annual Report 2008
8
1.1 Who we are
Information for shareholders (continued)
PROFIT RETENTION AND DISTRIBUTION POLICYING Group’s profit retention and distribution policy is determined by its internal financing requirements and its growth opportunities on the one hand and the capital providers’ dividend expectations on the other. ING Group’s internal funding needs are determined partly by statutory solvency requirements and capital ratios, compliance with which is essential to its existence. Credit ratings are just as important to ING Group, because they directly affect the company’s financing costs and hence profitability. For their part, the capital providers expect a dividend which reflects ING Group’s financial results and is relatively predictable. Following the capital injection from the Dutch State, ING maintains full discretion to determine its dividend on ordinary shares.
ING Group has announced that it will not pay a final dividend in May 2009 over the year 2008. Given the intensity of the crisis, it is difficult to foresee whether ING Group will be in a position to pay a dividend in 2009. The interim dividend for 2009 will not automatically be half of the total dividend of 2008.
ING Group will continue to pay dividends in relation to underlying cash earnings, and will take a balanced approach to dividends in a careful and conservative manner in the next few years.
Core Tier-1 securitiesIn October 2008, ING Group took advantage of previously announced capital support facilities by the Dutch Government by issuing EUR 10 billion of core Tier-1 (‘Securities’) to the Dutch State with a coupon of 8.5%. This capital injection significantly enhanced the capital position of ING Group. The Securities are pari passu with common equity (there is no claim, even in liquidation). When a dividend is paid, however small, the coupon on the Securities is also payable, albeit only with the permission of DNB (the Dutch central bank). More information on the Securities and the relation between dividend on common shares and the coupon on the Securities is available in the Capital management section, starting on page 16.
Share buy-back programmeOn 16 May 2007, ING announced a share buy-back programme to purchase ordinary shares (or depositary receipts for such shares), with a total value of EUR 5 billion over a period of 12 months, beginning in June 2007. On 23 May 2008, ING Group announced that it had completed the share buy-back programme. Under the programme, ING has repurchased 183,158,017 ordinary shares (or the depositary receipts therefor) in the market for a total consideration of EUR 4,903,355,838.50, bringing the average purchase price for the total programme to EUR 26.77. The repurchased shares were cancelled in accordance with approval obtained at the 2008 annual General Meeting.
Preference A sharesOn 5 March 2008, ING announced the tender offer for the 6,012,839 issued and outstanding preference A shares (or the depositary receipts therefor) of ING Groep N.V., with a nominal value of EUR 1.20 each. The purchase price for each share offered in accordance with the Tender Offer was EUR 3.60, or EUR 21.6 million in total. The purpose of the buy-back of the preference A shares was to simplify the corporate ownership and capital structure of ING on a one-share-one-vote basis and to optimise its
capital structure. The tender period ended on 26 June 2008 and all preference A shares (or the depositary receipts therefor) were cancelled in accordance with the resolution of ING’s General Meeting held on 22 April 2008.
LISTINGSIn November 2008, ING Group announced its intention to concentrate the trading of its shares (or the depositary receipts therefor) on the stock exchanges in Amsterdam, Brussels and New York (NYSE). Accordingly, ING has sought voluntary delisting of shares from the stock exchanges in Frankfurt, Paris and Switzerland. All relevant authorities and exchanges have approved the applications to delist and trading was halted as of 20 January 2009 in Paris, as of 26 February 2009 in Frankfurt and as of 3 March 2009 in Switzerland. Options on ordinary shares ING Group (or the depositary receipts therefor) are traded at the NYSE Euronext Amsterdam Derivative Markets and the Chicago Board Options Exchange.
Authorised and issued capital
in millionsYear-end
2008Year-end
2007
Ordinary shares– authorised 1,080 720 – issued 495 534 Preference shares– authorised 360– issued 19Cumulative preference shares– authorised 1,080 1,080– issued – –
Shares in issue and shares outstanding in the market
in millionsYear-end
2008Year-end
2007
(Depositary receipts for) ordinary shares of EUR 0.24 nominal value 2,063.1 2,226.4
(Depositary receipts for) own ordinary shares held by ING Group and its subsidiaries 36.5 126.8
(Depositary receipts for) ordinary shares outstanding in the market 2,026.6 2,099.6
(Depositary receipts for) preference shares of EUR 1.20 nominal value 16
(Depositary receipts for) own preference shares held by ING Group and its subsidiaries 10
(Depositary receipts for) preference shares outstanding in the market 6
Prices depositary receipts for ordinary shares
Euronext Amsterdam by NYSE Euronext in EUR 2008 2007 2006
Price – high 26.21 34.69 35.95Price – low 5.33 24.38 27.82Price – year end 7.33 26.75 33.59Price/earnings ratio* n.a.** 6.2 9.4
* Based on the share price at year-end and underlying net profit per ordinary share for the financial year.
** Not applicable.
04/05 07/05 10/05 04/06 07/06 04/07 07/07 01/0801/06 01/07 10/07 04/08 07/08 01/0910/0810/0601/050
50
100
150
200
ING MSCI World Banks MSCI World Insurance
ING Group Annual Report 2008
9
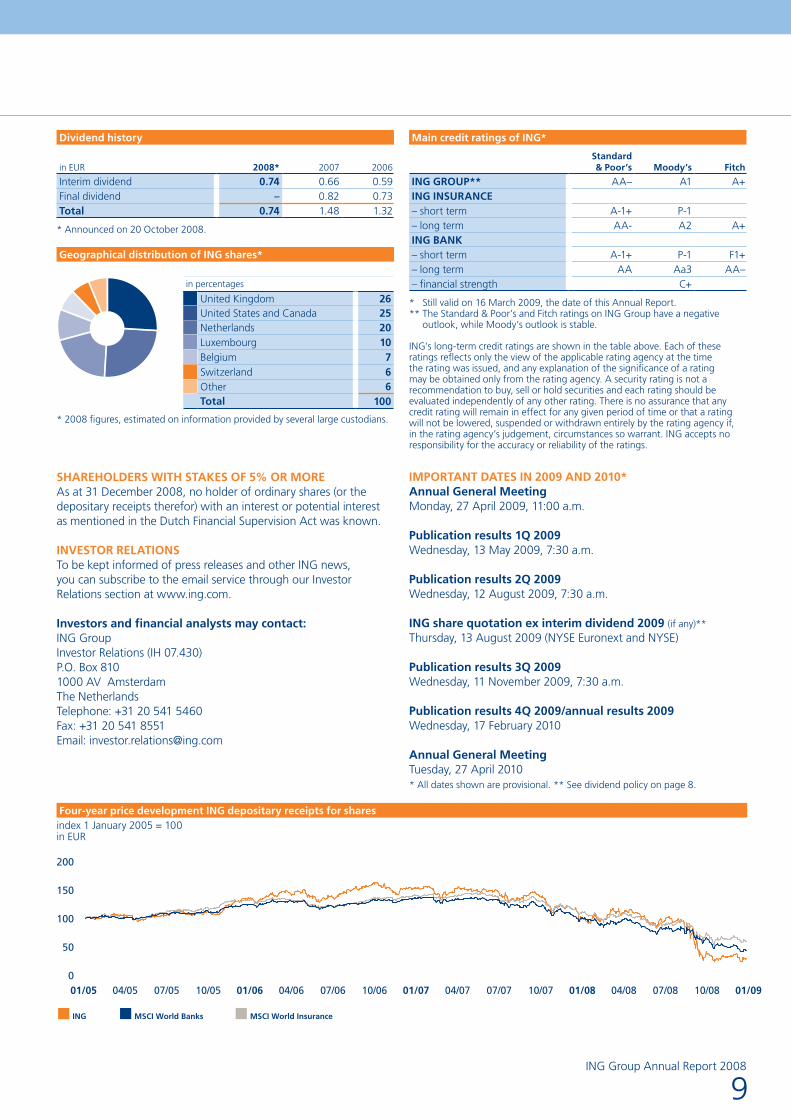
Main credit ratings of ING*
Standard & Poor’s Moody’s Fitch
ING GROUP** AA– A1 A+ING INSURANCE– short term A-1+ P-1– long term AA- A2 A+ING BANK– short term A-1+ P-1 F1+– long term AA Aa3 AA–– financial strength C+
* Still valid on 16 March 2009, the date of this Annual Report.** The Standard & Poor’s and Fitch ratings on ING Group have a negative
outlook, while Moody’s outlook is stable.
ING’s long-term credit ratings are shown in the table above. Each of these ratings reflects only the view of the applicable rating agency at the time the rating was issued, and any explanation of the significance of a rating may be obtained only from the rating agency. A security rating is not a recommendation to buy, sell or hold securities and each rating should be evaluated independently of any other rating. There is no assurance that any credit rating will remain in effect for any given period of time or that a rating will not be lowered, suspended or withdrawn entirely by the rating agency if, in the rating agency’s judgement, circumstances so warrant. ING accepts no responsibility for the accuracy or reliability of the ratings.
IMPORTANT DATES IN 2009 AND 2010*Annual General MeetingMonday, 27 April 2009, 11:00 a.m.
Publication results 1Q 2009Wednesday, 13 May 2009, 7:30 a.m.
Publication results 2Q 2009Wednesday, 12 August 2009, 7:30 a.m.
ING share quotation ex interim dividend 2009 (if any)**
Thursday, 13 August 2009 (NYSE Euronext and NYSE)
Publication results 3Q 2009Wednesday, 11 November 2009, 7:30 a.m.
Publication results 4Q 2009/annual results 2009Wednesday, 17 February 2010
Annual General MeetingTuesday, 27 April 2010* All dates shown are provisional. ** See dividend policy on page 8.
Dividend history
in EUR 2008* 2007 2006
Interim dividend 0.74 0.66 0.59Final dividend – 0.82 0.73Total 0.74 1.48 1.32
* Announced on 20 October 2008.
* 2008 figures, estimated on information provided by several large custodians.
SHAREHOLDERS WITH STAKES OF 5% OR MOREAs at 31 December 2008, no holder of ordinary shares (or the depositary receipts therefor) with an interest or potential interest as mentioned in the Dutch Financial Supervision Act was known.
INVESTOR RELATIONSTo be kept informed of press releases and other ING news, you can subscribe to the email service through our Investor Relations section at www.ing.com.
Investors and financial analysts may contact:ING GroupInvestor Relations (IH 07.430)P.O. Box 8101000 AV AmsterdamThe NetherlandsTelephone: +31 20 541 5460Fax: +31 20 541 8551Email: [email protected]
index 1 January 2005 = 100 in EUR
Geographical distribution of ING shares*
Four-year price development ING depositary receipts for shares
in percentages United Kingdom 26
United States and Canada 25 Netherlands 20 Luxembourg 10 Belgium 7 Switzerland 6 Other 6 Total 100
ING Group Annual Report 2008
1.2 Report of the Executive Board
10
StrategyAdjusting to a new reality
Key points> Confronting the crisis head-on> Prioritising customers, capital, risk and costs> Delivering an easier customer experience> Focus on banking, investments, life insurance
and retirement services
The global financial crisis has strongly impacted the financial services sector. ING has not been immune and has seen a corresponding deterioration in earnings. As maintaining the confidence of our stakeholders is essential to remain successful, we are confronting the crisis head-on by putting customers first, preserving our capital base, further mitigating risks and lowering costs. We will continue to align our long-term business strategy around a universal customer ideal: saving and investing for the future should be easier. This is even more valid going forward, as the crisis proves that financial institutions need to reduce the complexity of their product and services offering and go back to the basics of finance.
WEATHERING THE CRISISIn the course of 2008 the financial crisis intensified significantly. It has become evident that the long-lasting period of low interest rates and ample liquidity has triggered the emergence of incongruities in the financial sector. A combination of factors has severely undermined the proper functioning of the financial system: the mispricing of risk and excessive leverage by a number of financial institutions, the rapid emergence of toxic assets, the industry’s over-reliance on mathematical modelling; as well as the detrimental effects of certain incentive structures and the pro-cyclical working of accounting rules. As a result of the crisis, customer confidence in the sector has decreased significantly.
The consequences have been far-reaching. The market expectations of capital requirements for international financial institutions have increased substantially, forcing governments around the world to support banks with large capital injections. Unfortunately, ING was no exception. Although our commercial performance kept up reasonably well, the sharp market decline in 2008 led to significant impairments and negative revaluations across almost all asset classes, also affecting our earnings and capital position. Looking forward, all indicators suggest that market conditions will remain difficult throughout 2009.
BUSINESS INITIATIVESThe challenges we are facing in these exceptional times clearly require thoughtful solutions. Therefore, we are taking a fresh look at our business to seek new ways of doing business. In the Netherlands, the new bank created by combining ING Bank and Postbank began operating under the ING brand from 2009. In Belgium, we continued with the implementation of a new retail branch service concept, transforming traditional branches into outlets with automated self-service cash functions and online banking access. We invested in our retail banking network with a particular focus on Poland, Romania, Turkey and India. Building on our banking business, ING Direct aims to offer a more complete range of products in all countries, instead of offering single savings products. In Germany, ING Direct’s mortgage activities have been strengthened by the acquisition of Interhyp.
At Wholesale Banking, we reviewed and even selectively decreased our client coverage model in non-core markets. We reduced and exited certain volatile products and activities, especially in equities markets and within Financial Markets Strategic Trading. We will increasingly focus our full-service wholesale banking activities on

ING Group Annual Report 2008
11
Our efforts will be focused on disciplined execution of these plans in 2009, specifically by:
putting customers first;• preserving a strong capital position, including divestments that •free up capital; further mitigating risks; and • bringing our costs in line with the operating environment.•
Putting customers firstThe credit crisis has had a clear impact on customer needs, both in terms of product offering, as well as servicing models. These turbulent times prove once more that delivering an easier customer experience and going back to basics should be an essential part of our strategy. Hence, we will continue along the path chosen in 2007, when we launched our Easier programme, which emphasises the attributes that build customer trust and competitive advantage over the long term: customers expect us to be available when they need us, to provide them with a clear overview of their financial situation, to respond to their queries in a fast and efficient manner, to be open and transparent about our products and services and to provide them with objective and professional advice. Apart from the need to reinforce our efforts to deliver an easier customer experience, the crisis has created a shift in customer demand towards products that offer wealth-protection and risk reduction. Therefore, we will reposition our product portfolio to accommodate changing customer needs.
Preserving a strong capital positionThe economic environment has not only put pressure on the profitability of our business, but has also led to an internationally recognised belief that going forward, capital requirements for financial institutions should be higher. Although our capital position was above or in line with previously targeted levels and regulatory requirements, in October we decided to further strengthen our capital base in the form of the issuance of EUR 10 billion of core Tier-1 securities to the Dutch State. As a consequence, the ING Bank Tier-1 ratio rose to 9.32% as of 31 December 2008.
The current environment also forces us to reassess in what businesses and geographies ING has a strong market position that is sustainable for the long term. We aim to avoid asset growth in pressurised sectors and continue our efforts to deleverage our balance sheet and to reduce the volatility and complexity of our portfolio. We will make a number of selective divestments outside the core of our franchise to free up capital and simplify the organisation. We will do so in a disciplined manner. In February 2009, we sold our interest in ING Canada, the largest provider of property & casualty insurance products and services in Canada.
Mitigating riskING has been reducing risk across the balance sheet over the course of 2008. We aim to further reduce our risk exposure in the coming period. In 2008, we have started to reduce our real estate, private equity, corporate bond and interest rate exposure. We sold several equity stakes and implemented hedges. Moreover, we have begun to cap balance sheet growth for the bank and reduced market risk for insurance operations. In Taiwan, ING sold its life insurance business to Fubon Financial Holding, which resulted in a reduction of interest rate risk exposure.
the Benelux, where we aim to become the leading wholesale bank. ING also has ambitions to be a market leader in Poland and Romania, as well as in a number of key products globally, like Structured Finance.
In December 2008, we completed the acquisition of the Turkish voluntary pension company Oyak Emeklilik, which has been integrated in Insurance Europe. Oyak Emeklilik will be re-branded under the ING brand in 2009.
In the Americas, we are focused on the long-term growth opportunities presented by the ageing of the US population and the increasing wealth in Latin America. The acquisition of CitiStreet, one of the major retirement plan service and administration organisations in the US defined contribution market, provides us with an expanded geographic footprint and broader service offerings to customers. In Peru, we increased our stake in AFP Integra to 80%, the number one pension fund company by market share.
In Asia/Pacific, bank distribution was further reinforced through an exclusive agreement with the Royal Bank of Scotland in Hong Kong, and by sales expansion through TMB Bank from the Bangkok region to the entire branch network in Thailand. Furthermore, ING became one of the multi-region preferred strategic partners of HSBC Insurance.
STRATEGY: AdjUSTING To A NEW REAlITYFinancial institutions like ING have an important role to play in creating the conditions for social and economic progress, by taking and spreading the financial risks of individuals and companies. Yet, the credit crisis underscores that we can only do this if we are trusted by our customers. Earning and maintaining customer trust is therefore an absolute prerequisite for any financial institution to operate. As the increased complexity of the financial services industry has been a major cause of the crisis, going back to the basics of finance is inevitable.
ING has a clear eye for what lies at the heart of our business: collecting customer balances and redeploying these in the economy, by means of a self-originated loan book consisting of mortgages and corporate, private and other types of loans. We are well aware of our responsibilities and will continue to do our utmost to maintain the confidence of all our stakeholders and to contribute to a proper functioning of markets. We will align our long-term business strategy around a universal customer ideal: saving and investing for the future should be easier.
Going forward we will take steps to strengthen our financial position and adjust to the reality of the global recession while keeping focus on our long-term priorities. In the short to medium term, we will step up efforts to steer the business through these turbulent times, to stabilise our company and reinforce our credibility.

ING Group Annual Report 2008
1.2 Report of the Executive Board
12
Strategy (continued)
In January 2009, ING and the Dutch State reached an agreement on an Illiquid Assets Back-up Facility term sheet covering ING’s Alt-A residential mortgage-backed securities. Market prices for these securities had become depressed as liquidity dried up, which affected our results and equity far in excess of reasonably expected credit losses. This transaction with the Dutch State as described in the term sheet would significantly reduce the uncertainty regarding the impact on ING of any potential future losses on 80% of the portfolio. In 2009, we will continue to reduce our risk profile. We believe in a strong risk management function that is fully integrated into the daily management and strategic planning of all our business units. ING aims to close this transaction in the first quarter of 2009, but the closing is dependent on the completion of final documentation and approval of various regulators.
Bringing costs in line with the operating environmentWith pressure on margins and investment returns, it is vital to contain costs. In 2009 we announced to cut operating expenses by EUR 1 billion in 2009. The structural expense reduction is expected to lead to annual savings of approximately EUR 1.1 billion from 2010 onwards. Of the cutback, 35% will come from a reduction of the workforce by approximately 7,000 full-time positions in 2009. The remainder of the expense reduction comes from decreasing costs for our head office, marketing, the Formula 1 programme, consultancy, third-party staff and the renegotiating of certain contracts with IT-vendors.
By taking these measures we are bringing expenses in line with the operating environment. This will make ING leaner and more flexible as we position ourselves for an eventual recovery.
long-term prioritiesWe are convinced that it is in the long-term interest of all our stakeholders (customers, employees, communities, and shareholders) to do whatever is necessary to maximise business opportunities whilst maintaining the financial health and growth prospects of our company. Our focus on banking, investments, life insurance, and retirement services, enables us to provide retail customers with the products they need during their lives to grow savings, manage investments and prepare for retirement with confidence. With our wide range of products, innovative distribution models and strong footprints in both mature and developing markets, we have the economic, technological and demographic trends on our side.
We will continue to invest in our bank distribution platforms. We are able to serve our 85 million customers through different distribution channels – our direct banking channels and branches and also through tied agents, and via distribution agreements with other parties. Banks can fill many customer needs across a wide range of products from liquidity to lending and investing. Banking is also structurally well-positioned with many chances for customer interaction and long customer retention.
But even with the right mindset and structure in place, shielding customers from market risks while managing earnings volatility remains a challenge, especially in the uncertain market environment of today. Therefore, we also want to make sure that we continue to be able to generate a good portion of our own assets as well. Our wholesale banking activities will thus continue to play a fundamentally important role, as our expertise in this field helps us
generate the high-quality assets in which we can invest our retail deposits. Our wholesale banking business also provides us with relevant skills in risk management, and gives us access to financial markets around the world. Lastly, our asset management will also remain key to our strategy. In order to optimise our asset management skills we will further strengthen our capabilities and investment expertise to deliver first-class investment performance for our clients.
High-growth markets continue to play an important role for ING. Yet, given the new economic and regulatory realities and the necessity to preserve ING’s capital position, new investments will be tempered.
While drawing lessons from the crisis and the debate on the function of financial institutions in society, we will review the portfolio of the company in terms of markets, distribution models as well as product offering, in order to ensure our long-term competitiveness. We will focus on fewer, coherent and strong businesses. Also, we will simplify the organisation, improve the fundamentals of our business and invest in improving commercial processes.
Moreover, further strengthening of our brand around a universal ideal of delivering an easier customer experience remains a main objective, as awareness and appreciation of the ING brand is essential in building trust, a key driver for long-term business growth.
Last, but certainly not least, continued investment in our people is essential. ING is proud to have highly skilled and motivated staff. Hence, we will continue to promote people-oriented leadership, and to drive for excellence.
CoNClUSIoNS ANd AMBITIoNSThe global financial crisis made 2008 an extremely challenging year for all financial institutions and ING was no exception. The sharp market decline in 2008 has confronted us with significant impairments and negative revaluations across almost all asset classes. ING is confronting the crisis head-on by putting customers first, preserving a strong capital position, further mitigating risks and lowering costs.
While the global economy will be confronted with a recession in 2009, our first priority is to improve the financial fundamentals of the company, without losing perspective on the long term. We will assess our strategic focus and review our portfolio in the best interests of our customers, the markets we want to be in, our distribution models and our product offering. ING will pursue a universal customer ideal: saving and investing for the future should be easier.

ING Group Annual Report 2008
13
Financial highlightsResults impacted by dislocation in financial markets
In 2008, ING’s results were adversely impacted by the global financial crisis. The sharp market deterioration led to significant impairments and negative revaluations across almost all asset classes. Several steps were taken to strengthen ING Group’s capital position, including a capital support facility of EUR 10 billion by the Dutch State. ING also actively reduced risk exposures. The turmoil in financial markets caused a sharp decline in results for ING’s insurance operations. At the same time, the banking business reported positive net results despite the challenging circumstances.
GROUP RESULTSTotal net result decreased from EUR 9,241 million in 2007 to EUR -729 million. Underlying net result, which is defined as total net result excluding the impact of divestments and special items, decreased from EUR 9,172 million to EUR -171 million. Underlying result before tax decreased from EUR 11,080 million to EUR -786 million. Extreme market volatility and sharp declines in asset prices triggered impairments and fair value changes of EUR 5,081 million, of which EUR 2,599 million related to pressurised assets and EUR 1,707 million to equity securities. The remainder was attributable to impairments on other debt securities, including financial institutions’ debt.
Globally, real estate prices fell noticeably in 2008, leading to negative revaluations on real estate and impairments on development projects of EUR 1,184 million. Negative revaluations on private equity were EUR 399 million. Other impacts stemming from the weak financial landscape were EUR -162 million, including deferred acquisition cost unlocking and hedge losses, partly compensated by capital gains on equity securities. The weakening of most currencies against the euro during 2008 had a negative impact of EUR 163 million on net underlying result. Earnings per share decreased to EUR -0.36 from EUR 4.32.
Commercial performanceUnderlying result before tax of the Insurance operations decreased to a loss of EUR 1,235 million in 2008 from a profit of EUR 6,113 million in 2007. The sharp decline in results was mainly due to the financial market deterioration in the second half of 2008. However, the reported decline in 2008 is somewhat distorted by the fact that EUR 2,087 million in capital gains were booked in 2007. Underlying result before tax of the Banking operations declined by 91.0% to EUR 449 million. Retail Banking and Wholesale Banking remained profitable, while ING Direct turned to a loss of EUR 1,125 million due to impairments on pressurised assets.
Measured over the full-year 2008, net production of client balances was EUR 93 billion, excluding currency impacts. Including the impact of currency effects, total client balances remained stable at EUR 1,455 billion compared with the previous year. Client savings and deposits accounted for EUR 21 billion of the net production (excluding currency effects), EUR 12 billion of which was attributable to retail customers. At Insurance, positive net production of client balances was generated by all business lines as inflows in life insurance and retirement services more than offset outflows in third-party assets under management.
Overall, lending growth was robust in 2008, despite a fourth quarter decline in all markets except for the Netherlands. Of the client balance net production, bank lending contributed EUR 59 billion in 2008, excluding currency effects.
Bringing expenses in line with operating environmentUnderlying operating expenses (i.e. excluding the impact of divestments and special items) from Insurance operations decreased 0.6%. Underlying operating expenses from Banking operations increased 5.0% to EUR 10,002 million mainly at Retail Banking (due to the inclusion of ING Bank Turkey, formerly Oyak Bank) and ING Direct.
Contribution business lines to underlying result, excluding market volatility and risk costs
in percentages Insurance Europe 15
Insurance Americas 17 Insurance Asia/Pacific 6 Wholesale Banking 26 Retail Banking 24 ING Direct 12 Total 100
ING results 2008*Year-end 2008
in EUR million Bank Insurance Group
Underlying result, excluding market volatility and risk costs 5,263 2,057 7,319
Impairments and FV changes on pressurised assets –2,039 –560 –2,599Impairments on equity securities –331 –1,376 –1,707Impairments on other debt securities –255 –520 –775Impairments and losses –2,625 –2,455 –5,081
Revaluations on real estate/ impairments on development projects –732 –452 –1,184Revaluations on private equity –399 –399Revaluations –732 –851 –1,583Equity capital gains/equity hedge 30 1,181 1,211Equity related DAC unlocking –567 –567FX hedge/Other –206 –600 –806Other market impacts –176 14 –162Risk costs Bank –1,280 –1,280Underlying result before tax 449 –1,235 –786Tax and third-party interests 273 343 615Underlying net result 722 –893 –171Divestments and special items –267 –291 –558Total net result 454 –1,183 –729
* Numbers may not add up due to rounding.

ING Group Annual Report 2008
1.2 Report of the Executive Board
14
Financial Highlights (continued)
Across the organisation, cost-cutting initiatives have been implemented to adapt to the negative economic climate, amounting to a targeted overall cost reduction of EUR 1 billion in 2009.
Divestments and special itemsDivestments resulted in a gain after tax of EUR 7 million in 2008 compared with a gain of EUR 407 million in 2007. The impact from operations of divested units on total net result was EUR -50 million, versus EUR -4 million a year earlier. Special items in 2008 of EUR -515 million after tax were related to integration costs (mainly CitiStreet), the loss for the nationalisation of the pension business and provisioning for annuities in Argentina, the combination of ING Bank and Postbank in the Netherlands, the costs for the cancelled launch of ING Direct Japan, and the provisioning for the unwinding of the joint venture with Postkantoren BV in the Netherlands. The impact from divestments and special items is excluded in the underlying result.
Measures to strengthen capital and reduce riskING has taken several measures to strengthen the company. In October 2008, ING Group received a capital support facility, issuing core Tier-1 securities to the Dutch State for the consideration of EUR 10 billion. The facility significantly enhanced the capital position of ING Group (for more information, please refer to the Capital Management section).
In addition to the capital support facility provided by the Dutch State in 2008, ING received an Illiquid Assets Back-up Facility for 80% of our portfolio of Alt-A residential mortgage-backed securities (RMBS) in early 2009. This transaction will result in the reversal of 80% of the negative revaluation reserve held against the shareholders’ equity in relation to the Alt-A RMBS portfolio. As a result, ING Group’s shareholders’ equity will increase by EUR 4.6 billion. In addition, risk-weighted assets will decline by approximately EUR 13 billion, subject to discussions with regulators, increasing ING Bank’s Tier-1 ratio by 37 basis points to 9.7%, on a pro-forma basis. ING aims to close this transaction in the first quarter of 2009, but is dependent on the approval of various regulators.
The sale of the Taiwan life business substantially reduced our economic capital requirements, releasing EUR 5.7 billion in economic capital. The sale of the Canadian property and casualty business will further reduce leverage in the insurance business, and resulted in gross proceeds of CAD 2.2 billion (EUR 1.35 billion).
At year-end, all key capital and leverage ratios were within market norms. The debt/equity ratio of ING Group was 13.5%, while the debt/equity ratio of Insurance ended the year at 8.8%. The Tier-1 ratio of ING Bank under Basel II stood at 9.32%. The solvency ratio (BIS ratio for the bank) under Basel II was 12.78%. ING Group’s Available Financial Resources (AFR) at year-end 2008 was EUR 42.1 billion, compared to economic capital of EUR 30.7 billion after diversification, resulting in an AFR/EC Group ratio of 137%.
One of ING’s top priorities is to further reduce asset exposures and rationalise the cost base. We aim to shrink the balance sheet of ING Bank by 10% compared with the end of September 2008, while continuing to lend to key customers in our home markets. Also, we are reallocating investments towards less risky assets.
DividendING Group has announced that it will not pay a final dividend in May 2009, leaving the total dividend over the year 2008 at EUR 0.74 per share, which was paid as an interim dividend in August 2008. The first short coupon on the core Tier-1 securities will be paid to the Dutch State in May 2009, pending approval from DNB (the Dutch central bank). Given the intensity of the crisis, it is difficult to foresee whether ING Group will be in a position to pay a dividend in 2009. The payment of dividends is in relation to underlying cash earnings. In case a dividend is paid, the coupon on the Securities is also payable, subject to approval of DNB (the Dutch Central Bank).
INSURANCE OPERATIONSTotal result before tax from Insurance operations fell by EUR 8,168 million to a loss of EUR 1,635 million in 2008 from a profit of EUR 6,533 million in 2007. The underlying result before tax (excluding the impact of divestments and special items) decreased to a loss of EUR 1,235 million in 2008 from a profit of EUR 6,113 million in 2007. The sharp decline in results was mainly due to the deterioration of the financial markets in the second half of 2008, as well as EUR 2,087 million of gains on the sale of ING’s stakes in ABN AMRO and Numico in 2007.
Underlying result from life insurance fell to a loss of EUR 1,744 million from a profit of EUR 4,831 million last year. Investment income was negatively impacted by capital losses and impairments on equity and debt securities, as well as negative fair value changes on real estate and private equity investments. Furthermore, the result was negatively impacted by DAC unlocking in the US as well as losses on the SPVA business in Japan due to hedge losses.
Underlying result before tax from non-life insurance declined 60.3% to EUR 509 million from EUR 1,282 million last year, due primarily to capital losses and impairments on equities, as well as unfavourable underwriting results in Canada.
Underlying gross premium income from life insurance decreased 3.7%, but was up 3.3% excluding ING Life Taiwan and currency impact, to EUR 38,748 million, mainly driven by the US, Australia, and most countries in Asia. Underlying gross premium income from non-life insurance decreased 8.1%, or 4.1% excluding currency impact, to EUR 4,402 million, largely caused by the sale of the health business in Chile.
Underlying operating expenses from the Insurance operations decreased 0.6%, but were up 0.7% excluding ING Life Taiwan to EUR 5,188 million as cost containment helped to offset most of the investments to support growth of the business in Asia/Pacific and Central Europe. Furthermore, the 2007 operating expenses contained a EUR 89 million one-off net release of employee benefits provisions in the Netherlands.

ING Group Annual Report 2008
15
New sales, measured in annual premium equivalent (APE), for the life insurance business decreased 10.3%, or 7.8% excluding ING Life Taiwan to EUR 6,568 million primarily due to lower sales in the US, Australia, South Korea and Japan. APE is the sum of regular annual premiums from new business plus 10% of single premiums on new business written during the year. This decrease was in part offset by higher sales in Latin America, the Netherlands and Rest of Asia. The value of new business (VNB) decreased 8.1% to EUR 1,023 million. Excluding ING Life Taiwan, VNB remained flat compared to 2007.
BANKING OPERATIONSDespite the unprecedented impact of the financial crisis and challenging commercial environment, ING’s banking businesses reported commercial growth across all three business lines. Client balances went up EUR 61 billion to EUR 1,073 billion in total. Total result before tax from Banking operations declined 96.7% to EUR 148 million, driven by impairments and fair value changes due to the extreme market volatility and sharp decline in asset prices combined with higher risk costs. Underlying result before tax (excluding the impact of divestments and special items) declined by 91.0% to EUR 449 million. Retail Banking and Wholesale Banking remained profitable, while ING Direct reported a loss of EUR 1,125 million due to impairments on pressurised assets. Risk costs increased significantly due to worsening economic conditions.
Underlying income decreased 19.7% to EUR 11,731 million. The interest result, however, rose 22.3%, driven by higher margins at ING Direct and Wholesale Banking, the inclusion of ING Bank Turkey (formerly Oyak Bank) and an increase in volumes. Loans and advances to customers increased by EUR 72.0 billion, or 13.7%, to EUR 598.3 billion. Customer deposits and other funds on deposits increased by EUR 9.5 billion, or 1.8%, to EUR 537.7 billion. The total interest margin rose to 1.07% from 0.94% in 2007. Commission income decreased 1.1% driven by lower asset management fees and lower income from the securities business. Investment income fell from EUR 891 million in 2007 to EUR -2,459 million in 2008, mainly due to impairments on bonds and equities, and negative revaluations on real estate. Other income dropped 88% as a result of negative trading income and losses from associates.
Underlying operating expenses increased 5.0% to EUR 10,002 million mainly at Retail Banking due to the inclusion of ING Bank Turkey, and at ING Direct. The underlying cost/income ratio increased to 85.3% from 65.2% in 2007 driven by the sharp decline in income. The underlying net addition to the provision for loan losses increased to EUR 1,280 million from EUR 125 million in 2007. Risk costs in 2008 were 48 basis points of average credit-risk weighted assets, as gross additions to loan loss provisions of 62 basis points were offset by 14 basis points in releases.
The underlying risk-adjusted return on capital (RAROC) after tax fell to 2.6% from 22.3% in 2007, reflecting the impact of the market turmoil and a 31.6% increase in average Economic Capital due to methodology changes.
ASSET MANAGEMENTAssets under management declined by EUR 91.4 billion, or 14.2%, to EUR 551.3 billion in 2008, as a result of the sharp deterioration of financial markets. Lower asset prices for equity and fixed income securities had a negative impact of EUR 99.1 billion. Despite the depressed financial markets, ING recorded a net inflow of EUR 17.4 billion in 2008. All lines of business contributed to this net inflow with the exception of Insurance Europe which registered a net outflow of EUR 2.2 billion. Acquisitions and divestments had a net negative impact of EUR 6.2 billion. Furthermore exchange rates negatively impacted the growth of assets under management by EUR 3.6 billion.
LOOKING AhEADIn 2009, ING will operate in a difficult economic climate. Some of the main uncertainties are the development of the financial markets, the residential and commercial real estate markets, and a further deteriorating global economy, which will keep loan loss provisions and impairments at elevated levels. As we steer our business through these turbulent times, ING aims to mitigate risk, put in place measures to preserve capital and to reduce costs in line with the operating environment.

ING Group Annual Report 2008
1.2 Report of the Executive Board
16
Capital managementMaintaining a strong capital position
ING seeks to maintain a strong capital position and to allocate capital efficiently across the Group. The exceptional market conditions in 2008 had a significant negative effect on Shareholders’ equity. ING took a number of steps to strengthen its capital position. These included taking advantage of capital support facilities made available by the Dutch State.
Capital base: ING Groep N.V.
in EUR millionYear-end
2008Year-end
2007
Shareholders’ equity 17,334 37,208+ Core Tier-1 securities 10,000+ Group hybrid capital 11,655 8,620+ Group leverage (core debt) 7,170 4,728Total capitalisation (Bank + Insurance) 46,159 50,556–/– Revaluation reserves fixed income and other –6,769 963–/– Group leverage (core debt) (d) 7,170 4,728Adjusted equity (e) 45,758 44,865Debt/equity ratio (d/(d+e)) 13.5% 9.5%
Economic Capital and Available Financial Resources
EC ING Group 30,675 36,000AFR ING Group 42,135 49,715 AFR/EC ratio 137% 138%
Capital base: ING Verzekeringen N.V. (Insurance)
in EUR millionYear-end
2008Year-end
2007
Adjusted equity (e) 23,903 27,036Core debt (d) 2,301 4,267Debt/equity ratio (d/(d+e)) 8.8% 13.6%Available capital (a) 22,010 22,965EU required regulatory capital (b) 8,582 9,405Capital coverage ratio (a/b) 256% 244%
Economic Capital and Available Financial Resources
EC ING Insurance 13,681 23,199AFR ING Insurance 14,456 22,710
Capital base: ING Bank N.V.
in EUR millionYear-end
2008Year-end
2007
Core Tier-1 24,934 23,374Hybrid Tier-1 7,085 6,397Available capital Tier-1 32,019 29,772Other capital 11,870 11,792BIS capital 43,889 41,564Risk-weighted assets (1) 343,388 402,727Required capital Basel II 27,471Required capital floor based on Basel I 34,369Core Tier-1 ratio (1) 7.26% 5.80%Tier-1 ratio (1) 9.32% 7.39%BIS ratio (1) 12.78% 10.32%
Economic Capital and Available Financial Resources
EC ING Bank 22,407 17,927
AFR ING Bank 34,849 31,733(1) Based on Basel II as of 2008.

ING Group Annual Report 2008
17
MARKET CONDITIONSMarket conditions deteriorated dramatically during 2008, especially in the second half of the year. Credit spreads widened to unprecedented levels, raising the internal rate of return on many assets, but government interest rates and swap rates declined. Central banks cut short-term interest rates in the second half of the year. Equity markets fell throughout. The US dollar weakened during the first half of the year, but regained strength in the second half. The euro yield curve remained inverse for most of the year, but towards the end finally steepened somewhat thanks to ECB rate cuts. Equity, fixed income and real estate impairments negated underlying profitability. These market conditions significantly impacted Shareholders’ equity. ING Group took advantage of previously announced capital support facilities by issuing EUR 10 billion of core Tier-1 securities to the Dutch State in October. This capital injection significantly enhanced the capital position of ING Group.
CORE TIER-1 SECURITIESThe core Tier-1 securities (‘Securities’) were structured to be as similar to equity as possible without formally diluting existing shareholders through the issuance of common equity. The Securities are pari passu with common equity (there is no claim, even in liquidation). They have a coupon of at least 8.5% (higher according to a formula if the annual dividend on common equity exceeds EUR 0.68), but this coupon will only be paid (on a non cumulative basis) if a dividend is paid on common equity and even then only with permission of the Dutch central bank (DNB). Non-cumulative means that if a coupon is passed, it will not be due or payable in the future. The Securities are perpetual. Only ING Group as Issuer, with permission of DNB, can alter the fact that these Securities are outstanding. ING Group has a number of options open to it going forward apart from leaving the Securities outstanding. ING Group has the right to repurchase the Securities at any time with a premium of 50% over issue price. After three years ING Group may also convert the Securities on a one-for-one basis into common shares. However, if ING Group were to convert, the Dutch State may ask for redemption of the Securities at an issue price of EUR 10, all this again with permission of DNB. The transaction contains a paragraph on governance that is applicable as long as more than 25% of the Securities remain outstanding. The repurchase of the Securities is flexible. ING Group may repurchase all or part of the Securities when in the opinion of the DNB it can afford it. ING Group could use retained earnings for the repurchase of the Securities in the future. Alternatively, once the share price recovers to above EUR 15 per share, a rights issue can be considered to fund the repurchase.
As described above, the Securities are pari passu with common equity and have been structured to mirror common shares. As there are 1 billion Securities outstanding and just over 2 billion common shares, in liquidation the Securities and common shares share for one-third and two-thirds respectively in the value of the Group after all claims are paid. In a going concern situation the Securities have a claim on after-tax earnings of EUR 850 million per annum as long as dividends are paid and do not exceed EUR 0.68 per share.
DIVIDEND POLICYING Group has announced that it will not pay a final dividend on common equity in May 2009 over the year 2008. However, an interim dividend was paid in August 2008 and therefore the first short coupon on the Securities will be paid in May 2009 if DNB approves. Given the intensity of the crisis at the moment, it is difficult to foresee whether ING Group will be in a position to pay a dividend in 2009. The interim dividend for 2009 will not automatically be half of the total dividend of 2008. If ING Group resumes payment of dividends, it will continue to do so in relation to underlying cash earnings. Therefore ING will take a balanced approach to dividends in a careful and conservative manner in the next few years. In case a dividend is paid, the coupon on the Securities is also payable, subject to approval by DNB.
SUBSEQUENT EVENTSThe intensity of the crisis in the fourth quarter resulted in significant losses among the global financial institutions. In order to mitigate the impact of these results ING Group negotiated an Illiquid Assets Back-up Facility with the Dutch State in January 2009. Through this facility ING Group transfers 80% of its Alt-A mortgage assets in ING Direct US and ING Insurance US at a price of 90% of par in return for a government note. The up-front impact of this transaction was more or less neutral for the profit and loss account in 1Q, but reduced Risk Weighted Assets (RWAs) by approximately EUR 13 billion equivalent, subject to discussions with regulators. Also, approximately EUR 4.6 billion of negative revaluation reserves will be reversed in Shareholders’ equity.
GROUP EQUITYAdjusted equity of ING Group rose from EUR 45 billion to EUR 46 billion, but shareholders equity declined from EUR 37 billion to EUR 17 billion. ING Group received a capital injection from the Dutch State of EUR 10 billion. The two tables below explain these developments:
ING Group’s Shareholders’ equity movement in 2008
ING Group’s adjusted equity movement in 2008
10
15
20
25
30
35
40
15
20
25
30
35
40
45
50
Adj
uste
d eq
uity
Shar
ehol
ders
’ equ
ity
Gro
up h
ybrid
cap
ital
Cor
e Ti
er-1
sec
uriti
es
Reva
luat
ion
rese
rves
Goo
dwill
Adj
uste
d eq
uity
Shar
ehol
ders
’ equ
itybe
ginn
ing
of p
erio
d
Net
resu
lt fo
r the
per
iod
Fixe
d in
com
e re
valu
atio
ns+
cash
flow
hed
ge
Equi
ty re
valu
atio
ns
Div
iden
d an
dsh
are
buy-
back
Real
ised
gain
s
Shar
ehol
ders
’ equ
ityen
d of
per
iod
37.2 -0.7 -10.4
-5.6
-5.6
2.5 17.3
45.844.9 -19.9
10.0
3.0
-0.98.6
Shareholders’ equity declined due to unrealised losses on available for sale fixed income and equity assets that are booked against equity, dividends paid to shareholders and the remainder of the buy-back. In adjusted equity the revaluation reserve fixed income is added back, given the asymmetry of the accounting for assets and liabilities.

ING Group Annual Report 2008
1.2 Report of the Executive Board
18
Capital management (continued)
Available for sale assets are marked to market through Shareholders’ equity whilst liabilities are booked on an amortised cost basis. If ING Group were to mark its financial liabilities (senior term debt, dated subordinated debt and hybrids) to market, approximately EUR 12 billion would be added to Shareholders’ equity at the end of 2008. Adjusted equity improved by EUR 1 billion in spite of the decline in Shareholders’ equity because of an increase in hybrid Tier-1 capital, the capital injection from the Dutch State and the adding back of the revaluation reserve.
KEY CAPITAL AND LEVERAGE RATIOSGroup leverage, defined as equity investments into Bank and Insurance from Group minus adjusted Group equity, increased from EUR 5 billion to EUR 7 billion or, in other words, from 9.5% to 13.5%. Group paid out EUR 3 billion in dividends to shareholders and EUR 2 billion on the remainder of the share buy-back. Group injected EUR 2.95 billion into Bank and EUR 2.65 billion into Insurance during the year. As indicated, Group also received a capital injection from the Dutch State of EUR 10 billion.
Group raised EUR 1.5 billion and USD 2 billion of hybrid Tier-1 capital during 2008. The EUR issue was on-lent to Insurance and Bank on a 50/50 basis. The USD issue was on-lent to Insurance and Bank on a 75/25 basis. Also during the year a net USD 600 million of hybrids were moved from Bank to Insurance.
Tier-1 capital at Bank increased from EUR 30 billion to EUR 32 billion, although the definition of Tier-1 capital changed, moving from Basel I to Basel II. Basel II Tier-1 capital is approximately EUR 1 billion less than Basel I Tier-1 due to different deduction rules. Net profit in Bank was approximately EUR 0.5 billion. RWAs grew by 17% from EUR 293 billion at the start of the year to EUR 343 billion at the end of the year. Basel I RWAs grew by 18% from EUR 403 billion to EUR 477 billion at the end of the year. The nominal balance sheet of Bank increased from EUR 994 billion to EUR 1,030 billion, only 4%. The difference between nominal balance sheet growth and the growth of RWAs can be explained by the relative reduction of money market activities. Nominal lending by Bank grew from EUR 526 billion to EUR 598 billion, an increase of 14%.
The debt/equity ratio of Insurance decreased from 14% to 9% in spite of significant capital injections into operating subsidiaries throughout the year, especially in the fourth quarter. The amount was a net EUR 4 billion, compensated, however, by capital injections from Group and the on-lending of hybrid Tier-1 capital. At the end of the year Insurance had a hybrid ratio slightly above the 25% target.
AVAILABLE FINANCIAL RESOURCES AND ECONOMIC CAPITALIncreasingly ING looks at Available Financial Resources (AFR) and Economic Capital (EC) employed when managing capital. These concepts come from our internal risk management models. EC is a measure for the totality of risks run in the company over a one-year time horizon and with a AA confidence interval of 99.95%. AFR equals market value of assets minus market value of liabilities, excluding hybrids issued by ING Group which are counted as capital. At ING Bank the proxy for AFR is Tier-1 capital with certain adjustments, in the absence of a full market value
balance sheet for ING Bank. AFR should exceed EC for both ING Bank and ING Insurance. EC for ING Group is defined as EC ING Bank plus EC ING Insurance minus the diversification benefit. The diversification is partially due to opposite interest rate positions in ING Bank and Insurance and is prudently estimated at 15%. AFR ING Group equals AFR ING Bank plus AFR ING Insurance minus core debt ING Group. The target is that ING Group AFR should be at least 120% of ING Group EC. It is policy that any buffer should be able to be deployed with maximum flexibility and therefore be kept centrally. Free surplus is defined as the difference between AFR and EC.
AFR Bank increased from EUR 32 billion to EUR 35 billion during the year. The capital injections from Group to Bank more than compensated the loss for the year. EC Bank increased from EUR 18 billion to EUR 22 billion, given the increase in RWAs and also a methodology change. Interest rate risk resulting from the investment of capital is now included in the calculation. The free surplus at Bank declined from EUR 14 billion to EUR 13 billion.
AFR Insurance declined in light of the adverse market circumstances (higher credit spreads, lower interest rates and lower equity markets) and the incurred loss of over EUR 1 billion from EUR 23 billion to EUR 14 billion during the year. EC Insurance, however, decreased as well from EUR 23 billion to EUR 14 billion, given the sale of ING Life Taiwan and other actions implemented to reduce risk in spite of lower interest rates. This means that there was a small free surplus at Insurance at the end of the year. AFR and EC are adjusted to reflect illiquidity in the insurance portfolios as reporting AFR and EC with MVLs discounted at swap rates results in an asymmetry between the assets and liabilities in terms of reflection of illiquidity premiums. This has been approximated by applying a AAA covered bond spread to the valuation of the insurance liability cash flows, adjusted for the US and Japan with the difference between the local AAA corporate spreads and the European corporate spreads. At year-end 2007 the swap rate was used.
AFR ING Group decreased from EUR 50 billion to EUR 42 billion during 2008, while EC ING Group decreased from EUR 36 billion to EUR 31 billion. Thus the free surplus declined from EUR 14 billion to EUR 11 billion. This means that the capital buffer decreased from 138% at the end of 2007 to 137% at the end of 2008. Going forward we expect the AFR and EC numbers, given that they are market value based, to continue to be quite volatile.
THE INVESTMENT OF CAPITAL AND THE METHOD OF CHARGING FOR ITBanks have developed methods of partitioning the balance sheet’s assets and liabilities in books where assets are matched against liabilities. This allows for more granular risk management of the balance sheet. The surplus assets that offset equity are separated and it is good practice for these assets to be (at least notionally) invested risk free. This stems from the idea that risks are best run (with the most return) in the business and that the surplus assets representing equity are there to support the business risks and should not themselves be at risk. Insurance companies have developed this discipline of matching assets against liabilities and equity to a much lesser extent, in part due to the fact that the time horizons of insurers are longer than those of banks.

ING Group Annual Report 2008
19
For many years, as part of its capital management policy, RAROC methodology and transfer pricing business model, ING Bank has used a system of capital investment rules and of capital charging and benefits to manage the balance sheet and make business results comparable. Capital is invested credit risk free (notionally) and the returns on the assets in the capital book are charged away from the business units in return for the euro risk free rate on the Economic Capital they employ. Business units with this method become insensitive to the local capital they actually hold but become sensitive to the Economic Capital they employ. Capital can no longer be used as free funding to support earnings. This management accounting method makes all business units comparable as it includes the adjusted return over Economic Capital, irrespective of the amount of capital they hold and currency conditions they operate in. This then facilitates optimal allocation of capital as the returns on Economic Capital reported by the business units are comparable.
CAPITAL MARKET OPERATIONSIn 2008, the following issues were done:
For ING Groep N.V.EUR 10,000 million core Tier-1 securities•EUR 1,000 million 5-year senior unsecured bond• EUR 1,500 million hybrid Tier-1 capital in retail market• USD 2,000 million hybrid Tier-1 capital in retail market, fixed rate•
For ING Bank N.V.EUR 1,000 million 5-year covered bond•EUR 4,000 million 2-year senior unsecured bond•EUR 2,000 million 10-year covered bond•EUR 3,500 million 3-year senior unsecured bond•EUR 1,000 million lower Tier-2•GBP 800 million lower Tier-2• USD 1,250 million extendible, institutional market•
LIQUIDITY FACILITIESAlthough demand from international investors for securitised assets has all but disappeared and securitisations of a bank’s own assets have become less effective under Basel II, 2008 was a very active year for securitisations. Under Basel I the sale of (super) senior tranches of securitisations to investors led to a significant reduction of RWAs on the bank balance sheet without a significant transfer of risk taking place. This arbitrage is no longer possible under Basel II. Also, after the summer of 2007 the market for securitisations dried up, even for the most highly rated senior tranches of securitisations. However, lack of liquidity in the unsecured money markets has since then raised the demand for eligible collateral and this has created a new use for securitisations.
The transaction can be summarised as follows: a bank sells a pool of mortgages to a Special Purpose Vehicle (SPV). The SPV issues secured notes in two tranches, one subordinated tranche and one senior tranche, the latter rated AAA by the rating agencies. The bank buys both tranches, but can now use the AAA-rated tranche as collateral in the money market for secured borrowings. With the securitisation, illiquid assets have thus become to a large extent liquid. The Basel II RWAs of the bank remain unchanged. During 2008, ING Bank created a number of these securitisations through which in total approximately EUR 70 billion of AAA-rated notes were created. Own-originated mortgages in the Netherlands were
used as the underlying assets. Apart from the structuring and administration costs these securitisations are P&L neutral.
ACQUISITIONS AND DIVESTMENTSIn 2008, the acquisitions and divestments of ING Group balanced in terms of transaction value. Total divestments in the amount of EUR 1.5 billion comprised mainly of the sale of the Mexican non-core insurance business to AXA and the sale of our Taiwanese life insurance business to Fubon Financial Holding (closed on 11 February 2009). Furthermore, we closed the sale of NRG to a subsidiary of Berkshire Hathaway in June 2008 which was announced in December 2007. In South Korea we sold our 20% stake in the asset management joint-venture KBAM to KB Financial Group while we acquired the remaining 14.9% in ING Life Korea from Kookmin Bank. ING and KB Financial Group remain committed to their strategic partnership in Korea via the 49% stake in KB Life Insurance while ING increased its stake in KB Financial Group to 5.05%. Add-on acquisitions amounted to a value of about EUR 1.3 billion in 2008 and include the acquisition of CitiStreet in the US, Interhyp in Germany and Oyak Emiklilik in Turkey.
On 19 February 2009 we completed the sale of our stake in ING Canada via a secondary offering for proceeds of CAD 2.2 billion (EUR 1.35 billion).

ING Group Annual Report 2008
1.2 Report of the Executive Board
20
RISK MANAGEMENT IN TIMES OF CRISISTaking measured risks is part of ING’s business. As a financial services company active in banking, investments, life insurance and retirement services, ING is naturally exposed to a variety of risks. To ensure measured risk-taking ING has integrated risk management in its daily business activities and strategic planning. Risk Management assists with the formulation of risk appetite, strategies, policies and limits and provides a review, oversight and support function throughout the Group on risk-related issues. Investment and trading decisions are based on extensive internal research.
Like other financial institutions, ING has not been immune to the market turmoil. The turmoil started in the US subprime mortgage market in early 2007 and intensified over 2008 as prices fell across most major asset classes throughout the world. Equity markets lost significant ground; over the course of the year the S&P 500 declined by 38% and the Dutch Amsterdam Exchange index (AEX) by 52%. Real estate prices were generally under pressure. In the US the S&P Case-Shiller Index showed a cumulative decline in housing prices of 18.6% over 2008. Credit spreads in the corporate and financial sectors widened significantly, both in the US and Europe. As liquidity became tight, central banks around the world were quick to provide funding to prevent the interbank market from drying up. There were also a number of financial institutions that failed during the year. As the turmoil spread beyond the financial sector it also affected consumer confidence, other sectors and economic growth. All of these factors placed major strains on risk management departments in financial services companies, including ING, and emphasised the importance of having a robust risk management organisation in place that can take forceful measures to reduce risk.
Risk mitigating actionsAlthough some limits had been set at more stringent levels since early 2007, anticipating a downturn in the market, ING has taken additional actions over time to reduce risk across major asset classes.
De-leveragingING is working to reduce the bank balance sheet by 10% by decreasing the non-lending part by 25%. The available for sale portfolio will be reduced over time as proceeds from maturing securities will be used to fund ING-originated loans. Reducing trading activities, deposits at other banks and reverse-repos will make up most of the remaining reduction. At the same time, lending activities will be maintained with focus on the corporate and retail business.
Credit riskIn January 2009, ING entered into an Illiquid Assets Back-up Facility terms sheet with the Dutch State covering ING’s Alt-A Residential Mortgage-Backed Securities (RMBS) portfolio. Through this transaction, which is expected to close in the first quarter of 2009, subject to final documentation and regulatory approval, the Dutch State will become the economic owner of 80% of the Alt-A RMBS portfolio. This transaction is expected to be concluded at 90% of the EUR 30 billion par value of the portfolio. Following the deteriorated economic outlook in the third and fourth quarter, market prices for these securities had become depressed as
Risk managementMitigating risk a top priority
2008 was a challenging year for the financial sector. The crisis that originated in the US housing market intensified in the second half of the year, with prices falling across most asset classes and the turmoil impacting the broader economy around the world. Top global banks and financial institutions worldwide were impacted. ING Group has not been immune to developments in the markets, however its approach to risk management and the steps it has taken to reduce risk have helped in limiting the impact. In this environment a robust risk management organisation is essential.
Pre-tax P&L impact impairments, fair value changes and trading losses
in EUR million 2008 2007
US subprime RMBS –120 –64Alt-A RMBS –2,064 0CDOs/CLOs –394 –51Monolines –9 –66Investments in SIVs, ABCP –11 –45Leveraged Finance 0 –29Total –2,598 –255
US subprime RMBS, Alt-A RMBS and CDO/CLO exposures and revaluations at year-end 2008
in EUR million Market value
Pre-tax revaluation
via equity
US subprime RMBS 1,778 –1,146
Alt-A RMBS 18,847 –7,474
CDO/CLO 3,469 –352
Total 24,094 –8,972

ING Group Annual Report 2008
21
liquidity dried up, which had an impact on ING’s results and equity far in excess of estimated credit losses. Under the terms of the facility, ING will transfer 80% of each security in the Alt-A RMBS portfolios to the Dutch State. The Dutch State will absorb 80% of the risks and returns on the Alt-A RMBS portfolios. ING will remain exposed to 20% of the result of the Alt-A RMBS portfolios and will remain the legal owner of 100% of the securities. As such the transaction will significantly reduce the uncertainty regarding the impact on ING of any future losses in the portfolio. In addition, as a result of the facility, 80% of the Alt-A RMBS portfolios will be derecognised from ING’s balance sheet under IFRS. Therefore, 80% of the negative revaluation reserve on the securities will be reversed, resulting in an increase of EUR 4.6 billion in Shareholders’ equity. Another benefit of the facility is that it will reduce the amount of ING’s risk weighted assets approximately EUR 13 billion, subject to discussions withe regulators.
As condition to the Facility ING committed to support the growth of the Dutch lending business for an amount of EUR 25 billion at market-conform conditions.
ING is careful in mortgage underwriting and does not originate subprime mortgages. Moreover, ING has generally not been in the business of manufacturing subprime RMBS or Collateralised Debt Obligations (CDOs) nor has it purchased a material amount of CDOs backed by US subprime mortgages.
Reduction of equity exposure (available-for-sale)Direct public equity exposure was reduced from EUR 15.8 billion at the end of 2007 to EUR 5.8 billion at year-end 2008. The portfolio contains EUR 1.9 billion strategic banking stakes, mainly in Bank of Beijing and Kookmin Bank. ING Insurance has the remaining EUR 3.9 billion balance sheet exposure which was partially hedged against further market losses. In addition, a temporary hedging programme was put in place to reduce earnings volatility as a result of deferred acquisition cost (DAC) unlocking.
Reduction of interest rate riskING sold ING Life Taiwan which resulted in a reduction of its interest rate risk exposure. This divestment was in line with the strategy to allocate capital to those businesses that generate the highest return. In addition, ING lengthened its asset duration in order to hedge the impact of declining interest rates, herewith further reducing its interest rate risk exposure.
IMPACT ON ING’S ASSET BASEING primarily collects retail savings around the world and invests them in the economy. As one of the world’s largest savings banks, ING built up a substantial and high-quality balance sheet of EUR 1,332 billion at the end of 2008. There are three major blocks of assets in ING’s core loan book. There is EUR 620 billion consisting of well-rated or collateralised corporate loans and mortgages. Another EUR 258 billion is in investments, 97% of which is invested in debt securities and 3% in equity securities. Finally, ING has EUR 281 billion in financial assets at fair value.
The core loan bookING’s core loan book consists mainly of corporate loans and mortgages. The core loan book continues to perform well despite a continuous increase in risk cost over the year. Total net additions to loan loss provisions were EUR 1,280 million. This translates to
(annualised) 48 basis points of average credit risk-weighted assets. Especially in the second half of 2008 risk costs increased due to higher additions to loan loss provisions in Wholesale Banking and ING Direct US.
Debt securitiesSome EUR 73 billion of the investment portfolio concerns Asset Backed Securities (ABS) which include US subprime RMBS, US Alt-A RMBS, US CDOs and US Collateralised Loan Obligations (CLOs). The ABS portfolio comprises mainly AAA (85%) and AA-rated securities (9%) and is well-diversified due to limits, investment policies and mandates for every portfolio. The Illiquid Assets Back-up Facility reduces the ABS portfolio by EUR 15 billion to EUR 58 billion.
Financial assets at fair valueAs a result of the ongoing and unprecedented volatility in global financial markets, ING incurred negative revaluations and write-downs on its investment portfolio. The table on the first page of this section shows the negative revaluations and losses taken on the pressurised asset classes during 2008. Unrealised gains(/losses) relate to the available for sale (fixed income) securities and are taken into account in the revaluation reserve in Shareholders’ equity. Impairments, fair value changes and trading losses are directly charged to the profit and loss account.
US subprime mortgagesING has a very limited exposure to US subprime RMBS and does not originate subprime mortgages. Exposure to US subprime RMBS was EUR 1.8 billion at 31 December 2008, representing 0.1% of total assets and was valued at 58% of its cost. The exposure is of relatively high quality; at year-end 77% of the portfolio was rated AA or higher. The negative pre-tax revaluation on US subprime RMBS at 31 December 2008 was EUR 1,146 million. Net impairments and trading losses combined amounted to EUR 120 million. Alt-A RMBS portfolioAlt-A mortgage loans are regular residential mortgage loans in the US market which are frequently packaged into a RMBS. Notwithstanding the widespread existence of Alt-A RMBS a single standardised definition does not exist. As such ING uses a broader definition than some other financial institutions. Under the ‘broad’ definition of Alt-A RMBS, the applicable RMBS contains at least one of the following three characteristics: • on average a loan-to-value ratio between 70-100%; or • a so-called FICO credit score between 640-730; or • low quality or no documentation (referring to reduced
requirements regarding personal income and/or asset verification) of 50% of the debt holders in the portfolio or more.
At year-end, ING’s exposure under the broad definition was EUR 18.8 billion representing 1.4% of total assets. About 65% of the portfolio is rated AAA. ING Direct has the largest part of the Alt-A RMBS exposure, which was EUR 16.3 billion at year-end.
Under the ‘narrow’ definition a security qualifies as Alt-A RMBS if it meets all three criteria simultaneously (i.e. change ‘or’ to ‘and’). Under the narrow definition ING Direct’s exposure amounted to EUR 6.2 billion at 31 December 2008.
ING Group Annual Report 2008
1.2 Report of the Executive Board
22
On average, the ING Direct Alt-A RMBS portfolio is near prime and of high quality with a loan-to-value ratio of 72% and an average FICO score of 723. The negative pre-tax revaluation at 31 December 2008 was EUR 6,155 million for ING Direct (and EUR 7,474 million for ING as a whole).
ING’s Alt-A RMBS portfolio continues to benefit from the high level of ‘attachment points’ (the point at which credit losses are incurred), which provide structural protection equal to the overcollateralisation plus the subordinated tranches in the RMBS. Losses from underlying mortgage pools are first absorbed by the overcollateralisation and the subordinated RMBS tranches. A credit loss occurs when the underlying losses breach, or are expected to breach, the lower threshold. An estimated credit loss triggers an impairment of the specific RMBS tranche. IFRS requires that the impairment reflects a full write-down to market value. As the current Alt-A RMBS prices are hampered by illiquid markets, an impairment is significantly higher than the expected credit loss of the RMBS tranche.
In the second half of 2008 ING Direct impaired Alt-A RMBS bonds for the first time; 99 of the 734 Alt-A RMBS bonds in the portfolio were impaired. ING Direct recorded EUR 1,776 million of pre-tax impairments on the Alt-A RMBS portfolio in 2008 (and EUR 2,064 million for ING as a whole). The impairments are driven by a relatively small credit loss. ING continues to review its RMBS portfolio, and performs structural monitoring activities at the level of the individual security.
As mentioned above, ING took steps in January 2009 to reduce the risk on its Alt-A RMBS portfolio by entering into an agreement with the Dutch State, whereby the Dutch State absorbs 80% of the risk and returns of ING’s Alt-A RMBS portfolio and ING’s risk is limited to the remaining 20%.
CDOs and CLOsING uses a conservative definition for CDOs/CLOs. ING includes derivatives on corporate indices and credits as synthetic CDOs in its CDO/CLO exposure. The vast majority of the CDOs/CLOs have investment grade corporate credit as underlying assets, only EUR 1 million has US subprime mortgages as underlying assets. At year-end the Group’s net exposure to CDOs and CLOs was EUR 3.5 billion, or 0.3% of assets. Net impairments and trading losses combined taken on CDOs/CLOs totalled EUR 394 million. At the end of the year the portfolio was valued at 85% of cost, with a negative pre-tax revaluation of EUR 352 million.
Equity securities (available-for-sale)Another component of the available-for-sale investment portfolio is equity securities. At 31 December ING had in this caption direct equity exposure of EUR 5.8 billion (public) and EUR 0.4 billion (private). This contains EUR 1.9 billion strategic banking stakes, mainly in Bank of Beijing and Kookmin Bank. ING Insurance has the remaining EUR 3.9 billion balance sheet exposure which is partially hedged against further market losses. In addition a temporary hedging programme was put in place to reduce earnings volatility from potential negative DAC unlocking. ING generally decides to
impair a listed equity security based on two broad guidelines: when the market value is below 75% of the cost price or when the market price of the security is below the cost price for longer than six months. EUR 1,707 million of pre-tax impairments on the above mentioned direct public equity exposures were recorded in 2008.
Real estateING has EUR 15.5 billion of real estate exposure of which EUR 9.8 billion is subject to revaluation through the profit and loss account. In 2008, ING recorded EUR 1,184 million pre-tax negative revaluations and impairments. ING’s real estate portfolio has high occupancy rates and is diversified over sectors and regions, but is clearly affected by the negative real estate markets throughout the world.
LIQUIDITY RISK MANAGEMENT AT INGIn the volatile markets of 2008 liquidity management was a key issue. A number of liquidity problems have appeared in the market due to US subprime concerns, including challenges rolling over short-term asset-backed commercial paper in the secondary market, increased credit spreads and shorter terms. ING’s approach to liquidity management requires a surplus of liquid assets, liquidity contingency plans and close monitoring of market conditions. ING enjoys a favourable funding base with customer deposits providing 61% of total funding. Retail and corporate deposits are relatively stable sources of funding.
Since the start of the credit crisis ING’s Liquidity Crisis Committee, chaired by the chief risk officer, has met regularly to discuss ING’s liquidity and funding profile. The liquidity position and market conditions were monitored daily. Large buffers of liquidity were retained throughout 2008, and as a result, contingency funding plans, in place at all levels, were not required to be executed as ING’s liquidity position remained sound.
CONTINUING UNCERTAINTIESAs the financial crisis has not yet run its course, ING still faces a number of uncertainties. It is expected that economic conditions will weaken further. Some of the main uncertainties are:
The development of the global real estate market: • As mentioned above, the S&P Case-Shiller Index showed a 18.6% decline in US housing prices over 2008. The global real estate market is expected to further deteriorate into 2009 and is expected to negatively affect ING’s Real Estate portfolio. Equity markets: • As mentioned above, global stock markets fell significantly over 2008, impacting the value of ING’s investment portfolio. As the outlook for the stock markets remains uncertain, and can further reduce the value of the portfolio, ING is both actively reducing its exposure and hedging equity positions. Impact of credit migration: • Loan loss provisions and impairments will stay at elevated levels. A marked deterioration in the mortgage market outlook is reflected in default curves which are predicted to be higher for an extended period of time. In the current market, ING anticipates additional downgrades in securities as well as internal ratings on corporate customers, leading to further increases in credit risk weighted assets. The deteriorating global economy is expected to keep loan loss provisions going forward at elevated levels.
Risk management (continued)

ING Group Annual Report 2008
23
metrics since it was used as a tool to inform the Executive Board of the impact of potential risk-mitigating actions on the Group-wide risk profile. A full disclosure of the Earnings and Capital at Risk Dashboard, as well as other stress testing, and ING’s Economic Capital is included in the Risk section of the Annual Accounts.
ING’s risk governance framework ensures that the risk appetite is communicated and enforced throughout the Group. The framework contains three lines of defence: the business lines themselves, which have the primary responsibility for day-to-day management; Risk Management and Finance, which provide high-level policies, limits and risk oversight, as well as day-to-day transaction approval; and Corporate Audit Services, the internal audit department within ING Group, which provides an independent assessment of the design and effectiveness of internal controls over the risks to ING’s business performance.
Non-Financial Risk DashboardIn 2008, Risk Management introduced a Non-Financial Risk Dashboard for all business units providing integrated information on compliance, operational, information and security risk. Especially in these times of turmoil it is particularly pressing to ensure business continues as normal and is able to react quickly to potential risk breaches that could have a negative impact.
RISK MANAGEMENT SUPPORTS THE BUSINESSRisk Management benefits ING and its shareholders directly by providing more efficient capitalisation and lower costs of risk and funding.
The cost of capital is reduced by working closely with rating agencies and regulators to align capital requirements to risks. Funding costs are kept low and risk costs are mitigated by minimising potential losses.
Individual business units benefit from being part of a globally diversified group. Risk Management helps them lower funding costs, make use of the latest risk management tools and skills, and lower strategic risk, allowing business units to focus on their core expertise with the goal of making ING’s businesses more competitive in their markets.
Risk measurement allows ING to identify portfolios generating economic value. Risk management can help identify the most economically promising areas as well those businesses that are underperforming and in some cases need to be sold.
SOUND COMPLIANCEING believes that our compliance practices are in the best interest of its customers, shareholders and staff, and is important for the way ING does business. Complying with relevant laws, regulations and ethical/internal standards, in both letter and spirit, is essential for maintaining a good reputation. It also leads to lower operational risk costs and more stable business processes.
Low interest rates: • Over the course of 2008 interest rates declined in both the US and the Eurozone putting pressure on Insurance earnings. It is part of ING’s risk reduction programme to mitigate the impact of declining interest rates.
The market turmoil has demonstrated the importance of having a robust risk management organisation in place. Although ING’s risk management organisation and favourable liquidity profile have helped to limit the impact and manage the company throughout the turmoil, ING will continue to further strengthen its risk management organisation. The lessons learned in this crisis will contribute to this continuous process. Redefining risk appetite, de-leveraging and de-risking will remain key tasks. A more detailed disclosure of outstanding risk factors facing ING and the financial industry turn to the Risk factors section in the Additional Information part of the Annual Report.
ING’S RISK MANAGEMENT ORGANISATIONING Risk Management’s mission is to build a sustainable competitive advantage by fully integrating risk management into daily business activities and strategic planning. The following principles support this objective:
products and portfolios are structured, underwritten, priced, • approved and managed appropriately, and compliance with internal and external rules and guidelines is monitored; ING’s risk profile is transparent, with ‘no surprises’, and • consistent with delegated authorities; transparent communications are maintained with internal • and external stakeholders on risk management and value creation; and, the market turmoil underscores the importance of living by • this risk mission statement.
In recent years, ING has systematically improved its risk management capabilities with investments in people, governance, processes, measurement tools and systems. This has become necessary as investor demands have increased, regulation has become more sophisticated and as secondary markets have continued to decline. In 2008, ING invested in a number of areas including the further development of the risk trainee programme and liquidity risk management (with a further centralisation of treasury activities). Compliance was further embedded within ING Bank and ING Insurance.
Determining the risk appetiteFinancial Risk DashboardThe risk appetite, or the willingness of the Group to take risks, is defined by the Executive Board and measured through three key metrics: Earnings at Risk and Capital at Risk which are measured in the Financial Risk Dashboard, and Economic Capital. Business line managers aim to maximise value relative to these measures, while Risk Management monitors and controls the actual risk profile against the Group’s risk appetite. The metrics enable the Executive Board to identify risk concentrations and potential risk-mitigating actions. They provide an overview of risks inherent in all the banking and insurance businesses and facilitate monitoring the adherence of risk-taking with respect to the Groups’ risk appetite. It thereby allows ING to take strategic decisions using comparable risk measures and to maximise efficient capital allocation. The current crisis demonstrates the importance and value of these
ING Group Annual Report 2008
1.2 Report of the Executive Board
24
The Executive Board and Senior Management share a clear vision of reputation management that goes well beyond the compliance and operational risk functions. They expect the highest levels of personal conduct and integrity from all employees and managers to safeguard the Group’s reputation. In 2008, Compliance Risk Management helped develop and roll out the Non-Financial Risk Dashboard, which gives management an overview of all key risks in their jurisdiction.
ING’s Financial Economic Crime Policy (FEC Policy) was enhanced in 2008 to provide a clearer statement on combating criminal activity and on ING’s participation in international efforts to counter money laundering and the funding of terrorist and criminal activities.
Extraterritorial regulationsING continuously reviews US laws and regulations which have an extraterritorial effect on ING’s businesses. As an NYSE-listed company and because of ING’s regulated activities in the US, ING must comply with some key pieces of US legislation. To ensure compliance, the Executive Board approved a plan of action requiring ING’s legal and compliance officers at all levels to inform the managers of the businesses of these laws, to help business management assess if there are any gaps in business practices (gap analysis), and to incorporate the relevant laws in the business compliance charts.
Financial institutions continue to experience close scrutiny by regulatory authorities, governmental bodies, shareholders, rating agencies, customers and others to ensure they comply with the relevant laws, regulations, standards and expectations. Bank and insurance regulators and other supervisory authorities in Europe, the US and elsewhere continue to oversee the activities of financial institutions to ensure that they operate with integrity and conduct business in an efficient, orderly and transparent manner. ING seeks to meet the standards and expectations of regulatory authorities and other interested parties through a number of initiatives and activities, including scrutinizing account holder information, payment processing and other transactions to support compliance with regulations governing money-laundering, economic and trade sanctions, bribery and other corrupt practices. The failure or perceived failure by ING to meet applicable standards in these areas could result in, among other things, suspension or revocation of ING’s licences, cease and desist orders, fines, civil or criminal penalties and other disciplinary action which could materially damage ING’s reputation and financial condition, and accordingly ING’s primary focus is to support good business practice through its Business Principles and group policies. ING Bank N.V. has continued discussions with its Dutch bank regulator De Nederlandsche Bank (DNB) related to transactions involving persons in countries subject to sanctions by the EU, the US and other authorities and its earlier review of transactions involving sanctioned parties. In connection with that review and related discussions ING Bank has undertaken to complete the global implementation of enhanced compliance and risk management procedures, and to monitor the implementation of such procedures on an ongoing basis, as instructed by DNB. ING Bank also remains in discussions with authorities in the US and in other jurisdictions concerning these matters, including with respect to ongoing information requests, and it is not possible to predict at this time the outcome thereof.
As a result of our frequent evaluation of all businesses from economic, strategic and risk perspectives ING continues to believe that for business reasons doing business involving certain specified countries should be discontinued, which includes that ING has a policy not to enter into new relationships with clients from these countries and processes remain in place to discontinue existing relationships involving these countries. At present these countries include Myanmar, North Korea, Sudan, Syria, Iran and Cuba. ING Bank N.V. is now in the final stages of liquidating the Netherlands Caribbean Bank, which is since 2007 a 100% owned subsidiary.
Training and educationING started several global training programmes in 2008, including a global compliance training programme for 11,000 managers around the world. A training course was launched for Money Laundering Reporting Officers that aims to support the implementation of the updated FEC Policy. ING also started a course for all 750 compliance officers worldwide to increase personal effectiveness. Finally, a new e-learning course has been developed for all employees in the Netherlands updating them on financial laws and regulations, based on a course created in 2006. A PARTNER TO THE BUSINESSThe turmoil in the financial markets has underscored the need for sound risk management, especially in times of difficulty. Risk Management will continue to work closely with the business lines to support their strategic decisions, to help them identify and execute commercial opportunities, and to monitor asset, capital, liquidity and funding requirements. ING will manage its assets and risk profile in line with its risk appetite. Risk management has evolved significantly at ING and now serves as a true partner to the various businesses, helping them generate value and reduce risk.
Risk management (continued)
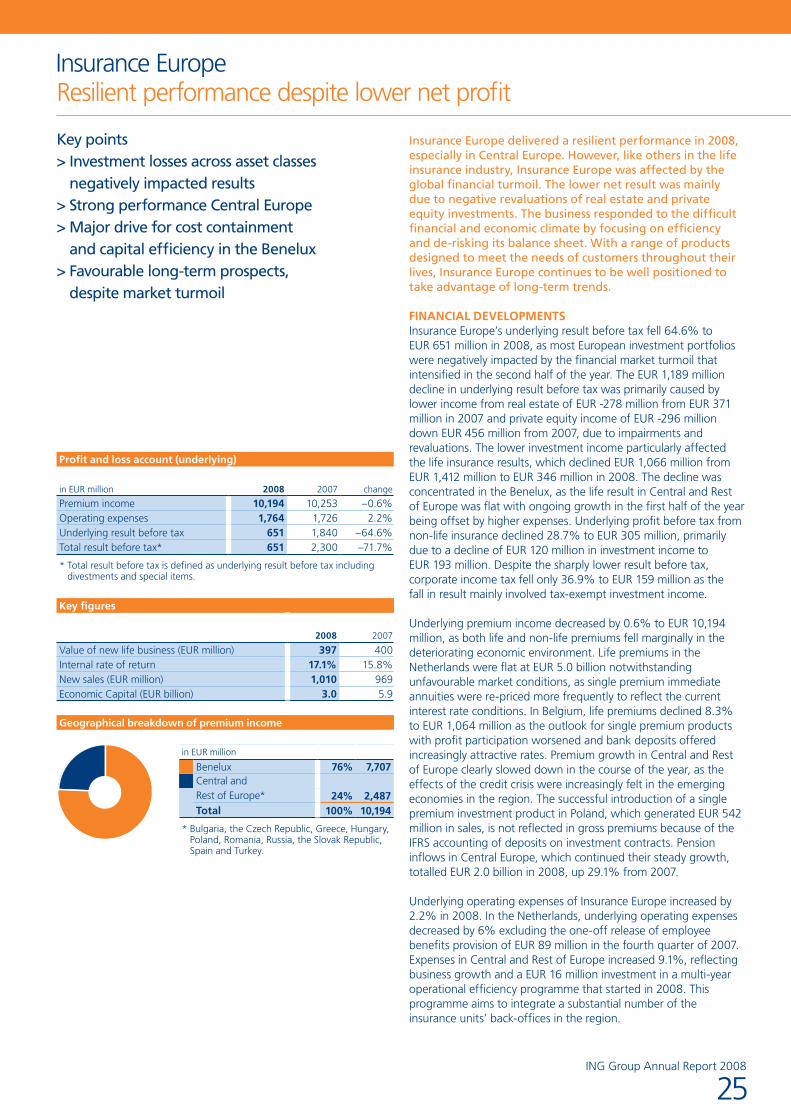
ING Group Annual Report 2008
25
Insurance EuropeResilient performance despite lower net profit
Key points> Investment losses across asset classes
negatively impacted results> Strong performance Central Europe> Major drive for cost containment
and capital efficiency in the Benelux> Favourable long-term prospects,
despite market turmoil
Insurance Europe delivered a resilient performance in 2008, especially in Central Europe. However, like others in the life insurance industry, Insurance Europe was affected by the global financial turmoil. The lower net result was mainly due to negative revaluations of real estate and private equity investments. The business responded to the difficult financial and economic climate by focusing on efficiency and de-risking its balance sheet. With a range of products designed to meet the needs of customers throughout their lives, Insurance Europe continues to be well positioned to take advantage of long-term trends.
FINANCIAL DEVELOPMENTSInsurance Europe’s underlying result before tax fell 64.6% to EUR 651 million in 2008, as most European investment portfolios were negatively impacted by the financial market turmoil that intensified in the second half of the year. The EUR 1,189 million decline in underlying result before tax was primarily caused by lower income from real estate of EUR -278 million from EUR 371 million in 2007 and private equity income of EUR -296 million down EUR 456 million from 2007, due to impairments and revaluations. The lower investment income particularly affected the life insurance results, which declined EUR 1,066 million from EUR 1,412 million to EUR 346 million in 2008. The decline was concentrated in the Benelux, as the life result in Central and Rest of Europe was flat with ongoing growth in the first half of the year being offset by higher expenses. Underlying profit before tax from non-life insurance declined 28.7% to EUR 305 million, primarily due to a decline of EUR 120 million in investment income to EUR 193 million. Despite the sharply lower result before tax, corporate income tax fell only 36.9% to EUR 159 million as the fall in result mainly involved tax-exempt investment income.
Underlying premium income decreased by 0.6% to EUR 10,194 million, as both life and non-life premiums fell marginally in the deteriorating economic environment. Life premiums in the Netherlands were flat at EUR 5.0 billion notwithstanding unfavourable market conditions, as single premium immediate annuities were re-priced more frequently to reflect the current interest rate conditions. In Belgium, life premiums declined 8.3% to EUR 1,064 million as the outlook for single premium products with profit participation worsened and bank deposits offered increasingly attractive rates. Premium growth in Central and Rest of Europe clearly slowed down in the course of the year, as the effects of the credit crisis were increasingly felt in the emerging economies in the region. The successful introduction of a single premium investment product in Poland, which generated EUR 542 million in sales, is not reflected in gross premiums because of the IFRS accounting of deposits on investment contracts. Pension inflows in Central Europe, which continued their steady growth, totalled EUR 2.0 billion in 2008, up 29.1% from 2007.
Underlying operating expenses of Insurance Europe increased by 2.2% in 2008. In the Netherlands, underlying operating expenses decreased by 6% excluding the one-off release of employee benefits provision of EUR 89 million in the fourth quarter of 2007. Expenses in Central and Rest of Europe increased 9.1%, reflecting business growth and a EUR 16 million investment in a multi-year operational efficiency programme that started in 2008. This programme aims to integrate a substantial number of the insurance units’ back-offices in the region.
Profit and loss account (underlying)
in EUR million 2008 2007 change
Premium income 10,194 10,253 –0.6%Operating expenses 1,764 1,726 2.2%Underlying result before tax 651 1,840 –64.6%Total result before tax* 651 2,300 –71.7%
* Total result before tax is defined as underlying result before tax including divestments and special items.
Key figures
2008 2007
Value of new life business (EUR million) 397 400Internal rate of return 17.1% 15.8%New sales (EUR million) 1,010 969Economic Capital (EUR billion) 3.0 5.9
Geographical breakdown of premium income
in EUR million Benelux 76% 7,707
Central and Rest of Europe* 24% 2,487 Total 100% 10,194
* Bulgaria, the Czech Republic, Greece, Hungary, Poland, Romania, Russia, the Slovak Republic, Spain and Turkey.

ING Group Annual Report 2008
1.2 Report of the Executive Board
26
Insurance Europe (continued)
In 2008, Insurance Europe received EUR 2.3 billion in (net) capital contributions from the Corporate Line Insurance. These capital contributions were needed to meet regulatory and/or internal solvency requirements, as available solvency was adversely affected by declining market values of the investment portfolios.
The value of new business was virtually flat at EUR 397 million although new sales (annual premium equivalent or APE) increased by 4.2% to EUR 1,010 million, due in particular to higher sales in the Netherlands after inclusion of group contract renewals in the definition of new sales. APE is the sum of regular annual premiums from new business plus 10% of single premiums on new business written during the year. The Romanian second-pillar pension fund, which was launched in September 2007, contributed EUR 73 million in value of new business and EUR 40 million in new sales in 2008.
COUNTRY DEVELOPMENTSUnderlying profit before tax in the Netherlands decreased by 83.2% to EUR 242 million, due mainly to negative revaluations and impairments on real estate and private equity investments in 2008 and the upstream of EUR 5.0 billion to the Corporate Line Insurance in 2007.
Underlying profit before tax in Belgium and Luxembourg increased by 23.1% to EUR 80 million. Both the life and non-life results were higher in 2008 due to one-off claims provision releases and the transfer of equity losses and impairments to the Corporate Line Insurance, whereas the profit sharing for policyholders was lower to reflect the negative return on equity investments. This was partly offset by higher expenses, due to business growth and organisational changes.
Central and Rest of Europe’s 2008 underlying profit before tax of EUR 329 million was essentially unchanged in comparison with last year. Continued business growth, predominantly in the first half of 2008, generated higher commissions and direct investment income which were offset by higher operating expenses and negative revaluations and impairments on investments.
BUSINESS DEVELOPMENTSInsurance Europe operates in the mature Benelux market and the emerging markets of Central Europe, with a focus on life insurance and retirement services. It is the leading life insurer and pension provider in both the Netherlands and Central Europe. In addition, Insurance Europe operates life insurance businesses in Spain, Greece, Russia and has a growing presence in Turkey. Commercial performance was resilient in 2008, especially in Central Europe, which continued to see strong net pension inflows and traditional life sales. However, like others in the industry, Insurance Europe was negatively affected by the global financial turmoil. The lower net result is mainly attributable to negative fair value changes on real estate and private equity investments.
Benelux insurance operationsWithin the Benelux, ING maintains its focus on the pension and life insurance business while continuing to enhance cost and capital efficiency.
Cost containment and capital Cost containment in the Netherlands was reflected in lower staffing levels and increased operational efficiency. Underlying operating expenses decreased by 6% excluding the one-off release of employee benefits provision of EUR 89 million in the fourth quarter of 2007. Life insurance operations in Belgium are continuing their operational efficiency efforts.
Efforts have been made to reduce the capital needs of the business by reducing the risk in the investment portfolio, including net sales of EUR 3 billion of public equity and a European equity hedging programme of EUR 2.8 billion, substantially reducing the impact of market volatility on the financial results.
Leveraging solid distribution powerThe life insurance market in the Benelux remains highly competitive. ING is focused on maintaining profitability and returns by enhancing its multi-channel distribution platform, reducing costs and reinforcing its market position as the specialist in retirement services.
AZL, a Dutch provider of pension fund management services which was acquired in 2007, has been successfully incorporated into the Group life business and is now operating as an integrated pension provider. This enables ING to provide integrated service offerings – fiduciary asset management and administration capabilities – to company pension funds, which are increasingly outsourcing these activities.
In the non-life sector, the innovative car insurance product distributed through the proprietary bank channel (via the internet, phone and bank branches) in Belgium continued its strong performance with over 50,000 policies sold in 2008. In the Netherlands, non-life maintained its market share in the property & casualty as well as the disability & accident insurance business in a competitive market.
Settling of disputeIn mid-November 2008 ING reached an outline agreement with consumer organisations in the Netherlands to resolve a dispute regarding individual universal life insurance products sold to customers in the Netherlands by ING’s Dutch insurance subsidiaries. It was agreed ING’s Dutch insurance subsidiaries will offer compensation to policy holders where individual universal life policies have a cost charge in excess of an agreed maximum. The costs of the settlement have been valued at EUR 365 million. Although the agreement is not binding for policyholders, ING believes a significant step was set towards resolving the issue.
Nationale-Nederlanden further demonstrated its commitment to improve customer confidence and transparency by ceasing production of its individual unit-linked life insurance policies, and by launching a new generation of fully transparent variable annuity products in the course of 2008.

ING Group Annual Report 2008
27
Stable growth in Central and Rest of EuropeBased on market share, ING is the number one pension and life insurance provider in Central Europe. Markets in Central Europe tend to be sizable, with a growing middle-class: demographic conditions that are conducive to growth in life insurance and retirement services. In 2008, ING in Central and Rest of Europe showed solid financial results and sales in general were up.
Overall, the number of customers increased from 7 million to 8.6 million, especially through the success of the Romanian second pillar pension fund. In Poland, where about half the region’s profit was recorded, premium income rose by 85% after the successful introduction of a single premium investment product (‘Optima’) sold through the bank channel. In Poland and in the Czech Republic APE increased by 42% and 24% respectively. Furthermore, an integrated transformation programme was launched in the region to leverage size into economies of scale by creating one operating model for all businesses, to reduce costs and increase synergies.
Solid performance in pensionsA growing number of customers and increasing wages resulted in a solid performance in the pensions business in Central Europe. In Poland, ING is the number two ranked pension provider with 2.6 million customers (24% market share) and over EUR 9 billion in assets under management (AuM). Strong inflows continued and the market share has increased.
The strong performance of the two Romanian ING pension funds continued in 2008 with ING’s market-leading position supplemented by the final governmental ‘lottery’, through which a further 300,000 customers were allotted to ING’s pension fund. ING is Romania’s number one pension fund provider with a market share of almost 40% with 1.4 million customers. Furthermore, ING secured the pension contract for 35,000 employees at Romania Post.
ING Bulgaria won group pension deals with some well-known companies in the country, for instance with the national TV station. ING Pension Insurance Company will also provide a comprehensive voluntary pension contribution scheme to the main telecommunication operator, BTC. The contract covers approximately 5,000 employees and has the potential to extend to the entire staff of more than 9,000. It is one of the largest pension plans of its type in Bulgaria.
Enhancing the multi-channel distribution networkING is implementing a multi-channel distribution approach, with a blend of channels such as tied agents, bancassurance and brokers. Direct channels are mainly used to generate leads. An example of this approach is a pilot with ING Direct in Spain.
Insurance Europe has the long-term ambition to grow sales through bancassurance in Central and Rest of Europe. ING has a solid retail banking presence in the large markets of Poland, Romania and Turkey. In addition, Insurance Europe has developed distribution agreements with third-party banks in other countries. In Greece it has a bancassurance joint-venture with Piraeus Bank. For the longer term, ING will focus on growth in pension and life insurance client balances driven by economic growth and growth in retirement services.
Several initiatives have been taken to enhance tied agent effectiveness in Central and Rest of Europe, such as the roll-out of a region-wide programme to increase value of new business by strict activity management, standardised monitoring, intensive coaching and joint field work.
New operationsING entered the Turkish market by acquiring Oyak Bank in 2007, and in 2008 integrated it into the ING Group, rebranding it ING Bank Turkey. In December 2008, ING completed the acquisition of Turkish voluntary pension company Oyak Emeklilik, providing the opportunity to enter the growing Turkish pension market. Turkey is a sizeable market, with a population of approximately 70 million. Oyak Emeklilik is Turkey’s sixth largest pension company with over EUR 150 million AuM. The acquisition was financed entirely by internal financial resources. Oyak Emeklilik will be integrated into Insurance Central and Rest of Europe and was rebranded under the ING brand in February 2009.
Ukrainian life insurance greenfield postponed In July 2008, ING received approval from the relevant authorities to start life insurance operations in Ukraine. However, economic circumstances in Ukraine have deteriorated drastically due to the global financial turmoil. As a result of this instability, ING decided to postpone its greenfield life insurance operation there. ING still considers Ukraine to be an attractive emerging market, with strong growth indicators and potential and will continue to monitor Ukraine’s commercial climate. This is witnessed by the fact that ING launched retail banking operations in Ukraine in 2008, based on the successful Romanian self-banking concept.
CONCLUSIONS AND AMBITIONSThe fundamentals of ING Insurance Europe’s well-diversified portfolio are solid. Commercial performance is resilient, expenses are under control and ING is well positioned to take advantage of major trends in areas where it is present.
Insurance Europe will reinforce its position as the specialist in investments and retirement services across Europe. Although economic prospects are muted due to the global economic climate, long-term growth prospects remain favourable. Insurance Europe will re-base the business to respond to market conditions, through a focus on expense reduction and capital management. In Central and Rest of Europe, ING will build on its leading position and focus on broadening the distribution base and increasing its operating efficiency.

in EUR million US 86% 18,736 Canada 12% 2,671 Latin America* 2% 480 Total 100% 21,887
* Excludes ING’s joint venture in Brazil because it is a minority interest.
ING Group Annual Report 2008
1.2 Report of the Executive Board
28
Insurance AmericasFocus on long-term opportunities
Key points> United States results significantly affected
by unprecedented downturn in markets> CitiStreet acquisition boosts
Retirement Services business> Shift towards traditional insurance lifts sales> Top-line growth in Latin America solid
but returns lower> Canada weathers turmoil reasonably well
Insurance Americas results were significantly affected by the global financial turmoil, which resulted in substantial credit and investment-related losses together with lower sales of equity-linked products. The CitiStreet acquisition has given Retirement Services in the US a robust platform for further growth. Sales in Latin America remained constant, while returns were lower and Canada produced firm results given the challenging market circumstances.
FINANCIAL DEVELOPMENTSUnderlying result before tax declined to a loss of EUR 534 million in 2008 from EUR 2,062 million profit in 2007. The US recorded a loss of EUR 1,117 million compared to a profit of EUR 1,356 million in 2007, following the severe impact of the turbulent financial environment. This result included investment losses of EUR 965 million, of which EUR 811 million related to credit losses. In addition, deferred acquisition costs (DAC) unlocking had a negative impact of EUR 1,180 million in 2008, compared with a positive impact of EUR 14 million in 2007. The underlying result was also impacted by negative alternative asset returns and lower fee income, as positive net flows could not overcome asset under management erosion and higher hedging costs. Underlying profit before tax in Canada decreased 22.6%, or 17.7% excluding currency effects, to EUR 364 million, driven by a lower underwriting result due to unfavourable claims experience, which was partially offset by higher investment results and lower impairments on fixed interest securities. Underlying profit before tax in Latin America decreased by 6.8%, or 2.3% excluding currencies, to EUR 220 million. The life business posted EUR 44 million lower profit, triggered by lower investment gains in Mexico. The profit from the non-life business improved by EUR 28 million, due to higher results in Brazil, including a tax reserve release of EUR 24 million.
Premium income decreased by 1.1% to EUR 21,887 million, but rose 6.9%, excluding currency effects. In the US, premiums increased by 8.4%, excluding currency impact, as sales of retirement services, variable and fixed annuities and insurance were higher than 2007 levels. Premium income in Canada decreased 4.2% to EUR 2,671 million, but increased by 1.7% excluding currency impact, reflecting rate increases in personal lines but a lower number of new insured risks. Premiums in Latin America decreased 20.6%, excluding currency effects, reflecting the sale of the Chile health insurance business in the first quarter of 2008, which was partly offset by higher annuity sales.
Operating expenses increased by 3.0% to EUR 2,340 million, or 10.5% excluding currency effects. Operating expenses in the US increased 10.1% excluding currency impact due to the acquisition of CitiStreet, and were partly offset by lower personnel-related expenses. Excluding CitiStreet and the currency impact, operating expenses in the US rose modestly by 0.7%. The increase in Latin America of 29.9% excluding currency impacts was mainly driven by the acquired pension businesses and higher sales, and was partly offset by the divestment of the Chile health business. Excluding the impact of acquisitions and the sale of the Chile health business and currency effects, operating expenses in Latin America increased by 1.5%. In Canada, operating expenses rose by 4.3% excluding currency impact, related to the direct distribution network and claims processing.
Profit and loss account (underlying)
in EUR million 2008 2007 change
Premium income 21,887 22,126 –1.1%Operating expenses 2,340 2,272 3.0%Underlying result before tax –534 2,062 –125.9%Total result before tax* –589 2,152 –127.4%
* Total result before tax is defined as underlying result before tax including divestments and special items.
Key figures
2008 2007
Value of new life business (EUR million) 304 270Internal rate of return 12.6% 11.8%New sales (EUR million) 3,503 3,671Economic Capital (EUR billion) 6.0 6.5
Geographical breakdown of premium income

ING Group Annual Report 2008
29
The value of new business (VNB) increased by 12.6%, driven by higher pension fund sales and better quality of business in Latin America. VNB in the US fell 7.9% due to reduced spread-related products sales and pressure on variable annuity margins and sales.
BUSINESS DEVELOPMENTSIn 2008, Insurance Americas continued its focus on the long-term growth opportunities presented by the ageing of the US population and increasing wealth in Latin America despite the challenging markets. During 2008, Insurance Americas maintained or improved its market position in retirement services and individual life insurance through innovative product development and distribution expansion.
Insurance Americas’ focus on faster-growing markets in the US and Latin America continued to be rewarded in the first half as sales, returns and the value of new business increased across the region. In the second half of the year, the deepening financial crisis resulted in substantial credit and investment-related losses, and dampened sales of equity-linked products including investments, variable universal life and variable annuities.
Because of the uncertain financial outlook, Insurance Americas’ most critical priorities in 2009 are customer retention, cost containment and reducing risk to preserve capital and to improve profitability.
The acquisition of CitiStreet for EUR 570 million boosted ING’s leading position in retirement services in the US, making ING the third-largest defined contribution business in the US based on assets under management and administration, and the second-largest based on number of plan participants.
Late in the year, ING US announced a realignment of its US Wealth Management business, segmenting Retirement Services and Annuities into two distinct business units. Under the new structure, the US business is organised into four divisions: Retirement Services, Annuities, Insurance, and Investments. The new structure provides better focus on ING’s diverse customer base and distribution partners. The structure is also intended to put ING in the best possible position to capture the maximum upside sales potential when the US economy recovers.
Retirement Services boosted by CitiStreet ING is a major player in retirement services, providing defined contribution plans to small and medium-sized corporations, educational institutions, hospitals and governments. ING is ranked number one in sales of retirement services for kindergarten through to 12th grade education markets and number two in small corporate plan sales.
The integration of the CitiStreet business into Retirement Services has proceeded according to plan, and key business and operational policies and strategies are being pursued which leverage the strengths and talents of both organisations.
ING plans to fully leverage CitiStreet’s scalable technology platform to allow easier business expansion and more technological innovation. Emphasis is now on strict execution of integration initiatives to become more efficient and effective. Significant cost savings, primarily in IT expenditure, are expected.
The addition of CitiStreet, one of the premier retirement plan service and administration organisations in the US defined contribution marketplace, provides ING with an expanded geographic footprint, further entry into specific market segments including the large corporate market, and broader service offerings to customers.
Retirement Services produced solid commercial results in 2008. For example, the State of Iowa selected ING as its 403 (b) plan administrator and one of its plan providers for education employees. The 403 (b) plan is a retirement savings plan offered by non-profit organisations such as educational institutions that come with several advantages such as tax concessions on contributions and earnings. ING is already one of the State’s four 457 (also a particular type of retirement savings plan) government pension plan providers for state and county employees. From 360 school districts in Iowa, more than 300 have already signed up to the Iowa state plan. This high enrolment rate could be repeated in other states which have yet to offer state-wide 403 (b) plans for school districts. Under recent changes to 403 (b) regulations, individual school districts in Iowa now have the option of arranging their own plans or joining the state plan. Only a few states have taken advantage of the changes in the legislation, but many more could follow, opening up opportunities for ING in the important education pension plan market.
Annuities hold ground in market turbulenceVariable annuity sales were well supported by ING LifePay Plus, a withdrawal benefit, which was launched in August 2007. An enhanced version of the product was introduced in April 2008. ING continued to target pre- and post-retirees in sales strategies as part of the easier brand campaign. Sales began to slow in the third quarter as equity markets became more volatile and dipped further in the fourth quarter. In 2008, as part of Insurance Americas’ de-risking initiatives, several product changes were made which lowered overall business risk. In January 2009, more de-risking product changes were instituted which included further restricting client exposure to equity funds, reducing benefit entitlements and repricing.
Sales of fixed annuities improved 35% as customers sought fixed-rate products in the volatile market environment. These products provide stability of principal sum and guaranteed returns. In addition, higher crediting rates made fixed annuities more attractive to customers.
ING continued to expand its distribution capacity, particularly in variable annuities, seeking out partnerships with major distributors. As part of the easier campaign, ING launched a major campaign to help simplify retirement planning. The ‘Your Number’ campaign was aimed at encouraging Americans to think about and calculate the savings they would require to retire comfortably. Print, web and TV ads directed people to www.INGyournumber.com where they could calculate their ‘number’ via an interactive, user-friendly tool.
Meeting the needs of customers, sponsors and distribution partners during a difficult economic period remains a major priority in Annuities, as well as Retirement Services.
ING Group Annual Report 2008
1.2 Report of the Executive Board
30
In February 2009, ING completed the sale of its entire 70% stake in ING Canada as part of the company’s strategy to focus on its core savings and investment businesses.
CONCLUSIONS AND AMBITIONSInsurance Americas achieved reasonable growth in sales and value of new business in 2008 given the market circumstances. ING will focus on aggressive capital management and de-risking in 2009 to ensure the company is well-positioned for the rebound in markets. Over the longer term, Insurance Americas will balance profit, growth, value creation and capital management with a continued focus on retirement services, life insurance and investments in the Americas. Insurance Americas remains committed to building and strengthening customer and distributor relationships, and making it easier for people to do business with ING. Accordingly, the company intends to continue to improve its technology to make it easier to serve customers, and to improve overall efficiency and effectiveness.
US Insurance benefits from diversified business modelOver the past three years, the US Individual Life business has diversified its product offering to include a variety of term insurance products as well as universal and variable life insurance. During 2008, customers turned away from products with an equity market component, and instead bought term insurance which provides a death benefit but no investment return. It is this diversified model and Individual Life’s continued focus on effective distribution, efficient operations and competitive manufacturing that allowed the business to generate an 11% increase in sales in 2008.
Individual Life also increased the number of policies it issued, which helped reduce per policy costs. More than 156,000 new policies were issued during 2008, up 87% from a year earlier.
During 2008, ING conducted a major campaign to increase sales in multicultural markets in the US, specifically the Latino and Asian American communities. ING trained and equipped its existing distribution channels with sales and marketing materials tailored to the language and culture of the target group. By 2010, ING expects US insurance multicultural sales to more than double to USD 48 million.
Lower returns in Latin America mask solid salesING’s strong market positions in life and pension businesses across Latin America allowed the company to post solid top-line growth, but investment returns declined due to the financial market crisis.
ING is one of the largest pension providers in Latin America. In Peru, ING is the largest pension provider by market share; in Mexico and Chile, the third largest; and in Uruguay and Colombia the company ranks among the top-five providers.
During 2008, ING continued to pursue its strategy in the region: acquiring customers most critical to its focus on investments, life insurance and retirement services; determining which products were best aligned against these customers; and investing resources accordingly.
The sale of the Mexican non-life insurance business, completed in July 2008, allowed ING in Mexico to concentrate on its growing Afore pension, annuities and investment management businesses.
In Peru, ING increased its stake in AFP Integra to 80%, the number one pension fund company in Peru, and also increased its shareholding in ING Fondos, a Peruvian mutual fund provider, under the holding company of ING Wealth Management.
In November, the Argentine government nationalised the country’s private pension system, which included ING’s pension fund business.
CanadaING Canada remains the number one property & casualty insurer in the country, and its scale and disciplined pricing has enabled the company to be at the forefront of the industry. The conservatively managed property & casualty business has been relatively unaffected by the financial crisis.
Insurance Americas (continued)

ING Group Annual Report 2008
31
Insurance Asia/PacificWell-positioned to strengthen the franchise
Key points> Despite lower sales, Insurance Asia/Pacific
maintained or improved market positions across the region
> Declining equity markets and weak economic conditions eroded demand for investment linked products
> Bank distribution reach extended: number of tied agents reached 100,000
> Brand awareness rose through the global and regional advertising campaigns
Growth in the Asia/Pacific region was adversely affected by global economic developments in 2008. However, as one of the leading international insurance and asset management companies in the region with a strong and diversified distribution network, ING remains well-positioned to maintain its franchise. Based on annual premium equivalent, ING maintained or improved its market positions across the region in 2008, a sign of its sound product portfolio and distribution capabilities. Active repositioning of its product portfolio was at the core of ING’s response to changing customer needs due to the economic downturn.
FINANCIAL DEVELOPMENTSUnderlying result before tax decreased by 79.9% to EUR 116 million in 2008 from EUR 576 million in 2007. Japan recorded a loss of EUR 167 million in 2008 compared to a profit of EUR 24 million in 2007, driven by losses on the variable annuity business, mainly due to extreme market volatility in October. Turmoil in the global financial markets led to negative revaluations on credit- and equity-linked securities and impairments on fixed income investments, which further contributed to the decrease in the underlying result. Excluding Japan and currency effects, underlying result before tax declined 15.5%.
On 20 October 2008, ING reached an agreement with Fubon Financial Holding Co. Ltd. to sell ING Life Taiwan for a consideration of USD 600 million (EUR 447 million). The transaction was completed on 11 February 2009 and the total net loss of the transaction, comprising of the loss on divestment and results from the divested unit, was EUR 292 million. The transaction significantly reduced the Economic Capital attributed to Insurance. Taiwan was separately reported from Insurance Asia/Pacific’s results in the fourth quarter of 2008. ING recorded zero underlying result before tax for Taiwan in the first nine months of 2008, as in 2007, due to strengthening of reserves in a low interest rate environment.
Gross premium income decreased 12.6%, or 3.3% excluding Taiwan and currency effects, to EUR 11,040 million. Double-digit growth was recorded in local currency terms in Australia, South Korea and Rest of Asia, but this was more than offset by a sharp decline in single premium variable annuity premiums in Japan. Assets under management decreased by 22.6% to EUR 82 billion at year-end 2008.
Underlying operating expenses fell 6.7%, but were up 7.0% excluding Taiwan and currency impact to EUR 1,040 million as cost containment helped to offset most of the increased expenses from a higher in-force base in some countries and continued investment in greenfield operations, to support the growth in premium income in these markets.
New sales decreased 23.3%, or 18.3% excluding Taiwan, to EUR 2,055 million as investment markets deteriorated and consumer preference for more cautious investment alternatives eroded demand for investment-linked products. The decline in sales was mainly attributable to Australia and Japan, whereas sales were stable or up in local currency terms in South Korea and Rest of Asia. The value of new business (VNB) decreased 27.4%, or 14.6% excluding Taiwan, to EUR 321 million, broadly consistent with the decline in sales. The 2008 VNB figures reflect the full-year impact of a change in methodology which excludes start-up
in EUR million Japan 36% 4,026
Taiwan 20% 2,156 South Korea 30% 3,291 Australia/New Zealand 2% 292 Rest of Asia* 12% 1,275 Total 100% 11,040
* India, China, Hong Kong, Thailand and Malaysia.
Profit and loss account (underlying)
in EUR million 2008 2007 change
Premium income 11,040 12,632 –12.6%Operating expenses 1,040 1,115 –6.7%Underlying result before tax 116 576 –79.9%Total result before tax* –213 576 –137.0%
* Total result before tax is defined as underlying result before tax including divestments and special items.
Key figures
2008 2007
Value of new life business (EUR million) 321 442Internal rate of return 14.0% 16.8%New sales (EUR million) 2,055 2,680Economic Capital (EUR billion) 2.8 7.0
Geographical breakdown of premium income

ING Group Annual Report 2008
1.2 Report of the Executive Board
32
Insurance Asia/Pacific (continued)
expenses for the greenfield business units in China, India and Thailand from their VNB.
COUNTRY DEVELOPMENTSIn Australia and New Zealand, underlying result before tax decreased 41.4%, or EUR 89 million to EUR 126 million in 2008 from EUR 215 million in 2007. This was driven by reduced fee income due to a decline in assets under management and lower investment earnings. New sales in life risk products and favourable in-force retention drove life premium income up by 6.2%, or EUR 17 million to EUR 292 million in 2008 from EUR 275 million in 2007. Operating expenses decreased 5.0%, but were up 1.6% excluding currency effects. The increase was driven by a higher in-force base, investment in select business transformation projects and restructuring costs.
In Japan, underlying result before tax decreased EUR 191 million from a profit of EUR 24 million in 2007 to a loss of EUR 167 million in 2008. The turnaround was driven primarily by adverse hedge results on the variable annuities business due to extraordinary market volatility, especially in October. This was partially offset by an increase in profits on the Corporate Owned Life Insurance (COLI) business on an increased premium base and improved investment results. The turbulent financial market environment severely affected single premium variable annuity (SPVA) sales. Premium income declined 14.2% to EUR 4,026 million from EUR 4,693 million in 2007. Despite this decrease, ING is a top-3 player in the COLI segment and a top-4 player in the SPVA segment.
In South Korea, underlying result before tax decreased 45.7%, or 33.3% excluding currency effects, to EUR 163 million in 2008 from EUR 300 million in 2007. The decline was mainly due to market related impacts, comprising negative revaluations on an equity derivative fund and credit-linked securities and impairments on fixed income securities. Results in 2007 had also been supported by the one-off recognition of EUR 10 million in dividend income from consolidation of equity funds. Premium income decreased 8.8%, but was up 13.8% excluding currency effects, to EUR 3,291 million in 2008 from EUR 3,607 million in 2007 due to favourable retention rates and stable new sales. Operating expenses decreased 9.5%, but were up 13.6% excluding currency effects, to EUR 229 million in 2008 from EUR 253 million in 2007.
In Rest of Asia (India, China, Hong Kong, Thailand and Malaysia), underlying result before tax from life insurance decreased by EUR 43 million to a loss of EUR 9 million in 2008, compared with a profit of EUR 34 million in 2007 due to negative revaluations on credit linked securities, debt impairments and an adjustment to the deferred acquisition cost balance in Thailand. Results in 2007 had also been supported by a one-off positive deferred acquisition cost adjustment in Malaysia of EUR 10 million. Greenfield operations in China, India and Thailand recorded losses as ING continued to invest for future growth in these markets. New sales grew 36.3% in China, 20.9% in India and 15.0% in Thailand, excluding currency effects, on the strength of increased distribution reach through agency force expansion and successful bank partnerships. In Malaysia, ING’s largest market in the Rest of Asia, ING became the third-largest insurer in Individual Life business, up from fifth in 2007 and maintained first place in Group Life business.
BUSINESS DEVELOPMENTSChallenging markets affected investment-linked sales, while increased customer demand for more traditional protection products emerged in the fourth quarter. ING helped customers protect their wealth and reduce risk across their portfolio through protection-type and capital-guaranteed products. Although Asia is being affected by negative developments in the global economy, long-term economic growth trends remain favourable.
ING is the region’s second-largest international life insurer, based on annual premium equivalent (APE), with 11 operations in 9 countries. APE is the sum of regular annual premiums from new business plus 10% of single premiums on new business written during the year. ING has strong positions in Australia, New Zealand, Japan, Hong Kong, Malaysia and South Korea, and has a growing presence in the high-growth markets of China, India and Thailand. ING is also the third-largest regional asset manager, based on assets under management, operating in 12 markets.
Continued strengthening of distribution channelsBroadening distribution methods and increasing the efficiency of existing channels continues to be a strategic priority for ING in Asia. Traditionally, the tied agent channel has been the largest, but distribution through banks is on the rise. The number of tied agents grew from 75,000 in 2007 to over 100,000. This growth took place mainly in India, South Korea and Thailand. Insurance Asia/Pacific’s bank distribution takes place through partnerships with other banks as well as through ING’s retail banking presence in the region. ING entered into a number of new distribution agreements and selectively invested in distribution initiatives and infrastructure enhancements to expand its presence across the region.
In Australia, ING operates a retail wealth management and life insurance business through ING Australia, a joint-venture with ANZ Group. ING Australia expanded its distribution reach with the acquisition of both Pinnacle Partners and Financial Lifestyle Solutions. These acquisitions position ING Australia as one of the top-three in the country in terms of distribution capacity with over 1,500 aligned advisers. ING Australia is one of the country’s leading financial institutions, providing financial services to over 1 million customers through aligned and open market advisers and ANZ.
In South Korea, Insurance Asia/Pacific operates two life insurance companies, ING Life and KB Life. KB Life is a bancassurance joint-venture with Kookmin Bank. In 2008, life sales by these two companies quickly reached the government-enforced 33% ceiling for how much share of Kookmin Bank sales these two companies (which have ING as a common substantial shareholder) can have. They led the market in terms of new business production through banks with a market share of about 11%, as of September 2008. On 29 December 2008, ING Group completed the purchase of the remaining minority interest of 14.9% held by Kookmin Bank in ING Life Korea for KRW 339 billion (approximately EUR 190 million), lifting ING’s ownership interest to 100%.
In Japan, ING Life was selected as one of the principal product providers by the newly privatised Japan Post Group. Sales through Japan Post commenced in the second quarter of 2008.
ING Group Annual Report 2008
33
Organisational and operational efficiencyInsurance Asia/Pacific’s regional structure was strengthened and simplified by the establishment of a new regional governance structure. ING continues to focus on talent management, managing the inflow of new talent as well as local leadership development. Across business units, ING aims to reap the benefits of scale through greater standardisation in key processes and IT systems. In line with Group risk and cost management, Insurance Asia/Pacific is continuing to improve operational risk management and cost management in the region. The pursuit of operational efficiencies is facilitated through the implementation of several programmes to streamline operations (often using the Lean Six Sigma approach).
Brand awarenessBrand awareness in the region has risen as a result of the global advertising campaign and sponsorship activation of the Shanghai, Tokyo, Melbourne and Singapore Formula 1 Grands Prix, as well as Insurance Asia/Pacific’s sponsorships of the national and league competitions under the purview of the Asian Football Confederation. This sponsorship agreement was extended for an additional four years. Together with local advertising and sponsorships, brand awareness increased throughout the region.
CONCLUSIONS AND AMBITIONSFaced with the challenging economic climate, Insurance Asia/Pacific’s performance was negatively impacted. Despite these difficulties ING maintained or improved market positions across the region supported by its strong product portfolio and by expanding its distribution network.
In the year ahead, ING will continue to focus on maintaining its market share and managing for value rather than growth. In addition to initiatives for cost containment and repositioning of product portfolios, new measures to strengthen capital and risk management, as well as compliance are under way. Throughout the business line, efficiency will be increased through the standardisation of key operational processes.
The product portfolio is shifting to accommodate changing customer needs for more protection and capital guaranteed type offerings. ING’s multi-distribution approach allows for diversification and flexibility to respond quickly to these changing needs. We will continue to strengthen the bancassurance model. These key priorities will position us well to capture the growth opportunities that Asia/Pacific offers.
Bank distribution was further reinforced through an exclusive agreement with the Royal Bank of Scotland in Hong Kong, and by sales expansion to TMB Bank’s entire branch network in Thailand. As a result of these and other bank agreements, ING products and services are marketed through over 200 different banks in the region, with a total branch network of more than 16,000 branches.
ProductsIn Japan, ING launched a new single premium variable annuity product with guaranteed income benefits. In addition, the next generation of ING’s ‘Smart Design’ product, which offers a guaranteed return after 10 years, was launched. In Malaysia, ING further expanded its unit-linked product offering in response to government deregulation. In Hong Kong, ING’s investment-linked iWealth product performed well for a second year in a row. In South Korea, ING launched retirement services in July.
Well-performing products were launched through Public Bank in Malaysia, a long-term alliance which became active in early 2008. Public Bank has an extensive distribution network of 241 branches across Malaysia and 15 commercial branches in Hong Kong. Through Public Bank, ING launched a single-premium capital guaranteed investment-linked product, with premium income of approximately EUR 30 million within a month of launch.
In line with customers’ preferences, product design is shifting towards simpler, easier, and more channel-specific products. In Australia, ING expanded its direct distribution channel approach by exploring direct response TV and web options. In New Zealand, the KiwiSaver programme, a work-based savings scheme, has reached over 150,000 clients since July 2007 through a variety of channels. ING is one of the few government-appointed default providers of this type of product. In Australia, a flexible term-deposit option was added to the wealth management platform to compete against higher deposit rates offered by banks. In South Korea, a product was launched that allows customers a choice between asset-linked performance (with a capital guarantee) or a fixed interest rate every six months.
Australia and New Zealand fund outflowsING further strengthened its life risk and bancassurance businesses in Australia and New Zealand, maintaining sales and improving market share. Life risk and bancassurance now represent the majority of the profits of ING’s business in these two countries. However, ING is also active in the wealth management business which is more reliant on financial market conditions. In 2008, the performance of ING’s wealth management businesses in Australia and New Zealand was impacted by the market downturn, as well as the Australian government guarantee on bank deposits which led to significant outflows in favour of bank deposits. These developments led to the suspension of certain ING managed funds which were impacted most substantially. This was an industry-wide issue, affecting not just ING, but other companies as well.
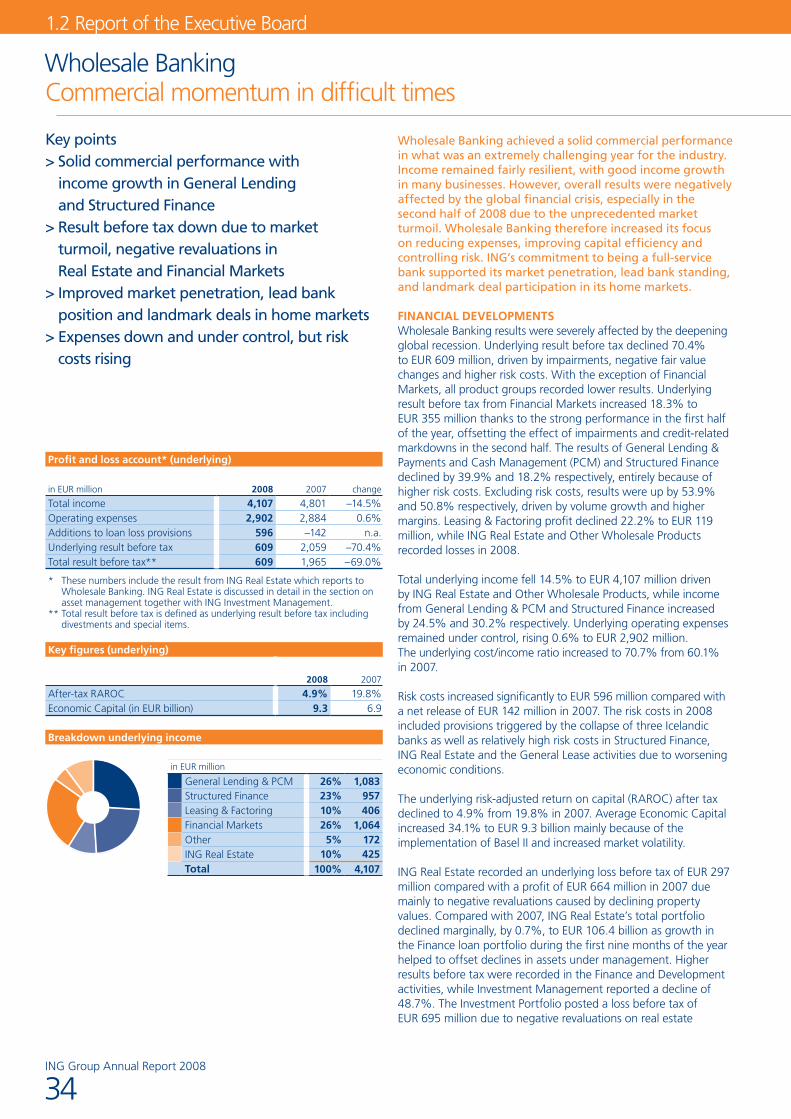
ING Group Annual Report 2008
1.2 Report of the Executive Board
34
Wholesale BankingCommercial momentum in difficult times
Profit and loss account* (underlying)
in EUR million 2008 2007 change
Total income 4,107 4,801 –14.5%Operating expenses 2,902 2,884 0.6%Additions to loan loss provisions 596 –142 n.a.Underlying result before tax 609 2,059 –70.4%Total result before tax** 609 1,965 –69.0%
** These numbers include the result from ING Real Estate which reports to Wholesale Banking. ING Real Estate is discussed in detail in the section on asset management together with ING Investment Management.
** Total result before tax is defined as underlying result before tax including divestments and special items.
Key figures (underlying)
2008 2007
After-tax RAROC 4.9% 19.8%Economic Capital (in EUR billion) 9.3 6.9
Key points> Solid commercial performance with
income growth in General Lending and Structured Finance
> Result before tax down due to market turmoil, negative revaluations in Real Estate and Financial Markets
> Improved market penetration, lead bank position and landmark deals in home markets
> Expenses down and under control, but risk costs rising
Wholesale Banking achieved a solid commercial performance in what was an extremely challenging year for the industry. Income remained fairly resilient, with good income growth in many businesses. However, overall results were negatively affected by the global financial crisis, especially in the second half of 2008 due to the unprecedented market turmoil. Wholesale Banking therefore increased its focus on reducing expenses, improving capital efficiency and controlling risk. ING’s commitment to being a full-service bank supported its market penetration, lead bank standing, and landmark deal participation in its home markets.
FINANCIAL DEVELOPMENTSWholesale Banking results were severely affected by the deepening global recession. Underlying result before tax declined 70.4% to EUR 609 million, driven by impairments, negative fair value changes and higher risk costs. With the exception of Financial Markets, all product groups recorded lower results. Underlying result before tax from Financial Markets increased 18.3% to EUR 355 million thanks to the strong performance in the first half of the year, offsetting the effect of impairments and credit-related markdowns in the second half. The results of General Lending & Payments and Cash Management (PCM) and Structured Finance declined by 39.9% and 18.2% respectively, entirely because of higher risk costs. Excluding risk costs, results were up by 53.9% and 50.8% respectively, driven by volume growth and higher margins. Leasing & Factoring profit declined 22.2% to EUR 119 million, while ING Real Estate and Other Wholesale Products recorded losses in 2008.
Total underlying income fell 14.5% to EUR 4,107 million driven by ING Real Estate and Other Wholesale Products, while income from General Lending & PCM and Structured Finance increased by 24.5% and 30.2% respectively. Underlying operating expenses remained under control, rising 0.6% to EUR 2,902 million. The underlying cost/income ratio increased to 70.7% from 60.1% in 2007.
Risk costs increased significantly to EUR 596 million compared with a net release of EUR 142 million in 2007. The risk costs in 2008 included provisions triggered by the collapse of three Icelandic banks as well as relatively high risk costs in Structured Finance, ING Real Estate and the General Lease activities due to worsening economic conditions.
The underlying risk-adjusted return on capital (RAROC) after tax declined to 4.9% from 19.8% in 2007. Average Economic Capital increased 34.1% to EUR 9.3 billion mainly because of the implementation of Basel II and increased market volatility.
ING Real Estate recorded an underlying loss before tax of EUR 297 million compared with a profit of EUR 664 million in 2007 due mainly to negative revaluations caused by declining property values. Compared with 2007, ING Real Estate’s total portfolio declined marginally, by 0.7%, to EUR 106.4 billion as growth in the Finance loan portfolio during the first nine months of the year helped to offset declines in assets under management. Higher results before tax were recorded in the Finance and Development activities, while Investment Management reported a decline of 48.7%. The Investment Portfolio posted a loss before tax of EUR 695 million due to negative revaluations on real estate
Breakdown underlying income
in EUR million
General Lending & PCM 26% 1,083 Structured Finance 23% 957 Leasing & Factoring 10% 406 Financial Markets 26% 1,064 Other 5% 172 ING Real Estate 10% 425 Total 100% 4,107

ING Group Annual Report 2008
35
compared with a profit of EUR 261 million in 2007. The after-tax RAROC of ING Real Estate declined to -13.3% from 32.7% in 2007.
BUSINESS DEVELOPMENTSWholesale Banking plays a fundamentally important role within ING Group. The essence of the Group’s business is to collect customer deposits and redeploy these funds as investments. Wholesale Banking complements the Group’s business model in three ways: as a contributor of capital, as an important generator of assets, and as a source of skills and expertise. The business line generates capital that can be redeployed efficiently to high-growth businesses. It also generates high-quality assets into which ING can invest retail deposits, and provides the Group with many relevant skills in financial markets, risk and specialist finance, as well as access to the financial markets.
Wholesale Banking conducts operations for corporations – from large companies to major multinationals – as well as for governments and financial institutions. It also provides selected products and services for mid-corporate clients, a segment managed by ING Retail Banking from early 2008. Wholesale Banking’s primary focus is on the Netherlands, Belgium, Poland and Romania, where it offers a full range of products, from cash management to corporate finance. Elsewhere, it takes a more selective approach to clients and products. Wholesale Banking has six business units: General Lending & PCM, Structured Finance, Leasing & Factoring, Financial Markets, Other Wholesale Products, and ING Real Estate.
Focused strategyAfter years of improved capital efficiency, solid profit growth and expense reduction, Wholesale Banking in 2008 launched a ‘Fitter, Focused, Further’ strategy for 2008-2010, with the aim of becoming a leader in several key markets and products.
The strategy includes becoming the market leader in the Benelux, a top-5 wholesale bank in Central Europe, and a global or regional leader in a number of key product areas, including Structured Finance, Financial Markets, PCM and Leasing.
In the Dutch market, ING launched several campaigns to boost recruiting and visibility. A recruitment campaign was launched at the beginning of 2008 to hire new top talent and support ING’s growth ambitions. An advertising campaign aimed at Dutch corporations was also launched to reinforce ING’s position as a leading bank in the corporate market. Central Europe, which Wholesale Banking entered in the early 1990s, is now prominent enough to be regarded as part of its home markets. Wholesale Banking is already a market leader in Poland and Romania.
Operating expenses under controlING continues to be vigilant about costs without impairing growth opportunities. Expenses rose slightly in 2008 despite lower compliance costs and favourable currency effects. The market turmoil also resulted in additional risk costs. Wholesale Banking’s cost/income ratio excluding impairments improved significantly, putting it in line with the industry average.
The organisation has several cost containment initiatives in place to reduce operating expenses and to stimulate growth. It has also
been working on re-engineering the lending process, reducing the number of full-time equivalents and streamlining support services. In 2008, Wholesale Banking reviewed and in some cases selectively decreased its client coverage model in non-core markets. ING reduced and exited certain volatile products and activities, especially in equity markets and within Financial Markets Strategic Trading. Core products have been prioritised and optimised. Financial Markets has been re-evaluating its priorities. In Operations & IT Banking (OIB), steps have been taken to contain costs and a programme has been launched to reduce further baseline costs.
Volume growth in General Lending & PCM General Lending is used as an entry product across all regions to attract customers and to cross-sell other high-value products. Volumes increased in General Lending over the course of the year as the turbulent market circumstances offered the possibility to pursue selective asset growth, at higher margins and fee levels. General Lending results were particularly strong in the Netherlands and in Central Europe. The balance between loan portfolio growth and margin increases continues to be strictly managed given the market circumstances. The favourable trend in income for General Lending was offset by high loan loss provisions, including EUR 83 million for Icelandic banks in the second half of 2008, compared to net releases in 2007.
ING’s PCM business experienced volume growth due to new and renewed mandates from institutional clients. Opportunities also arose from the creation of the Single Euro Payments Area (SEPA) on January 28, 2008, which removed the distinction between national and intra-European cross-border payments. With an already strong position in PCM, ING is recognised as one of the most advanced providers of PCM in SEPA, resulting in cash service mandates from institutional clients across Europe.
Strong demand for Structured FinanceStructured Finance helps companies finance large capital projects and transfer risk through various products. Key segments of expertise are Natural Resources, Telecommunications, Media, Finance and Utilities. In 2008, Structured Finance held up well due to strong demand from customers in a market where credit was reduced significantly. Both margins and the relative market position of Structured Finance continued to improve. ING continued to support clients’ funding needs during 2008. The scarcity of available financing further increased margins, especially benefiting Structured Finance in the US, but also in Western Europe and Asia. Deal flow was particularly robust in Natural Resources, where ING extended its capabilities by adding advisory teams in London and Singapore. International Trade & Export Finance again posted strong results, particularly in the commodity finance area.
In Leveraged Finance, ING led a number of European transactions, which were successfully syndicated. The number of transactions was relatively low in 2008 compared to prior years. ING was concerned about the overexpansion of the market and started to decrease its exposure from the beginning of 2007, well ahead of the summer 2007 turmoil. 2008 was much more moderate. A bigger tendency emerged towards club deals that spread the risk, and the income, over a larger group of partners. There was also downward pressure on underwriting fees.
ING Group Annual Report 2008
1.2 Report of the Executive Board
36
ING Real Estate As a result of the financial market crisis, real estate markets deteriorated during 2008, making it a tough year for ING Real Estate. ING Real Estate incurred a loss before tax of EUR 297 million, while maintaining the size of its total portfolio at EUR 106 billion. This was largely a result of the impact of EUR 712 million of unrealised fair value losses on its investment portfolio, from a total exposure of approximately EUR 5 billion (including a 100% interest in Summit: ING Real Estate owns 50% of Summit. However, in results before tax Summit is fully consolidated and the remaining 50% is offset via third-party interest). The fair value losses were somewhat compensated by EUR 49 million of positive revaluations in ING Real Estate’s development activities. Excluding the revaluation changes, profit before tax was slightly lower than the previous year at EUR 366 million. Turn to the Asset Management section, page 43, for further details.
Winning a number of landmark dealsWholesale Banking completed a number of high profile transactions in 2008. ING served as adviser to Vedior, and bookrunner on the public offer by Randstad to acquire Vedior, creating the second-largest human resources services company in the world. In a transaction in May valued at EUR 2.8 billion, ING’s Corporate Finance was a joint underwriter of the bridge facility and syndicated credit facilities for the acquisition of Vedior. ING also served as adviser and bookrunner to the Nederlandse Gasunie for a bridge facility for the acquisition of BEB Erdgas und Erdöl GmbH.
In Belgium, ING was a bookrunner and mandated lead arranger to InBev for the underwriting and credit facilities for the approximately EUR 32 billion acquisition of Anheuser-Busch in the US. Furthermore, the Financial Markets team also provided EUR 6.2 billion in IRS / FX swaps for the acquisition. ING also won a mandate to help Leaseplan Corporation, the car leasing affiliate of Volkswagen AG, raise up to EUR 1.5 billion with a two-year bond. In December, ING also participated in the successful completion of a EUR 7.2 billion rights issue by Santander.
CONCLUSIONS AND AMBITIONS2008 was an unusually difficult year for the industry. Wholesale Banking kept its focus on its customers, and despite the turmoil managed to record solid commercial performance across most of its businesses. ING continues to secure important mandates and transactions. It is managing expenses carefully, in part to compensate for higher risk costs and impairments, and has adjusted its strategic focus to key markets and product areas where it already has a competitive advantage. Wholesale Banking is an essential part of the Group, and has a clearly defined focus and ambition to be a full-service Benelux bank and a specialist products provider globally.
In December, Leveraged Finance and Sponsor Coverage (LF&SC) Asia-Pacific won Finance Asia’s award for the best leveraged finance deal of 2008 and best private equity buyout for serving as the mandated lead arrangers and bookrunners to KKR for facilities used for its public-to-private buyout of Unisteel Technology.
Portfolio and income growth in Leasing & FactoringIn spite of the difficult market circumstances, Leasing & Factoring saw increases in portfolio size and income levels throughout 2008. ING also continued to seek out opportunities to cross-sell services to corporate clients. Leasing growth was driven by higher volumes in Belgium, Italy, the Netherlands, Poland, Hungary and Russia. Gradual margin increases on new lease production progressively compensated for rising funding costs. ING Car Lease income was adversely impacted by lower prices on the used vehicle market. As a result, the business actively sought new remarketing channels for used cars. In the Netherlands, where ING Car Lease is the market-leader, a new e-leasing tool was introduced, speeding up the application and credit process.
Volumes in Factoring grew as the business benefited from being viewed as an attractive alternative to general lending, although margin pressure remained. There were higher factoring volumes in all markets, with ING strengthening its leadership position in the Netherlands and Poland. The short-term nature of these transactions and Basel II implications make this an interesting area for banks.
Strong Financial Markets operational performanceFinancial Markets had an exceptionally strong first half and continued to show robust operational performance during the rest of 2008. Nevertheless, credit-related markdowns and impairments in the second half negatively impacted 2008’s overall performance.The client and product businesses held up well, in line with the aim to diversify away from proprietary risk businesses, including proprietary trading. Financial Markets continues to seek cross-selling opportunities across product areas and client groups, including a new strategy to target emerging markets, home markets, strategic clients and global clients. ING aims to be a top-5 player in selected markets or products by taking advantage of our geographic footprint, strong brand recognition and commercial expertise and reputation. In developed markets, particularly in home markets where ING remains uniquely positioned, ING will continue to provide core products and explore selective growth initiatives.
Declining marketsAlready weak financial markets declined further towards the end of 2008, leading to unprecedented conditions around the world. The failure of several major financial institutions triggered a rise in credit spreads and general risk aversion, causing paralysis in the interbank lending markets. The drastic deterioration of financial and corporate asset prices resulted in material marked-to-market credit losses and impairments on Lehman Brothers, Washington Mutual and one specific CDO. Asset & Liability Management continued to perform strongly in the face of interest rate volatility. The difficult market conditions also negatively affected results in proprietary trading.
Wholesale Banking (continued)
ING Group Annual Report 2008
37
Retail BankingKeeping the customer at the heart of our strategy
Profit and loss account (underlying)
in EUR million 2008 2007 change
Total income 7,399 7,456 –0.8%Operating expenses 5,307 4,855 9.3%Additions to loan loss provisions 401 198 102.5%Underlying result before tax 1,691 2,402 –29.6%Total result before tax* 1,420 2,078 –31.7%
* Total result before tax is defined as underlying result before tax including divestments and special items
Key figures (underlying)
2008 2007
After-tax RAROC 21.7% 37.0%Economic Capital (EUR billion) 5.9 4.8
Breakdown of underlying income
in EUR million 2008
Netherlands 4,346Belgium 1,842 Central Europe* 878Asia* 333Total 7,399
* Mainly the retail banking operations in Romania, Ukraine, India (ING Vysya Bank), Private Banking Asia, the ING participations in Bank of Beijing, TMB and Kookmin Bank.
Key points> Steady performer in difficult environment> Postbank and ING Bank merged into
new retail bank in the Netherlands> Transformation branch network in Belgium> Rebranding Oyak Bank into ING Bank
Turkey successfully completed > Economic slowdown affected assets under
management in Private Banking
The retail banking market became increasingly challenging in 2008. Against this backdrop, Retail Banking remained a steady performer with a high return on capital. Further progress was made in improving the customer experience and efficiency, reducing costs in the Benelux and preparing new service models. In Central Europe and Asia, ING continued to grow its activities.
FINANCIAL DEVELOPMENTSRetail Banking’s result was severely affected by increased margin pressure from intense competition for savings and the negative effects of the worldwide recession on commission income and risk costs. Underlying result before tax declined 29.6% to EUR 1,691 million in 2008, mainly due to an increase in underlying expenses and risk costs, while income declined slightly. Total result before tax declined 31.7% to EUR 1,420 million, as 2008 included EUR 271 million of charges recognised as special items related to the implementation of the Retail Netherlands strategy.
Total underlying income declined slightly, by 0.8%, to EUR 7,399 million. Income for Central Europe grew in 2008 by 77.4% due to the inclusion of ING Bank Turkey and as a result of marketing initiatives. The Netherlands, Belgium and Asia recorded negative growth as underlying income was affected by intensified competition for savings which had a severe impact on margins, while volumes continued to increase. Income was also affected by a decline in asset management fees due to deteriorating equity markets.
Underlying operating expenses increased 9.3% to EUR 5,307 million, predominantly in Central Europe due to the inclusion of ING Bank Turkey and investments in distribution channels and advertising campaigns. In the Netherlands, underlying operating expenses were up 0.2%. In Belgium, expenses increased by 3.3% because of the inflationary effect on salaries and investments in the branch network. In Asia, expenses decreased by 0.9% resulting from lower costs in Private Banking. The underlying cost/income ratio increased to 71.7% in 2008 from 65.1% in 2007.
The addition to the loan loss provisions doubled versus 2007 levels to EUR 401 million, mainly because of higher risk costs in the mid-corporate segment and Private Banking (as underlying collateral for loans decreased significantly), and from the inclusion of ING Bank Turkey.
The underlying risk-adjusted return on capital (RAROC) after tax from Retail Banking decreased to 21.7% in 2008 from 37.0% in 2007. Average Economic Capital increased EUR 1.2 billion to EUR 5.9 billion in 2008, of which EUR 0.7 billion is explained by the inclusion of ING Bank Turkey.
COuNTry DEVELOPMENTS In the Netherlands, underlying result before tax declined 25.4%, driven by a 7.6% fall in income combined with higher risk costs. In Belgium, result before tax fell 24.8% due to 3.6% lower income and 3.3% higher expenses. In Central Europe, result before tax decreased to EUR 17 million from EUR 124 million in 2007, mainly because of a EUR 65 million net addition to the loan loss provisions compared with a net release of EUR 24 million in the previous year.
ING Group Annual Report 2008
1.2 Report of the Executive Board
38
Retail Banking (continued)
ING Bank Turkey reported a loss before tax of EUR 17 million, after internal capital charges. However, its result before tax before internal capital charges was EUR 121 million. In Asia, result before tax declined 53.3% as a result of higher risk costs at Private Banking while income declined 3.2% due to lower equity markets. Profit from Private Banking operations, which is included in the respective Retail Banking regions, decreased 57.8% to EUR 111 million. BuSINESS DEVELOPMENTSRetail Banking operates in the Benelux and in the fast-developing countries of Central Europe and Asia. Over the last year, the retail banking environment has changed dramatically, with the fight for savings intensifying and the economic slowdown becoming more visible worldwide. The successive waves of the banking crisis have led to less confidence in banks and the desire for safety as the main driver in choosing a financial institution. The winning retail banks will first of all be safe but also low cost, with simple straight forward products and transparent pricing.
In this increasingly competitive environment, ING will continue or even accelerate investments in its domestic markets by consolidating branch networks in the Benelux and moving them towards the ‘internet-first’ model with its focus on low-cost, easy transactions and strong branding. ING remains committed to growth in emerging markets but will temporise investments. In all markets ING will put more emphasis on cost reduction and de-risking in the present environment.
New service models in the BeneluxIn 2007, ING announced a substantial investment in its retail banking direct channels and branch network in the Netherlands by combining the successful direct banking model of Postbank with the professional advice capabilities of ING Bank. Preparations were finalised to combine ING Bank and Postbank in the first quarter of 2009. All post offices, Postbank service shops, ATMs and branch interiors have been rebranded. As of January 2009, all branches started working according to ING’s new ‘bankshop’ formula.The new bank will improve services and maintain a strong focus on cost-effective execution. It serves more than 8 million retail clients and 600,000 business customers. Improvements in operating efficiencies and an expected reduction of 2,500 full-time equivalents following the integration of Postbank and ING Bank will significantly reduce operating costs.
ING Belgium continued the roll-out of a new service and distribution model in which traditional branches are being transformed into outlets with self-service cash functions and online banking access. 130 adjusted branches were up and running at the end of 2008 out of the 260 planned to be opened by the end of 2009.
Competition in the Dutch savings market remained fierce and resulted in a shift from variable to relatively low-margin fixed products. ING responded by offering competitive fixed and variable savings products for both retail and business banking customers. ING managed to increase savings and deposits in 2008 by EUR 1.1 billion, or 2%.
In Belgium, ING attracted substantial inflows and new clients by introducing a range of online savings products for different target groups. The launch of the ING Lion Deposit, an online savings
account, resulted in 103,000 account openings. ING also introduced the ING Long Term Account, a savings certificate with maturities varying from one to ten years. The ING Lion Fidelity account, introduced in 2007, attracted EUR 3.6 billion by the end of 2008.
Mortgage production in the Netherlands fell significantly, as demand for mortgage financing dropped sharply. ING’s focus is to keep volumes and market share stable without sacrificing margins.
Continued volume growth in Central Europe and AsiaRetail Banking is well positioned in Poland, Romania, Turkey and the important Asian markets of India and China. In 2008, ING invested in its distribution network with a focus on Poland, Romania, Turkey and India. Towards the end of the year, Retail Banking adapted its growth plans given the overall economic climate. ING remains committed to growth in emerging markets but will slow down the expansion. Given the current environment, ING will put more emphasis on cost reduction and de-risking in all markets.
Poland showed strong volume growth across all products. ING Bank Slaski opened 34 franchise outlets bringing the total number of branches to 439. The number of customers grew by 340,000, to a total of 2.6 million. Savings and deposits increased strongly in the first three quarters thanks to successful campaigns, but the fourth quarter was extremely competitive. ING gave preference to margin, relinquishing some of the earlier volume gains. ING Bank Slaski is an important distributor of ING investment funds in Poland, but the decline in equity markets resulted in lower sales of mutual funds and lower fees on assets under management.
In Romania, ING continued the roll-out of its successful self-service banking concept. ING opened 7 Self’Bank outlets, bringing the total to 205 since the operation started in 2004. Customer growth continued, reaching 775,000 at the end of 2008. This means a net increase of 272,000 clients was realised in 2008 (+54% from 503,000). Full-year commercial liabilities growth was 28%, bringing its market share to 3.3% based on volumes. In savings, ING had a 5% market share by volumes. ING launched a campaign to attract new savers and increase the balances of existing savers.
ING started retail banking operations in Ukraine in 2008, based on the Romanian concept and had 20 branches by the end of 2008.
ING entered the Turkish market by acquiring Oyak Bank in 2007. In 2008 it was integrated into ING Group and rebranded as ING Bank Turkey. The bank has some 1.3 million retail and 300,000 small and medium-sized enterprise customers and a network of 366 branches and outlets. In addition to full-service branches, ING Bank Turkey opened 15 express branches: relatively small, cost-efficient branches with fewer staff and efficient operations.
In India, ING has a 44% stake in ING Vysya Bank. It expanded its distribution network with the opening of new branches and ATMs which will contribute to more growth.
In Thailand, ING has a presence through its 30% stake in TMB Bank, a universal banking platform with a nationwide network. It was a transition year for TMB: a new chief executive officer was

ING Group Annual Report 2008
39
appointed and several senior ING managers were assigned to further develop risk management and improve profitability.
In China, ING holds a 16% stake in the Bank of Beijing. The priority is to support the growth of the bank through strategic partnerships with other ING units and technical assistance projects. Bank of Beijing continued its expansion within and outside its home city.
ExPANSION OF MID COrPOrATE CLIENTSMid Corporate Clients expanded in its home markets of the Netherlands and Belgium, as well as in Poland, Romania and Turkey. In Belgium and the Netherlands, a service model was introduced which focuses on efficiently distributing a full range of business products. In Poland and Romania customer satisfaction significantly improved. European Business Desks developed a stronger position in ING’s network and cooperated closely with local relationship managers to win new international business, predominantly in payments and cash management.
PrIVATE BANKINGING Private Banking suffered from the ongoing market turmoil. Assets under management remained stable during the first nine months but due to market events assets under management decreased by 9% by year-end. The crisis motivated many investors to move their assets into more conservative products, like deposits and savings. Provisioning in Asia was quite high given the exceptional market circumstances in 2008.
ING sold its Curaçao Private Banking Business in 2008, in line with its strategy to concentrate on Europe and Asia.
The focus for 2009 is on further asset gathering, concentrating on Europe and Asia and offering more competitive products, while keeping a close eye on margins and expenses.
CONCLuSIONS AND AMBITIONSRetail Banking proved to be a steady performer and a good contributor to the Group results. The new service models in the Netherlands and Belgium are fully on track. In Central Europe and Asia ING expanded its distribution network and consolidated its acquisition of Oyak Bank in Turkey. In Private Banking, ING sharpened its focus on Europe and Asia.
Given the current market upheaval, our priorities are more than ever to be customer-oriented and to exceed customer expectations. Next to that, maintaining liquidity, increasing margins, controlling costs and managing risk are key. Across all regions, steps have been taken to respond to the challenging conditions while remaining open to new opportunities.
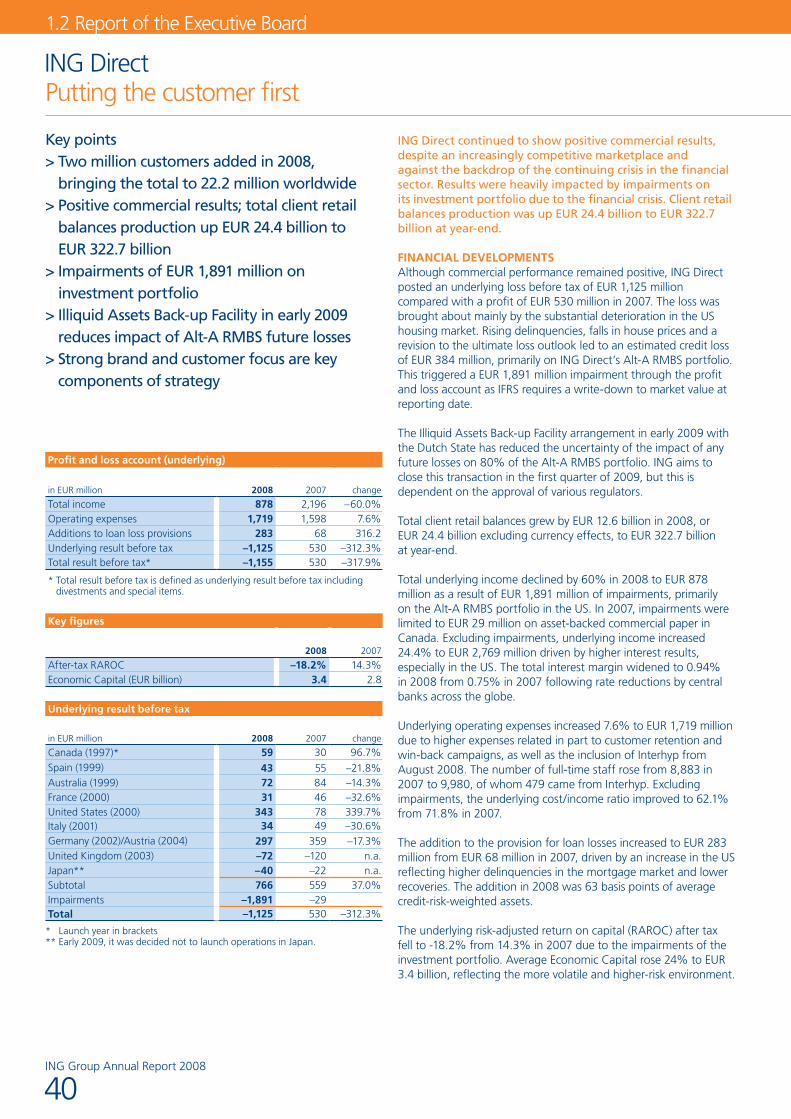
ING Group Annual Report 2008
1.2 Report of the Executive Board
40
ING DirectPutting the customer first
Key points> Two million customers added in 2008,
bringing the total to 22.2 million worldwide > Positive commercial results; total client retail
balances production up EUR 24.4 billion to EUR 322.7 billion
> Impairments of EUR 1,891 million on investment portfolio
> Illiquid Assets Back-up Facility in early 2009 reduces impact of Alt-A RMBS future losses
> Strong brand and customer focus are key components of strategy
ING Direct continued to show positive commercial results, despite an increasingly competitive marketplace and against the backdrop of the continuing crisis in the financial sector. Results were heavily impacted by impairments on its investment portfolio due to the financial crisis. Client retail balances production was up EUR 24.4 billion to EUR 322.7 billion at year-end.
FINANCIAL DEVELOPMENTSAlthough commercial performance remained positive, ING Direct posted an underlying loss before tax of EUR 1,125 million compared with a profit of EUR 530 million in 2007. The loss was brought about mainly by the substantial deterioration in the US housing market. Rising delinquencies, falls in house prices and a revision to the ultimate loss outlook led to an estimated credit loss of EUR 384 million, primarily on ING Direct’s Alt-A RMBS portfolio. This triggered a EUR 1,891 million impairment through the profit and loss account as IFRS requires a write-down to market value at reporting date.
The Illiquid Assets Back-up Facility arrangement in early 2009 with the Dutch State has reduced the uncertainty of the impact of any future losses on 80% of the Alt-A RMBS portfolio. ING aims to close this transaction in the first quarter of 2009, but this is dependent on the approval of various regulators.
Total client retail balances grew by EUR 12.6 billion in 2008, or EUR 24.4 billion excluding currency effects, to EUR 322.7 billion at year-end.
Total underlying income declined by 60% in 2008 to EUR 878 million as a result of EUR 1,891 million of impairments, primarily on the Alt-A RMBS portfolio in the US. In 2007, impairments were limited to EUR 29 million on asset-backed commercial paper in Canada. Excluding impairments, underlying income increased 24.4% to EUR 2,769 million driven by higher interest results, especially in the US. The total interest margin widened to 0.94% in 2008 from 0.75% in 2007 following rate reductions by central banks across the globe.
Underlying operating expenses increased 7.6% to EUR 1,719 million due to higher expenses related in part to customer retention and win-back campaigns, as well as the inclusion of Interhyp from August 2008. The number of full-time staff rose from 8,883 in 2007 to 9,980, of whom 479 came from Interhyp. Excluding impairments, the underlying cost/income ratio improved to 62.1% from 71.8% in 2007.
The addition to the provision for loan losses increased to EUR 283 million from EUR 68 million in 2007, driven by an increase in the US reflecting higher delinquencies in the mortgage market and lower recoveries. The addition in 2008 was 63 basis points of average credit-risk-weighted assets.
The underlying risk-adjusted return on capital (RAROC) after tax fell to -18.2% from 14.3% in 2007 due to the impairments of the investment portfolio. Average Economic Capital rose 24% to EUR 3.4 billion, reflecting the more volatile and higher-risk environment.
Profit and loss account (underlying)
in EUR million 2008 2007 change
Total income 878 2,196 –60.0%Operating expenses 1,719 1,598 7.6%Additions to loan loss provisions 283 68 316.2Underlying result before tax –1,125 530 –312.3%Total result before tax* –1,155 530 –317.9%
* Total result before tax is defined as underlying result before tax including divestments and special items.
Key figures
2008 2007
After-tax RAROC –18.2% 14.3%Economic Capital (EUR billion) 3.4 2.8
Underlying result before tax
in EUR million 2008 2007 change
Canada (1997)* 59 30 96.7%Spain (1999) 43 55 –21.8%Australia (1999) 72 84 –14.3%France (2000) 31 46 –32.6%United States (2000) 343 78 339.7%Italy (2001) 34 49 –30.6%Germany (2002)/Austria (2004) 297 359 –17.3%United Kingdom (2003) –72 –120 n.a. Japan** –40 –22 n.a. Subtotal 766 559 37.0%Impairments –1,891 –29Total –1,125 530 –312.3%
* Launch year in brackets** Early 2009, it was decided not to launch operations in Japan.

ING Group Annual Report 2008
41
COUNTry DEVELOPMENTSExcluding impairments, ING Direct’s underlying result before tax rose 37.0% to EUR 766 million. In the US, result before tax increased to EUR 343 million from EUR 78 million in 2007, while Canada rose to EUR 59 million from EUR 30 million. The UK made good progress by reducing its loss to EUR 72 million from a EUR 120 million loss in 2007. All other countries reported lower results due to the intensified competition for retail funds and an increase in risk costs.
BUSINESS DEVELOPMENTSING Direct is the world’s leading direct bank. It sells a limited number of simple banking products at very low cost to retail customers in nine major developed countries. ING Direct’s vision is to become the world’s most preferred consumer bank by being our customers’ primary bank. ING Direct will therefore continue to put customers first and gradually expand its product offering while maintaining outstanding customer satisfaction levels.
In 2008, ING Direct continued to invest in building the business and expanding its product offering, with investment costs amounting to EUR 331 million. Given the current priorities of preserving ING’s capital position and the worsening economic outlook, ING Direct is strictly managing its risks, capital and expense base.
In line with these priorities, it was decided early 2009 not to launch ING Direct operations in Japan. ING Direct will reduce expenses in 2009 by about EUR 150 million through lower operating and marketing expenses, and a headcount reduction of around 600 FTEs.
Sources of growthING Direct is focusing on different sources of future growth. First, it aims at continued growth in customer numbers and savings deposits in countries where it is already present. Our current market share in existing markets is around 2% in savings and less than 2% in mortgages, leaving ample room to grow.
Another source of growth is via an expansion of the product range. ING Direct aims to address the five major consumer needs: savings, mortgages, payment accounts, investment products and consumer lending. These products will only be introduced in a country if it is economically viable. Expanding the multi-product range will result in more diversified profit and also supports client retention and cross-selling opportunities.
Developing the major product categories
Savings – strong competition in 2008The savings market has become increasingly competitive, with strong competition for retail deposits in all ING Direct countries, especially as banks worldwide seek to lock in liquidity. In light of this development, one of ING Direct’s key focus points is to increase the repricing speed of assets in order to be able to track central bank rates more closely.
ING Direct used to offer only a single, simple savings product, but it refined its savings products in all countries to win new customers and new funds from existing customers in a more competitive market. An example are fixed-term savings products, which
performed well in 2008; the total number of these accounts increased by 0.5 to 3.1 million (+21%). The new product offering also allows us to better meet customers’ needs.
As the financial crisis deepened during late September/early October, consumers worldwide actively re-allocated their account balances among multiple financial institutions to maximise protection from government guarantees. This led to outflows, but also to an inflow of new customers coming over from other banks. Active rebalancing slowed after governments increased guarantee limits. From the end of October, customer behaviour returned to normal and ING Direct returned to growth.
Overall, production of funds entrusted was EUR 6.7 billion, mainly driven by strong growth in the United States. Including the impact of negative currency effects, total funds entrusted balances declined by EUR 0.5 billion to EUR 191.0 billion at year-end.
In the United Kingdom, ING Direct repositioned itself away from more price-sensitive customers and it also tracked the Bank of England rates more closely. It took several management, pricing and marketing actions in 2008, which resulted in ING Direct UK reaching break-even in the fourth quarter. In October, ING Direct UK acquired retail deposits from two British subsidiaries of Icelandic banks Kaupthing Edge and Heritable Bank.
Mortgages – portfolio growth under strict criteriaThe own-originated mortgages portfolio grew by EUR 17.2 billion (up 18.6% from 2007), bringing the total residential mortgages portfolio to EUR 113.7 billion at year-end. ING Direct’s own-originated residential mortgages reached 57% of funds entrusted.
A focal point in 2008 was to better balance the growth in savings and in mortgages and this will remain a priority for 2009. ING Direct also sharply monitors the quality of the new mortgage portfolio and has tightened its underwriting criteria accordingly.
The deterioration in the US housing market led to an increase in the provision for loan losses, reflecting a higher rate of delinquencies in the mortgage market and lower recovery. Within the US mortgage portfolio, the non-performing loans (90+ Days Past Due) rose to 2.7% at the end of December. However, the mortgage portfolio continues to perform better than the US industry average for prime adjustable-rate mortgages (ARMs), which showed a rate of non-performing loans of 8.3% as at the end of November 2008.
The overall US portfolio consists of quality customers with an average loan-to-value ratio of 75% (indexed for changes in property values), and 97% of the mortgages are to owner-occupiers.
In 2008, ING Direct acquired a 99.15% stake in Interhyp, Germany’s largest independent distributor of residential mortgages. Interhyp offers residential mortgages from over 70 banks, building societies and insurance companies, using a state-of-the-art internet platform. In 2008, it distributed EUR 5.9 billion of mortgages that represent a market share of 3.3%.
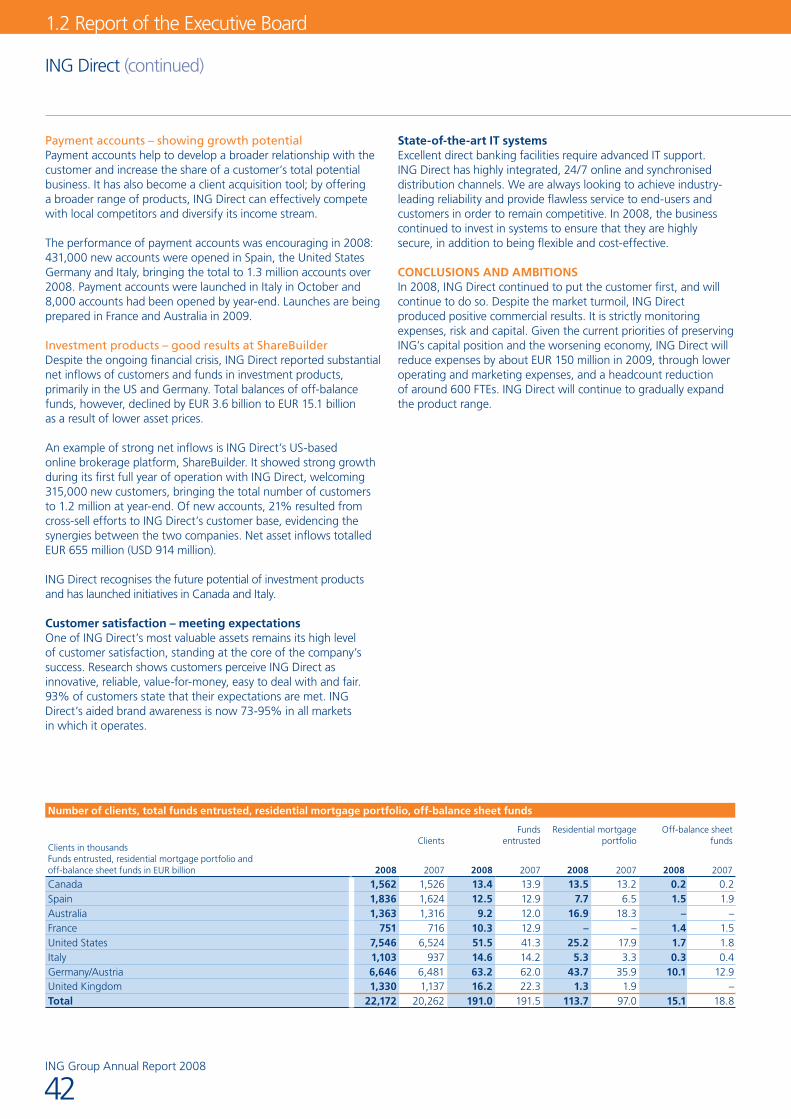
ING Group Annual Report 2008
1.2 Report of the Executive Board
42
State-of-the-art IT systems Excellent direct banking facilities require advanced IT support. ING Direct has highly integrated, 24/7 online and synchronised distribution channels. We are always looking to achieve industry-leading reliability and provide flawless service to end-users and customers in order to remain competitive. In 2008, the business continued to invest in systems to ensure that they are highly secure, in addition to being flexible and cost-effective.
CONCLUSIONS AND AMBITIONS In 2008, ING Direct continued to put the customer first, and will continue to do so. Despite the market turmoil, ING Direct produced positive commercial results. It is strictly monitoring expenses, risk and capital. Given the current priorities of preserving ING’s capital position and the worsening economy, ING Direct will reduce expenses by about EUR 150 million in 2009, through lower operating and marketing expenses, and a headcount reduction of around 600 FTEs. ING Direct will continue to gradually expand the product range.
Payment accounts – showing growth potential Payment accounts help to develop a broader relationship with the customer and increase the share of a customer’s total potential business. It has also become a client acquisition tool; by offering a broader range of products, ING Direct can effectively compete with local competitors and diversify its income stream.
The performance of payment accounts was encouraging in 2008: 431,000 new accounts were opened in Spain, the United States Germany and Italy, bringing the total to 1.3 million accounts over 2008. Payment accounts were launched in Italy in October and 8,000 accounts had been opened by year-end. Launches are being prepared in France and Australia in 2009.
Investment products – good results at ShareBuilderDespite the ongoing financial crisis, ING Direct reported substantial net inflows of customers and funds in investment products, primarily in the US and Germany. Total balances of off-balance funds, however, declined by EUR 3.6 billion to EUR 15.1 billion as a result of lower asset prices. An example of strong net inflows is ING Direct’s US-based online brokerage platform, ShareBuilder. It showed strong growth during its first full year of operation with ING Direct, welcoming 315,000 new customers, bringing the total number of customers to 1.2 million at year-end. Of new accounts, 21% resulted from cross-sell efforts to ING Direct’s customer base, evidencing the synergies between the two companies. Net asset inflows totalled EUR 655 million (USD 914 million).
ING Direct recognises the future potential of investment products and has launched initiatives in Canada and Italy.
Customer satisfaction – meeting expectationsOne of ING Direct’s most valuable assets remains its high level of customer satisfaction, standing at the core of the company’s success. Research shows customers perceive ING Direct as innovative, reliable, value-for-money, easy to deal with and fair. 93% of customers state that their expectations are met. ING Direct’s aided brand awareness is now 73-95% in all markets in which it operates.
Number of clients, total funds entrusted, residential mortgage portfolio, off-balance sheet funds
Clients in thousandsFunds entrusted, residential mortgage portfolio and off-balance sheet funds in EUR billion
ClientsFunds
entrustedResidential mortgage
portfolioOff-balance sheet
funds
2008 2007 2008 2007 2008 2007 2008 2007
Canada 1,562 1,526 13.4 13.9 13.5 13.2 0.2 0.2Spain 1,836 1,624 12.5 12.9 7.7 6.5 1.5 1.9Australia 1,363 1,316 9.2 12.0 16.9 18.3 – –France 751 716 10.3 12.9 – – 1.4 1.5United States 7,546 6,524 51.5 41.3 25.2 17.9 1.7 1.8Italy 1,103 937 14.6 14.2 5.3 3.3 0.3 0.4Germany/Austria 6,646 6,481 63.2 62.0 43.7 35.9 10.1 12.9United Kingdom 1,330 1,137 16.2 22.3 1.3 1.9 –Total 22,172 20,262 191.0 191.5 113.7 97.0 15.1 18.8
ING Direct (continued)

ING Group Annual Report 2008
43
Asset management
Key points> Total assets under management,
which include ING Investment Management, ING Real Estate and ING Private Banking decreased by 14% to EUR 551.3 billion
> Investor confidence hit hard by the global financial crisis resulting in sharply lower net inflows
> ING Real Estate total business portfolio marginally lower
> ING Private Banking recorded net inflows
2008 proved to be a very challenging year for the asset management industry. Sharp falls in asset values and lower net inflows had a major impact on industry profitability. Client appetite for risk almost disappeared with alternative investments such as hedge funds and private equity hit hard, and with retail clients in particular seeking sanctuary in low-risk funds or those with guarantees. ING’s investment management business was to a certain extent insulated from the global financial turmoil because of relatively stable inflows from ING’s insurance, investment and pension businesses. ING Real Estate’s total business portfolio was EUR 106 billion, marginally lower than 2007. Despite the market turmoil, ING Private Banking achieved net inflows.
FINANCIAL DEVELOPMENTSAssets under management fell by EUR 91.4 billion, or 14.2%, to EUR 551.3 billion in 2008, as a result of the sharp deterioration in financial markets. Lower asset prices for equity and fixed-income securities had an adverse impact of EUR 99.1 billion. Despite the depressed financial markets, ING recorded a net inflow of EUR 17.4 billion in 2008. All lines of business contributed to this net inflow with the exception of Insurance Europe which reported a net outflow of EUR 2.2 billion. Acquisitions and divestments had a net negative impact of EUR 6.2 billion and exchange rate movements reduced assets under management by EUR 3.6 billion.
ING INVESTMENT MANAGEMENTING Investment Management (ING IM) is the principal asset manager of ING Group with EUR 332.5 billion in assets under management at the end of 2008 compared to EUR 390.2 billion at the end of 2007. ING’s investment management business continued to pursue its goal of strengthening its position in global asset management. Growth was constrained by the financial turmoil and the dampening impact it had on investor enthusiasm. Despite this, ING IM’s global distribution reach and strong emerging markets presence, together with its scale in fixed income, strong brand recognition and access to a global network of ING channels and flows held the company in a relatively solid position in challenging market circumstances.
The company fared relatively better in the institutional segment where it managed to maintain and in some regions attract net inflows. Retail flows were adversely affected by investors moving to lower-risk products or those with a capital guarantee.
At the end of the year, the investment management business delivered investment performance with 46% of mutual fund assets outperforming their peer median and 61% of mutual funds outperforming their benchmark on a three-year basis. Morningstar awarded 76% of ING’s ranked mutual funds with 3 stars or higher.
All three regions – Europe, Americas and Asia/Pacific continued to focus on the core strategy of delivering a wide range of innovative investment strategies to ING’s global network of businesses and third-party clients.
Assets under management by manager
Assets under management by client category
in EUR billion
Investment Management Europe 23% 129.5
Investment Management Americas 25% 139.4
Investment Management Asia/Pacific 12% 63.6
ING Real Estate 13% 69.5 Private Banking 10% 53.1 Other 4% 23.6 Externally managed 13% 72.6 Total 100% 551.3
in EUR billion
Insurance policy holders 19% 103.0 Institutional clients 25% 140.5 Retail clients 17% 91.6 Private banking clients 11% 62.0 Proprietary 28% 154.1 Total 100% 551.3

ING Group Annual Report 2008
1.2 Report of the Executive Board
44
Asset management (continued)
This was achieved by all three working closely to leverage scale, investment expertise and best practices, in order to maximise cross-selling opportunities. An example of this was the successful distribution of ING’s European investment management Global Currency strategy in Japan in close cooperation with the investment management business in the Asia/Pacific. The fund successfully attracted EUR 1.3 billion of inflow.
The strengthening of risk controls and risk reporting procedures across the regions was improved.
In the second half of the year, as the financial crisis worsened, the investment management businesses in Europe, the Americas and Asia/Pacific focused very much on client communication, advice and client retention. There was very close cooperation among all three regions to assess market, credit and operational risk exposures as well as thorough discussions about risk mitigation scenarios.
ING Investment Management became a signatory to the United Nations Principles for Responsible Investing (UNPRI), which is designed to guide investment decision-making with a view to corporate responsibility considerations. (See also the Corporate responsibility section.)
EuropeAssets under management fell 15% to EUR 129.5 billion. Third-party AuM declined by 19% to EUR 81.6 billion and proprietary business AuM was 8% lower at EUR 48 billion. Limited outflows from mutual funds were recorded as a result of the market turbulence. The business unit strengthened its position in the fiduciary market through a series of new relationship agreements and the acquisition of Altis Investment Management. Altis is a leading multi-manager specialist team based in Switzerland. The acquisition was in line with the business’ ambition to be a leading solutions provider. In addition, the institutional business in the Netherlands was strengthened with ING/AZL entering into agreements to provide fiduciary management services to two major pension funds, Pension Fund Social and Economic Council of the Netherlands (SER) and Public Authorities, and the Will Niemeijer Pension Fund as well as TVM Verzekeringen. ING acquired AZL, a Dutch provider of pension fund management services, in 2007 to boost its scale and market strength in the European pension business.
ING IM benefited from the growth of ING’s insurance and pension businesses in Central Europe. Operations in six Central European countries serve an increasing broad spectrum of clients.
Despite the difficult market situation, ING IM established its presence in the Middle East, which included local investment capabilities, taking advantage of investment opportunities arising from global economic changes as well as growth opportunities in the region.
AmericasAssets under management fell 8% to EUR 139.4 billion. Third-party AuM declined by 7% to EUR 74.9 billion and proprietary business AuM declined 10% to EUR 64.5 billion. The financial turmoil dampened the willingness of both retail and institutional clients to add to their portfolios during the year. The business focused its strategy on raising the visibility of three significant franchise strengths – Senior Bank Loans and Small and Mid-Cap Equity. The Senior Loan team was selected by the USD 190 billion California Public Employees Retirement System (CalPERS) as one of three bank loan managers to manage future CalPERS allocations to senior bank loans. ING IM’s Senior Loan team also won a EUR 193 million mandate from the Massachusetts Pension Reserves Investment Management Board during 2008. In addition, the fundamental equity teams in the US and the Canadian equity group continued to be bright spots with recent sales wins.
The retail side of the investment management business realigned its sales force to focus on improved client segmentation and increased traction with broker dealer investment platforms and with ING’s Retirement Services Group. Despite challenging market conditions there were several positive developments during the quarter. Separately Managed Accounts sales increased by 13% during the year from EUR 414 million to EUR 466 million, assets were added to the VP Growth and Income Fund through a merger, and the ING Global Target Payment Fund, one of the first open-end managed payout funds, was launched in September.
Pomona Capital, part of the Alternative Assets Group, saw strong ongoing fundraising of EUR 860 million in the Private Equity Fund of Funds. Performance in ING’s Fund of Hedge Funds was relatively solid despite difficult market conditions and there are good prospects for the marketability of this fund. In spite of the challenging market conditions, investment management in Latin America continued to deliver strong relative investment performance across the region supporting growth in ING’s mandatory pension and annuities businesses. In its third-party business, assets under management in institutional private pension plans continued to grow offsetting weakness in retail mutual funds. In January 2009, ING launched its Chilean mutual fund company.
In the coming year the business will place increasing emphasis on returning to its basic core strengths and improving its investment performance and product development for its customers. In addition, the business’s already strong risk management resources will be further improved.

ING Group Annual Report 2008
45
ING REAL ESTATE2008 was a difficult year for ING Real Estate as the financial crisis continued to impact negatively on real estate markets around the globe. As a result, some of world’s most established real estate markets saw substantial falls in value as the readily available capital which had fuelled the strong valuation growth of previous years, dried up. Canada, Australia and the United Kingdom in particular saw substantial yield shift and valuation declines with Asia and Europe also being affected negatively during the year. In the second half of the year the prospect of recession in many major economies proved a further blow to the markets.
At the year-end, ING Real Estate’s total business portfolio was EUR 106 billion, marginally lower than 2007. A 15% increase to EUR 37 billion in the loan portfolio was offset by a decrease in assets under management from EUR 75 billion to EUR 70 billion. Despite an inflow of new client money, the decrease in assets under management occurred as a result of lower values in listed and unlisted funds as well as adverse currency movements.
As the real estate markets went into reversal, ING Real Estate put in place a cost containment programme, beginning at the end of the first quarter of 2008. This resulted in full-year costs excluding impairments being only marginally (less than 1%) higher than 2007.
ING Real Estate Investment ManagementFee income was much lower and there were substantial unrealised losses on the investment portfolio. Despite this there were significant net inflows into funds and a number of new mandates were won. During the year the focus of Real Estate Investment Management remained on ensuring client relationship management was maintained to the highest standard whilst at the same time ensuring a switch from growing the business to sustaining the performance of the business. Cost containment measures were implemented to ensure the cost base reflected the new reality of the market.
ING Real Estate FinanceThe Real Estate Finance business held up well, given the market circumstances. The loan portfolio grew by 15%, and although risk costs increased quite substantially, volumes and margins rose as well. The loan portfolio remained diversified both by geography, of which 53% was Dutch, and by asset class. Following the substantial growth in recent years it became clear towards the end of 2008 that Real Estate Finance would be unable to sustain its current growth particularly in the light of ING Group’s overall risk strategy.
ING Real Estate DevelopmentAt Real Estate Development it became apparent that to withstand the deteriorating markets it would need to continue to review its business and refocus its activities on major retail and regeneration projects. As a result the business withdrew from a number of projects while also deferring several projects that were in the pipeline. It continued to progress major regeneration and inner city projects across Europe, projects which were already under way and which had already passed the stringent risk criteria in place for development activities.
Asia/PacificAssets under management fell 25% to EUR 63.6 billion. Third-party AuM fell by 19% to EUR 48.4 billion and proprietary business AuM declined by 39% to EUR 15.2 billion. Equity funds in the region experienced outflows, but bond funds received net inflows. Despite the uncertain economic climate, ING was successful in booking significant new and prestigious mandates with the Monetary Authority of Singapore (EUR 183 million), the Bank of Thailand (EUR 143 million), Bank Negara in Malaysia (EUR 129 million) and GSIS in the Philippines (EUR 215 million).
On the retail front, major fund launches included a Real Estate Fund in Hong Kong and the Taiwan Focus Fund, which will be marketed around the region. The launch of the High Yield Currency Fund in Japan resulted in record net inflows (EUR 3.58 billion). ING IM expanded its geographic footprint by opening a representative office in Beijing.
Risk management was a major focus in the business. Risk controls were strengthened and a more frequent risk reporting process was conducted to consolidate risk issues for management. In 2009, there are plans to further strengthen risk awareness and regional investment risk governance.
Goals and ambitionsING Investment Management gives ING a significant global presence through its broad offerings of a diversified mix of products with solid performance.
ING IM is committed to further strengthening partnerships with ING businesses and developing third-party business opportunities. The business also strives to increase investment performance for clients and to maximise the use of ING’s risk management skills.
Both the retail and institutional sides of the businesses will continue to focus on close customer contact and are committed to working with clients to manage their investments through turbulent times.
With the likelihood of difficult market conditions continuing in 2009, cost containment measures have been taken with due care to preserving the investment expertise and full commercial growth capabilities of the business.
ING IM will focus further on strengthening the organisation to capitalise fully on the recovery after the crisis. This includes enhancing operations, investment platforms and distribution capacity.

ING Group Annual Report 2008
1.2 Report of the Executive Board
46
PRIVATE BANKINGPrivate Banking reported a decline in asset accumulation to EUR 62 billion from EUR 68 billion at the end of 2007. Costs were well contained. Underlying profit before tax fell 57.8% to EUR 111 million. Loan loss provisions in Asia were made as a result of the exceptional market circumstances in 2008.
Private Banking aims to grow its assets under management by focusing on gathering assets and building a strong foundation for future revenues when the market recovers, while keeping a close eye on margins and expenses. The uncertain economic situation has stimulated many investors to move their assets into more conservative products. ING benefited from its conservative profile and from being the third largest savings bank in the world.
In the Netherlands, capitalising on the integration of Postbank and ING Bank, Personal Banking was introduced. This is a new service for clients with investments of between EUR 75,000 and EUR 500,000. The service combines the investment advice strengths of both banks and gives clients access to investment specialists. ING sold its Curaçao Private Banking Business in 2008 in line with its strategy to concentrate its activities on Europe and Asia. The focus for 2009 is on this region and offering more competitive products. In January 2009, Private Banking announced it would transfer the ownership of its investment business to ING Investment Management Europe. This effectively means the European business will become the investment management service provider of choice for ING Private Banking globally. Despite this move, open architecture – providing a wide range of third-party funds for portfolios – remains one of the cornerstones of Private Banking’s strategy.
The financial sector will continue to face market volatility, limited liquidity and intensified competition for deposits. Private Banking therefore expects its margins to remain under pressure. Private Banking has been one of the most attractive businesses in the banking industry, and although an economic downturn may restrict growth in the short term, Private Banking expects its average growth rate to remain above that of retail banking businesses in general.
Asset management (continued)

ING Group Annual Report 2008
47
Human resourcesFocus on leadership and engagement in times of change
Key points> Winning Performance Culture Survey
of 85,000 people yields positive results> Retain talent and get best people in
the right places> Dealing with changing environment> More business alignment and involvement,
sharing of best practices
To manage the change of the business landscape and to continue to run our business well, it is essential to develop and engage our employees in the best possible way. The strong alignment between HR and the business was proven midway through 2008 when the global financial markets took a dramatic turn for the worse. From being focused on supporting business growth, HR switched emphasis to help the company deal with the effects of the unpredictable market events on the company and its employees.
HR IN SUPPORT OF BUSINESSThe human resources discipline is closely aligned with ING’s business strategy. This is partly the result of a continuous interaction that engages HR, the business and its leadership in building ING’s overall people strategy. In 2008, HR continued to foster the highest standards of behaviour and professionalism and this was a significant factor in driving the business. We aim to provide staff with the opportunities and tools to allow them to engage in the business and excel in their career development. ING’s workforce of 125,000 people worldwide is diverse and talented. Our global on-boarding programme, Get Orange, instills our values in new staff while the development and education programmes for existing staff help them get more engaged.
Increased engagementING continued to implement its Winning Performance Culture (WPC) programme across the organisation. Set up in 2005, its objective is to establish a culture in which the company’s shared values, beliefs and practices create and sustain superior business performance. Progress is measured by a regular WPC Survey and 2008 was the first time all ING employees were invited to participate. More than 85,000 employees (73% of all those invited) completed it halfway through 2008. Overall, engagement rose to 71%, which gave ING a higher score than the average scored by other multinational companies that have conducted similar surveys.
‘Engagement’ is defined in a number of ways, including the intention to stay with the company. High levels of engagement were also apparent in the open feedback section, where 63,000 comments were posted. Other positive findings were that ING provides a stimulating work environment, and 79% of respondents indicated they had a good understanding of ING’s strategy. Reported areas for improvement included processes, cost management and opportunities for career development.
Each manager has received the WPC Survey results for their own business unit and HR is helping them interpret the results, understand the core issues and develop an action plan.
In 2008, diversity was comprehensively integrated in the WPC survey for the first time to measure employee perceptions around diversity and comparisons of engagement among diverse segments to the overall employee base.
DiversityING recognises that diversity is about creating an inclusive corporate culture that embraces the differences of its employees. This understanding contributes to our winning performance culture, it values collective wisdom in business decision-making and ultimately helps us to better connect with our current and potential customers as well as to each other.
ING Group Annual Report 2008
1.2 Report of the Executive Board
48
External benchmarking of our industry peers in the last quarter of 2008 indicated that high-performing companies continued their focus on people development during times of crisis, of which diversity was an integral part. Meeting our workforce diversity objectives remained a priority in 2008. The Global Diversity Council was re-established, containing several senior executives. Diversity business plans are being introduced in several business lines and coordinated on a global level.
Talent acquisition and retentionIn spite of the financial crisis, recruiting and managing executives and strengthening succession planning continued in 2008. The main focus of the leadership acquisition team is to benefit from past and on-going recruitment initiatives world-wide. The added value of this is the sharing of information on a wealth of potential candidates across business lines and, by doing so, providing senior management with timely access on a global basis to these candidates. An added benefit of this approach is that ING will capitalise on executive search firm fees. This resulted in a heightened interest for a central coordination platform for all external searches that are to a lesser extent still taking place.
In 2008, ING was successful in attracting a considerable number of young talented graduates. In the Netherlands, ING was named as ‘favourite employer in the financial services industry’ by students. The financial crisis, however, will impact the recruitment process as we are bringing expenses in line with revenue expectations. This will lead to lower inflows of graduates. In addition to this, the image of the financial industry has been harmed. Hence, it will be more challenging to attract talents. At the same time the war for talent continues, making recruitment of talent even more critical.
ING attracts graduates for all business lines and has defined a global profile to do so. Applicants are measured against elements such as a ‘can-do’ mentality, unpretentious, result-driven, passion for teamwork, academic background, two years of working experience at the most and fluency in English. Our graduate profile demonstrates ING’s commitment to attracting and retaining talented people from diverse backgrounds. The same criteria have been defined for people who enter the ING International Graduate Programme, a four-year curriculum for talents starting with ING.
In 2008, a new tool was selected as next-generation system for global recruitment and selection. It makes it easier to share information about internal and external applicants across the company. This supports ING’s leadership acquisition and talent management aim to create a global platform for all vacancies. Given the reduced budgets for recruitment, there was growing appetite for this platform.
A talent review was conducted in 2008 by each business line, covering all senior positions and talents. ING’s long-term success will depend heavily on having key talents in the right critical positions. The international mobility of staff is a necessity for a global company. A need for leaders with regional and international responsibilities and experience will remain. Retaining and motivating our key people is now more important than ever.
Learning and developingING takes a structured approach to executive training and development and is convinced that the development and education programmes for existing staff help them get more engaged. The ING Business School expanded its range of courses in 2008. The school enlisted 2,550 participants, compared to 2,800 in 2007 and also delivered its programmes regionally (in the US, Central Europe and Asia). In the course of 2008, the leadership training programme refocused to the subject of crisis leadership.
In addition, the Business School increased the business impact learning initiatives. In Thailand, Central Europe and within Investment Management, these initiatives created extra business. An important shift took place from learning programmes related to managing for value to process management (‘Lean Six Sigma’) courses, also reflecting the changed business environment.
Strengthening the human resources footprint at a global levelThe human resources function within ING strives to increase value and service quality to the business. The governance model was changed in 2008 and is now based on two pillars: reaching out to the business lines and making global projects more transparent. A business line forum was established with 20 key HR positions from the business lines. Its purpose is to further reach out to the business lines when developing human resources strategy. In addition, two new steering committees were put in place, with representatives from the HR Business Line Forum and the Corporate HR Expert Centers, in order to facilitate global HR projects in key areas like IT Application Strategy, Talent & Development and Performance & Reward.
Dealing with changing environmentAs in 2008, the company will also have to deal with the effects of the unpredictable market events in 2009. In early 2009, ING announced the necessity to cut operating expenses by EUR 1 billion in 2009. 35% of this amount will come from a reduction of the workforce by approximately 7,000 full-time positions, involving 2,800 people within our banking operations and 4,200 within insurance. ING remains committed to managing its people with respect and will support those affected by this shift in priorities. Given current concerns in society that incentive structures may have contributed to the emergence of the financial crisis, and as agreed with the Dutch State, the ING Supervisory Board will review the remuneration policy for the Executive Board and senior management. Further information is to be found in the Remuneration report.
CONCLUSIONS AND AMBITIONSThe global human resources function is focused on supporting ING’s business priorities, with employee engagement remaining high on the agenda. Global HR will continue to promote people-oriented leadership, as business success can only be achieved through people. Global HR will also take its responsibility in helping the company deal with its shift in priorities due to the challenging market circumstances.
Human resources (continued)
ING Group Annual Report 2008
49
Corporate responsibilitySustainable approach to support long-term priorities
Key points> Signing up to the UN Principles for Responsible
Investment (PRI) > Financial education initiatives around the world > Thousands of children in school via the ING
Chances for Children programme> Independent sustainable benchmarks and
indices, such as Dow Jones Sustainability Index and the FTSE4Good Index, recognise ING’s effort in the field of CR by increasing our individual sustainability scores
The current financial crisis has damaged trust in our industry. We believe that responsible behaviour is crucial in earning and maintaining the confidence of our stakeholders. Clarity about financial strength, business models and products is essential, as is a clear customer focus and transparency about the way we operate. This includes our responsibilities to our employees and our duty to manage the broader social and environmental impact of our business activities.
CLEAR STRATEGYOur corporate responsibility strategy is an integral part of our business and is built on our Business Principles. These principles give us guidance on matters such as the environment and human rights, as well as our responsibilities towards our stakeholders. We consider them to be the fundaments for confidence of customers, employees, investors and business partners in ING.
ING aims at taking part in society in a positive and responsible way. We have our own vision on ethical social and environmental topics, which is translated into clear policies. These apply all over the world and to all market circumstances. We continuously keep track of how stakeholders perceive ING, which issues are important to them and what we can do to meet their expectations. An open shareholder dialogue helps us to understand issues and concerns and to adapt our policies, where necessary.
Our corporate responsibility strategy is based on main focus areas which are formulated in six key pillars. This helps us to continue to focus on achieving our objectives, to measure our performance and to meet our commitment of continuous improvement. We believe that the integration of sustainability issues into our strategy is essential for our licence to operate. It contributes to our success by earning and maintaining trust, enabling us to recruit and retain talented employees, continuing strong stakeholder relationships, taking advantage of new business opportunities and managing risk.
Key points of ING’s corporate responsibility
We lend and invest responsiblyWe offer our customers sustainable productsWe are inclusive and clearWe play an active role in the communityWe manage our impact on the environmentWe engage our employees in sustainability
Responsible lending and investing Performance is not only about demanding targets. Sometimes it also means refraining from a certain business activity or transaction in order to live up to our standards. We avoid business dealings that are not in line with our vision on sustainability. When making ethical choices, we take into consideration the expectation that our customers, employees, shareholders and society have of us. This has led to policies with regard to not financing cluster bombs or landmines, nor financing projects in countries such as Burma and Sudan.
In 2008, we actively sought the views of various stakeholders, not only to hold up the mirror to our own business practices, but also to exchange ideas and knowledge. Key issues that were discussed include climate change, controversial weapons and human rights.

ING Group Annual Report 2008
1.2 Report of the Executive Board
50
Corporate responsibility (continued)
In all our business activities, ING strives for the highest ethical standards. ING Investment Management, for example, signed up to the UN Principles for Responsible Investment (PRI) on 1 September 2008. Launched in 2006 by the UN Secretary General, the PRI are a set of global best-practices for responsible investing. The PRI is a partnership with the UN Global Compact and the Finance Initiative of the UN Environmental Programme, both of which ING is a member. These principles are designed to help investors consider the environmental, social and governance issues in investment decision-making and ownership practices. With regard to project financing, Wholesale Banking has subscribed to the Equator Principles since 2003. These ensure that socio-environmental risks form an essential part in our overall risk analysis of the projects we finance.
Sustainable productsWe strive to meet the growing demand from customers for products and services that are environmentally friendly and socially responsible in addition to generating a good return. To cater to those needs, ING offers several funds and products that allow them to do this. Examples are sustainable investment funds including the so-called thematic funds that offer clients the opportunity to invest in topics such as water, renewable energy and microfinance. Green deposits or notes and eco-efficient Car Lease opportunities for clients are also part of ING’s sustainable product range. The amount of sustainable assets under management was EUR 2,295 million in 2008.
Financial inclusion and educationWe now more than ever need to be accessible, easy to understand, transparent and ready to serve our customers with professional advice in order to help them manage their financial future. At the same time, the choice and complexity of products and delivery channels has increased substantially throughout the financial sector. Therefore, easy access, reducing complexity and clear and transparent information are essential parts of our commitment to treating our customers fairly and being responsive to their needs.
We believe that providing additional information to educate people on financial products is a key element in empowering customers with the confidence and capacity to take more appropriate financial decisions. In our view, financial education should be complementary to adequate consumer protection and to the responsibility of treating our customers fairly. Moreover, education can only be effective if it is relevant to people’s needs. Therefore, our initiatives are developed to link in with the different phases of our customers’ lives, from buying a house to managing a pension.
We place an emphasis on investing in financial education for youth, as we believe it is important that good financial habits are developed early in life. In recent years, we have started several financial education initiatives around the world. ING Vysya Bank in India launched the portal www.kidzzbank.com to help children understand the concept of money and savings in a fun way. In Peru, ING has partnered with the Aflatoun organisation and the Peruvian Ministry of Education to advance the financial education of Peruvian children. The ING Foundation in the US has joined with charity Girls Inc. to create a pioneering initiative for high school girls. The programme aims at teaching girls how to invest. ING has also developed educational tools for its (potential) clients.
An example is the L-earn online education package from ING Australia. L-earn covers key investment topics and is relevant to people regardless of age, risk tolerance, existing wealth or current level of investment and knowledge.
Community commitment ING feels it has a responsibility to make a positive contribution to society by donating and sponsoring projects in the field of education in particular. Through our main global charity programme ING Chances for Children, and in cooperation with UNICEF, we give children a real chance of securing a better future by providing them with education. Our employees are the cornerstone of the programme’s success, either through their donations (which are matched by ING) or by providing voluntary help. In 2008, we provided thousands of children with primary education through the programme.
On 20 November 2008, the UN Day of the Child, ING Chances for Children held its first global charity event, the ING Global Challenge. Staff from 29 countries volunteered more than 29,000 hours, raised EUR 986,400 and promoted the importance of supporting education in their communities.
Art, culture and sportsAlso in the fields of art, culture and sports, ING feels committed to contributing to society. Our cultural sponsorships focus on music, fine arts and design. In the Netherlands, for example, ING is the main sponsor of the Royal Concertgebouw Orchestra, the Rijksmuseum and the Zuiderzeemuseum. In 2008, an innovative approach was taken to establishing a think tank for various business problems. This group consists of young talented designers who, in cooperation with ING employees, came up with innovative, creative and useful solutions. In the field of sports, ING sponsors soccer and the ING Renault F1 Team. It has also been the title sponsor of the ING New York City marathon for several years. Business units throughout the company support various initiatives in their own communities, such as the Society for the Preservation of Nature, sponsored by ING in the Netherlands.
Impact on the environmentING supports the thesis that healthy economic growth and environmental care are two sides of the same coin. Environmental protection is a fundamental part of our commitment to conduct our business responsibly.
In 2005, ING issued a global internal environmental statement, which outlines three areas in which ING believes its direct impact on the environment is most significant and which can be controlled effectively: energy consumption, business travel and paper consumption. These three areas cause about 99% of our direct environmental footprint. Furthermore, ING was one of the first major Dutch financial institutions to be 100% carbon neutral. This was achieved in 2007. By lowering our energy consumption, using green energy and investing in renewable energy projects, we have reduced our net CO2 emission to zero.
ING has drawn up sector-specific policies to prevent or limit our indirect impact on the environment. Our financing activities, for example, may involve us indirectly in operations which can be harmful to the environment. This mainly applies to financing of the oil, gas, mining, forestry, paper and agricultural sectors.

ING Group Annual Report 2008
51
MEASURING PERFORMANCEING has identified ten KPIs for its CR reporting. These KPIs relate directly to the ING CR Strategy and are used by ING to measure CR performance within ING.
Key Performance Indicators (1)
Year-end2008
Year-end 2007
Equator PrinciplesNumber of projects reviewed 135 85
Sustainable assets under management (in EUR million) 2,295 2,763 (2)
Customer satisfaction index (3) 69.6% 71.2%
Economic value (in EUR million)Total assets 1,331,663 1,312,510Capital and reserves 17,334 37,208Total income 66,291 76,587Result before tax –1,487 11,043Net result –729 9,241Personnel expenses: salaries 5,885 5,696Personnel expenses: other 2,879 2,565Employee engagement index (4) 83% 77%
DiversityPercentage of women in the international management council 11.8% 10.2%
ING Chances for ChildrenNumber of children provided with access to education 111,409 124,634
Green energyKWH (in thousands) of electricity purchased by ING that is derived from renewable resources 344,448 259,780Dow Jones Sustainability Index 71 62FTSE4Good Index Included Included(1) The audit firm Ernst & Young has audited the KPIs for reasonable assurance.(2) For a detailed overview, see the 2008 Corporate Responsibility Performance
Report.(3) Satisfaction scores are based on the American Customer Satisfaction Index
(ACSI) methodology, adapted for the financial services market and based on a combination of questions related to overall satisfaction, customer delight and ideal provider. This score is not weighted by market.
(4) ING engagement index is the percentage of ING employees that have indicated that they are proud to work for ING. The research is done by Kenexa (April 2008).
For more information in the area of CR, see www.ing.com/cr.
AMSTERDAM, 16 MARCh 2009
ThE EXECUTIVE BOARD
If the environmental and social performance associated with the transaction is reasonable but needs improvement, conditional advice is given. If a transaction is not in line with the specific policies, ING will withdraw from it.
Employee engagementOur employees are key to the company’s success. The ING Business Principles form the basis for their behaviour and guide their conduct towards customers as well as among each other. In 2008, we continued to focus strongly on embedding responsible behaviour in our employees’ day-to-day activities. That is why corporate responsibility became an even more important element of the general staff education programmes and our leadership development curriculum in 2008. We also engage employees in sustainability by involving them in community development programmes, such as ING Chances for Children and initiatives promoting a cleaner environment.
Over the last two years, our employees have become much more attuned to environmental issues such as climate change, deforestation and the protection of endangered species. The ‘Orange Goes Green’ programme was a response to this development and invites employees around the world to start up local initiatives and get involved in the preservation and promotion of a cleaner environment. In eight countries, ING volunteers planted trees in 2008 as part of the ‘Orange Goes Green’ campaign.
CONCLUSIONS AND AMBITIONSING will continue its focus on the main strategic priorities based both on our business principles and dialogue with our stakeholders. We believe financial education will become increasingly important. Moreover, we will continue to monitor, track and improve our performance in the area of sustainability on the basis of our Key Performance Indicators (KPIs). We believe all these initiatives contribute to building our clients’ and investors’ confidence in ING.

ING Group Annual Report 2008
52
Report of the Supervisory Board
In 2008 the Supervisory Board and the Executive Board met through regular and additional meetings. Many important issues were discussed, with strategy and the financial crisis high on the agenda due to the unprecedented circumstances. Committees of the Supervisory Board discussed a range of subjects on which the Supervisory Board received advice, the main ones being the quarterly results, the financial crisis, the external auditors tender, IT, corporate governance and human resources.
GeneralThe Supervisory Board met thirteen times in 2008 of which six meetings were scheduled. Most of the ad-hoc meetings focused on the development of the financial markets crisis and the implications for ING. The unique unprecedented market circumstances required intensive interaction between the Supervisory Board and the Executive Board to support the necessary actions initiated by management to weather the crisis. Attendance in the scheduled meetings was high: only three Supervisory Board members were absent once. Due to the fact that the ad hoc meetings were called at very short notice, attendance in these meetings was somewhat lower: on average, about 75% of the Supervisory Board members were present. The Audit Committee had six meetings, while the Remuneration and Nomination Committee met five times and the Corporate Governance Committee met twice. One Audit Committee member was absent once at the Audit Committee meetings. Three members were absent once at the Remuneration and Nomination as well as at the Corporate Governance Committee meetings.
Supervisory Board meetings While the execution of the strategy was an important subject in the first half of 2008, the implications of the financial crisis for ING were the main topic on the agenda of the Supervisory Board meetings in the second half of 2008.
2008 started off with a Supervisory Board Knowledge Day in January, a full day of presentations and discussions around several important ING subjects. The Supervisory Board members discussed the ING Direct strategy going forward and an extensive presentation was given on the business opportunities in Asia. The market developments regarding the financial crisis and liquidity management at ING were also discussed at the Knowledge Day.
In January 2008, the Supervisory Board also held its annual full-day meeting on ING’s strategy and medium-term plan, including the related risks. The medium-term plan addresses the plans and the financial targets for each of the business lines, and for the Group as a whole. The Supervisory Board discussed and approved the medium-term plan and ING’s strategic direction. In this meeting the feedback of investors on ING over the year 2007 was also discussed.
In February 2008, the 2007 annual figures were discussed, including the related reports from the internal and external auditors and the assessment of the Executive Board of the adequacy and effectiveness of the risk management and control systems of ING as well as the significant changes made thereto. In this meeting the draft agenda of the annual General Meeting as well as the proposed final 2007 dividend were also discussed and approved.
The quarterly figures of the first three quarters 2008 were discussed in May, August and November respectively. The results of the first two quarters declined compared to the same period in 2007, but the direct impact from the financial markets crisis on ING was still limited. At the end of the third quarter, after the collapse of Lehman Brothers, financial market circumstances deteriorated sharply. Several financial institutions became distressed, one of which was Fortis. After careful consideration with the Supervisory
1.3 Our Governance

ING Group Annual Report 2008
53
Board, ING decided not to make an offer to acquire ABN AMRO Netherlands from Fortis.
Following the facility of the Dutch government to make capital available to financial enterprises that are fundamentally sound and viable, the Supervisory Board approved the agreement with the Dutch government to strengthen the capital position of ING with EUR 10 billion at the end of October, creating a buffer to navigate through the severe financial market and economic environment that had emerged. In connection with this transaction, the Dutch government was granted the right to recommend two candidates for appointment to the Supervisory Board. The Dutch government announced that it recommended Peter Elverding, already a Supervisory Board member, and Lodewijk de Waal for appointment to the Supervisory Board. Lodewijk de Waal has been nominated as a Supervisory Board member for appointment by the annual General Meeting in April 2009. Until his appointment, Mr. de Waal will participate as an observer in the Supervisory Board meetings.
In the fourth quarter, the earnings became more and more affected through impairments on pressurised asset classes, negative revaluations and write-offs. This resulted in a first-time negative net result for the fourth quarter of 2008. The Supervisory Board met in a number of additional meetings to discuss various measures to mitigate the effects of the financial crisis on the results of ING. It was decided to take measures aimed at reducing the risks and expenses of ING, and to increase the capital position and ratios as international market expectations of capital levels had changed dramatically.
At the end of January 2009, the Supervisory Board extensively discussed and finally approved an agreement between ING and the Dutch government on an Illiquid Assets Back-up Facility covering 80% of ING’s Alt-A residential mortgage-backed securities. This transaction significantly reduced the uncertainty regarding the impact on ING of any future losses in the portfolio. In connection with this agreement, the government-recommended members of the ING Supervisory Board will have approval rights regarding the CEO appointment. Furthermore several other measures to reduce risk and costs were approved by the Supervisory Board. ING aims to close this transaction in the first quarter of 2009, but is dependent on the approval of various regulators.
The progress of the integration of ING Bank in the Netherlands and Postbank was discussed by the Supervisory Board in February, May and November 2008. The Supervisory Board extensively discussed the timelines, the dismantling of Postkantoren BV, the integration of the IT systems, the migration of customers to the new bank and possible implications of the financial crisis for the project. In February 2008, the management of Wholesale Banking gave a presentation on structured finance products and in May the annual General Meeting was evaluated.
The Supervisory Board visited some of the ING operations in the US at the end of May. In August, a strategic framework for the business opportunities for ING in Asia was presented and discussed, and the delisting of ING shares from the stock exchanges in Frankfurt, Paris and Switzerland was approved by the Supervisory Board. The annual update of the ING Regulation on Financial Instruments was approved in the November meeting.
During the regular internal meetings of the Supervisory Board, potential Supervisory Board candidates and the membership of the various Supervisory Board committees was discussed in light of the appointment of Mr. Hommen as the chairman of the Supervisory Board as of 1 January 2008. The peer group selection for assessing Executive Board remuneration and the remuneration proposals for the Executive Board were also reviewed. At the internal meeting of the Supervisory Board in November, the functioning of the Supervisory Board, its committees and its individual members and the conclusions to be drawn there from were discussed. This was done in the light of the Supervisory Board Profile and the composition of the Supervisory Board. Furthermore, the functioning of the Executive Board and the performance of the individual Executive Board members were discussed.
audit Committee meetingsIn 2008, the Audit Committee met five times to discuss the annual and quarterly results and the Annual Report on Form 20-F. In an additional meeting the effects of the financial crisis on ING were reviewed.
Other important subjects in 2008 were: the evaluation of the acquisition of the TMB, variable annuity products and IT. Other topics discussed in the meetings were risk, governance, capital management and regulatory matters. The volatility of the results in Japan was frequently discussed during the Audit Committee meetings.
remuneration and nomination Committee meetingsIn January 2008, four Supervisory candidates were nominated for appointment by the 2008 annual General Meeting. The Remuneration and Nomination Committee also discussed the future composition of the Supervisory Board and its committees.
In February 2008, the 2007 performance of the Executive Board members was discussed on the basis of the group performance criteria and the individual targets. The Executive Board compensation structure for 2008 was also discussed as well as the adjustment of the compensation and performance peer group towards a European financial industry peer group consisting of 14 financial sector companies. In an additional meeting the succession of the CFO was discussed as well as the proposal to split the Remuneration and Nomination Committee into two separate committees to comply with the Tabaksblat Code.
Corporate Governance Committee meetingsThe Corporate Governance Committee discussed the agenda for the 2008 annual General Meeting, which included the appointment of Ernst & Young as the auditor for ING Group, ING Bank and ING Insurance. The Committee discussed the position of the ING Trust Office.

ING Group Annual Report 2008
1.3 Our Governance
54
CompoSition of the exeCutive BoardThe 2008 annual General Meeting reappointed Eric Boyer de la Giroday and Eli Leenaars for a new four-year term. John Hele, the chief financial officer announced his resignation as an Executive Board member for family reasons as of 31 March 2009. On 26 January 2009, Michel Tilmant stepped down from the Executive Board to take effect at once. Michel Tilmant will be an adviser to the company until his retirement from ING on 1 August 2009. The Supervisory Board decided that Jan Hommen will be appointed as CEO of ING Group, upon his appointment as a member of the Executive Board by the annual General Meeting in April 2009. Eric Boyer, member of the Executive Board since 2004, will be acting CEO until Jan Hommen can formally take over after the General Meeting. During that meeting Patrick Flynn will be proposed as the successor to John Hele as CFO of ING Group. Further information on the members of the Executive Board is provided on pages 61-62.
retirement of eric Bourdais de Charbonnière Eric Bourdais de Charbonnière joined the Supervisory Board in 2004. He became vice-chairman of the Supervisory Board in February 2005. His inspiring vision combined with his vast international experience made his input in the meeting very valuable. We are very grateful for his contribution through the years.
CompoSition of the SuperviSory BoardCor Herkströter retired as member and chairman of the Supervisory Board per 1 January 2008. Jan Hommen succeeded Cor Herkströter as chairman of the Supervisory Board and Wim Kok succeeded Jan Hommen as chairman of the Audit Committee, both as of 1 January 2008. For this reason Wim Kok did not retire in 2008. Luella Gross Goldberg retired after the 2008 annual General Meeting having stayed on one year longer.
Harish Manwani, Aman Mehta, Joan Spero and Jackson Tai were appointed as new members of the Supervisory Board at the 2008 annual General Meeting. Jan Hommen succeeded Cor Herkströter as chairman of the Remuneration and Nomination Committee and the Corporate Governance Committee. Harish Manwani and Aman Mehta each became a member of the Corporate Governance Committee. Joan Spero became a member of the Remuneration and Nomination Committee. Jackson Tai became a member of the Audit Committee, together with Piet Hoogendoorn. Claus Hoffmann stepped down from the Audit Committee and joined the Corporate Governance Committee. Lodewijk de Waal participated in the Remuneration and Nomination Committee and the Corporate Governance Committee as an observer as of November 2008 onwards.
Following the envisaged appointment of Jan Hommen as the CEO of ING Group, the Supervisory Board decided to appoint Peter Elverding as successor to Jan Hommen as chairman of the Supervisory Board effective after the annual General Meeting in April 2009. In light of this appointment, the Dutch State has recommended Tineke Bahlmann as a member for the Supervisory Board. Eric Bourdais de Charbonnière and Wim Kok will retire from the Supervisory Board after the 2009 annual General Meeting.
retirement of Wim Kok Wim Kok was appointed as a member of the Supervisory Board in 2003. He contributed substantially to the Audit Committee and in 2008 he was asked to stay on for one year longer to succeed Jan Hommen as the chairman of the Audit Committee.
With his background, Wim Kok had good insights into Dutch politics, and was also of great value for discussions about financial issues both nationally and internationally. The members of the Supervisory Board and the Executive Board valued his opinion in the decision-making process and would like to thank him for his strong personal contribution.
The Supervisory Board has nominated three candidates for appointment: Tineke Bahlmann, Jeroen van der Veer and Lodewijk de Waal. For the proposed appointments approval has been obtained from DNB (the Dutch central bank).
Information on the members of the Supervisory Board and the nominated members is provided on page 64-65.
Currently, only one Supervisory Board member, Piet Hoogendoorn qualifies as ‘non-independent’ as defined in best-practice provision III.2.1 of the Dutch Corporate Governance Code. Mr. Hoogendoorn is considered to be not independent, because of his position with Deloitte Touche Tohmatsu until 1 June 2007, taking into account the important relationship between Deloitte Touche Thomatsu and ING.
annual aCCountS and dividendThe Executive Board has prepared the annual accounts and discussed these with the Supervisory Board. The annual accounts will be submitted for adoption to the 2009 General Meeting as part of the Annual Report. The interim dividend for 2008 was EUR 0.74 per (depositary receipt for an) ordinary share which was paid in August 2008. ING has announced that it will not pay a final dividend in May 2009 over the year 2008.
appreCiation for the exeCutive Board and the inG employeeSThe Supervisory Board would like to thank the Executive Board members for the very hard work done in the extremely challenging circumstances on the financial markets. The Supervisory Board would also like to express its appreciation to the 125,000 employees of ING who each serve the interests of the customers, the shareholders and other stakeholders of ING.
additional informationFor additional information, reference is made to the section on corporate governance (pages 55-66) and the Remuneration Report (pages 73-82), which are deemed to be incorporated by reference here.
amSterdam, 16 marCh 2009
the SuperviSory Board
Report of the Supervisory Board (continued)
ING Group Annual Report 2008
55
Corporate governance
This section discusses the application by ING Groep N.V. (‘ING Group’) of the Dutch Corporate Governance Code and provides information on capital and control, the Executive Board, the Supervisory Board and the external auditors. This section also serves as the ‘corporate governance statement’ referred to in article 46a of Directive 78/660/EEC.
RECENT DEVELOPMENTSLegislative and regulatory developmentsIn December 2008, the Monitoring Committee of the Dutch Corporate Governance Code (the ‘Frijns Committee’) published an updated version of the Dutch Corporate Governance Code (‘Tabaksblat Code’ or ‘Code’), the draft of which was distributed for consultation in June 2008. The revised Code became effective on 1 January 2009.
ING Group is now considering the revised Code and to what extent it can be implemented. As recommended by the Frijns Committee, the implementation of the revised Code will be discussed at the 2010 General Meeting as a separate agenda item.
In 2008, several changes of EU origin relating to listed company disclosure and transparency were proposed to be implemented in Dutch law. These especially affect annual and interim financial reporting, a mandatory corporate governance statement in the annual report and – for public interest entities – the introduction of a mandatory audit committee. Subsidiaries of a public interest entity which complies with the mandatory audit committee requirement are exempt. ING Group, ING Bank N.V, and ING Verzekeringen N.V. have an audit committee, whereas the other ING Group subsidiaries in the Netherlands make use of this exemption.
Furthermore, also as a result of EU legislation, the rules on the maintenance and alteration of capital of public limited liability companies were amended. The amended rules, among others things, facilitate the issue of shares against contribution in kind, the repurchase of shares, and the provision of financial support for the acquisition of a company’s own stock by third parties.
A legislative proposal to implement the EU Shareholder Rights Directive was submitted to the Dutch Parliament in November 2008. It primarily addresses matters of logistics in the build-up to a general meeting, such as the disclosure and distribution of the meeting materials, the record date, shareholders’ proposals and the asking of questions.
Following a consultation procedure, a legislative proposal was submitted to the Dutch Parliament in November 2008 to facilitate the introduction of the one-tier board into Dutch company law. The proposal will clarify the rules on the division of tasks in a board of directors. This proposal also includes a revised version of the conflict of interest rules and will abolish the required second candidate within the context of a binding nomination, recommended by the Tabaksblat Committee in 2003.
Finally, as a result of a change in Dutch law, the term ‘general meeting of shareholders’ in the Dutch Civil Code was changed to ‘general meeting’. For the time being ING Group is not planning to change its Articles of Association to incorporate the new term, though the term is used in this Annual Report.
Transactions with the Dutch StateOn 12 November 2008, ING Group issued 1 billion core Tier-1 securities (‘Securities’) to the Dutch State against payment of EUR 10 per Security resulting in an increase of ING Group’s core Tier-1 capital of EUR 10 billion. The Securities do not form part of ING Group’s share capital; accordingly they do not carry voting

ING Group Annual Report 2008
1.3 Our Governance
56
rights in the General Meeting. The financial entitlements of the Securities are described in the Annual Accounts on page 122.
On 26 January 2009, ING Group reached an agreement with the Dutch State regarding an Illiquid Assets Back-up Facility covering 80% of ING’s Alt-A residential mortgage-backed securities (‘Back-up Facility’) and on 30 January 2009, its subsidiary ING Bank N.V. announced that it had issued under the Credit Guarantee Scheme of the Dutch government USD 6 billion three-year government guaranteed senior unsecured bonds (‘Bonds’).
In the framework of these transactions, certain arrangements with respect to corporate governance and executive remuneration were agreed with the Dutch State which will remain in place as long as the Dutch State owns at least 250 million Securities, as long as the Back-up Facility continues or any of the Bonds is outstanding. These arrangements entail that:
the Dutch State may recommend two candidates (‘State •Nominees’) for appointment to the Supervisory Board. Certain decisions of the Supervisory Board require approval of the State Nominees (these decisions are specified in the section ‘Supervisory Board’ below); ING Group will develop a sustainable remuneration policy for the •Executive Board and Senior Management that is aligned to new international standards and submit this to its General Meeting for adoption. This remuneration policy shall include incentive schemes which are linked to long-term value creation, thereby taking account of risk and restricting the potential for ‘rewards for failure’. The new remuneration policy will among others include objectives relating to corporate and social responsibility; members of the ING Executive Board will not receive any •performance-related payment – either in cash, options, shares or depositary receipts – for 2008, 2009 and subsequent years until the adoption of the new remuneration policy mentioned above; severance payments to Executive Board member will be limited •to a maximum of one year’s fixed salary, in line with the Tabaksblat Code.
For more information on the State Nominees, reference is made to the section on the Supervisory Board; for more information on the other arrangements, reference is made to the Remuneration report, starting on page 73.
Shareholder participation and position of the Trust OfficeAs announced earlier, the Executive Board and the Supervisory Board intend to reconsider the position of the Stichting ING Aandelen (the ‘Trust Office’) and depositary receipts once the number of votes on ordinary shares and depositary receipts of ordinary shares, including proxies and excluding the votes which are at the discretion of the Trust Office at a General Meeting is at least 35% of the total votes that may be cast for three consecutive years.
In 2006, the percentage of votes thus cast amounted to 28% of total votes, which increased to 37.6% in 2007 and to well over 38% in 2008. Assuming that the 35% threshold will be exceeded again in the 2009 annual General Meeting, the Executive Board and the Supervisory Board will discuss the position of the Trust Ofiice at that General Meeting. The Executive Board is committed to encouraging depositary-receipt holders, particularly institutional investors, to participate in voting at the General Meeting.
Elimination of preference A shares and preference B sharesIn 2008 all remaining preference A shares were eliminated. Such shares were cancelled either following the repurchase of the depositary receipts of the A shares, or through redemption. Subsequently, the preference A shares and the preference B shares were removed from ING Group’s Articles of Association. As a result, all outstanding ING Group shares have voting rights proportional to their economic value as recommended under section IV.1.2 of the Dutch Corporate Governance Code.
Separate Remuneration Committee and Nomination CommitteeOn 1 January 2009, the Remuneration and Nomination Committee of the Supervisory Board was split into a separate Remuneration Committee and a separate Nomination Committee. As recommended under section III.5.11 of the Tabaksblat Code, the Remuneration Committee will not be chaired by the chairman of the Supervisory Board.
CORPORATE GOVERNANCE CODESIn compliance with the Dutch Corporate Governance CodeIn its corporate governance structure and practices, ING Group uses the Tabaksblat Code of 2003 as reference. The Code can be downloaded on the website of the Frijns Committee (1). The ING Group corporate governance structure described in the document ‘The Dutch Corporate Governance Code – ING’s implementation of the Tabaksblat Code for good corporate governance’ was approved by the General Meeting on 26 April 2005. As a result, ING Group is considered to be in full compliance with the Tabaksblat Code, although it does not apply all best-practice provisions of the Code in full. The document is available on the website of ING Group (www.ing.com).
The following deviations from the Tabaksblat Code are to be reported for 2008:
best-practice provision II.1.1: Michel Tilmant, being appointed •as an Executive Board member before 1 January 2004, was appointed for an indefinite period of time. He stepped down from the Executive Board effective 26 January 2009; best-practice provision II.2.3: Executive Board members may sell •shares awarded to them without financial consideration within the five-year retention period in order to cover the wage tax which is to be withheld over the vested award, so as to avoid the total wage tax being withheld in the month of vesting exceeding the gross salary payment of that month; best-practice provisions II.2.3, II.2.10 and II.2.11: although ING •Group’s policy is to disclose the performance criteria for variable remuneration only to the extent that this information is not share price sensitive or competition-sensitive, this is not relevant for 2008 as no variable remuneration will be paid to Executive Board members with respect to performance in 2008; best-practice provisions II.2.8, II.3.2 and II.3.3: Executive Board •members may obtain banking and insurance services from ING Group subsidiaries in the ordinary course of their business and on terms that apply to all employees. These may include services in which the granting of credit is of a subordinate nature, e.g. credit cards and overdrafts in current accounts. These exceptions are based on a lack of materiality; best-practice provision III.2.2: if a Supervisory Board member •does not meet the independence criteria of the Code, the
(1) http://www.commissiecorporategovernance.nl/Corporate_Governance_Code
Corporate governance (continued)

ING Group Annual Report 2008
57
Supervisory Board may still decide to consider such member to be independent in order to take into account specific circumstances, such as family and employment relations, so as to allow for situations of non-independence that are not material; best-practice provisions III.2.2 and II.3.1: the legally required •second candidate on a binding nomination for appointment to the Supervisory Board does not need to meet the independence criteria of the Tabaksblat Code nor the requirements of the Supervisory Board profile, in view of the contemplated abolition of this legal requirement; best-practice provision III.3.4: Jan Hommen, who was appointed •in the 2005 annual General Meeting as a Supervisory Board member, has more than five positions as a supervisory board member with other Dutch-listed companies. This was approved by the Supervisory Board in view of Jan Hommen’s intention to give up his chairmanship of the Supervisory Board of TNT N.V. With a view to his proposed appointment to the Executive Board at the 2009 General Meeting, Jan Hommen will step down from his positions as a Supervisory Board member of Reed Elsevier N.V. and TNT N.V. by April 2009. He will also step down from his position as a Supervisory Board member of Koninklijke FrieslandCampina N.V. (non-listed); best-practice provision III.3.5: under special circumstances the •Supervisory Board may deviate from the general rule that a member of the Supervisory Board may not be reappointed for more than two subsequent four-year terms; best-practice provision III.5.1: instead of a separate remuneration •committee and a nomination committee, ING Group established a combined Remuneration and Nomination Committee; this committee however, was separated into a Nomination Committee and a Remuneration Committee on 1 January 2009; best-practice provision III.5.11: the Remuneration and •Nomination Committee was chaired by the chairman of the Supervisory Board. On 1 January 2009, the new separate Remuneration Committee will no longer be chaired by the chairman of the Supervisory Board; best-practice provision III.6.1: in the case of a transaction with •a family member that entails a conflict of interests according to the Code, the Supervisory Board may decide that no conflict of interests exists if the relationship is based on a marriage that is now over, to allow for situations where the family relationship no longer exists; best-practice provisions III.6.3 and III.6.4: transactions with •Supervisory Board members or persons holding at least 10% of the shares of ING Group in which there are significant conflicting interests will be published in the Annual Report, unless (i) this conflicts with the law, (ii) the confidential, share-price sensitive or competition-sensitive character of the transaction prevents this and/or (iii) the information is so competition-sensitive that the publication could damage the competitive position of ING Group; best-practice provision III.7.4: Supervisory Board members •may obtain banking and insurance services from ING Group subsidiaries in the ordinary course of their business and on terms that are customary in the sector. These may include services in which the granting of credit is of a subordinate nature, e.g. credit cards and overdrafts in current accounts. These exceptions are based on a lack of materiality; best-practice provision IV.3.8: if a notarial report is drawn up of •the General Meeting, shareholders will not have the opportunity to react to the minutes of the meeting, as this would be in conflict with the laws applicable to such notarial report.
Deviations from the Tabaksblat Code by the Trust Office are reported in the Trust Office’s own report (see page 67).
Differences between Dutch and US corporate governance practicesIn conformity with recent regulation from the US Securities and Exchange Commission, ING Group as a foreign private issuer, whose securities are listed on the New York Stock Exchange (‘NYSE’) must disclose in its Annual Report on Form 20-F any significant ways in which its corporate governance practices differ from those applicable to US domestic companies under the NYSE listing standards.
ING Group believes the following to be the significant differences between its corporate governance practices and NYSE corporate governance rules applicable to US companies:
ING Group has a two-tier board structure, in contrast to the •one-tier board structure used by most US companies. In the Netherlands, a Naamloze Vennootschap (public limited liability company) has an Executive Board as its management body and a Supervisory Board which advises and supervises the Executive Board. In general, Executive Board members are employees of the company while members of the Supervisory Board are often former state or business leaders and sometimes former members of the Executive Board. Members of the Executive Board and other officers and employees cannot simultaneously be a member of the Supervisory Board. The Supervisory Board must approve specified decisions of the Executive Board. Under the Tabaksblat Code, all members of the Supervisory Board with the exception of not more than one person, must be independent. The present members of ING Group’s Supervisory Board with the exception of one member, are independent within the meaning of the Tabaksblat Code. The definitions of independence under the Tabaksblat Code, however, differ in their details from the definitions of independence under the NYSE listing standards. In some cases the Dutch requirements are stricter and in other cases the NYSE listing standards are the stricter of the two. The Audit Committee, Corporate Governance Committee and Remuneration and Nomination Committee of ING Group are comprised of members of the Supervisory Board. In contrast to the Sarbanes-Oxley Act of 2002, the Tabaksblat •Code contains an ‘apply-or-explain’ principle, offering the possibility to deviate from the Code as long as any such deviations are explained. To the extent that such deviations are approved by the general meeting, the company is deemed to be in full compliance with the Code. Dutch law requires that the company’s external auditors •be appointed at the general meeting and not by the Audit Committee. The ING Group’s Articles of Association provide that there are •no quorum requirements to hold a General Meeting, although certain shareholder actions and certain resolutions may require a quorum. The shareholder approval requirements for equity compensation •plans under Dutch law and the Tabaksblat Code differ from those applicable to US companies which are subject to the NYSE’s listing standards. Under Dutch company law and the Tabaksblat Code, shareholder approval is only required for equity compensation plans (or changes thereto) for members of the Executive Board and Supervisory Board, and not for equity compensation plans for other groups of employees.

ING Group Annual Report 2008
1.3 Our Governance
58
CAPITAL AND SHARESCapital structure, sharesThe authorised capital of ING Group consists of ordinary shares and cumulative preference shares. Currently, only ordinary shares are issued, while a right to acquire cumulative preference shares has been granted to the ING Continuity Foundation (Stichting Continuïteit ING). The acquisition of cumulative preference shares pursuant to the call option is subject to the restriction that, immediately after the issue of cumulative preference shares, the total amount of cumulative preference shares outstanding may not exceed one-third of the total issued share capital of ING Group (see page 69). The purpose of the cumulative preference shares is to protect the independence, the continuity and the identity of ING Group against influences which are contrary to the interests of ING Group, its enterprise and the enterprises of its subsidiaries and all stakeholders (including hostile takeovers). The ordinary shares are used solely for funding purposes. The shares, which are all registered shares, are not listed on a stock exchange.
Depositary receiptsOver 99% of the issued ordinary shares are held by the Trust Office. The Trust Office issues bearer depositary receipts in exchange for these shares. The depositary receipts are listed on certain stock exchanges (see page 8 for an overview of the listings). The depositary receipts can be exchanged, without any restrictions, for the underlying shares. An administrative fee may be charged for this.
The board of the Trust Office comprises five members who are independent of ING Group. No ING Group employees or Supervisory Board members are on the board of the Trust Office. The board of the Trust Office appoints its own members, without any requirement for approval by ING Group.
The board of the Trust Office reports on its activities through an Annual Report, which has been included on pages 67-68.
Issue of sharesING Group’s authorised capital is the maximum amount of capital allowed to be issued under the terms of its Articles of Association. New shares in excess of this amount can only be issued if the Articles of Association are amended. An amendment has to be passed by notarial deed, and this in turn requires a declaration of no objection to be issued by the Minister of Justice. For reasons of flexibility, the authorised capital in the Articles of Association of ING Group has been set at the highest level permitted by law.
Share issues are to be decided by the General Meeting, which may also delegate its authority. Each year, the General Meeting is asked to delegate authority to the Executive Board to issue new ordinary shares or to grant rights to take up new ordinary shares, both with and without a right of first refusal for existing shareholders.
The powers delegated to the Executive Board are limited:in time: powers are delegated for a period of 18 months;• by number: ordinary shares may be issued up to a maximum •of 10% of the issued capital, or 20% in the event of a merger or takeover; and in terms of control: resolutions by the Executive Board to issue •shares require the approval of the Supervisory Board.
Approval by the General Meeting would be required for any share issues exceeding these limits.
Transfer of shares and depositary receipts and transfer restrictionsShares are transferred by means of a deed of transfer between the transferor and the transferee. To become effective, ING Group has to acknowledge the transfer, unless ING Group itself is a party to the transfer. Pursuant to the Articles of Association, there are no restrictions for the transfer of ordinary shares, whereas transfer of cumulative preference shares is subject to prior approval of the Executive Board.
There are no restrictions for the transfer of depositary receipts pursuant to the Articles of Association or the conditions of administration. ING Group is not aware of the existence of any agreement under which transfer of ordinary shares or depositary receipts is restricted.
Repurchase of sharesING Group may repurchase shares outstanding and depositary receipts for such shares. Although the power to repurchase shares and depositary receipts is vested in the Executive Board subject to Supervisory Board approval, prior authorisation from the General Meeting is required for these repurchases. Under Dutch law, this authorisation lapses after 18 months. Each year, the General Meeting is asked to approve the Executive Board’s authority to repurchase shares.
When repurchasing shares the Executive Board is to observe the price ranges prescribed in the authorisation. For the ordinary shares and depositary receipts, the authorisation currently in force stipulates a minimum price of one eurocent and a maximum price equal to the highest stock price on the Euronext Amsterdam by NYSE Euronext on the date of the repurchase contract or the preceding day on which this stock market is open.
For the preference A shares (currently no longer in existence) the authorisation applicable for 2008 provided for a minimum price of one eurocent and a maximum price equal to 130% of the amount, including share premium, that was paid on such a share, or 130% of the highest stock price on the Euronext Amsterdam by NYSE Euronext either on the date on which an offer for the preference A shares was made or on the date of the purchase contract or the preceding day on which this stock market was open.
Special rights of controlNo special rights of control referred to in Article 10 of the EU Directive on takeover bids are attached to any share.
Shareholders’ structureDetails of investors who have reported their interest in ING Group pursuant to the Dutch Financial Supervision Act (or the predecessor of this legislation) are shown on page 9. ING Group is not aware of investors with an interest of 10% or more in ING Group.
Corporate governance (continued)

ING Group Annual Report 2008
59
GENERAL MEETINGFrequency, notice and agenda of General MeetingsGeneral Meetings are normally held each year in April or May, to discuss the course of business in the preceding financial year on the basis of the reports prepared by the Executive Board and the Supervisory Board, and to decide on the distribution of dividends or other distributions, the appointment and/or reappointment of members of the Executive Board and Supervisory Board (if any), other items requiring shareholder approval under Dutch law, and any other matters proposed by the Supervisory Board, the Executive Board or shareholders or holders of depositary receipts in accordance with ING Group’s Articles of Association.
Meetings are convened by public notice. As of the date of convening a General Meeting, all information relevant for shareholders and holders of depositary receipts, is made available to them on ING Group’s website (www.ing.com) and at ING Group’s head office, mentioned in the notice.
This information includes the notice to the General Meeting, the agenda, the verbatim text of the proposals with an explanation and instructions on how to participate in the meeting (either in person or by proxy vote), as well as the reports of the Executive Board and the Supervisory Board. More complex proposals such as amendments to ING Group’s Articles of Association normally are not included in the notice but are made available separately on ING Group’s website and at ING Group’s head office.
Proposals by shareholders/holders of depositary receiptsProposals to include items on the agenda for a General Meeting can be made by shareholders and holders of depositary receipts representing a joint total of 0.1% of the share capital or representing together, on the basis of the stock prices on the Euronext Amsterdam by NYSE Euronext, a share value of at least EUR 50 million. Given the period of notice required for proxy voting, proposals have to be submitted in writing at least 50 days before the date of the meeting. Properly submitted proposals will be included on the agenda for the General Meeting.
Dialogue with shareholdersIn 2008, investors were allowed to ask questions about items on the agenda for the annual General Meeting, and they will be allowed to do so in 2009. Shareholders and holders of depositary receipts can visit the website of ING Group (www.ing.com) to submit their questions and they will be answered on the same website.
Record dateIt is standard practice with ING Group to set a record date for attending a General Meeting and voting on the proposals in that General Meeting. Shareholders and depositary receipt holders who hold shares and/or depositary receipts at the record date are entitled to attend the General Meeting and to exercise other rights related to the General Meeting in question on the basis of their holding at the record date, notwithstanding a subsequent sale or purchase of shares or depositary receipts. The record date is published in the notice to the General Meeting.
Attending General MeetingsFor logistical reasons, attendance at a General Meeting by shareholders and depositary receipt holders, either in person or by proxy, is subject to the requirement that ING Group be notified in advance. Instructions to that effect are included in the notice to the General Meeting.
Shareholders and depositary receipt holders who do not attend the General Meeting, may nevertheless follow the course of affairs in the meeting by internet webcast.
Voting rights on sharesEach share entitles the holder to cast one vote at the General Meeting. Articles of Association do not restrict the voting rights on any class of shares of ING Group. ING Group is not aware of any contract under which voting rights on any class of its shares are restricted.
Voting on depositary receiptsAlthough the depositary receipts do not formally have any voting rights, holders of depositary receipts, in practice, rank equally with shareholders with regard to voting. The Trust Office will, subject to certain restrictions, grant a proxy to a holder of depositary receipts for ordinary shares to the effect that such holder may, in the name of the Trust Office, exercise the voting rights attached to the number of its shares that corresponds to the number of depositary receipts held by such holder of depositary receipts.
Holders of depositary receipts may vote as they see fit. Holders of depositary receipts not attending a meeting can also issue binding voting instructions to the Trust Office. The Trust Office has made it easier for votes to be cast in this way by putting arrangements in place for proxy voting and E-voting. The restrictions under which the Trust Office will grant a voting proxy to holders of bearer receipts are:
the relevant holder of depositary receipts must have announced •his or her intention to attend the General Meeting observing the provisions laid down in the Articles of Association of ING Group; the relevant holder of depositary receipts may delegate the •powers conferred upon him or her by means of the voting proxy, provided that the relevant holder of depositary receipts has announced his or her intention to do so to the Trust Office observing a term before the commencement of the General Meeting, which term will be determined by the Trust Office.
The Trust Office has discretion to vote in respect of shares for which it has not issued proxy votes to holders of depositary receipts and has not received any voting instructions. Under its conditions of Administration, the Trust Office is required to promote the interests of all holders of depositary receipts, irrespective of whether they attend the General Meeting, also taking into account the interests of ING Group, the businesses of ING Group and its group companies and all other ING Group stakeholders in voting such shares, to ensure that all these interests are given as much consideration and protection as possible.
The depositary receipts and the Trust Office structure outlined above would prevent a small minority, which coincidentally may form the majority in the meeting, from taking decisions purely to suit themselves in the absence of other parties at the General Meeting.

ING Group Annual Report 2008
1.3 Our Governance
60
Proxy voting facilitiesING Group is a member of the Stichting Communicatiekanaal Aandeelhouders, through which participating depositary receipt holders can give voting instructions to the Trust Office. ING Group provides a similar proxy voting facility to international institutional investors. In addition, ING Group solicits proxies from its American Depositary Receipt (‘ADR’) holders in line with common practice in the United States.
Voting proxy forms for shareholders and voting instruction forms for depositary receipt holders who do not participate in the Stichting Communicatiekanaal Aandeelhouders are made available on ING Group’s website. The submission of these forms is subject to additional conditions which are specified in the forms themselves.
Main powers of the General MeetingThe main powers of the General Meeting are to decide on:
the appointment, suspension and dismissal of members of the •Executive Board and of the Supervisory Board, subject to a binding nomination or a proposal of the Supervisory Board;the adoption of the annual accounts;• the declaration of dividends, subject to the power of the •Executive Board to make – with approval of the Supervisory Board – reservations, and the declaration of other distributions, subject to a proposal by the Executive Board which was approved by the Supervisory Board;the appointment of the external auditor;• an amendment of the Articles of Association, a legal merger •or division of ING Group, and to dissolve or liquidate ING Group, all subject to a proposal by the Executive Board which was approved by the Supervisory Board; the issue of shares or rights to shares, the restriction or exclusion •of pre-emptive rights of shareholders, and to delegate these powers to the Executive Board, subject to a proposal by the Executive Board which was approved by the Supervisory Board, and to authorise the repurchase of outstanding shares and to •cancel shares.
Moreover, the approval of the General Meeting is required for Executive Board decisions that are so far-reaching that they would greatly change the identity or nature of ING Group or its enterprise. This includes resolutions to transfer or assign otherwise all or virtually all of the enterprise of ING Group or its subsidiaries as a consequence of which ING Group or the group over which ING Group exercises central control ceases to engage in either insurance or banking activities.
ReportingResolutions adopted at a General Meeting shall also be published on ING Group’s website within one week after the meeting. The draft minutes of the General Meeting are made available to shareholders on ING Group’s website (www.ing.com) no later than three months after the meeting. Shareholders and depositary receipt holder may react to the draft minutes in the following three months, after which the final minutes will be adopted by the chairman of the meeting in question and by a shareholder or depositary receipt holder appointed by that meeting. The final minutes are made available on ING Groups’ website (www.ing.com).
EXECUTIVE BOARDAppointment and dismissalMembers of the Executive Board are appointed by the General Meeting from a binding list to be drawn up by the Supervisory Board. This list shall mention at least two candidates for each vacancy and if not, the list will be non-binding. The General Meeting may declare the list non-binding by a majority resolution supported by at least one-third of the issued share capital.
Candidates for appointment to the Executive Board must comply with the expertise and reliability requirements set out in the Wet financieel toezicht (Dutch Financial Supervision Act). Members of the Executive Board may be suspended or dismissed at any time by a majority resolution at the General Meeting. A resolution to suspend or dismiss members of the Executive Board that has not been introduced by the Supervisory Board needs the support of at least one-third of the issued capital.
Function of the Executive BoardThe Executive Board is responsible for the management of the company, which includes the responsibility for achieving the company’s aims and for the company’s results, as well as for determining the company’s strategy and policy. It also includes the day-to-day management of the company and its business lines (Insurance Europe, Insurance Americas, Insurance Asia/Pacific, Wholesale Banking, Retail Banking and ING Direct). The organisation, powers and modus operandi of the Executive Board are detailed in the Executive Board Charter, which was approved by the Supervisory Board. The Executive Board Charter is available on the ING Group website (www.ing.com).
Profile of members of the Executive BoardThe Supervisory Board has drawn up a profile to be used as a basis for selecting members of the Executive Board. This Executive Board profile was submitted for discussion to the annual General Meeting in 2005. It is available at the ING Group head office and on the ING Group website (www.ing.com).
Remuneration and share ownershipDetails of the remuneration of members of the Executive Board, including shares and/or option rights granted to them, together with information pertaining to such decisions, are provided in the Remuneration Report, starting on page 73. Members of the Executive Board are permitted to hold shares and depositary receipts for shares in the company for long-term investment purposes. Transactions in these shares are subject to the ING regulations for insiders. These regulations are available on the ING Group website (www.ing.com).
Ancillary positions/Conflicting interestsTo avoid potential conflicts of interest, ING Group has a policy that members of its Executive Board do not accept corporate directorships with listed companies outside ING. The only exception is currently Jacques de Vaucleroy, who is on the Board of Directors of Delhaize Group in Belgium. He held this position prior to his appointment to the Executive Board of ING Group.
Transactions involving actual or potential conflicts of interestDetails of relationships that members of the Executive Board have with ING Group subsidiaries as ordinary, private individuals are not
Corporate governance (continued)

ING Group Annual Report 2008
61
reported, with the exception of information on any loans that may have been granted to them (see page 80). In all these cases, the company complies with the best-practice provisions of the Tabaksblat Code.
INFORMATION ON MEMBERS OF THE EXECUTIVE BOARDMichel J. Tilmant, chairman (until 26 January 2009)(Born 1952, Belgian nationality; male; appointed in 1998, stepped down on 26 January 2009, retirement date 1 August 2009)Michel Tilmant graduated from Louvain University with a Licence in Business Administration. He is also a graduate of Louvain School for European Affairs. He started his career with Morgan Guaranty Trust Company in New York. In 1992 he joined Bank Brussels Lambert, where he was appointed chairman of the Executive Board in 1997. After the acquisition of BBL by ING in 1998, Michel Tilmant was appointed vice-chairman in May 2000. He was appointed chairman in April 2004. Five Group staff departments reported directly to Michel Tilmant: Corporate Legal Department, Corporate Human Resources, Corporate Development, Corporate Communications & Affairs and Corporate Audit Services.
Eric F. Boyer de la Giroday (acting chairman from 26 January-27 April 2009)(Born 1952, Belgian nationality, male; appointed in 2004, term expires in 2012)After completing his degree in commercial engineering at the Free University of Brussels and a master in Business Administration at the Wharton School, University of Pennsylvania, Eric Boyer started his career with Citibank in 1978. In 1984 he joined Bank Brussels Lambert, which was acquired by ING Group in 1998, where he held various management positions in the fields of capital markets, treasury and corporate and investment banking. He was appointed a member of the Executive Board of ING Group in April 2004. He is responsible for Wholesale Banking and ING Real Estate.
Dick H. Harryvan(Born 1953, Dutch nationality, male; appointed in 2006, term expires in 2010)Dick Harryvan graduated from the Erasmus University Rotterdam with a master’s degree in Business Economics, majoring in finance. He joined ING as a management trainee at Nationale-Nederlanden in 1979. Before his appointment to the Executive Board in 2006, he held various management positions in the United States, Canada and the Netherlands, where he was chief financial officer/chief risk officer and member of the Global Management Team of ING Direct until his appointment to the Board. Dick Harryvan is also CEO of ING Direct.
John C.R. Hele, CFO (until 31 March 2009)(Born 1958, Canadian nationality, male; appointed in 2007)John Hele graduated from the University of Waterloo, Canada, in 1980 with a bachelor’s degree in Mathematics. He joined ING in 2003 as general manager and chief insurance risk officer, responsible for global insurance risk management. He also functioned as the Group actuary. Before he joined the Executive Board, John Hele had been deputy chief financial officer of ING Group since 2006. Before joining ING, John Hele held various positions at Crown Life in Canada, Merrill Lynch in the United States and at Worldinsure, Bermuda. He is responsible for Group Capital Management, Group Tax, Group Finance and Control, Group Finance Bank and Group Finance Insurance.
Eli P. Leenaars(Born 1961, Dutch nationality, male; appointed in 2004, term expires in 2012)Eli Leenaars studied Civil Law at the Catholic University of Nijmegen and received an LLM from the European University Institute in Florence, Italy and attended the Harvard Graduate School of Business in Boston. After a traineeship at ABN AMRO, he joined ING in 1991, where he held various management positions, including chairman of ING Poland and of ING Latin America. He was appointed a member of the Executive Board of ING Group in April 2004. He is responsible for Retail Banking and Private Banking. He is also in charge of Operations/IT.
Tom J. McInerney(Born 1956, American nationality, male; appointed in 2006, term expires in 2010)Tom McInerney has a bachelor’s degree from Colgate University (Hamilton, New York) and received an MBA from the Tuck School of Business, Dartmouth College (Hanover, New Hampshire). He started his career in 1978 with Aetna Financial Services, which was acquired by ING in 2000. He had been CEO of ING’s insurance activities in the United States, which position included the responsibility for ING Mexico until his appointment to the Executive Board. Tom McInerney is responsible for Insurance Americas, ING Investment Management Americas and the global coordination of ING Investment Management.
Hans van der Noordaa(Born 1961, Dutch nationality, male; appointed in 2006, term expires in 2010)Hans van der Noordaa graduated in Public Administration at the University of Twente, the Netherlands. After a career in retail banking at ABN AMRO, he joined ING in 1991, where he held various management positions. He was CEO of the Retail Division of ING Netherlands, responsible for Postbank, ING Bank and RVS, before his appointment to the Executive Board in 2006. Hans van der Noordaa is responsible for Insurance Asia/Pacific and ING Investment Management Asia/Pacific.
Koos (J.)V. Timmermans, CRO(Born 1960, Dutch nationality, male; appointed in 2007, term expires in 2011)Koos Timmermans graduated from Erasmus University in Rotterdam with a master’s degree in economics. Until 1991 he worked at ABN AMRO in the field of derivatives. For IBM’s European treasury he was stationed in Ireland. Koos Timmermans joined ING in 1996. He performed various roles: head of Treasury ING Insurance, head of Corporate Market Risk Management and from 2006-2007 he was deputy CRO of ING Group, until his appointment to the Executive Board. Koos Timmermans is responsible for ING’s risk departments including compliance.
Jacques M. de Vaucleroy(Born 1961, Belgian nationality, male; appointed in 2006, term expires in 2010)Jacques de Vaucleroy graduated from Louvain University with a degree in Law. He also has a master’s degree in Business Law from the Free University of Brussels, Belgium. In 1986 he joined Bank Brussels Lambert, which was acquired by ING in 1998. Before his appointment to the Executive Board in 2006, he was Group president ING Retail at US Financial Services. Jacques de Vaucleroy

ING Group Annual Report 2008
1.3 Our Governance
62
is responsible for Insurance Europe and ING Investment Management Europe.
Changes in the compositionMichel Tilmant stepped down from the Executive Board on 26 January 2009. He will be succeeded as chairman of the Executive Board by Jan Hommen (born 1943, Dutch nationality, male) upon his appointment to the Executive Board. Jan Hommen will be nominated for appointment to the Executive Board at the 2009 annual General Meeting. In the intervening months, Eric Boyer will be acting chairman of the Executive Board.
John Hele will leave ING on 31 March 2009. At the 2009 General Meeting, Patrick Flynn (born 1960, Irish nationality, male) will be nominated for appointment to the Executive Board. More information can be found in the convocation for the 2009 General Meeting, available on the ING Group website (www.ing.com).
SUPERVISORY BOARDAppointment and dismissalMembers of the Supervisory Board are appointed by the General Meeting from a binding list to be drawn up by the Supervisory Board. This list shall mention at least two candidates for each vacancy, failing which the list will be non-binding. The list will also be non-binding pursuant to a resolution to that effect of the General Meeting adopted by an absolute majority of the votes cast which majority represents more than one-third of the issued share capital. Candidates for appointment to the Supervisory Board must comply with the reliability requirements set out in the Wet financieel toezicht (Dutch Financial Supervision Act).
In connection with the issue of Securities to the Dutch State, it was agreed between ING Group and the Dutch State that the Dutch State may recommend candidates for appointment to the Supervisory Board in such a way that upon appointment of all recommended candidates by ING Group’s General Meeting, the Supervisory Board will have two State Nominees among its members. The Dutch State may recommend a Supervisory Board member already in office. The recommendation right of the Dutch State is subject to applicable law and to corporate governance practices, generally accepted under stock listing regimes applicable to ING Group and continues as long as the Dutch State holds at least 250 million Securities, as long as the Back-up Facility continues or any of the Bonds is outstanding. Should the holding of the Dutch State decrease below 250 million Securities, and both the Back-up Facility and the Bonds have expired, the State Nominees will remain in office and complete their term of appointment.
Candidates thus recommended by the Dutch State will be nominated, by way of a binding nomination, for appointment at the next annual General Meeting, unless one or more specified situations would occur. These include that:
the candidate is not fit and proper to discharge his duties as a •Supervisory Board member; upon appointment the composition of the Supervisory Board •would not be appropriate and/or not be in accordance with the Supervisory Board profile; appointment would be incompatible with any provision of the •ING Group’s Articles of Association, its Supervisory Board Charter, any principle or best-practice provision of the Dutch
Corporate Governance Code as applied by ING Group and/or any other generally accepted corporate governance practice or requirement which is applicable to ING Group as an internationally listed company the relevant candidate has a structural conflict of interest with •ING Group; and the Dutch central bank refuses to issue a statement of “no •objection” against the appointment of the relevant candidate.
On 22 October 2008 the Dutch State announced that it recommended Lodewijk de Waal for appointment to the Supervisory Board. Also Peter Elverding, already member of the Supervisory Board, was appointed as State Nominee. On 11 March 2009 the Dutch State announced that it recommended Tineke Bahlmann to replace Peter Elverding, who will no longer be available as State Nominee upon his appointment as chairman of the Supervisory Board as from 27 April 2009.
Members of the Supervisory Board may be suspended or dismissed at any time by the General Meeting. A resolution to suspend or dismiss members of the Supervisory Board which has not been brought forward by the Supervisory Board may only be adopted by the General Meeting by an absolute majority of the votes cast which majority represents at least one-third of the issued share capital.
Function of the Supervisory BoardThe function of the Supervisory Board is to supervise the policy of the Executive Board and the general course of events in the company and its business, as well as to provide advice to the Executive Board. In line with Dutch company law, the Tabaksblat Code and the Articles of Association, the Supervisory Board Charter requires all Supervisory Board members, including the State Nominees, to act in accordance with the interests of ING and the business connected with it, taking into account the relevant interests of all the stakeholders of ING, to perform their duties without mandate and independent of any interest in the business of ING, and to refrain from supporting one interest without regard to the other interests involved.
As part of its supervisory role, certain resolutions of the Executive Board specified in the Articles of Association and in the Supervisory Board Charter are subject to Supervisory Board approval.
Pursuant to the transactions with the Dutch State mentioned above, certain Supervisory Board resolutions are subject to the condition that no State Nominee voted against the proposal. It has been agreed with the Dutch State that these approval rights will become effective as from the 2009 General Meeting. These resolutions relate to the following matters:a. the issue or acquisition of its own shares by ING Group (other
than related to or in connection with the Securities issue – including, for the avoidance of doubt, for the purpose of conversion or financing of a repurchase of Securities – and other than as part of regular hedging operations and the issuing of shares according to employment schemes);
b. the cooperation by ING Group in the issue of depositary receipts for shares;
c. the application for listing in or removal from the price list of any stock exchange of the securities referred to in a. or b.;
Corporate governance (continued)

ING Group Annual Report 2008
63
d. the entry into or termination of lasting cooperation between ING Group or a dependent company and another legal entity or partnership or as general partner in a limited partnership or general partnership where such cooperation or termination thereof has material significance for ING Group, i.e. amounting to one-quarter or more of ING’s issued capital and reserves as disclosed in its balance sheet and notes thereto;
e. the acquisition by ING Group or a dependent company of a participating interest in the capital of another company amounting to one-quarter or more of ING Group’s issued capital and reserves as disclosed in its balance sheet and notes thereto or a material increase or decrease in the magnitude of such a participating interest;
f. investments involving an amount equal to one-quarter or more of ING Group’s issued capital and reserves as disclosed in its balance sheet and notes thereto;
g. a proposal to wind up ING Group;h. filing of a petition for bankruptcy or moratorium of ING Goup;i. a proposal to reduce the issued capital of ING Group (other than
related to the Securities issue);j. a proposal for merger/split-off, dissolution of ING Group;k. a proposal to the General Meeting to change ING Group’s
remuneration policy; andl. appointment of the chief executive officer of ING Group’s
Executive Board.
Committees of the Supervisory BoardOn 31 December 2008, the Supervisory Board had three standing committees: the Audit Committee, the Remuneration and Nomination Committee and the Corporate Governance Committee. On 1 January 2009, the Remuneration and Nomination Committee was split into a Remuneration Committee and a separate Nomination Committee.
The organisation, powers and modus operandi of the Supervisory Board are detailed in the Supervisory Board Charter. Separate charters have been drawn up for the Audit Committee, the Remuneration Committee, the Nomination Committee and the Corporate Governance Committee. These charters are available on the ING Group website (www.ing.com). A short description of the duties for the Committees follows below.
The Audit Committee assists the Supervisory Board in monitoring the integrity of the financial statements of ING Group, ING Verzekeringen N.V. and ING Bank N.V., in monitoring the compliance with legal and regulatory requirements, and in monitoring the independence and performance of ING’s internal and external auditors. On 31 December 2008, the members of the Audit Committee were: Wim Kok (chairman), Peter Elverding, Piet Hoogendoorn, Godfried van der Lugt and Jackson Tai.
The Remuneration and Nomination Committee advised the Supervisory Board, among other things on the composition of the Supervisory Board and Executive Board, on the compensation packages of the members of the Executive Board and on stock-based compensation programmes for top senior management, including the Executive Board. On 31 December 2008, the members of the Remuneration and Nomination Committee were: Jan Hommen (chairman), Eric Bourdais de Charbonnière, Piet Klaver, Joan Spero and Karel Vuursteen, with Lodewijk de Waal participating as observer, awaiting his appointment to the Supervisory Board.
The Corporate Governance Committee assists the Supervisory Board in monitoring and evaluating the corporate governance of ING as a whole and the reporting of this in the Annual Report and to the General Meeting, and advises the Supervisory Board on improvements. On 31 December 2008, the members of the Corporate Governance Committee were: Jan Hommen (chairman), Eric Bourdais de Charbonnière, Henk Breukink, Claus Dieter Hoffmann, Harish Manwani and Aman Mehta, with Lodewijk de Waal participating as observer, awaiting his appointment to the Supervisory Board.
The (new) Remuneration Committee advises the Supervisory Board, among other things, on the compensation packages of the members of the Executive Board and on stock-based compensation programmes for top senior management, including the Executive Board. As of 1 January 2009, the members of the Remuneration Committee were: Eric Bourdais de Charbonnière (chairman), Piet Klaver, Joan Spero and Karel Vuursteen.
The (new) Nomination Committee advises the Supervisory Board, among other things, on the composition of the Supervisory Board and Executive Board. As of 1 January 2009, members of the Nomination Committee were: Jan Hommen (chairman), Eric Bourdais de Charbonnière, Peter Elverding, Piet Klaver, Joan Spero and Karel Vuursteen.
Profile of members of the Supervisory BoardThe Supervisory Board has drawn up a Profile to be used as a basis for its composition. The Profile was submitted for discussion to the annual General Meeting in 2005. It is available at the ING Group head office and on the ING Group website (www.ing.com).
In view of their experience and the valuable contribution that former members of the Executive Board can make to the Supervisory Board, it has been decided, taking into account the size of the Supervisory Board and ING’s wide range of activities, that such individuals may become members of the Supervisory Board of ING Group. There is, however, a restriction in that only one in every five other members of the Supervisory Board may be a former member of the Executive Board. In addition, this member must wait at least one year after resigning from the Executive Board before becoming eligible for appointment to the Supervisory Board. Former members of the Executive Board are not eligible for appointment to the position of chairman of the Supervisory Board.
After being appointed to the Supervisory Board, a former member of the Executive Board may also be appointed to one of the Supervisory Board’s committees. However, appointment to the position of chairman of a committee is only possible if the individual in question resigned from the Executive Board at least four years prior to such appointment.
Reappointment of Supervisory Board membersMembers of the Supervisory Board will resign from the Supervisory Board at the annual General Meeting held in the calendar year in which they will complete the fourth year after their most recent reappointment. As a general rule, they shall also resign at the annual General Meeting in the year in which they attain the age of 70 and shall not be reappointed. The schedule for resignation by rotation is available on the ING Group website (www.ing.com). Members of the Supervisory Board may as a general rule be
ING Group Annual Report 2008
1.3 Our Governance
64
reappointed for two four-year terms, based on a proposal from the Supervisory Board to the General Meeting.
Ancillary positions/Conflicting interestsMembers of the Supervisory Board are asked to provide details of any other directorships, paid positions and ancillary positions they may hold. Such positions are not permitted to conflict with the interests of ING Group. It is the responsibility of the individual member of the Supervisory Board and the Supervisory Board’s Corporate Governance Committee to ensure that the directorship duties are performed properly and not affected by any other positions that the individual may hold outside the group.
Details of transactions involving actual or potential conflicts of interestDetails of any relationships that members of the Supervisory Board may have with ING Group subsidiaries as ordinary, private individuals are not reported, with the exception of any loans that may have been granted to them (see page 82).
IndependenceAnnually, the Supervisory Board members are requested to assess whether the criteria of independence set out in the Tabaksblat Code do not apply to them and to confirm this in writing. On the basis of these criteria, all members of the Supervisory Board, except Piet Hoogendoorn, are to be regarded as independent on 31 December 2008. Members of the Supervisory Board to whom the independence criteria of the Tabaksblat Code do not apply, and members of the Supervisory Board to whom the criteria do apply but who can explain why this does not undermine their independence, are deemed to be independent.
Remuneration and share ownershipThe remuneration of the members of the Supervisory Board is set by the General Meeting and is not dependent on the results of the company. Details of the remuneration are provided in the Remuneration Report on pages 81-82. Members of the Supervisory Board are permitted to hold shares and depositary receipts for shares in the company for long-term investment purposes. Details are given on page 82. Transactions by Supervisory Board members in ING Group shares and depositary receipts for shares are subject to the ING regulations for insiders. These regulations are available on the ING Group website (www.ing.com).
INFORMATION ON MEMBERS OF THE SUPERVISORY BOARDJan H.M. Hommen, chairman (until 27 April 2009)(Born 1943, Dutch nationality, male; appointed in 2005, term expires in 2009)Former vice-chairman and CFO of the Board of Management of Royal Philips Electronics.Other business activities: until 22 April 2009, non-executive chairman of Reed Elsevier Group plc and Reed Elsevier PLC (UK) and until 8 April 2009, member of the Supervisory Board of TNT N.V. (listed companies). Chairman of the Supervisory Board of Academisch Ziekenhuis Maastricht (hospital).
Peter A.F.W. Elverding (chairman from 27 April 2009)(Born 1948, Dutch nationality, male; appointed in 2007, term expires in 2011)Former chairman of the Managing Board of Directors of Royal DSM N.V. and former vice-chairman of the Supervisory Board of De Nederlandsche Bank N.V. (Dutch Central Bank).Other business activities: chairman of the Supervisory Board of Océ N.V. (listed company). Member of the Supervisory Board of SHV Holdings N.V. Vice-chairman of the Supervisory Board of Q-Park N.V. Member of the Supervisory Board of Koninklijke FrieslandCampina N.V. Chairman of the Supervisory Board of Maastricht University and member of the Supervisory Board of the cross-border University of Limburg.
Eric Bourdais de Charbonnière, vice-chairman (until 27 April 2009)(Born 1939, French nationality, male; appointed in 2004, retirement in 2009)Former managing director of JPMorgan France and chief financial officer of Michelin.Other business activities: chairman of the Supervisory Board of Michelin and member of the Supervisory Board of Thomson (listed companies). Member of the Supervisory Board of each of Oddo et Cie, American Hospital of Paris and Associés en Finance.
Henk W. Breukink(Born 1950, Dutch nationality, male; appointed in 2007, term expires in 2011)Former managing director of F&C and country head for F&C Netherlands (asset management firm).Other business activities: non-executive/vice-chairman of VastNed Offices/Industrial (real estate fund) and non-executive director of F&C hedge funds, Ireland (listed companies). Non-executive director of Heembouw Holding B.V. and chairman of the Supervisory Board of Modulus VastGoed Ontwikkelingen. Member of the Supervisory Board of Omring (health care institution) and HaagWonen (housing corporation). Also associated as coach with TEC (Top Executive Coaching).
Claus Dieter Hoffmann(Born 1942, German nationality, male; appointed in 2003, term expires in 2011)Former chief financial officer of Robert Bosch GmbH. Managing partner of H+H Senior Advisors, Stuttgart.Other business activities: chairman of the Supervisory Board of EnBW AG (listed company). Member of the Supervisory Board of de Boer Structures Holding B.V. Chairman of the Charlottenklinik Foundation (hospital). Chairman of the Board of Trustees (Vereinigung der Freunde) of Stuttgart University.
Piet Hoogendoorn(Born 1945, Dutch nationality, male; appointed in 2007, term expires in 2011)Former chairman of the Board of Directors of Deloitte Touche Tohmatsu and CEO of Deloitte in the Netherlands. Former chairman of Royal NIVRA (Netherlands Institute of Chartered Accountants).
Corporate governance (continued)
ING Group Annual Report 2008
65
Piet C. Klaver(Born 1945, Dutch nationality, male; appointed in 2006, term expires in 2010)Former chairman of the Executive Board of SHV Holdings N.V.Other business activities: chairman of the Supervisory Board of TNT N.V. (listed company). Chairman of the Supervisory Board of each of Dekker Hout Groep B.V., Credit Yard Group BV and Jaarbeurs Holding B.V. Member of the Supervisory Board of SHV Holdings N.V. and Dura Vermeer Groep N.V. Member of the African Parks Foundation. Chairman of the Supervisory Board of Utrecht School of the Arts.
Wim Kok (until 27 April 2009)(Born 1938, Dutch nationality, male; appointed in 2003, retirement in 2009)Former Minister of Finance and Prime Minister of the Netherlands.Other business activities: non-executive member of the Board of Directors of Royal Dutch Shell plc and member of the Supervisory Board of TNT N.V. (listed companies). Member of the Supervisory Board of KLM Royal Dutch Airlines. Chairman of the Supervisory Board of the Anne Frank Foundation, Amsterdam and of Het Nationale Ballet, Amsterdam. Member of the Supervisory Board of Het Muziektheater, Amsterdam and of the Rijksmuseum, Amsterdam. Chairman of the Supervisory Board of the Netherlands Cancer Institute – Antoni van Leeuwenhoek Hospital. Member of the Board of Start Foundation.
Godfried J.A. van der Lugt(Born 1940, Dutch nationality, male; appointed in 2001, term expires in 2009)Former chairman of the Executive Board of ING Group (retired in May 2000).Other business activities: chairman of the Supervisory Board of Stadsherstel Amsterdam NV. Chairman of the Advisory Board of Kasteel De Haar and of R.C. Oude Armenkantoor. Member of the Investment Advisory Committee of Stichting Instituut GAK.
Harish Manwani(Born 1953, Indian nationality, male; appointed in 2008, term expires in 2012)President Unilever Asia, Africa, Central & Eastern Europe.Other business activities: non-executive chairman of Hindustan Unilever Ltd. Member of the Executive Board of Indian School of Business.
Aman Mehta(Born 1946, Indian nationality, male; appointed in 2008, term expires in 2012)Former CEO of Hong Kong & Shanghai Banking Corporation in Hong Kong.Other business activities: non-executive director of each of Tata Consultancy Services Ltd., Jet Airways Ltd. , PCCW Ltd., Vedanta Resources Plc, Wockhardt Ltd., Godrej Consumer Products Ltd., Cairn India Ltd., Max Healthcare Institute Ltd. and Emaar MGF Land Ltd. Governing board member of Indian School of Business and of Indian Centre for International Economic Relations. Member of the International Advisory Council of INSEAD.
Joan E. Spero(Born 1944, American nationality, female; appointed in 2008, term expires in 2012)Former Executive Vice-President Corporate Affairs and Communications of American Express Company. Former Under Secretary Economic Business & Agricultural Affairs, US State Department.Other business activities: non-executive director of IBM Corporation. President of Doris Duke Charitable Foundation. Member of the International Advisory Board of Toyota Motor Corporation. Trustee of Columbia University, Council on Foreign Relations and Trustee of Wisconsin Alumni Research Foundation.
Jackson P. Tai(Born 1950, American nationality, male; appointed in 2008, term expires in 2012)Former vice-chairman and chief executive officer of DBS Group Holdings. Former managing director in the Investment Banking Division of JPMorgan.Other business activities: non-executive director of MasterCard Incorporated and CapitaLand. Chairman of the Board of Directors of Brookstone, Inc. Member of the Bloomberg Asia Pacific Advisory Board and of the Harvard Business School Asia Pacific Advisory Board. Trustee of Rensselaer Polytechnic Institute.
Karel Vuursteen(Born 1941, Dutch nationality, male; appointed in 2002, term expires in 2010)Former chairman of the Executive Board of Heineken N.V.Other business activities: vice-chairman of the Supervisory Board of Akzo Nobel N.V., chairman of the Supervisory Board of TomTom N.V. and member of the Supervisory Board of Henkel KGaA (listed companies). Member of the Board of Directors of Heineken Holding N.V. Member of the Advisory Board of CVC Capital Partners. Chairman of World Wild Life Fund Netherlands and of the Concertgebouw Fund Foundation. Member of the Supervisory Board of Nyenrode Foundation.
Changes in the compositionEric Bourdais de Charbonnière and Wim Kok will retire after the 2009 General Meeting. At the same meeting, Godfried van der Lugt is nominated for reappointment.
At the 2009 General Meeting, Tineke Bahlmann (born 1950, Dutch nationality, female), Jeroen van der Veer (born 1947, Dutch nationality, male) and Lodewijk de Waal (born 1950, Dutch nationality, male) are nominated for appointment as new Supervisory Board members. Tineke Bahlmann and Lodewijk de Waal were recommended for appointment by the Dutch State.Lodewijk de Waal has already attended the Supervisory Board Meetings as an observer since October 2008.
As Jan Hommen is nominated for appointment to the Executive Board, he will, following this appointment, step down from the Supervisory Board. As chairman of the Supervisory Board, he will be succeeded by Peter Elverding as from 27 April 2009.More information can be found in the convocation for the 2009 General Meeting, available on the ING Group website (www.ing.com).

ING Group Annual Report 2008
1.3 Our Governance
66
FINANCIAL REPORTINGA description of the main features of ING Group’s internal control and risk management systems in relation to the financial reporting process is included in the statement with respect to Section 404 Sarbanes-Oxley Act on page 71, which is deemed to be included by reference here.
CHANGE OF CONTROL PROVISIONSLegal provisionsUnder the terms of the Dutch Act on Financial Supervision a declaration of no objection from the Dutch Minister of Finance must be obtained by anyone wishing to obtain or hold a participating interest of at least 10% respectively in ING Group or to exercise control to this extent via a participating interest in ING Group. Similarly, on the basis of indirect change of control statutes in the various jurisdictions where subsidiaries of ING Group are operating, permission from or notification to local regulatory authorities may be required for the acquisition of a substantial interest in ING Group.
Change of control clauses in important contractsING Group is not a party to any material agreement, which becomes effective, or is being amended or terminated subject to the condition of a change of control of ING Group following a public bid defined in section 5:70 of the Financial Supervision Act. ING Group subsidiaries have customary change of control arrangements in contracts related to various business activities, such contracts including joint venture agreements, letters of credit and other credit facilities, reinsurance contracts and futures and option trading contracts. Following a change of control of ING Group (whether or not as the result of a public bid), such contracts may be amended or terminated, leading to, for example, an obligatory transfer of the interest in the joint venture, early repayment of amounts due, loss of credit facilities or reinsurance cover and liquidation of outstanding futures and option trading positions.
Severance payments to Executive Board membersThe employment contracts with the members of the Executive Board provide for severance payments, which are to become due in case of termination of the contract in connection with a public bid defined in section 5:70 of the Dutch Financial Supervision Act. With respect to the amounts due, there is no difference as to whether termination of the contract would be in connection with a public bid or not.
AMENDMENT OF THE ARTICLES OF ASSOCIATIONThe Articles of Association of ING Group may be amended in accordance with a resolution of the General Meeting, adopted with a majority of two-thirds of the votes cast in a meeting in which two-thirds of the issued share capital is present or represented. The resolution of the General Meeting must be proposed by the Executive Board; the Executive Board proposal must be approved by the Supervisory Board.
EXTERNAL AUDITORSAt the annual General Meeting on 22 April 2008, Ernst & Young was appointed to audit the financial statements of ING Group for the financial years 2008 to 2011 inclusive, to report on the outcome of these audits to the Executive Board and the Supervisory Board and to provide an audit opinion on the financial statements of ING Group. Furthermore, Ernst & Young also audited and reported on the effectiveness of internal control over financial reporting on 31 December 2008.
The external auditors attended the meetings of the Audit Committee and the General Meeting held in 2008.
After a maximum period of five years of performing the financial audit of ING Group or ING Verzekeringen N.V. or ING Bank N.V., the lead audit partners of the external audit firm and the audit partners responsible for reviewing the audits, have to be replaced by other partners of the external audit firm. The Audit Committee provides recommendations to the Supervisory Board regarding these replacements based on an annual evaluation of the provided services. In line with this requirement, the lead audit partner of Ernst & Young was replaced after the year-end audit 2006. The rotation of other partners involved with the audit of the financial statements of ING are subject to applicable independence legislation.
The external auditors may be questioned at the annual General Meeting about their audit opinion on the annual accounts. The external auditors will therefore attend and be entitled to address the meeting.
Ernst & Young may only provide audit and non-audit services to ING Group and its subsidiaries with the permission of the Audit Committee. The Audit Committee has generally pre-approved certain types of audit, audit-related, tax and non-audit services to be provided by ING Group’s external audit firms on an annual basis. Services that have not been generally pre-approved by the Audit Committee should not be provided by the external auditor or should be specifically pre-approved by the Audit Committee after recommendation of local management.
The Audit Committee also sets the maximum annual amount that may be spent for pre-approved services. Throughout the year the external audit firms and ING monitor the amounts paid versus the pre-approved amounts. The external auditor provides the Audit Committee with a full overview of all services provided to ING, including related fees, supported by sufficiently detailed information. This overview is periodically evaluated by the Audit Committee during the year.
More details of ING Group’s policy on external auditor’s independence are available on the website of ING Group (www.ing.com).
Corporate governance (continued)

ING Group Annual Report 2008
67
Report of ING Trust Office
The following report is issued in compliance with the provisions of article 15 of the Trust Conditions for registered shares in the share capital of ING Groep N.V.
Pursuant to its articles of association, the object of Stichting ING Aandelen (‘ING Trust Office’), a foundation organised under the laws of the Netherlands, established in Amsterdam is:a. to foster the interests of the holders of depositary receipts for
shares in the capital of ING Groep N.V. (‘ING Group’), while having regard for the interests of (i) ING Group itself, (ii) the enterprises carried on by ING Group and companies associated with it in a group and (iii) all other stakeholders in ING Group, such that all those interests are balanced and safeguarded as effectively as possible;
b. to acquire and administer for the purposes of management registered shares in the capital of ING Group and any bonus shares which may be distributed thereon or shares acquired as stock dividend or by the exercise of subscription rights and to issue exchangeable depositary receipts for these shares to exercise voting rights and all other rights attaching to the shares, to exercise subscription rights and to receive dividends and other distributions, including proceeds of liquidation, subject to the obligation to distribute the income to the depositary receipt holders, save that depositary receipts shall be issued for bonus shares, shares acquired as stock dividend and shares acquired on behalf of depositary receipt holders by virtue of the exercise of subscription rights;
c. to foster the exchange of information between ING Group on the one hand and the depositary receipt holders and shareholders in ING Group on the other;
d. to promote and organise the solicitation of proxies of shareholders other than the foundation itself and of specific proxies and/or voting instructions of depositary receipt holders,
and further to engage in any activity which may be related to the foregoing in the widest sense, whereby all activities which entail commercial risk shall be excluded from the foundation’s object.
During the 2008 reporting year the Board of ING Trust Office (the ‘Board’) held five meetings.
On 4 March 2008 the Board met to discuss among others corporate governance developments, the composition of the Board, the independence of ING Trust Office and its position in general. During this meeting the Board also prepared for the annual General Meeting of ING Group of 22 April 2008.
On 2 April 2008 the Board held a meeting to discuss among others the 2007 balance sheet and statement of income and expenditure of ING Trust Office, the power of attorney to the secretary of ING Trust Office, the amendment of the Articles of Association of ING Trust Office and the amendment of the Trust Conditions. During this meeting the Board also prepared for the annual General Meeting of ING Group of 22 April 2008. Prior to this meeting the Executive Board and Supervisory Board of ING Groep discussed with the Board the activities and performance of ING Group over 2007 on the basis of the press release of 20 February 2008 on the 2007 figures.
On 22 April 2008 the Board convened before the annual General Meeting of ING Group to discuss the proxy voting results and to decide on the initial position of the Board vis-à-vis the items on the agenda. During this meeting the Board also signed and adopted the 2007 balance sheet and statement of income and expenditure of ING Trust Office.
On 3 November 2008 the Board held an additional meeting given the developments in the financial markets and the position of ING. In this meeting the Board discussed with the general counsel of ING the position of ING, in particular the transaction agreed between the Dutch government and ING Group.
The last meeting was held on 3 December 2008. In this meeting the Board discussed among others the amendment of the Articles of Association of ING Trust Office, the composition of the Board, the statements regarding independence of the members of the Board, the agreement regarding reimbursement of costs between ING Trust Office and ING Group and corporate governance developments. During this meeting the Board also looked back at the annual General Meeting of ING Group of 22 April 2008 and looked forward to the annual General Meeting of ING Group of 27 April 2009. Prior to this meeting the Executive Board and Supervisory Board of ING Group discussed with the Board the activities and performance of ING Group over the first nine months of 2008 as published on 12 November 2008.
As stated above, given the developments in the financial markets and the position of ING, the Board held an additional meeting on 3 November 2008. Furthermore, the Board followed the developments very closely and, where necessary, obtained further clarification on the specific choices ING Group made, including the nature of the capital injection by the Dutch government, the decision on the final dividend, the appointment and the powers of two members of the Supervisory Board and the changes to the remuneration policy of the members of the Executive Board. Where the Board thought it useful, it has asked ING Group to provide greater clarity, especially on the question whether the capital injection by the Dutch government was under the circumstances the best option for all holders of depositary receipts and all other stakeholders. ING Trust Office informed the shareholders and holders of depositary receipts of ING Group about the foregoing by way of an additional column of the chairman of the Board in the magazine ING Shareholder nr. 4.
ING Trust Office organises the solicitation of proxies of shareholders of ING Group other than ING Trust Office itself and of specific proxies or voting instructions of holders of depositary receipts. The Board encourages the greatest possible participation of shareholders and holders of depositary receipts.
Holders of depositary receipts in the Netherlands, the United Kingdom and the United States are able to vote by proxy. For the 2008 annual General Meeting of ING Group votes were cast for 38,69% of the total number of issued ordinary shares (excluding the voting rights on the former preference shares). ING Trust Office voted for the remaining shares.
ING Group Annual Report 2008
1.3 Our Governance
68
ING Trust Office takes the position that abandoning depositary receipts will be considered when the turnout at the General Meeting of ING Group reaches a level of at least 35% of the votes that can be cast on ordinary shares (excluding the multiple voting rights on the former preference shares) during three consecutive years. The level of 35% was exceeded during the General Meetings of 2007 and 2008.
According to its Articles of Association ING Trust Office has to vote in the interest of all holders of depositary receipts, including the majority of holders of depositary receipts that has not given voting instructions, while taking into account the interests of ING Group itself, the enterprises carried on by ING Group and companies associated with it in a group and all other stakeholders in ING Group. By doing so ING Trust Office promotes the execution of voting rights in a transparent way and prevents at the same time that a minority of shareholders and holders of depositary receipts could use a chance majority of votes to the disadvantage of those investors not present or not represented.
ING Trust Office, represented by the Board, attended the 2008 annual General Meeting of ING Group and answered various questions. ING Trust Office voted in favour of all agenda items for the shares for which it had received no voting instructions.
On 31 December 2008 the nominal value of administered ordinary shares amounted to EUR 494,923,263.12 for which 2,062,180,263 depositary receipts were issued, each with a nominal value of EUR 0.24. During the reporting year, the net number of depositary receipts cancelled for ordinary shares ran to 163,583,975.
The decrease came about as follows:Add: from exercise of warrants 18,013,226;from conversion of shares into depositary receipts 1,931,005;Less: from conversion of depositary receipts into shares 370,189;cancellation as a result of share buy-back programme 183,158,017.
During the reporting year 2008 all issued preference A shares in the share capital of ING Group were cancelled. Given said cancellation and the fact that there were no preference B shares in the share capital of ING Group outstanding and there will be no need to issue preference B shares in the future, the Articles of Association of ING Trust Office and the Trust Conditions were amended, as a result of which all provisions with respect to the preference A shares and preference B shares were deleted.
The Board currently consists of:Jan Veraart, chairman, former chairman of the Executive Board of Hollandsche Beton Groep N.V.;Huib Blaisse, lawyer and partner at Blaisse Advocaten;Paul Frentrop, Head Corporate Governance APG Groep N.V.;Carel van den Driest, former chairman of the Executive Board of Koninklijke Vopak N.V.;Herman Hazewinkel, former chairman of the Executive Board of Koninklijke Volker Wessels Stevin N.V.
A profile and an overview of additional relevant offices held by the members of the Board can be found on the website of ING Trust Office (www.ingtrustoffice.com).
All members of the Board stated that they meet the conditions regarding independence as referred to in the Dutch Corporate Governance Code and the Articles of Association of ING Trust Office.
The annual remuneration for the chairman of the Board amounts to EUR 25,000.00 and for the other members of the Board to EUR 20,000.00.
In 2008 the costs of proxy voting amounted to EUR 118,088.94.
In 2008 ING Trust Office obtained an advice from NautaDutilh N.V. regarding guidelines with respect to the performance of duties by the Board.
ING Trust Office may consult holders of depositary receipts in a separate meeting. This possibility was not made use of. The Board is of the opinion that a meeting of holders of depositary receipts is not the right medium, because the holders of depositary receipts that will appear at such a meeting will as a rule also attend the General Meeting of ING Group. In that meeting they can voice their opinion and vote themselves. Their interests can therefore be looked after by themselves and not by ING Trust Office.
The activities involved in the administration of shares are performed by Administratiekantoor van het Algemeen Administratie- en Trustkantoor B.V., Amsterdam.
The contact details of ING Trust Office are:Maartje DapperenTelephone + 31 20 5418645E-mail: [email protected]
AMSTERDAM, 16 MARCH 2009
BOARD OF STICHTING ING AANDELEN
Report of ING Trust Office (continued)

ING Group Annual Report 2008
69
Stichting Continuïteit ING, a foundation organised under the laws of the Netherlands, established in Amsterdam, was founded on 22 January 1991. By amendment of the Articles of Association on 23 June 2003, the former name ‘Stichting Cumulatief Preferente Aandelen ING Groep’ was changed into Stichting Continuïteit ING (‘ING Continuity Foundation’).
A call-option agreement concluded between ING Continuity Foundation and ING Groep N.V. (‘ING Group’) vests ING Continuity Foundation with the right to acquire cumulative preference shares in the share capital of ING Group up to a maximum of 4.5 billion cumulative preference shares. The acquisition of cumulative preference shares by ING Continuity Foundation is subject to the restriction that, immediately after the issue of cumulative preference shares, the total amount of cumulative preference shares may not exceed one third of the total issued share capital of ING Group. If new shares other than cumulative preference shares are subsequently issued, ING Continuity Foundation may again exercise its right, subject to the provisions of the preceding sentence. On acquisition of cumulative preference shares, at least 25% of the nominal value must be paid up on said shares.
In 2008 the Board of ING Continuity Foundation (the ‘Board’) met three times, namely on 28 January, 2 April and 3 December.
The composition of the Board is currently as follows: Sebastian Kortmann, who was appointed chairman of the Board as of 2 April 2008, Allard Metzelaar, who was reappointed as of 12 May 2008, Wim van Vonno and Peter Wakkie, who was appointed as of 1 August 2008. Ad Timmermans, the former chairman of the Board, retired as of 1 January 2008 reaching the age limit of 70 as referred to in the Articles of Association of ING Continuity Foundation.
All members of the Board stated that they meet the conditions regarding independence as referred to in the Articles of Association of ING Continuity Foundation.
AMSTERDAM, 16 MARCH 2009
BOARD OF STICHTING CONTINUITEIT ING
Report of ING Continuity Foundation

ING Group Annual Report 2008
1.3 Our Governance
70
The Executive Board is required to prepare the Annual Accounts and the Annual Report of ING Groep N.V. for each financial year in accordance with applicable Dutch law and those International Financial Reporting Standards (IFRS) that were endorsed by the European Union.
Conformity statement pursuant to section 5:25c paragraph 2(c) of the Dutch Financial Supervision Act (Wet op het financieel toezicht)
The Executive Board is responsible for maintaining proper accounting records, for safeguarding assets and for taking reasonable steps to prevent and detect fraud and other irregularities. It is responsible for selecting suitable accounting policies and applying them on a consistent basis, making judgements and estimates that are prudent and reasonable. It is also responsible for establishing and maintaining internal procedures which ensure that all major financial information is known to the Executive Board, so that the timeliness, completeness and correctness of the external financial reporting are assured.
As required by section 5:25c paragraph 2(c) of the Dutch Financial Supervision Act, each of the signatories hereby confirms that to the best of his or her knowledge:
the ING Groep N.V. 2008 Annual Accounts give a true and fair •view of the assets, liabilities, financial position and profit or loss of ING Groep N.V. and the enterprises included in the consolidation taken as a whole;
the ING Groep N.V. 2008 Annual Report gives a true and fair •view of the position at the balance sheet date, the development and performance of the business during the financial year 2008 of ING Groep N.V. and the enterprises included in the consolidation taken as a whole, together with a description of the principal risks ING Groep N.V. is being confronted with.
AMSTERDAM, 16 MARCH 2009
Eric Boyer de la GirodayActing CEO, member of the Executive Board
Dick HarryvanMember of the Executive Board
John HeleCFO, member of the Executive Board
Eli LeenaarsMember of the Executive Board
Tom McInerneyMember of the Executive Board
Hans van der NoordaaMember of the Executive Board
Koos TimmermansCRO, member of the Executive Board
Jacques de VaucleroyMember of the Executive Board
Conformity statement

ING Group Annual Report 2008
71
Section 404 Sarbanes-Oxley ActInternal control over financial reporting
Due to the listing of ING shares on the New York Stock Exchange, ING Group is required to comply with the SEC regulations adopted pursuant to Section 404 of the Sarbanes-Oxley Act, or SOX 404. These regulations require that the CEO (the chairman of the Executive Board) and the CFO of ING Group report and certify on an annual basis on the effectiveness of ING Group’s internal controls over financial reporting. Furthermore, the external auditors are required to provide an opinion on the effectiveness of ING Group’s internal controls over financial reporting.
Internal controls over financial reporting already existed before the adoption of SOX 404. However, SOX 404 regulations require management to demonstrate the effectiveness of such controls. This implies a more formalised approach in executing our tasks. ING Group has long-established Business Principles and a strong internal-control culture, which all staff must adhere to. SOX 404 activities are organised along the lines of the governance structure, and involve the participation of senior management across ING. Following the SOX 404 process, ING is in the position to publish an unqualified statement which denotes that the company’s internal control over financial reporting is effective as of 31 December 2008. The SOX 404 statement by the Executive Board is included below, followed by the report of the external auditor.
RepoRt of the executive boaRd on inteRnal contRol oveR financial RepoRtingThe Executive Board is responsible for establishing and maintaining adequate internal control over financial reporting. ING’s internal control over financial reporting is a process designed under the supervision of our principal executive and principal financial officers to provide reasonable assurance regarding the reliability of financial reporting and the preparation of financial statements for external purposes in accordance with generally accepted accounting principles.
Our internal control over financial reporting includes those policies and procedures that:
pertain to the maintenance of records that, in reasonable detail, •accurately and fairly reflect the transactions and dispositions of the assets of ING; provide reasonable assurance that transactions are recorded •as necessary to permit preparation of financial statements in accordance with generally accepted accounting principles, and that our receipts and expenditures are being made only in accordance with authorisations of our management and directors; and provide reasonable assurance regarding prevention or timely •detection of unauthorised acquisition, use or disposition of our assets that could have a material effect on our financial statements.
Because of its inherent limitations, internal control over financial reporting may not prevent or detect misstatements. Also, projections of any evaluation of effectiveness to future periods are subject to the risk that controls may become inadequate because of changes in conditions, or that the degree of compliance with the policies or procedures may deteriorate.
The Executive Board assessed the effectiveness of our internal control over financial reporting as of 31 December 2008. In making this assessment, the Executive Board performed tests based on the criteria of the Committee of Sponsoring Organizations of the Treadway Commission (COSO) in Internal Control – Integrated Framework. Based on the Executive Board’s assessment and those criteria, the Executive Board concluded that the company’s internal control over financial reporting is effective as of 31 December 2008.
Our independent registered public accounting firm has audited and issued their report on ING’s internal control over financial reporting, which appears on the following page.
aMSteRdaM, 16 MaRch 2009
eric boyer de la girodayActing CEO, member of the Executive Board
John heleChief Financial Officer

ING Group Annual Report 2008
1.3 Our Governance
72
RepoRt of independent RegiSteRed public accounting fiRMto the Shareholders, the Supervisory board and the executive board of ing groep n.v.
We have audited ING Groep N.V.’s internal control over financial reporting as of 31 December 2008, based on criteria established in Internal Control – Integrated Framework issued by the Committee of Sponsoring Organizations of the Treadway Commission (the COSO criteria). ING Groep N.V.’s management is responsible for maintaining effective internal control over financial reporting, and for its assessment of the effectiveness of internal control over financial reporting included in the accompanying Report of the Executive Board on Internal Control Over Financial Reporting. Our responsibility is to express an opinion on the company’s internal control over financial reporting based on our audit.
We conducted our audit in accordance with the standards of the Public Company Accounting Oversight Board (United States). Those standards require that we plan and perform the audit to obtain reasonable assurance about whether effective internal control over financial reporting was maintained in all material respects. Our audit included obtaining an understanding of internal control over financial reporting, assessing the risk that a material weakness exists, testing and evaluating the design and operating effectiveness of internal control based on the assessed risk, and performing such other procedures as we considered necessary in the circumstances. We believe that our audit provides a reasonable basis for our opinion.
A company’s internal control over financial reporting is a process designed to provide reasonable assurance regarding the reliability of financial reporting and the preparation of financial statements for external purposes in accordance with generally accepted accounting principles. A company’s internal control over financial reporting includes those policies and procedures that (1) pertain to the maintenance of records that, in reasonable detail, accurately and fairly reflect the transactions and dispositions of the assets of the company; (2) provide reasonable assurance that transactions are recorded as necessary to permit preparation of financial statements in accordance with generally accepted accounting principles, and that receipts and expenditures of the company are being made only in accordance with authorisations of management and directors of the company; and (3) provide reasonable assurance regarding prevention or timely detection of unauthorized acquisition, use or disposition of the company’s assets that could have a material effect on the financial statements.
Because of its inherent limitations, internal control over financial reporting may not prevent or detect misstatements. Also, projections of any evaluation of effectiveness to future periods are subject to the risk that controls may become inadequate because of changes in conditions, or that the degree of compliance with the policies or procedures may deteriorate.
In our opinion, ING Groep N.V. maintained, in all material respects, effective internal control over financial reporting as of 31 December 2008, based on the COSO criteria.
We also have audited, in accordance with the standards of the Public Company Accounting Oversight Board (United States), the consolidated balance sheet of ING Groep N.V. as of 31 December 2008, the consolidated profit and loss account, consolidated statement of cash flows and consolidated statement of changes in equity for the year then ended. Our report dated 16 March 2009 expressed an unqualified opinion thereon.
aMSteRdaM, 16 MaRch 2009
eRnSt & young accountantS llp
Section 404 Sarbanes-Oxley Act (continued)
ING Group Annual Report 2008
73
Remuneration report
This section sets out the remuneration for the Executive Board and the Supervisory Board. The remuneration policy was adopted by the annual General Meeting on 27 April 2004. In 2006, the Executive Board pension scheme was revised in alignment with the approved amendment to the remuneration policy. The revised Executive Board pension scheme is further described on page 79. There were no changes to this policy in 2008 and therefore, the approval of the 2006 annual General Meeting still applies for 2008. This section starts with the general policy for senior management remuneration, followed by the Executive Board compensation for 2008 and the compensation structure for 2009. In addition, information is included on loans and advances to the Executive Board and Supervisory Board members as well as ING depositary receipts for shares held by members of both Boards.
GENERAL POLICY SENIOR MANAGEMENT REMUNERATION BackgroundThe prime objective of the remuneration policy is to enable the company to recruit and retain qualified and expert leaders. The remuneration package supports a performance-driven culture that aligns ING’s objectives with those of its stakeholders. ING rewards performance on the basis of previously determined, challenging, measurable and influenceable short-term and long-term targets.
ING’s remuneration policy is based on five key principles that apply throughout ING. These principles are:
Total compensation levels are benchmarked against relevant •markets in which ING competes for talent. ING aims for total compensation at the median level in the •relevant market, allowing only for above-median compensation in the event of outstanding performance. The remuneration package includes variable-pay components •(short-term and long-term incentives) to ensure that executive remuneration is linked to ING’s short-term and long-term business performance. To enhance the effectiveness of the short-term incentive plan, •clear, measurable and challenging targets are set at the beginning of each year. Long-term incentives ensure a focus on longer-term strategic •targets and create alignment of management with the interests of shareholders. A broad selection of ING’s senior leaders participates in the plan to ensure a common focus on ING’s overall performance.
Remuneration structureTotal compensation throughout ING consists of three basic components:
Fixed or base salary which represents the total guaranteed •annual income. Short-term incentive (STI) in cash, which compensates for past •performance measured over one year. Long-term incentive (LTI) in stock options and performance •shares, which compensates for performance measured over multiple years and is forward-looking.
In addition to the base salary and incentive plan participation, senior management and Executive Board members enjoy benefits similar to most other comparable employees of ING Group. These include benefits such as the use of company cars, contributions to company savings plans and, if applicable, expatriate allowances.
Base salary The base salaries of the Executive Board should be sufficient to attract and retain high-calibre management needed to achieve our business objectives. The Supervisory Board assesses the experience, background, responsibilities, performance and leadership competencies of the CEO and the members of the Executive Board when making decisions on base-salary levels.
To ensure that base-salary levels are in line with the relevant market for talent, the Supervisory Board reviews the base-salary levels of the Executive Board on an annual basis.
Short-term incentive planThe short-term incentive plan (STIP) is a key component of ING’s performance-driven culture. The short-term incentive is paid in
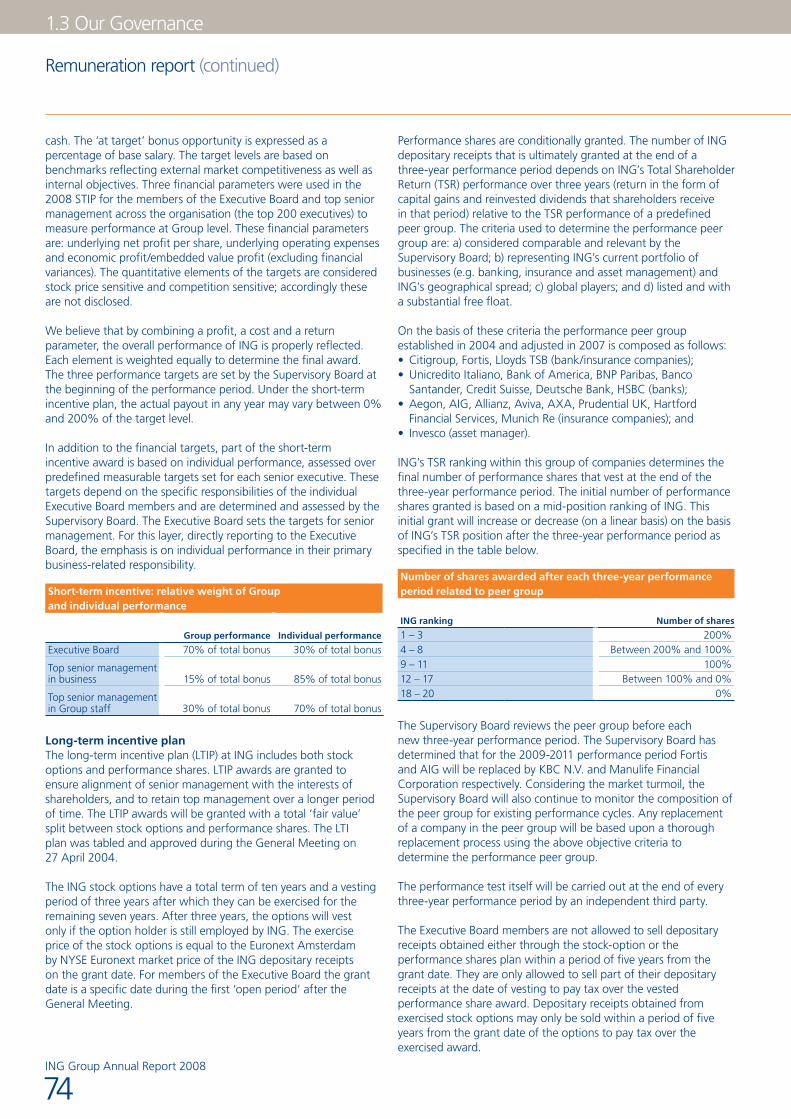
ING Group Annual Report 2008
1.3 Our Governance
74
cash. The ‘at target’ bonus opportunity is expressed as a percentage of base salary. The target levels are based on benchmarks reflecting external market competitiveness as well as internal objectives. Three financial parameters were used in the 2008 STIP for the members of the Executive Board and top senior management across the organisation (the top 200 executives) to measure performance at Group level. These financial parameters are: underlying net profit per share, underlying operating expenses and economic profit/embedded value profit (excluding financial variances). The quantitative elements of the targets are considered stock price sensitive and competition sensitive; accordingly these are not disclosed.
We believe that by combining a profit, a cost and a return parameter, the overall performance of ING is properly reflected. Each element is weighted equally to determine the final award. The three performance targets are set by the Supervisory Board at the beginning of the performance period. Under the short-term incentive plan, the actual payout in any year may vary between 0% and 200% of the target level.
In addition to the financial targets, part of the short-term incentive award is based on individual performance, assessed over predefined measurable targets set for each senior executive. These targets depend on the specific responsibilities of the individual Executive Board members and are determined and assessed by the Supervisory Board. The Executive Board sets the targets for senior management. For this layer, directly reporting to the Executive Board, the emphasis is on individual performance in their primary business-related responsibility.
Short-term incentive: relative weight of Group and individual performance
Group performance Individual performance
Executive Board 70% of total bonus 30% of total bonus
Top senior management in business 15% of total bonus 85% of total bonus
Top senior management in Group staff 30% of total bonus 70% of total bonus
Long-term incentive planThe long-term incentive plan (LTIP) at ING includes both stock options and performance shares. LTIP awards are granted to ensure alignment of senior management with the interests of shareholders, and to retain top management over a longer period of time. The LTIP awards will be granted with a total ‘fair value’ split between stock options and performance shares. The LTI plan was tabled and approved during the General Meeting on 27 April 2004.
The ING stock options have a total term of ten years and a vesting period of three years after which they can be exercised for the remaining seven years. After three years, the options will vest only if the option holder is still employed by ING. The exercise price of the stock options is equal to the Euronext Amsterdam by NYSE Euronext market price of the ING depositary receipts on the grant date. For members of the Executive Board the grant date is a specific date during the first ‘open period’ after the General Meeting.
Performance shares are conditionally granted. The number of ING depositary receipts that is ultimately granted at the end of a three-year performance period depends on ING’s Total Shareholder Return (TSR) performance over three years (return in the form of capital gains and reinvested dividends that shareholders receive in that period) relative to the TSR performance of a predefined peer group. The criteria used to determine the performance peer group are: a) considered comparable and relevant by the Supervisory Board; b) representing ING’s current portfolio of businesses (e.g. banking, insurance and asset management) and ING’s geographical spread; c) global players; and d) listed and with a substantial free float.
On the basis of these criteria the performance peer group established in 2004 and adjusted in 2007 is composed as follows:
Citigroup, Fortis, Lloyds TSB (bank/insurance companies);• Unicredito Italiano, Bank of America, BNP Paribas, Banco •Santander, Credit Suisse, Deutsche Bank, HSBC (banks); Aegon, AIG, Allianz, Aviva, AXA, Prudential UK, Hartford •Financial Services, Munich Re (insurance companies); and Invesco (asset manager).•
ING’s TSR ranking within this group of companies determines the final number of performance shares that vest at the end of the three-year performance period. The initial number of performance shares granted is based on a mid-position ranking of ING. This initial grant will increase or decrease (on a linear basis) on the basis of ING’s TSR position after the three-year performance period as specified in the table below.
Number of shares awarded after each three-year performance period related to peer group
ING ranking Number of shares
1 – 3 200%4 – 8 Between 200% and 100%9 – 11 100%12 – 17 Between 100% and 0%18 – 20 0%
The Supervisory Board reviews the peer group before each new three-year performance period. The Supervisory Board has determined that for the 2009-2011 performance period Fortis and AIG will be replaced by KBC N.V. and Manulife Financial Corporation respectively. Considering the market turmoil, the Supervisory Board will also continue to monitor the composition of the peer group for existing performance cycles. Any replacement of a company in the peer group will be based upon a thorough replacement process using the above objective criteria to determine the performance peer group.
The performance test itself will be carried out at the end of every three-year performance period by an independent third party.
The Executive Board members are not allowed to sell depositary receipts obtained either through the stock-option or the performance shares plan within a period of five years from the grant date. They are only allowed to sell part of their depositary receipts at the date of vesting to pay tax over the vested performance share award. Depositary receipts obtained from exercised stock options may only be sold within a period of five years from the grant date of the options to pay tax over the exercised award.
Remuneration report (continued)

ING Group Annual Report 2008
75
Remuneration levelsEvery year a compensation benchmark analysis is performed based upon a peer group of companies. This peer group, established in 2008, is a group of European financial services companies. The peer group reflects ING’s business structure and environment. ING competes with these companies for executive talent. The following companies are part of this compensation peer group: Aegon, Allianz, AXA, Banco Santander, Barclays, BNP Paribas, Credit Suisse, Deutsche Bank, Fortis, HSBC, Royal Bank of Scotland, Société Générale, Unicredito Italiano, and Zurich Financial Services.
In line with ING’s overall remuneration policy, the Supervisory Board has focused on increasing variable (performance-driven) pay components which has resulted in a gradual convergence of the Executive Board total compensation to the median benchmark. The mix of total target compensation (in case of at-target performance) is divided equally between each component (i.e. 1/3rd base salary, 1/3rd short-term incentives, and 1/3rd long-term incentives).
Pensions Executive Board membersAt the General Meeting on 25 April 2006, it was agreed to amend the Executive Board remuneration policy with respect to pensions. This revised pension plan applies to all members of the Executive Board regardless of the time of appointment to the Executive Board except for John Hele and Tom McInerney. The revised pension plan does not apply to John Hele and Tom McInerney as they participate in the US pension plans. The pensions of the Executive Board are now based on a defined-contribution plan, which are insured through a contract with Nationale-Nederlanden Levensverzekering Maatschappij N.V. Starting in 2006, members of the Executive Board have been required to pay a portion of their pension premium. The Employment Contract will terminate by operation of law in case of retirement (‘Standard Retirement’), which will take place on the first day of the month that the individual reaches the age of 65. The retirement age has been changed from previous years (age 60) as a result of the Dutch tax reform.
Employment contract for newly appointed Board membersThe contract of employment for Executive Board members appointed after 1 January 2004 provides for an appointment for a period of four years (the appointment period) and allows for reappointment by the General Meeting.
In the case of an involuntary exit, Executive Board members would be entitled to an amount which has been set at a multiple of their Executive Board member base salary, preserving their existing rights. These rights in some cases could exceed the exit-arrangement provision in the Dutch Corporate Governance Code, i.e. no more than two times base salary (first appointment period) or one-time base salary (all other situations). Under the terms of the agreement reached with the Dutch State to strengthen ING’s capital position, the exit arrangments have been limited to one-year base salary.
The term of notice for Executive Board members is three months for the employee and six months for the employer.
REMUNERATION EXECUTIVE BOARD 2008Executive Board base salary 2008The base salary of all Executive Board members with the exception of Tom McInerney (who is employed on a US-based compensation structure) was increased by 5% in 2008. Base salaries had been frozen in 2004, 2005, 2006 and 2007.
Executive Board short-term incentive plan 2008 The target STI payout over 2008 was set at 100% of the individual Executive Board member’s base salary. The final award is based on the achievement of a set of common Group financial targets and specific individual qualitative and quantitative objectives for each Executive Board member. Specifically, 70% of the total award is based on the Group’s underlying net profit per share, underlying operating expenses and economic profit/embedded value profit (excluding financial variances), while the remaining 30% is based on individual objectives set at the beginning of the year by the chairman of the Executive Board and approved by the Remuneration and Nomination Committee of the Supervisory Board.
Under the terms of the agreement reached with the Dutch State to trengthen ING’s capital position, the individual Executive Board members will not receive their 2008 STI payout.
Executive Board long-term incentive plan 2008Under the LTIP for the Executive Board, two instruments are used: stock options and performance shares. As mentioned earlier, an identical plan has been adopted by the Executive Board for the top senior managers across ING. As a result, approximately 7,000 senior leaders participate in a similar plan.
The target level for the 2008 LTIP was set at 100% of base salary for each Executive Board member. The final grant level depends on the Group STIP performance and will vary between 50% of the target level (if Group STI would be 0%) and 150% (if Group STI would be 200%).
Under the terms of the agreement reached with the Dutch State to strengthen ING’s capital position, the individual Executive Board members will not receive their 2008 LTI grant.
Tom McInerney is entitled to receive a conditional share award on the same grant date as the other long-term incentive awards. The conditional share award would be 100% vested four years after the grant date with the condition being an active employment contract at the date of vesting. This award is part of Tom McInerney’s employment contract to align his total remuneration with the market practice of senior executives in the United States. Tom McInerney will not receive his conditional share award to be awarded in 2009 for the 2008 performance year.
The performance shares granted in 2006 had a three-year performance period of 2006–2008 and will vest in 2009. The actual results of 43% are based upon ING’s TSR ranking of 15 within the designated peer group. The results were determined by an independent third party. ING’s external auditor has reviewed the calculations performed. For members of the Executive Board who received an award as an Executive Board member in 2006, such award will vest in the final number of performance shares in May 2009. For the other senior leaders who participated in the 2006–2008 performance share award, such award vested in March 2009.
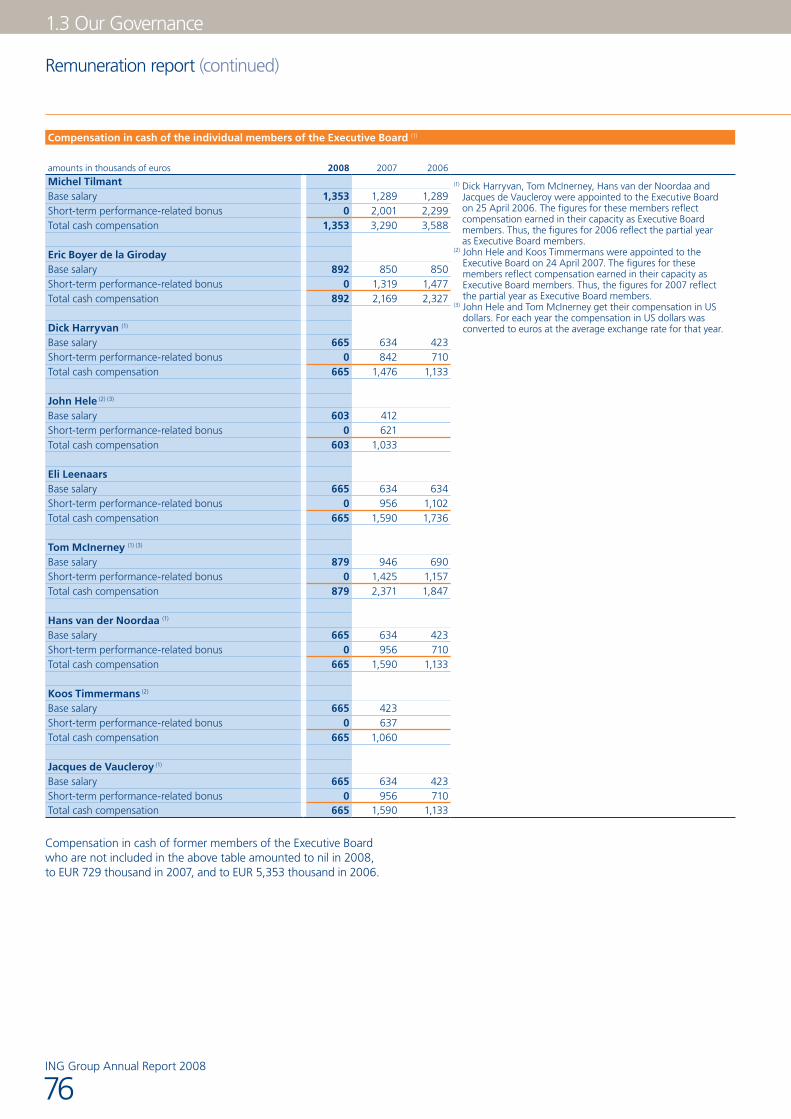
ING Group Annual Report 2008
1.3 Our Governance
76
Compensation in cash of the individual members of the Executive Board (1)
amounts in thousands of euros 2008 2007 2006
Michel Tilmant (1) Dick Harryvan, Tom McInerney, Hans van der Noordaa and Jacques de Vaucleroy were appointed to the Executive Board on 25 April 2006. The figures for these members reflect compensation earned in their capacity as Executive Board members. Thus, the figures for 2006 reflect the partial year as Executive Board members.
(2) John Hele and Koos Timmermans were appointed to the Executive Board on 24 April 2007. The figures for these members reflect compensation earned in their capacity as Executive Board members. Thus, the figures for 2007 reflect the partial year as Executive Board members.
(3) John Hele and Tom McInerney get their compensation in US dollars. For each year the compensation in US dollars was converted to euros at the average exchange rate for that year.
Base salary 1,353 1,289 1,289Short-term performance-related bonus 0 2,001 2,299Total cash compensation 1,353 3,290 3,588
Eric Boyer de la GirodayBase salary 892 850 850Short-term performance-related bonus 0 1,319 1,477Total cash compensation 892 2,169 2,327
Dick Harryvan (1)
Base salary 665 634 423Short-term performance-related bonus 0 842 710Total cash compensation 665 1,476 1,133
John Hele (2) (3)
Base salary 603 412Short-term performance-related bonus 0 621Total cash compensation 603 1,033
Eli LeenaarsBase salary 665 634 634Short-term performance-related bonus 0 956 1,102Total cash compensation 665 1,590 1,736
Tom McInerney (1) (3)
Base salary 879 946 690Short-term performance-related bonus 0 1,425 1,157Total cash compensation 879 2,371 1,847
Hans van der Noordaa (1)
Base salary 665 634 423Short-term performance-related bonus 0 956 710Total cash compensation 665 1,590 1,133
Koos Timmermans (2)
Base salary 665 423Short-term performance-related bonus 0 637Total cash compensation 665 1,060
Jacques de Vaucleroy (1)
Base salary 665 634 423Short-term performance-related bonus 0 956 710Total cash compensation 665 1,590 1,133
Compensation in cash of former members of the Executive Board who are not included in the above table amounted to nil in 2008, to EUR 729 thousand in 2007, and to EUR 5,353 thousand in 2006.
Remuneration report (continued)

ING Group Annual Report 2008
77
Long-term incentives of the individual members of the Executive Board (1)
fair market value at grant in thousands of euros 2008 2007 2006
Michel Tilmant (1) Long-term incentives are granted in the year following the reporting year. The long-term incentive plan provides for a combination of share options and provisional performance shares based on a 50/50 split in value. The ratio of options to performance shares varies each year as a result of the fair value calculation and the 50/50 split in value. The fair value calculation for the performance year 2008 resulted in a ratio of options to performance shares of 2.36 : 1 (2007: 4.22 : 1, 2006: 4.78 : 1).
(2) The fair market value of a long-term incentive award reflects the estimated fair market value of the long-term incentive award based on a fair value calculation. The valuation is calculated on the last trading day of the year for grants made to the Executive Board members for performance over the specified year and is not updated for current market values.
(3) Dick Harryvan, Tom McInerney, Hans van der Noordaa and Jacques de Vaucleroy were appointed to the Executive Board on 25 April 2006. The figures for these members reflect compensation earned in their capacity as Executive Board members.
(4) John Hele and Koos Timmermans were appointed to the Executive Board on 24 April 2007. The figures for these members reflect compensation earned in their capacity as Executive Board members.
(5) Tom McInerney is entitled to receive conditional shares on the same grant date as the other long-term incentive awards. The conditional shares will be 100% vested four years after the grant date with the condition being an active employment contract. The conditional shares are provided to align Tom McInerney’s total remuneration with US market practice. Tom McInerney will not receive his conditional share award for the 2008 performance year.
Number of options 0 132,054 132,163Number of performance shares 0 31,293 27,650Fair market value of long-term incentive (2) 0 1,521 1,734
Eric Boyer de la GirodayNumber of options 0 87,066 87,138Number of performance shares 0 20,632 18,230Fair market value of long-term incentive (2) 0 1,003 1,143
Dick Harryvan (3)
Number of options 0 64,967 43,347Number of performance shares 0 15,396 9,069Fair market value of long-term incentive (2) 0 748 569
John Hele (4)
Number of options 0 42,228Number of performance shares 0 10,007Fair market value of long-term incentive (2) 0 486
Eli LeenaarsNumber of options 0 64,967 65,021Number of performance shares 0 15,396 13,603Fair market value of long-term incentive (2) 0 748 853
Tom McInerney (3) (5)
Number of options 0 96,875 70,695Number of performance shares 0 22,957 14,790Number of conditional shares 0 54,312 37,633Fair market value of long-term incentive (2) 0 2,571 2,201
Hans van der Noordaa (3)
Number of options 0 64,967 43,347Number of performance shares 0 15,396 9,069Fair market value of long-term incentive (2) 0 748 569
Koos Timmermans (4)
Number of options 0 43,312Number of performance shares 0 10,264Fair market value of long-term incentive (2) 0 499
Jacques de Vaucleroy (3)
Number of options 0 64,967 43,347Number of performance shares 0 15,396 9,069Fair market value of long-term incentive (2) 0 748 569
The fair market value of long-term incentive awards of former members of the Executive Board who are not included in the above table amounted to nil in 2008 and 2007, and to EUR 938 thousand in 2006.
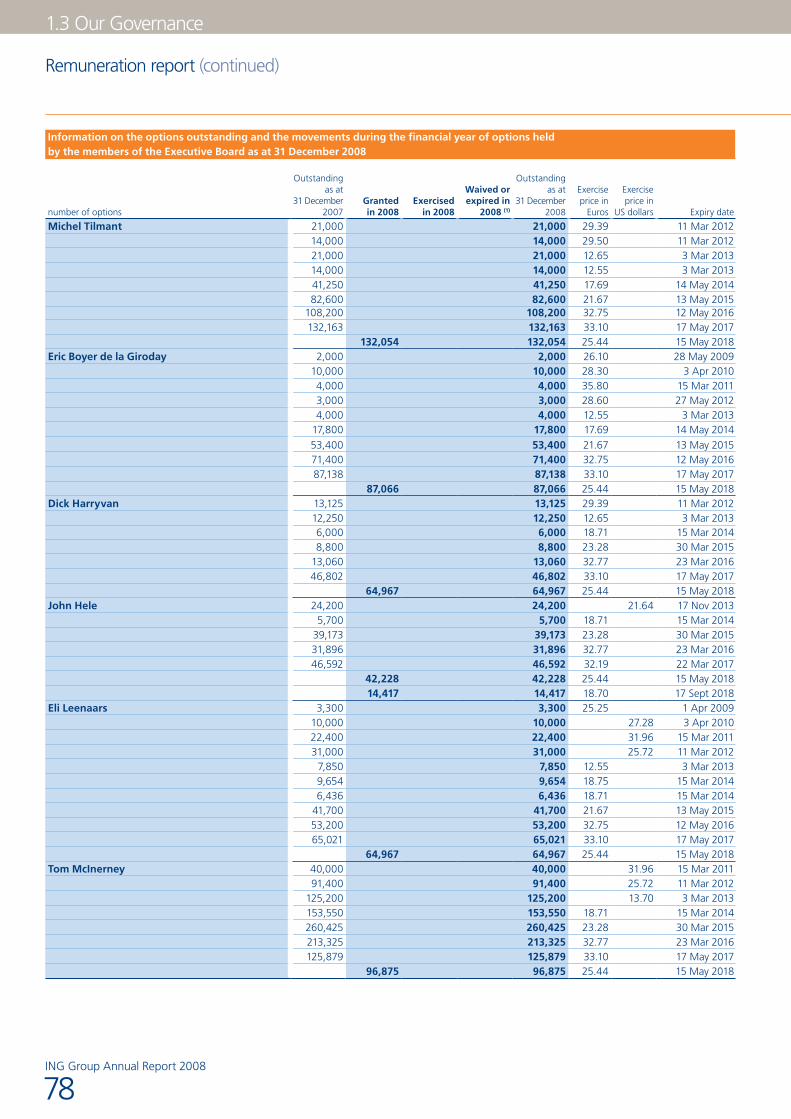
ING Group Annual Report 2008
1.3 Our Governance
78
Remuneration report (continued)
Information on the options outstanding and the movements during the financial year of options held by the members of the Executive Board as at 31 December 2008
number of options
Outstanding as at
31 December 2007
Granted in 2008
Exercised in 2008
Waived or expired in
2008 (1)
Outstanding as at
31 December 2008
Exercise price in
Euros
Exercise price in
US dollars Expiry date
Michel Tilmant 21,000 21,000 29.39 11 Mar 201214,000 14,000 29.50 11 Mar 201221,000 21,000 12.65 3 Mar 201314,000 14,000 12.55 3 Mar 201341,250 41,250 17.69 14 May 201482,600 82,600 21.67 13 May 2015
108,200 108,200 32.75 12 May 2016132,163 132,163 33.10 17 May 2017
132,054 132,054 25.44 15 May 2018Eric Boyer de la Giroday 2,000 2,000 26.10 28 May 2009
10,000 10,000 28.30 3 Apr 20104,000 4,000 35.80 15 Mar 20113,000 3,000 28.60 27 May 20124,000 4,000 12.55 3 Mar 2013
17,800 17,800 17.69 14 May 201453,400 53,400 21.67 13 May 201571,400 71,400 32.75 12 May 201687,138 87,138 33.10 17 May 2017
87,066 87,066 25.44 15 May 2018Dick Harryvan 13,125 13,125 29.39 11 Mar 2012
12,250 12,250 12.65 3 Mar 20136,000 6,000 18.71 15 Mar 20148,800 8,800 23.28 30 Mar 2015
13,060 13,060 32.77 23 Mar 201646,802 46,802 33.10 17 May 2017
64,967 64,967 25.44 15 May 2018John Hele 24,200 24,200 21.64 17 Nov 2013
5,700 5,700 18.71 15 Mar 201439,173 39,173 23.28 30 Mar 201531,896 31,896 32.77 23 Mar 201646,592 46,592 32.19 22 Mar 2017
42,228 42,228 25.44 15 May 201814,417 14,417 18.70 17 Sept 2018
Eli Leenaars 3,300 3,300 25.25 1 Apr 200910,000 10,000 27.28 3 Apr 201022,400 22,400 31.96 15 Mar 201131,000 31,000 25.72 11 Mar 2012
7,850 7,850 12.55 3 Mar 20139,654 9,654 18.75 15 Mar 20146,436 6,436 18.71 15 Mar 2014
41,700 41,700 21.67 13 May 201553,200 53,200 32.75 12 May 201665,021 65,021 33.10 17 May 2017
64,967 64,967 25.44 15 May 2018Tom McInerney 40,000 40,000 31.96 15 Mar 2011
91,400 91,400 25.72 11 Mar 2012125,200 125,200 13.70 3 Mar 2013153,550 153,550 18.71 15 Mar 2014260,425 260,425 23.28 30 Mar 2015213,325 213,325 32.77 23 Mar 2016125,879 125,879 33.10 17 May 2017
96,875 96,875 25.44 15 May 2018
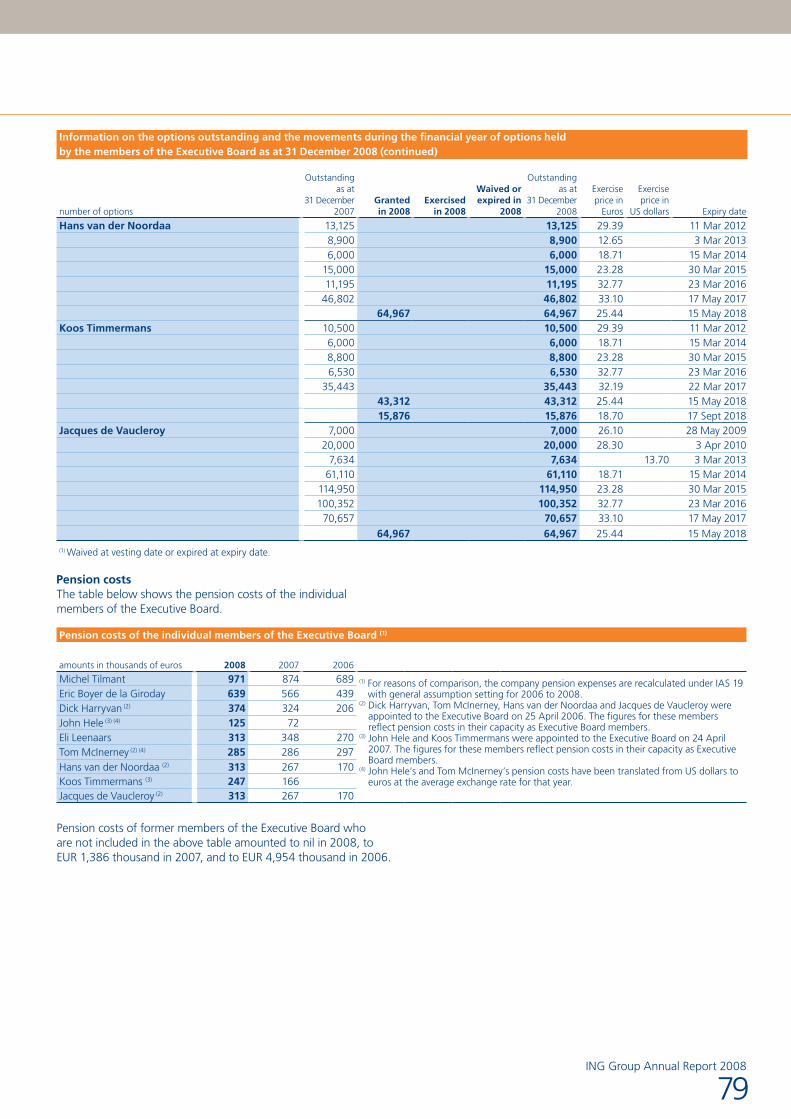
ING Group Annual Report 2008
79
Information on the options outstanding and the movements during the financial year of options held by the members of the Executive Board as at 31 December 2008 (continued)
number of options
Outstanding as at
31 December 2007
Granted in 2008
Exercised in 2008
Waived or expired in
2008
Outstanding as at
31 December 2008
Exercise price in
Euros
Exercise price in
US dollars Expiry date
Hans van der Noordaa 13,125 13,125 29.39 11 Mar 20128,900 8,900 12.65 3 Mar 20136,000 6,000 18.71 15 Mar 2014
15,000 15,000 23.28 30 Mar 201511,195 11,195 32.77 23 Mar 2016
46,802 46,802 33.10 17 May 201764,967 64,967 25.44 15 May 2018
Koos Timmermans 10,500 10,500 29.39 11 Mar 20126,000 6,000 18.71 15 Mar 20148,800 8,800 23.28 30 Mar 20156,530 6,530 32.77 23 Mar 2016
35,443 35,443 32.19 22 Mar 201743,312 43,312 25.44 15 May 201815,876 15,876 18.70 17 Sept 2018
Jacques de Vaucleroy 7,000 7,000 26.10 28 May 200920,000 20,000 28.30 3 Apr 2010
7,634 7,634 13.70 3 Mar 201361,110 61,110 18.71 15 Mar 2014
114,950 114,950 23.28 30 Mar 2015100,352 100,352 32.77 23 Mar 2016
70,657 70,657 33.10 17 May 201764,967 64,967 25.44 15 May 2018
(1) Waived at vesting date or expired at expiry date.
Pension costs The table below shows the pension costs of the individual members of the Executive Board.
Pension costs of the individual members of the Executive Board (1)
amounts in thousands of euros 2008 2007 2006
Michel Tilmant 971 874 689 (1) For reasons of comparison, the company pension expenses are recalculated under IAS 19 with general assumption setting for 2006 to 2008.
(2) Dick Harryvan, Tom McInerney, Hans van der Noordaa and Jacques de Vaucleroy were appointed to the Executive Board on 25 April 2006. The figures for these members reflect pension costs in their capacity as Executive Board members.
(3) John Hele and Koos Timmermans were appointed to the Executive Board on 24 April 2007. The figures for these members reflect pension costs in their capacity as Executive Board members.
(4) John Hele’s and Tom McInerney’s pension costs have been translated from US dollars to euros at the average exchange rate for that year.
Eric Boyer de la Giroday 639 566 439Dick Harryvan (2) 374 324 206John Hele (3) (4) 125 72Eli Leenaars 313 348 270Tom McInerney (2) (4) 285 286 297Hans van der Noordaa (2) 313 267 170Koos Timmermans (3) 247 166Jacques de Vaucleroy (2) 313 267 170
Pension costs of former members of the Executive Board who are not included in the above table amounted to nil in 2008, to EUR 1,386 thousand in 2007, and to EUR 4,954 thousand in 2006.
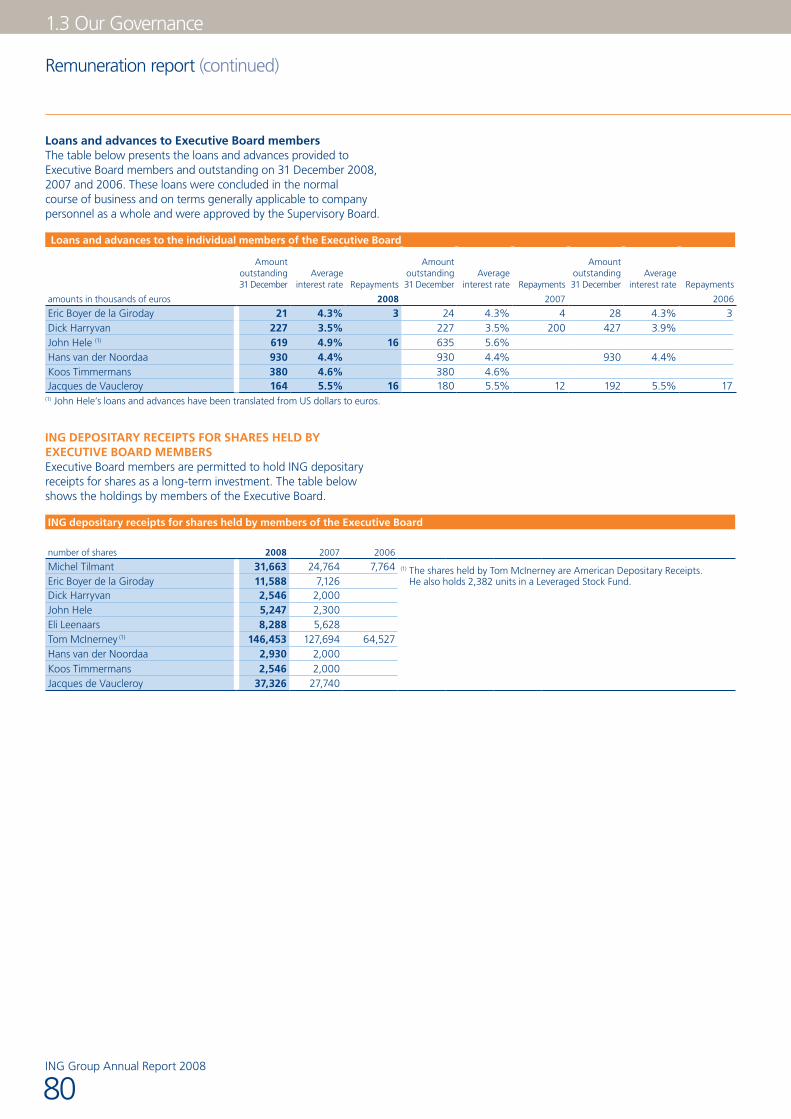
ING Group Annual Report 2008
1.3 Our Governance
80
Loans and advances to Executive Board membersThe table below presents the loans and advances provided to Executive Board members and outstanding on 31 December 2008, 2007 and 2006. These loans were concluded in the normal course of business and on terms generally applicable to company personnel as a whole and were approved by the Supervisory Board.
Loans and advances to the individual members of the Executive Board
Amount outstanding 31 December
Average interest rate Repayments
Amount outstanding 31 December
Average interest rate Repayments
Amount outstanding 31 December
Average interest rate Repayments
amounts in thousands of euros 2008 2007 2006
Eric Boyer de la Giroday 21 4.3% 3 24 4.3% 4 28 4.3% 3Dick Harryvan 227 3.5% 227 3.5% 200 427 3.9%John Hele (1) 619 4.9% 16 635 5.6%Hans van der Noordaa 930 4.4% 930 4.4% 930 4.4%Koos Timmermans 380 4.6% 380 4.6%Jacques de Vaucleroy 164 5.5% 16 180 5.5% 12 192 5.5% 17
(1) John Hele’s loans and advances have been translated from US dollars to euros.
ING DEPOSITARY RECEIPTS fOR SHARES HELD BY EXECUTIVE BOARD MEMBERSExecutive Board members are permitted to hold ING depositary receipts for shares as a long-term investment. The table below shows the holdings by members of the Executive Board.
ING depositary receipts for shares held by members of the Executive Board
number of shares 2008 2007 2006
Michel Tilmant 31,663 24,764 7,764 (1) The shares held by Tom McInerney are American Depositary Receipts. He also holds 2,382 units in a Leveraged Stock Fund.Eric Boyer de la Giroday 11,588 7,126
Dick Harryvan 2,546 2,000John Hele 5,247 2,300Eli Leenaars 8,288 5,628Tom McInerney (1) 146,453 127,694 64,527Hans van der Noordaa 2,930 2,000Koos Timmermans 2,546 2,000Jacques de Vaucleroy 37,326 27,740
Remuneration report (continued)

ING Group Annual Report 2008
81
EXECUTIVE BOARD REMUNERATION STRUCTURE 2009In October 2008, ING reached an agreement with the Dutch State to strengthen its capital position. Under the terms of the agreement, the ING Supervisory Board will review the remuneration policy for the Executive Board and senior management to align it with new international standards. This will include linking incentive schemes to long-term value creation and risk.
The Supervisory Board has taken notice of the preliminary recommendations published by some financial authorities and will continue to monitor developments in this area. For ING as a global company it is essential to work from one set of global recommendations. As soon as international standards are determined ING will review and amend the current remuneration policy as appropriate. Any changes to the remuneration policy will require approval by the annual General Meeting. The reviewed remuneration policy is expected to be proposed to the General Meeting in 2010 and to be effective as of compensation year 2010.
In December 2008, the Monitoring Committee Dutch Corporate Governance Code (the ‘Frijns Committee’) published an updated and revised version of the Tabaksblat Code in its definitive form; a proposal thereto was disclosed for consultation purposes in June 2008. The revised Tabaksblat Code became effective as of 1 January 2009. ING Group is now considering the implications of the revised Tabaksblat Code on the remuneration policy and to what extent these can be implemented. As recommended by the Frijns Committee, the implementation of the revised Tabaksblat Code will be discussed in the 2010 General Meeting as a separate agenda item.
Policy for 2009With regard to the remuneration policy for 2009, the Supervisory Board continues to build upon the remuneration policy initiated in 2003. In January 2009, ING and the Dutch State reached an agreement on an Illiquid Assets Back-up Facility (‘Back-up Facility’). Under the terms of this agreement members of the Executive Board will not receive any bonuses until a reviewed remuneration policy has been completed. The remuneration policy will, among other things, include objectives relating to corporate and social responsibility.
Executive Board base salary 2009For 2009 base salary levels will be frozen.
Executive Board short-term incentive plan 2009Under the terms of the Illiquid Assets Back-up Facility agreed with the Dutch State in January 2009, the individual Executive Board members will not receive a 2009 short-term incentive.
Executive Board long-term incentive plan 2009Under the terms of the Illiquid Assets Back-up Facility agreed with the Dutch State in January 2009, the individual Executive Board members will not receive a 2009 long-term incentive award.
REMUNERATION SUPERVISORY BOARDRemunerationThe annual remuneration of the Supervisory Board members amounts to: chairman EUR 75,000, vice-chairman EUR 65,000, other members EUR 45,000. In addition to the remuneration each member receives an expense allowance. For the chairman and vice-chairman the annual amount is EUR 6,810. For the other members the amount is EUR 2,270.
The remuneration for the membership of committees is as follows: chairman of the Audit Committee EUR 8,000, members of the Audit Committee EUR 6,000, chairmen of other Supervisory Board committees EUR 7,500 and members of other Supervisory Board committees EUR 5,000. In addition to the fixed remuneration, committee members receive a fee for each meeting they attend. For the Audit Committee chairman this fee is EUR 2,000 per meeting and for its members EUR 1,500. For the chairman and members of other committees the attendance fee amounts to EUR 450 per meeting. The remuneration and the attendance fee for the membership of a committee are not applicable to the chairman and vice-chairman of the Supervisory Board if they are on one of the committees.
Supervisory Board members receive an additional fee of EUR 2,000 per attended Supervisory Board or Committee meeting in the event the meeting is held outside the country of residence of the Supervisory Board member, or an additional amount of EUR 7,500 per attended Supervisory Board or Committee meeting if intercontinental travel is required for attending the meeting.

ING Group Annual Report 2008
1.3 Our Governance
82
The table below shows the remuneration, expense allowances and attendance fees per Supervisory Board member for 2008 and previous years.
Compensation of the members of the Supervisory Board
amounts in thousands of euros 2008 2007 2006
Jan Hommen (1) 89 67 57 (1) Jan Hommen is a member of the Supervisory Board as of June 2005 and chairman as of January 2008.
(2) Eric Bourdais de Charbonnière is a member of the Supervisory Board as of April 2004 and vice-chairman as of February 2005.
(3) Henk Breukink is a member of the Supervisory Board as of April 2007. The compensation figure for 2007 reflects the partial year as member of the Supervisory Board.
(4) Peter Elverding is a member of the Supervisory Board as of August 2007. The compensation figure for 2007 reflects the partial year as member of the Supervisory Board.
(5) Piet Hoogendoorn is a member of the Supervisory Board as of June 2007. The compensation figure for 2007 reflects the partial year as member of the Supervisory Board.
(6) Piet Klaver is a member of the Supervisory Board as of April 2006. The compensation figure for 2006 reflects the partial year as member of the Supervisory Board.
(7) Harish Manwani, Aman Mehta, Joan Spero and Jackson Tai are members of the Supervisory Board as of April 2008. The compensation figure for 2008 reflects the partial year as members of the Supervisory Board.
(8) Luella Gross Goldberg retired in April 2008. The compensation figure for 2008 reflects the partial year as member of the Supervisory Board.
Eric Bourdais de Charbonnière (2) 89 72 70Henk Breukink (3) 61 35Peter Elverding (4) 68 20Claus Dieter Hoffmann 67 62 56Piet Hoogendoorn (5) 70 28Piet Klaver (6) 62 47 33Wim Kok 75 62 51Godfried van der Lugt 70 62 56Harish Manwani (7) 51Aman Mehta (7) 62Joan Spero (7) 55Jackson Tai (7) 89Karel Vuursteen 62 56 43Luella Gross Goldberg (8) 16 60 52
Lodewijk de Waal is nominated for appointment as a member of the Supervisory Board at the General Meeting in 2009. Under the terms of the agreement reached with the Dutch State in October 2008 to strengthen ING’s capital position, and anticipating his appointment in 2009, he has been acting as an observer in the Supervisory Board as from November 2008. Lodewijk de Waal has received remuneration, expense allowances and attendance fees in line with the Remuneration policy of the Supervisory Board.
Compensation of former members of the Supervisory Board who are not included in the above table amounted to nil in 2008, to EUR 102 thousand in 2007, and to EUR 160 thousand in 2006.
Loans and advances to Supervisory Board membersAs at 31 December 2008, 2007 and 2006, there were no loans and advances outstanding to members of the Supervisory Board.
ING depositary receipts for shares and options held by Supervisory Board membersSupervisory Board members are permitted to hold ING depositary receipts for shares as a long-term investment. The table below shows the holdings by members of the Supervisory Board. Supervisory Board members did not hold ING options at year-end 2008.
ING depositary receipts for shares and options held by members of the Supervisory Board
number of shares 2008 2007 2006
Piet Klaver 7,430 7,430 5,430 (1) Luella Gross Goldberg retired in April 2008. The shares held by her are American Depositary Receipts.Karel Vuursteen 1,510 1,510 1,510
Luella Gross Goldberg (1) 6,814 6,814
Remuneration report (continued)

ING Group Annual Report 2008
83
Central Works CounCilas at 1 January 2009
Rob Eijt, chairmanPaul de Widt, secretaryBernard Wempe, deputy chairmanRené van der Linden, deputy secretaryGoof Bode, Bernardt Bodt, Hans de Boer, Ron Brands, Anneke Dalger, Petra Delhez, Rudi van Doorn, Petra Hartendorp, Winie den Hartog, Thea van der Heide, Piet Hoekstra, Alex Hoogendoorn, Aad Kant, Maarten Kramer, Rinus Koster, Peter van Oord, Gerrit Riphagen, Frans Rose, Rob de Winter, Peter van Weissenbruch, Paul Zoet.
european Works CounCilas at 1 January 2009
Mathieu Blondeel, chairman, BelgiumMarcel Koopman, secretary, the NetherlandsNorbert Lucas, deputy chairman, GermanyGerlinde Korterink, deputy secretary, the NetherlandsWerner Fözö, AustriaJean-Claude Van Den Abeele, Leo D Antuono, Jean Pierre Lambert, BelgiumKaloyan Marinov, BulgariaLenka Mysakova, Czech RepublicMourad Benzaaza, FranceCarolin Simonis, GermanyNikolaos Ploumis, GreeceCsilla Dobos, HungaryMarta Gasparoli, ItalyArsène Kihm, LuxembourgBernard Bodt, Jeffrey Dinsbach, Thea van der Heide, Dave Kooijman, Maarten Kramer, Robert Milewski, Gerrit Riphagen, Bernard Wempe, Jelte Wiersinga, Paul Zoet, the NetherlandsMieczyslaw Bielawski, Mariusz Cieslik, Jakub Dzianowicz, PolandMihai Ailincai, Ane-Mona Giurgiteanu, RomaniaAna Baron, Araceli Rodriguez, SpainSam Chaudhuri, Rina Goldenberg, United Kingdom
Works councils

2.1 Consolidated annual accounts
Consolidated balance sheet of ING Groupas at 31 December
amounts in millions of euros 2008 2007
ASSETSCash and balances with central banks 1 22,045 12,406Amounts due from banks 2 48,447 48,875Financial assets at fair value through profit and loss 3– trading assets 160,378 193,213– investments for risk of policyholders 95,366 114,827– non-trading derivatives 16,484 7,637– designated as at fair value through profit and loss 8,277 11,453Investments 4– available-for-sale 242,852 275,897– held-to-maturity 15,440 16,753Loans and advances to customers 5 619,791 552,964Reinsurance contracts 17 5,797 5,874Investments in associates 6 4,355 5,014Real estate investments 7 4,300 4,829Property and equipment 8 6,396 6,237Intangible assets 9 6,915 5,740Deferred acquisition costs 10 11,843 10,692Other assets 11 62,977 40,099Total assets 1,331,663 1,312,510
EQUITYShareholders’ equity (parent) 12 17,334 37,208Non-voting equity securities 12 10,000
27,334 37,208Minority interests 1,594 2,323Total equity 28,928 39,531
LIABILITIESPreference shares 13 21Subordinated loans 14 10,281 7,325Debt securities in issue 15 96,488 66,995Other borrowed funds 16 31,198 27,058Insurance and investment contracts 17 240,790 265,712Amounts due to banks 18 152,265 166,972Customer deposits and other funds on deposit 19 522,783 525,216Financial liabilities at fair value through profit and loss 20– trading liabilities 152,616 148,988– non-trading derivatives 21,773 6,951– designated as at fair value through profit and loss 14,009 13,882Other liabilities 21 60,532 43,859Total liabilities 1,302,735 1,272,979
Total equity and liabilities 1,331,663 1,312,510
References relate to the notes starting on page 107. These form an integral part of the consolidated annual accounts.
ING Group Annual Report 2008
84

Consolidated profit and loss account of ING Groupfor the years ended 31 December
amounts in millions of euros 2008 2008 2007 2007 2006 2006
Interest income banking operations 97,011 76,749 59,170Interest expense banking operations –85,969 –67,773 –49,978Interest result banking operations 34 11,042 8,976 9,192Gross premium income 35 43,812 46,818 46,835Investment income 36 4,664 13,352 10,907Net gains/losses on disposals of group companies 17 430 1Gross commission income 7,504 7,693 6,867Commission expense –2,539 –2,866 –2,551Commission income 37 4,965 4,827 4,316Valuation results on non-trading derivatives 38 2,300 –561 89Net trading income 39 –749 1,119 1,172Share of profit from associates 6 –404 740 638Other income 40 644 885 471Total income 66,291 76,586 73,621
Gross underwriting expenditure 41 18,831 51,818 53,065Investment result for risk of policyholders 32,408 –1,079 –2,702Reinsurance recoveries –1,754 –1,906 –2,175Underwriting expenditure 41 49,485 48,833 48,188Addition to loan loss provisions 5 1,280 125 103Intangible amortisation and other impairments 42 464 15 35Staff expenses 43 8,764 8,261 7,918Other interest expenses 44 978 1,102 1,016Other operating expenses 45 6,807 7,207 6,421Total expenses 67,778 65,543 63,681
Result before tax –1,487 11,043 9,940
Taxation 46 –721 1,535 1,907Net result (before minority interests) –766 9,508 8,033
Attributable to:Equityholders of the parent –729 9,241 7,692Minority interests –37 267 341
–766 9,508 8,033
amounts in euros 2008 2007 2006
Basic earnings per ordinary share 47 –0.36 4.32 3.57Earnings – after attribution to non-voting equity securities – per ordinary share 47 –0.56 4.32 3.57Diluted earnings per ordinary share 47 –0.36 4.28 3.53Dividend per ordinary share 48 0.74 1.48 1.32
References relate to the notes starting on page 162. These form an integral part of the consolidated annual accounts.
85ING Group Annual Report 2008

2.1 Consolidated annual accounts
Consolidated statement of cash flows of ING Groupfor the years ended 31 December
amounts in millions of euros 2008 2007 2006
Result before tax –1,487 11,043 9,940Adjusted for – depreciation 1,492 1,382 1,298 – deferred acquisition costs and value of business acquired –444 –1,338 –1,317 – increase in provisions for insurance and investment contracts 16,363 26,494 17,689 – addition to loan loss provisions 1,280 125 103 – other 6,955 –3,897 –4,778Taxation paid –49 –1,347 –1,739Changes in – amounts due from banks, not available on demand 7,162 –8,690 3,117 – trading assets 32,386 2,997 –48,168 – non-trading derivatives –2,020 261 –179 – other financial assets at fair value through profit and loss 3,174 –4,878 3,930 – loans and advances to customers –76,215 –75,501 –59,800 – other assets –11,847 –6,534 1,218 – amounts due to banks, not payable on demand 13,210 15,414 1,925 – customer deposits and other funds on deposit 6,831 28,640 47,521 – trading liabilities 3,501 20,916 38,821 – other financial liabilities at fair value through profit and loss 13,016 44 2,405 – other liabilities –485 6,577 –2,416Net cash flow from operating activities 12,823 11,708 9,570
Investments and advances – group companies –1,725 –3,215 –2,358 – associates –1,034 –1,221 –449 – available-for-sale investments –228,291 –284,006 –295,086 – held-to-maturity investments –314 – real estate investments –905 –876 –1,588 – property and equipment –708 –575 –568 – assets subject to operating leases –1,401 –1,393 –1,164 – investments for risk of policyholders –64,735 –54,438 –44,116 – other investments –881 –316 –250Disposals and redemptions – group companies 1,590 1,012 490 – associates 972 1,049 459 – available-for-sale investments 225,539 281,198 271,983 – held-to-maturity investments 1,640 822 1,343 – real estate investments 415 309 1,294 – property and equipment 137 151 292 – assets subject to operating leases 428 417 402 – investments for risk of policyholders 59,251 47,136 37,945 – other investments 19 13 51Net cash flow from investing activities 51 –10,003 –13,933 –31,320
Proceeds from issuance of subordinated loans 2,721 1,764 865Repayments of subordinated loans –600Proceeds from borrowed funds and debt securities 391,915 455,629 304,228Repayments of borrowed funds and debt securities –354,015 –464,982 –283,728Issuance of ordinary shares 448 397 5Issuance of non-voting equity securities 10,000Payments to acquire treasury shares –2,388 –3,446 –1,422Sales of treasury shares 252 846 373Dividends paid –3,207 –3,039 –2,716Net cash flow from financing activities 45,726 –12,831 17,005
Net cash flow 52 48,546 –15,056 –4,745
Cash and cash equivalents at beginning of year –16,811 –1,795 3,335Effect of exchange rate changes on cash and cash equivalents –464 40 –385Cash and cash equivalents at end of year 53 31,271 –16,811 –1,795
Cash and cash equivalents as at 31 December 2008 of EUR 31,271 million (2007: EUR –16,811 million) includes cash and balances with central banks of EUR 22,045 million (2007: EUR 12,406 million). Reference is made to Note 53 ‘Cash and Cash equivalents’.
References relate to the notes starting on page 179. These form an integral part of the consolidated annual accounts.
ING Group Annual Report 2008
86

Consolidated statement of changes in equity of ING Groupfor the years ended 31 December
amounts in millions of euros Share capital Share premium Reserves
Total shareholders’
equity (parent)
Non-voting equity
securitiesMinority interests Total equity
Balance as at 1 January 2006 530 8,343 27,863 36,736 1,689 38,425
Unrealised revaluations after taxation –1,096 –1,096 –8 –1,104Realised gains/losses transferred to profit and loss –759 –759 –1 –760Changes in cash flow hedge reserve –696 –696 –696Transfer to insurance liabilities/DAC 820 820 –3 817Employee stock option and share plans 100 100 2 102Exchange rate differences –1,335 –1,335 –70 –1,405Total amount recognised directly in equity –2,966 –2,966 –80 –3,046
Net result 7,692 7,692 341 8,0334,726 4,726 261 4,987
Changes in the composition of the group 1,034 1,034Dividends (1) –2,681 –2,681 –35 –2,716Purchase/sale of treasury shares –520 –520 –520Exercise of warrants and options 5 5 5Balance as at 31 December 2006 530 8,348 29,388 38,266 2,949 41,215
Unrealised revaluations after taxation –1,135 –1,135 –109 –1,244Realised gains/losses transferred to profit and loss –3,186 –3,186 –3,186Changes in cash flow hedge reserve –925 –925 –925Transfer to insurance liabilities/DAC 1,132 1,132 5 1,137Employee stock option and share plans 104 104 104Exchange rate differences (3) –1,381 –1,381 23 –1,358Other revaluations 31 31Total amount recognised directly in equity –5,391 –5,391 –50 –5,441
Net result 9,241 9,241 267 9,5083,850 3,850 217 4,067
Changes in the composition of the group –745 –745Dividends (2) –2,999 –2,999 –40 –3,039Purchase/sale of treasury shares –2,304 –2,304 –2,304Exercise of warrants and options 4 391 395 395Change in minority interest shareholdings –58 –58Balance as at 31 December 2007 534 8,739 27,935 37,208 2,323 39,531
Unrealised revaluations after taxation –18,437 –18,437 –48 –18,485Realised gains/losses transferred to profit and loss 2,476 2,476 2,476Changes in cash flow hedge reserve 746 746 746Transfer to insurance liabilities/DAC 2,193 2,193 2,193Employee stock option and share plans 31 31 31Issuance costs incurred –20 –20 –20Exchange rate differences (3) –952 –952 –134 –1,086Other revaluations –23 –23Total amount recognised directly in equity –13,963 –13,963 –205 –14,168
Net result –729 –729 –37 –766 –14,692 –14,692 –242 –14,934
Issue of non-voting equity securities 10,000 10,000Changes in the composition of the group –455 –455Dividends (4) –3,600 –3,600 –32 –3,632Purchase/sale of treasury shares –44 –1,986 –2,030 –2,030Exercise of warrants and options 5 443 448 448Balance as at 31 December 2008 495 9,182 7,657 17,334 10,000 1,594 28,928
87ING Group Annual Report 2008

2.1 Consolidated annual accounts
(1) 2005 final dividend of EUR 0.64 per ordinary share and 2006 interim dividend of EUR 0.59 per ordinary share. (2) 2006 final dividend of EUR 0.73 per ordinary share and 2007 interim dividend of EUR 0.66 per ordinary share. (3) Exchange rate differences include Exchange rate differences for the year of EUR –952 million (2007: EUR –1,153 million; 2006: EUR –1,335 million) and Realised
gains/losses transferred to profit and loss of nil (2007: EUR –228 million; 2006: nil). Reference is made to Note 12 ‘Shareholders’ equity/non-voting equity securities’.
(4) 2007 final dividend of EUR 0.82 per ordinary share, 2008 interim dividend of EUR 0.74 per ordinary share and EUR 0.425 per non-voting equity security.
In 2008, deferred taxes for the year with regard to unrealised revaluations amounted to EUR 5,381 million (2007: EUR 1,451 million). For details on deferred tax see Note 21 ‘Other liabilities’.
Reserves include Revaluation reserve of EUR –8,502 million (2007: EUR 4,937 million; 2006: EUR 9,453 million), Currency translation reserve of EUR –1,918 million (2007: EUR –1,354 million; 2006: EUR –473 million) and Other reserves of EUR 18,077 million (2007: EUR 24,352 million; 2006: EUR 20,408 million). Changes in individual components are presented in Note 12 ‘Shareholders’ equity (parent)/ non-voting equity securities’.
Consolidated statement of changes in equity of ING Group (continued)
ING Group Annual Report 2008
88

Accounting policies for the consolidated balance sheet and profit and loss account of ING Group
AUTHORISATION OF ANNUAL ACCOUNTS The consolidated annual accounts of ING Groep N.V. (‘ING Group’) for the year ended 31 December 2008 were authorised for issue in accordance with a resolution of the Executive Board on 16 March 2009. ING Groep N.V. is incorporated and domiciled in Amsterdam, the Netherlands. The principal activities of ING Group are described in the section ‘ING at a glance’ in section 1.1.
BASIS OF PRESENTATIONING Group applies International Financial Reporting Standards as adopted by the European Union (‘EU’).
The following standards and interpretations became effective in 2008: International Financial Reporting Interpretation Committee (IFRIC) 12 ‘Service Concession Arrangements’, IFRIC 14 ‘IAS 19 – The Limit of a Defined Benefit Asset, Minimum Funding Requirements and their Interaction’ and ‘Reclassification of Financial Assets: Amendments to IAS 39 Financial Instruments: Recognition and Measurement and IFRS 7 Financial Instruments: Disclosures’. None of these recently issued standards and interpretations has had a material effect on equity or result for the year.
The following new and revised standards and interpretations were issued by the IASB, which become effective for ING Group as of 2009 (unless otherwise indicated):
Amendment to IFRS 1 ‘First-time adoption of IFRS’ (effective as of 2010)•Amendment to IFRS 2 ‘Share-based Payments’ – ‘Vesting Conditions and Cancellations’•IFRS 3 ‘Business Combinations’ (revised) and IAS 27 ‘Consolidated and Separate Financial Statements’ (amended) (effective as of 2010)•IFRS 8 ‘Operating Segments’•IAS 1 ‘Presentation of Financial Statements’•IAS 23 ‘Borrowing Costs’• Amendments to IAS 32 ‘Financial Instruments: Presentation’ and IAS 1 ‘Presentation of Financial Statements’ – ‘Puttable Financial •Instruments and Obligations Arising on Liquidation’ Amendments to IFRS 1 ‘First-time Adoption of IFRS’ and IAS 27 ‘Consolidated and Separate Financial Statements’ – Determining •the cost of an Investment in the Separate Financial Statements’Amendment to IAS 39 ‘Financial Instruments: Recognition and Measurement’ – ‘Eligible Hedged Items’ (effective as of 2010)•IFRIC 13 ‘Customer Loyalty Programmes’•IFRIC 15 ‘Agreements for the Construction of Real Estate’•IFRIC 16 ‘Hedges of a Net Investment in a Foreign Operation’•2008 Annual Improvements to IFRS•IFRIC 17 ‘Distributions of Non-cash Assets to Owners’ (effective as of 2010)•IFRIC 18 ‘Transfers of Assets from Customers’ (effective as of 2010)•Amendment to IFRS 7 ‘Improving Disclosures about Financial Instruments’•Amendments to IFRIC 9 and IAS 39 – ‘Embedded Derivatives’.•
ING Group does not expect the adoption of these new or revised standards and interpretations to have a significant effect on the consolidated financial statements.
International Financial Reporting Standards as adopted by the EU provide several options in accounting policies. ING Group’s accounting policies under International Financial Reporting Standards, as adopted by the EU and its decision on the options available, are set out in the section ‘Principles of valuation and determination of results’ below.
In this document the term ‘IFRS-EU’ is used to refer to International Financial Reporting Standards as adopted by the EU, including the decisions ING Group made with regard to the options available under International Financial Reporting Standards as adopted by the EU.
As explained in the section ‘Principles of valuation and determination of results’ and in Note 23 ‘Derivatives and hedge accounting’ ING Group applies fair value hedge accounting to portfolio hedges of interest rate risk (macro hedging) under the EU ‘carve out’ of IFRS-EU.
The presentation of, and certain terms used in, the consolidated balance sheet, the consolidated profit and loss account, consolidated statement of cash flows, consolidated statement of changes in equity and certain notes has been changed to provide additional and more relevant information.
CRITICAL ACCOUNTING POLICIESING Group has identified the accounting policies that are most critical to its business operations and to the understanding of its results. These critical accounting policies are those which involve the most complex or subjective decisions or assessments, and relate to insurance provisions and deferred acquisition costs, the loan loss provision, the determination of the fair values of real estate, financial assets and liabilities, impairments and employee benefits. In each case, the determination of these items is fundamental to the financial condition and results of operations, and requires management to make complex judgements based on information and financial data that may change in future periods. As a result, determinations regarding these items necessarily involve the use of assumptions and subjective judgements as to future events and are subject to change, as the use of different assumptions or data could produce materially different results. For a further discussion of the application of these accounting policies, reference is made to the applicable notes to the consolidated financial statements and the information below under ‘Principles of valuation and determination of results’.
89ING Group Annual Report 2008

2.1 Consolidated annual accounts
INSURANCE PROVISIONS, DEFERRED ACQUISITION COSTS (DAC) AND VALUE OF BUSINESS ACQUIRED (VOBA)The establishment of insurance provisions, DAC and VOBA is an inherently uncertain process, involving assumptions about factors such as court decisions, changes in laws, social, economic and demographic trends, inflation, investment returns, policyholder behaviour and other factors, and, in the life insurance business, assumptions concerning mortality and morbidity trends. Specifically, significant assumptions related to these items that could have a material impact on financial results include interest rates, mortality, morbidity, property and casualty claims, investment yields on equity and real estate, foreign currency exchange rates and reserve adequacy assumptions.
The use of different assumptions about these factors could have a material effect on insurance provisions and underwriting expense. Changes in assumptions may lead to changes in the insurance provisions over time. Furthermore, some of these assumptions can be volatile.
In addition, the adequacy of insurance provisions, net of DAC and VOBA, is evaluated regularly. The test involves comparing the established insurance provision with current best estimate assumptions about factors such as court decisions, changes in laws, social, economic and demographic trends, inflation, investment returns, policyholder behaviour and other factors, and mortality and morbidity trends. The use of different assumptions in this test could lead to a different outcome.
Insurance provisions also include the impact of minimum guarantees which are contained within certain variable annuity products. This impact is dependent upon the difference between the potential minimum benefits payable and the total account balance, expected mortality and surrender rates. The determination of the potential minimum benefits payable also involves the use of assumptions about factors such as inflation, investment returns, policyholder behaviour, and mortality and morbidity trends. The use of different assumptions about these factors could have a material effect on insurance provisions and underwriting expense.
The process of defining methodologies and assumptions for insurance provisions, DAC and VOBA is governed by ING Insurance risk management governance as described in the ‘Risk management’ section.
See the ‘Risk management’ section for a sensitivity analysis of net result and shareholders’ equity to insurance, interest rate, equity, foreign currency and real estate risks. These sensitivities are based on changes in assumptions that management considers reasonably likely at the balance sheet date.
LOAN LOSS PROVISIONSLoan loss provisions are recognised based on an incurred loss model. Considerable judgement is exercised in determining the extent of the loan loss provision (impairment) and is based on the management’s evaluation of the risk in the portfolio, current economic conditions, loss experience in recent years and credit, industry and geographical concentration trends. Changes in such judgements and analyses may lead to changes in the loan loss provisions over time.
The identification of impairment and the determination of the recoverable amount are an inherently uncertain process involving various assumptions and factors including the financial condition of the counterparty, expected future cash flows, observable market prices and expected net selling prices.
Future cash flows in a portfolio of financial assets that are collectively evaluated for impairment are estimated on the basis of the contractual cash flows of the assets in the portfolio and historical loss experience for assets with credit risk characteristics similar to those in the portfolio. Historical loss experience is adjusted on the basis of current observable data to reflect the effects of current conditions that did not affect the period on which the historical loss experience is based and to remove the effects of conditions in the historical period that do not exist currently. Current observable data may include changes in unemployment rates, property prices and commodity prices. The methodology and assumptions used for estimating future cash flows are reviewed regularly to reduce any differences between loss estimates and actual loss experience.
FAIR VALUES OF REAL ESTATEReal estate investments are reported at fair value; all changes in fair value are recognised directly in the profit and loss account. The fair value of real estate investments is based on regular appraisals by independent qualified valuers. The fair values represent the estimated amount for which the property could be exchanged on the date of valuation between a willing buyer and willing seller in an at-arm’s-length transaction after proper marketing wherein the parties each acted knowledgeably, prudently and without compulsion. The valuations are based on the assumption that the properties are let and sold to third parties based on the actual letting status. The valuations are based on discounted cash flow analysis of each property. The discounted cash flow analyses are based on calculations of the future rental income in accordance with the terms in existing leases and estimations of the rental values when leases expire.
For each reporting period every property is valued either by an independent valuer or internally. Indexation is used when a property is valued internally. The index is based on the results of the independent valuations carried out in that period. Market transactions and disposals are monitored as part of the procedures to back test the indexation methodology. Valuations performed earlier in the year are updated if necessary to reflect the situation at year end.
Accounting policies for the consolidated balance sheet and profit and loss account of ING Group (continued)
ING Group Annual Report 2008
90

The valuation of real estate involves various assumptions and techniques. The use of different assumptions and techniques could produce significantly different revaluations.
FAIR VALUES OF FINANCIAL ASSETS AND LIABILITIESFair values of financial assets and liabilities are determined using quoted market prices where available. Market prices are obtained from independent market vendors, brokers, or market makers. In general, positions are valued taking the bid price for a long position and the offer price for a short position. In some cases where positions are marked at mid-market prices, a fair value adjustment is calculated.
In certain markets that have become significantly less liquid or illiquid, the range of prices for the same security from different price sources can be significant. Selecting the most appropriate price within this range requires judgement. The choice of different prices could produce materially different estimates of fair value.
For certain financial assets and liabilities quoted market prices are not available. For these financial assets and liabilities, fair value is determined using valuation techniques. These valuation techniques range from discounting of cash flows to valuation models, where relevant pricing factors including the market price of underlying reference instruments, market parameters (volatilities, correlations, credit ratings) and customer behaviour are taken into account. All valuation techniques used are subject to internal review and approval. Most data used in these valuation techniques are validated on a daily basis.
Valuation techniques are subjective in nature and significant judgement is involved in establishing fair values for certain financial assets and liabilities. Valuation techniques involve various assumptions regarding pricing factors. The use of different valuation techniques and assumptions could produce materially different estimates of fair value.
Price testing is performed to assess whether the process of valuation has led to an appropriate fair value of the position and to an appropriate reflection of these valuations in the profit and loss account. Price testing is performed to minimise the potential risks for economic losses due to materially incorrect or misused models.
Certain asset backed securities in the Unites States are valued using external price sources that are obtained from third party pricing services and brokers. During 2008 the markets for these assets have become inactive and as a result, the dispersion between different prices for the same security is significant. In such cases, management applies additional processes to select the most appropriate external price, including an internally developed price validation matrix and a process to challenge the price source. The valuation of these portfolios would have been significantly different had different prices been selected.
See Note 33 ‘Fair value of financial assets and liabilities’ for the basis of the determination of the fair value of financial instruments and related sensitivities.
IMPAIRMENTSImpairment evaluation is a complex process that inherently involves significant judgements and uncertainties that may have a material impact on the ING Group’s consolidated financial statements. Impairments are especially relevant in two areas: Available-for-sale debt and equity securities and Goodwill/Intangible assets.
All debt and equity securities (other than those carried at fair value through profit or loss) are subject to impairment testing every reporting period. The carrying value is reviewed in order to determine whether an impairment loss has been incurred. Evaluation for impairment includes both quantitative and qualitative considerations. For debt securities, such considerations include actual and estimated incurred credit losses indicated by payment default, market data on (estimated) incurred losses and other current evidence that the issuer may be unlikely to pay amounts when due. Equity securities are impaired when management believes that, based on (the combination of) a significant or prolonged decline of fair value below the acquisition price, there is sufficient reason to believe that the acquisition cost may not be recovered. ‘Significant’ and ‘prolonged’ are interpreted on a case-by-case basis for specific equity securities; generally 25% and 6 months are used as triggers.
Upon impairment, the full difference between amortised cost and fair value is removed from equity and recognised in net profit or loss. Impairments on debt securities may be reversed if there is a decrease in the amount of the impairment which can be objectively related to an observable event. Impairments on equity securities may not be reversed.
Impairments on other debt instruments (Loans and held-to-maturity investments) are part of the loan loss provision as described above.
Impairment reviews with respect to goodwill and intangible assets are performed at least annually, and more frequently if events indicate that an impairment may have occurred. Goodwill is tested for impairment by comparing the book value (including goodwill) to the best estimate of the fair value of the reporting unit to which the goodwill has been allocated. A reporting unit is the lowest level at which goodwill is monitored. Intangible assets are tested for impairment by comparing its book value with the best estimate of its recoverable amount.
91ING Group Annual Report 2008
2.1 Consolidated annual accounts
The identification of impairment is an inherently uncertain process involving various assumptions and factors, including financial condition of the counterparty, expected future cash flows, statistical loss data, discount rates, observable market prices, etc. Estimates and assumptions are based on management’s judgement and other information available prior to the issuance of the financial statements. Materially different results can occur as circumstances change and additional information becomes known.
EMPLOYEE BENEFITSGroup companies operate various defined benefit retirement plans covering a significant number of ING’s employees.
The liability recognised in the balance sheet in respect of the defined benefit pension plans is the present value of the defined benefit obligation at the balance sheet date less the fair value of the plan assets, together with adjustments for unrecognised actuarial gains and losses, and unrecognised past service costs.
The determination of the defined benefit plan liability is based on internal and external actuarial models and calculations. The defined benefit obligation is calculated using the projected unit credit method. Inherent in these actuarial models are assumptions including discount rates, rates of increase in future salary and benefit levels, mortality rates, trend rates in health care costs, consumer price index, and the expected return on plan assets. The assumptions are based on available market data and the historical performance of plan assets, and are updated annually.
The actuarial assumptions may differ significantly from the actual results due to changes in market conditions, economic and mortality trends, and other assumptions. Any changes in these assumptions could have a significant impact on the defined benefit plan liabilities and future pension costs. The effects of changes in actuarial assumptions and experience adjustments are not recognised in the profit and loss account unless the accumulated changes exceed 10% of the greater of the defined benefit obligation and the fair value of the plan assets and the excess is then amortised over the employees’ expected average remaining working lives. See Note 21 ‘Other liabilities’ for the weighted averages of basic actuarial assumptions in connection with pension and other post-employment benefits.
PRINCIPLES OF VALUATION AND DETERMINATION OF RESULTSCONSOLIDATIONING Group (‘the Group’) comprises ING Groep N.V. (‘the Company’), ING Verzekeringen N.V., ING Bank N.V. and all other subsidiaries. The consolidated financial statements of ING Group comprise the accounts of ING Groep N.V. and all entities in which it either owns, directly or indirectly, more than half of the voting power or over which it has control of their operating and financial policies through situations including, but not limited to:
Ability to appoint or remove the majority of the board of directors;•Power to govern such policies under statute or agreement; and•Power over more than half of the voting rights through an agreement with other investors.•
A list of principal subsidiaries is included in Note 28 ‘Principal subsidiaries’.
The existence and effect of potential voting rights that are currently exercisable or convertible are considered in assessing whether the Group controls another entity. For interests in investment vehicles the existence of control is determined taking into account both ING’s financial interests for own risk and its role as investment manager.
The results of the operations and the net assets of subsidiaries are included in the profit and loss account and the balance sheet from the date control is obtained until the date control is lost. On disposal, the difference between the sales proceeds, net of directly attributable transaction costs, and the net assets is included in net result.
A subsidiary which ING Group has agreed to sell but is still legally owned by ING Group may still be controlled by ING Group at the balance sheet date and, therefore, still be included in the consolidation. Such a subsidiary may be presented as a held for sale disposal group if certain conditions are met. Disposal groups (and Non-current assets) are classified as held for sale if their carrying amount will be recovered principally through a sale transaction rather than through continuing use. This condition is regarded as met only when the sale is highly probable and the disposal group (or asset) is available for immediate sale in its present condition; management must be committed to the sale, which should be expected to occur within one year from the date of classification as held for sale.
All intercompany transactions, balances and unrealised surpluses and deficits on transactions between group companies have been eliminated. Where necessary, the accounting policies used by subsidiaries have been changed to ensure consistency with group policies. In general, the reporting dates of subsidiaries are the same as the reporting date of ING Groep N.V.
Accounting policies for the consolidated balance sheet and profit and loss account of ING Group (continued)
ING Group Annual Report 2008
92

ING Group’s interests in jointly controlled entities are accounted for using proportionate consolidation. ING Group proportionately consolidates its share of the joint ventures’ individual income and expenses, assets and liabilities, and cash flows on a line-by-line basis with similar items in ING Group’s financial statements. ING Group recognises the portion of gains or losses on the sale of assets to the joint venture that is attributable to the other venturers. ING Group does not recognise its share of profits or losses from the joint venture that results from the purchase of assets by ING Group from the joint venture until it resells the assets to an independent party. However, if a loss on the transaction provides evidence of a reduction in the net realisable value of current assets or an impairment loss, the loss is recognised immediately.
USE OF ESTIMATES AND ASSUMPTIONSThe preparation of the consolidated financial statements necessitates the use of estimates and assumptions. These estimates and assumptions affect the reported amounts of the assets and liabilities and the amounts of the contingent liabilities at the balance sheet date, as well as reported income and expenses for the year. The actual outcome may differ from these estimates.
The process of setting assumptions is subject to internal control procedures and approvals, and takes into account internal and external studies, industry statistics, environmental factors and trends, and regulatory requirements.
SEGMENTAL REPORTINGA business segment is a distinguishable component of the Group engaged in providing products or services that is subject to risks and returns that are different from those of other business segments. A geographical segment is a distinguishable component of the Group engaged in providing products or services within a particular economic environment that is subject to risks and returns that are different from those of segments operating in other economic environments. The geographical analyses are based on the location of the office from which the transactions are originated. The business lines of the Group are the business segments and the primary segment reporting format. The geographical segments are considered the secondary.
ANALYSIS OF INSURANCE BUSINESSWhere amounts in respect of insurance business are analysed into ‘life’ and ‘non-life’, health and disability insurance business which is similar in nature to life insurance business is included in ‘life’.
FOREIGN CURRENCY TRANSLATIONFunctional and presentation currencyItems included in the financial statements of each of the Group’s entities are measured using the currency of the primary economic environment in which the entity operates (‘the functional currency’). The consolidated financial statements are presented in euros, which is the Company’s functional and presentation currency.
Transactions and balancesForeign currency transactions are translated into the functional currency using the exchange rates prevailing at the dates of the transactions. Exchange rate differences resulting from the settlement of such transactions and from the translation at year-end exchange rates of monetary assets and liabilities denominated in foreign currencies are recognised in the profit and loss account, except when deferred in equity as part of qualifying cash flow hedges or qualifying net investment hedges.
Exchange rate differences on non-monetary items, measured at fair value through profit and loss, are reported as part of the fair value gain or loss. Non-monetary items are retranslated at the date fair value is determined. Exchange rate differences on non-monetary items measured at fair value through the revaluation reserve are included in the revaluation reserve in equity.
Exchange rate differences in the profit and loss account are generally included in Net trading income. Refer to Note 39 ‘Net trading income’, which discloses the amounts included in the profit and loss account. Exchange rate differences relating to the disposal of Available-for-sale debt and equity securities are considered to be an inherent part of the capital gains and losses recognised in Investment income. As mentioned in Group companies below any exchange rate differences deferred in equity are recognised in the profit and loss account in Net gains and losses on disposals of group companies. Refer also to Note 12 ‘Shareholders’ equity (parent)/non-voting equity securities’, which discloses the amounts included in the profit and loss account.
Group companiesThe results and financial position of all group companies that have a functional currency different from the presentation currency are translated into the presentation currency as follows:
Assets and liabilities included in each balance sheet are translated at the closing rate at the date of that balance sheet;• Income and expenses included in each profit and loss account are translated at average exchange rates (unless this average is not •a reasonable approximation of the cumulative effect of the rates prevailing on the transaction dates, in which case income and expenses are translated at the dates of the transactions); andAll resulting exchange rate differences are recognised in a separate component of equity.•
93ING Group Annual Report 2008

2.1 Consolidated annual accounts
On consolidation, exchange rate differences arising from the translation of a monetary item that forms part of the net investment in a foreign operation, and of borrowings and other instruments designated as hedges of such investments, are taken to shareholders’ equity. When a foreign operation is sold, these exchange rate differences are recognised in the profit and loss account as part of the gain or loss on sale.
Goodwill and fair value adjustments arising from the acquisition of a foreign operation are treated as assets and liabilities of the foreign operation and translated at the exchange rate prevailing at the balance sheet date.
FAIR VALUES OF FINANCIAL ASSETS AND LIABILITIESThe fair values of financial instruments are based on quoted market prices at the balance sheet date where available. The quoted market price used for financial assets held by the Group is the current bid price; the quoted market price used for financial liabilities is the current ask price.
The fair values of financial instruments that are not traded in an active market are determined using valuation techniques. The Group uses a variety of methods and makes assumptions that are based on market conditions existing at each balance sheet date.
See Note 33 ‘Fair value of financial assets and liabilities’ for the basis of the determination of the fair value of financial instruments.
FINANCIAL ASSETSRecognition of financial assetsAll purchases and sales of financial assets classified as fair value through profit and loss, held-to-maturity and available-for-sale that require delivery within the time frame established by regulation or market convention (‘regular way’ purchases and sales) are recognised at trade date, which is the date on which the Group commits to purchase or sell the asset. Loans and receivables are recognised at settlement date, which is the date on which the Group receives or delivers the asset.
Derecognition of financial assetsFinancial assets are derecognised when the rights to receive cash flows from the financial assets have expired or where the Group has transferred substantially all risks and rewards of ownership. If the Group neither transfers nor retains substantially all the risks and rewards of ownership of a financial asset, it derecognises the financial asset if it no longer has control over the asset. In transfers where control over the asset is retained, the Group continues to recognise the asset to the extent of its continuing involvement. The extent of continuing involvement is determined by the extent to which the Group is exposed to changes in the value of the asset.
Realised gains and losses on investmentsRealised gains and losses on investments are determined as the difference between the sale proceeds and (amortised) cost. For equity securities, the cost is determined using a weighted average per portfolio. For debt securities, the cost is determined by specific identification.
CLASSIFICATION OF FINANCIAL INSTRUMENTSFinancial assets at fair value through profit and lossFinancial assets at fair value through profit and loss include equity securities, debt securities, derivatives, loans and receivables and other, and comprise the following sub-categories: trading assets, non-trading derivatives, financial assets designated at fair value through profit and loss by management and investments for risk of policyholders.
A financial asset is classified as at fair value through profit and loss if acquired principally for the purpose of selling in the short term or if so designated by management. Management will make this designation only if this eliminates a measurement inconsistency or if the related assets and liabilities are managed on a fair value basis.
Investments for risk of policyholders are investments against insurance liabilities for which all changes in fair value of invested assets are offset by similar changes in insurance liabilities. Transaction costs on initial recognition are expensed as incurred. Interest income from debt securities and loans and receivables classified as at fair value through profit and loss is recognised in Interest income from banking operations and Investment income in the profit and loss account, using the effective interest method.
Dividend income from equity instruments classified as at fair value through profit and loss is generally recognised in Investment income in the profit and loss account when dividend has been declared. Investment result from investments for risk of policyholders is recognised in investment result for risk of policyholders. For derivatives reference is made to the ‘Derivatives and hedge accounting’ section. For all other financial assets classified as at fair value through profit and loss changes in fair value are recognised in Net trading income.
Accounting policies for the consolidated balance sheet and profit and loss account of ING Group (continued)
ING Group Annual Report 2008
94

InvestmentsInvestments (including loans quoted in active markets) are classified either as held-to-maturity or available-for-sale and are initially recognised at fair value plus transaction costs. Investment securities and loans quoted in active markets with fixed maturity where management has both the intent and the ability to hold to maturity are classified as held-to-maturity. Investment securities and actively traded loans intended to be held for an indefinite period of time, which may be sold in response to needs for liquidity or changes in interest rates, exchange rates or equity prices, are classified as available-for-sale.
Available-for-sale financial assetsAvailable-for-sale financial assets include available-for-sale debt securities and available-for-sale equity securities. Available-for-sale financial assets are initially recognised at fair value plus transaction costs. For available-for-sale debt securities, the difference between cost and redemption value is amortised. Interest income is recognised using the effective interest method. Available-for-sale financial assets are measured at fair value. Interest income from debt securities classified as available-for-sale is recognised in Interest income from banking operations and Investment income in the profit and loss account using the effective interest method. Dividend income from equity instruments classified as available-for-sale is generally recognised in Investment income in the profit and loss account when the dividend has been declared. Unrealised gains and losses arising from changes in the fair value are recognised in equity. When the securities are disposed of, the related accumulated fair value adjustments are included in the profit and loss account as investment income. For impairments of available-for-sale financial assets reference is made to the section ‘Impairments of other financial assets’. Investments in prepayment sensitive securities such as Interest-Only and Principal-Only strips are generally classified as available-for-sale.
Held-to-maturity investmentsNon-derivative financial assets with fixed or determinable payments and fixed maturity for which the Group has the positive intent and ability to hold to maturity and which are designated as held-to-maturity assets are initially recognised at fair value plus transaction costs. Subsequently, they are carried at amortised cost using the effective interest method less any impairment losses. Interest income from debt securities classified as held-to-maturity is recognised in Interest income in the profit and loss account using the effective interest method. Held-to-maturity investments include only debt securities.
Loans and receivablesLoans and receivables are non-derivative financial assets with fixed or determinable payments that are not quoted in an active market. They are initially recognised at fair value plus transaction costs. Subsequently, they are carried at amortised cost using the effective interest method less any impairment losses. Loans and receivables include: Cash and balances with central banks, Amounts due from banks, Loans and advances to customers and Other assets and are reflected in these balance sheet lines. Interest income from loans and receivables is recognised in Interest income and Investment income in the profit and loss account using the effective interest method.
Credit risk management classificationCredit risk management disclosures are provided in the section ‘Risk management’. The relationship between credit risk classifications in that section and the consolidated balance sheet classifications above is explained below:
Lending risk arises when ING grants a loan to a customer, or issues guarantees on behalf of a customer and mainly relates to the •balance sheet classification Loans and advances to customers and credit commitments in respect of off balance sheet items e.g. financial guarantees; Investment risk comprises the credit default and migration risk that is associated with ING’s investment portfolio and mainly relates •to the balance sheet classification Investments (available-for-sale and held-to-maturity); Money market risk arises when ING places short term deposits with a counterparty in order to manage excess liquidity and mainly •relates to the balance sheet classification Amounts due from banks; Pre-settlement risk arises when a counterparty defaults on a transaction before settlement and ING has to replace the contract by a •trade with another counterparty at the then prevailing (possibly unfavourable) market price. The pre-settlement risk classification mainly relates to the balance sheet classification Financial assets at fair value through profit and loss (trading assets and non-trading derivatives); Settlement risk arises when there is an exchange of value (funds, instruments or commodities) for the same or different value dates and •receipt is not verified or expected until ING has paid or delivered its side of the trade. Settlement risk mainly relates to the balance sheet classification Financial assets at fair value through profit and loss (trading assets and non-trading derivatives) and Investments (available-for-sale and held-to-maturity).
DERIVATIVES AND HEDGE ACCOUNTINGDerivatives are initially recognised at fair value on the date on which a derivative contract is entered into and are subsequently remeasured at fair value. Fair values are obtained from quoted market prices in active markets, including recent market transactions, and valuation techniques (such as discounted cash flow models and option pricing models), as appropriate. All derivatives are carried as assets when their fair value is positive and as liabilities when their fair values are negative.
Some credit protection contracts that take the legal form of a derivative, such as certain credit default swaps, are accounted for as financial guarantees.
95ING Group Annual Report 2008

2.1 Consolidated annual accounts
The method of recognising the resulting fair value gain or loss depends on whether the derivative is designated as a hedging instrument and, if so, the nature of the item being hedged. The Group designates certain derivatives as hedges of the fair value of recognised assets or liabilities or firm commitments (fair value hedge), hedges of highly probable future cash flows attributable to a recognised asset or liability or a forecast transaction (cash flow hedge), or hedges of a net investment in a foreign operation. Hedge accounting is used for derivatives designated in this way provided certain criteria are met.
At the inception of the transaction ING documents the relationship between hedging instruments and hedged items, its risk management objective, together with the methods selected to assess hedge effectiveness. The Group also documents its assessment, both at hedge inception and on an ongoing basis, of whether the derivatives that are used in hedging transactions are highly effective in offsetting changes in fair values or cash flows of the hedged items.
ING Group applies fair value hedge accounting to portfolio hedges of interest rate risk (macro hedging) under the EU ‘carve out’ of IFRS-EU. The EU ‘carve-out’ macro hedging enables a group of derivatives (or proportions) to be viewed in combination and jointly designated as the hedging instrument and removes some of the limitations in fair value hedge accounting relating to hedging core deposits and under-hedging strategies. Under the IFRS-EU ‘carve-out’, hedge accounting may be applied to core deposits and ineffectiveness only arises when the revised estimate of the amount of cash flows in scheduled time buckets falls below the designated amount of that bucket.
ING Group applies fair value hedge accounting for portfolio hedges of interest rate risk (macro hedging) under the EU ‘carve-out’ to its retail operations. The net exposures of retail funding (savings and current accounts) and retail lending (mortgages) are hedged. The hedging activities are designated under a portfolio fair value hedge on the mortgages. Changes in the fair value of the derivatives are recognised in the profit and loss account, together with the fair value adjustment on the mortgages (hedged items) insofar as attributable to interest rate risk (the hedged risk).
Certain derivatives embedded in other contracts are measured as separate derivatives when their economic characteristics and risks are not closely related to those of the host contract, the host contract is not carried at fair value through profit and loss, and if a separate instrument with the same terms as the embedded derivative would meet the definition of a derivative. These embedded derivatives are measured at fair value with changes in fair value recognised in the profit and loss account. An assessment is carried out when the Group first becomes party to the contract. A subsequent reassessment is carried out only when there is a change in the terms of the contract that significantly modifies the expected cash flows.
Fair value hedgesChanges in the fair value of derivatives that are designated and qualify as fair value hedges are recognised in the profit and loss account, together with fair value adjustments to the hedged item attributable to the hedged risk. If the hedge relationship no longer meets the criteria for hedge accounting, the cumulative adjustment of the hedged item is, in the case of interest bearing instruments, amortised through the profit and loss account over the remaining term of the original hedge or recognised directly when the hedged item is derecognised. For non-interest bearing instruments, the cumulative adjustment of the hedged item is recognised in the profit and loss account only when the hedged item is derecognised.
Cash flow hedgesThe effective portion of changes in the fair value of derivatives that are designated and qualify as cash flow hedges are recognised in equity. The gain or loss relating to the ineffective portion is recognised immediately in the profit and loss account. Amounts accumulated in equity are recycled to the profit and loss account in the periods in which the hedged item affects net result. When a hedging instrument expires or is sold, or when a hedge no longer meets the criteria for hedge accounting, any cumulative gain or loss existing in equity at that time remains in equity and is recognised when the forecast transaction is ultimately recognised in the profit and loss account. When a forecast transaction is no longer expected to occur, the cumulative gain or loss that was reported in equity is transferred immediately to the profit and loss account.
Net investment hedgesHedges of net investments in foreign operations are accounted for in a similar way to cash flow hedges. Any gain or loss on the hedging instrument relating to the effective portion of the hedge is recognised in equity and the gain or loss relating to the ineffective portion is recognised immediately in the profit and loss account. Gains and losses accumulated in equity are included in the profit and loss account when the foreign operation is disposed of.
Non-trading derivatives that do not qualify for hedge accountingDerivative instruments that are used by the Group as part of its risk management strategies, but which do not qualify for hedge accounting under the Group’s accounting policies, are presented as non-trading derivatives. Non-trading derivatives are measured at fair value with changes in the fair value taken to the profit and loss account.
Accounting policies for the consolidated balance sheet and profit and loss account of ING Group (continued)
ING Group Annual Report 2008
96
OFFSETTING OF FINANCIAL ASSETS AND FINANCIAL LIABILITIESFinancial assets and financial liabilities are offset, and the net amount reported, in the balance sheet when the Group has a legally enforceable right to set off the recognised amounts and intends to either settle on a net basis or to realise the asset and settle the liability simultaneously.
REPURCHASE TRANSACTIONS AND REVERSE REPURCHASE TRANSACTIONSSecurities sold subject to repurchase agreements (‘repos’) are retained in the consolidated financial statements. The counterparty liability is included in Amounts due to banks, Other borrowed funds or Customer deposits and other funds on deposit, as appropriate.
Securities purchased under agreements to resell (‘reverse repos’) are recognised as Loans and advances to customers or Amounts due from banks, as appropriate. The difference between the sale and repurchase price is treated as interest and amortised over the life of the agreement using the effective interest method.
IMPAIRMENTS OF LOANS AND ADVANCES TO CUSTOMERS (LOAN LOSS PROVISIONS)The Group assesses periodically and at each balance sheet date whether there is objective evidence that a financial asset or group of financial assets is impaired. A financial asset or a group of financial assets is impaired and impairment losses are incurred if, and only if, there is objective evidence of impairment as a result of one or more events that occurred after the initial recognition of the asset, but before the balance sheet date, (a ‘loss event’) and that loss event (or events) has an impact on the estimated future cash flows of the financial asset or group of financial assets that can be reliably estimated. The following circumstances, among others, are considered objective evidence that a financial asset or group of assets is impaired:
The borrower has sought or has been placed in bankruptcy or similar protection and this leads to the avoidance or delays repayment •of the financial asset; The borrower has failed in the repayment of principal, interest or fees and the payment failure has remained unsolved for a certain •period; The borrower has demonstrated significant financial difficulty, to the extent that it will have a negative impact on the expected future •cash flows of the financial asset; The credit obligation has been restructured for non-commercial reasons. ING has granted concessions, for economic or legal reasons •relating to the borrower’s financial difficulty, the effect of which is a reduction in the expected future cash flows of the financial asset; and Historical experience, updated for current events where necessary, provides evidence that a proportion of a group of assets is impaired •although the related events that represent impairment triggers are not yet captured by the Group’s credit risk systems.
The Group does not consider events that may be expected to occur in the future as objective evidence, and consequently they are not used as a basis for concluding that a financial asset or group of assets is impaired.
In determining the impairment, expected future cash flows are estimated on the basis of the contractual cash flows of the assets in the portfolio and historical loss experience for assets with credit risk characteristics similar to those in the portfolio. Historical loss experience is adjusted on the basis of current observable data to reflect the effects of current conditions that did not affect the period on which the historical loss experience is based and to remove the effects of conditions in the historical period that do not currently exist. Losses expected as a result of future events, no matter how likely, are not recognised.
The Group first assesses whether objective evidence of impairment exists individually for financial assets that are individually significant, and then individually or collectively for financial assets that are not individually significant. If the Group determines that no objective evidence of impairment exists for an individually assessed financial asset, whether significant or not, it includes the asset in a group of financial assets with similar credit risk characteristics and collectively assesses them for impairment. Assets that are individually assessed for impairment and for which an impairment loss is or continues to be recognised are not included in a collective assessment of impairment.
If there is objective evidence that an impairment loss on an asset carried at amortised cost has been incurred, the amount of the loss is measured as the difference between the asset’s carrying amount and the present value of estimated future cash flows (excluding future credit losses that have not been incurred) discounted at the financial asset’s original effective interest rate. The carrying amount of the asset is reduced through the use of an allowance account (‘Loan loss provision’) and the amount of the loss is recognised in the profit and loss account under ‘Addition to loan loss provision’. If the asset has a variable interest rate, the discount rate for measuring any impairment loss is the current effective interest rate determined under the contract.
For the purposes of a collective evaluation of impairment, financial assets are grouped on the basis of similar credit risk characteristics. Those characteristics are relevant to the estimation of future cash flows for groups of such assets by being indicative of the debtors’ ability to pay all amounts due according to the contractual terms of the assets being evaluated. The collective evaluation of impairment includes the application of a ‘loss confirmation period’ to default probabilities. The loss confirmation period is a concept which recognises that there is a period of time between the emergence of impairment triggers and the point-in-time at which those events are captured by the Group’s credit risk systems. Accordingly, the application of the loss confirmation period ensures that impairments that are incurred
97ING Group Annual Report 2008
2.1 Consolidated annual accounts
but not yet identified are adequately reflected in the Group’s loan loss provision. Although the loss confirmation periods are inherently uncertain, the Group applies estimates to sub-portfolios (e.g. large corporations, small and medium size enterprises and retail portfolios) that reflect factors such as the frequency with which customers in the sub-portfolio disclose credit risk sensitive information and the frequency with which they are subject to review by the Group’s account managers. Generally, the frequency increases in relation to the size of the borrower. Loss confirmation periods are based on historical experience and are validated, and revised where necessary, through regular back-testing to ensure that they reflect recent experience and current events.
If, in a subsequent period, the amount of the impairment loss decreases and the decrease can be related objectively to an event occurring after the impairment was recognised (such as an improvement in the debtor’s credit rating), the previously recognised impairment loss is reversed by adjusting the provision. The amount of the reversal is recognised in the profit and loss account.
When a loan is uncollectible, it is written off against the related loan loss provision. Such loans are written off after all the necessary procedures have been completed and the amount of the loss has been determined. Subsequent recoveries of amounts previously written off are recognised in the profit and loss account.
IMPAIRMENT OF OTHER FINANCIAL ASSETSAt each balance sheet date, the Group assesses whether there is objective evidence that a financial asset or a group of financial assets is impaired. In the specific case of equity investments classified as available-for-sale, a significant or prolonged decline in the fair value of the security below its cost is considered in determining whether the assets are impaired. ‘Significant’ and ‘prolonged’ are interpreted on a case-by-case basis for specific equity securities; generally 25% and 6 months are used as triggers. If any objective evidence exists for available-for-sale debt and equity investments, the cumulative loss – measured as the difference between the acquisition cost and the current fair value, less any impairment loss on that financial asset previously recognised in net result – is removed from equity and recognised in the profit and loss account. Impairment losses recognised on equity instruments can never be reversed. If, in a subsequent period, the fair value of a debt instrument classified as available-for-sale increases and the increase can be objectively related to an event occurring after the impairment loss was recognised in the profit and loss account, the impairment loss is reversed through the profit and loss account.
INVESTMENTS IN ASSOCIATESAssociates are all entities over which the Group has significant influence but not control. Significant influence generally results from a shareholding of between 20% and 50% of the voting rights, but also is the ability to participate in the financial and operating policies through situations including, but not limited to one or more of the following:
Representation on the board of directors;•Participation in the policymaking process; and•Interchange of managerial personnel.•
Investments in associates are initially recognised at cost and subsequently accounted for using the equity method of accounting.
The Group’s investment in associates (net of any accumulated impairment loss) includes goodwill identified on acquisition. The Group’s share of its associates’ post-acquisition profits or losses is recognised in the profit and loss account, and its share of post-acquisition changes in reserves is recognised in equity. The cumulative post-acquisition changes are adjusted against the carrying amount of the investment. When the Group’s share of losses in an associate equals or exceeds its interest in the associate, including any other unsecured receivables, the Group does not recognise further losses, unless it has incurred obligations or made payments on behalf of the associate.
Unrealised gains on transactions between the Group and its associates are eliminated to the extent of the Group’s interest in the associates. Unrealised losses are also eliminated unless they provide evidence of an impairment of the asset transferred. Accounting policies of associates have been changed where necessary to ensure consistency with the policies adopted by the Group. The reporting dates of all material associates are consistent with the reporting date of the Group.
For interests in investment vehicles the existence of significant influence is determined taking into account both the Group’s financial interests for own risk and its role as investment manager.
REAL ESTATE INVESTMENTSReal estate investments are stated at fair value at the balance sheet date. Changes in the carrying amount resulting from revaluations are recognised in the profit and loss account. On disposal the difference between the sale proceeds and book value is recognised in the profit and loss account.
The fair value of real estate investments is based on regular appraisals by independent qualified valuers. Each year every property is valued either by an independent valuer or internally. Indexation is used when a property is valued internally. The index is based on the results of the independent valuations carried out in that period. Market transactions, and disposals made by the Group, are monitored as part of the procedures to back test the indexation methodology. All properties are valued independently at least every five years.
Accounting policies for the consolidated balance sheet and profit and loss account of ING Group (continued)
ING Group Annual Report 2008
98

PROPERTY AND EQUIPMENTProperty in own useLand and buildings held for own use are stated at fair value at the balance sheet date. Increases in the carrying amount arising on revaluation of land and buildings held for own use are credited to the revaluation reserve in shareholders’ equity. Decreases that offset previous increases of the same asset are charged against the revaluation reserve directly in equity; all other decreases are charged to the profit and loss account. Increases that reverse a revaluation decrease on the same asset previously recognised in net result are recognised in the profit and loss account. Depreciation is recognised based on the fair value and the estimated useful life (in general 20–50 years). Depreciation is calculated on a straight-line basis. On disposal the related revaluation reserve is transferred to retained earnings.
The fair values of land and buildings are based on regular appraisals by independent qualified valuers. Subsequent expenditure is included in the asset’s carrying amount when it is probable that future economic benefits associated with the item will flow to the Group and the cost of the item can be measured reliably.
Property under constructionLand and buildings under construction (including real estate investments) are stated at the directly attributable purchase and construction costs incurred up to the balance sheet date plus borrowing costs incurred during construction and the Group’s own development and supervision expenses, where necessary, less impairment losses.
Property held for saleProperty held for sale comprises properties obtained from foreclosures and property developed for sale for which there is no specifically negotiated contract. These properties are stated at the lower of cost and net realisable value. Cost includes borrowing costs. Net realisable value is the estimated selling price in the ordinary course of business, less applicable variable selling expenses. Where the net realisable value is lower than the carrying amount, the impairment is recognised in the profit and loss account.
Property under development for third partiesProperty under development where there is not yet a specifically negotiated contract is measured at direct construction cost incurred up to the balance sheet date, including borrowing costs incurred during construction and the Group’s own directly attributable development and supervision expenses less any impairment losses. Profit is recognised using the completed contract method (on sale date of the property).
Property under development where there is a specifically negotiated contract is valued using the percentage of completion method (pro rata profit recognition).
EquipmentEquipment is stated at cost less accumulated depreciation and any impairment losses. The cost of the assets is depreciated on a straight line basis over their estimated useful lives, which are generally as follows: for data processing equipment two to five years, and four to ten years for fixtures and fittings. Expenditure incurred on maintenance and repairs is charged to the profit and loss account as incurred. Expenditure incurred on major improvements is capitalised and depreciated.
Assets under operating leasesAssets leased out under operating leases in which ING is the lessor are stated at cost less accumulated depreciation and any impairment losses. The cost of the assets is depreciated on a straight-line basis over the lease term. Reference is made to the section ‘Leases’.
DisposalsThe difference between the proceeds on disposal and net book value is recognised in the profit and loss account.
Borrowing costsBorrowing costs incurred for the construction of any qualifying asset are capitalised during the period of time that is required to complete and prepare the asset for its intended use.
LEASESThe Group as the lesseeThe leases entered into by ING are primarily operating leases. The total payments made under operating leases are charged to the profit and loss account on a straight-line basis over the period of the lease.
When an operating lease is terminated before the lease period has expired, any payment required to be made to the lessor by way of penalty is recognised as an expense in the period in which termination takes place.
99ING Group Annual Report 2008

2.1 Consolidated annual accounts
The Group as the lessorWhen assets are held subject to a finance lease, the present value of the lease payments is recognised as a receivable under Loans and advances to customers or Amounts due from banks. The difference between the gross receivable and the present value of the receivable is unearned lease finance income. Lease income is recognised over the term of the lease using the net investment method (before tax), which reflects a constant periodic rate of return. When assets are held subject to an operating lease, the assets are included under Assets under operating leases.
PURCHASE ACCOUNTING, GOODWILL AND OTHER INTANGIBLE ASSETSGoodwillING Group’s acquisitions are accounted for under the purchase method of accounting, whereby the cost of the acquisitions is allocated to the fair value of the assets, liabilities and contingent liabilities acquired. Goodwill, being the difference between the cost of the acquisition (including assumed debt) and the Group’s interest in the fair value of the acquired assets, liabilities and contingent liabilities as at the date of acquisition, is capitalised as an intangible asset. The results of the operations of the acquired companies are included in the profit and loss account from the date control is obtained.
Goodwill is only capitalised on acquisitions after the implementation date of IFRS-EU (1 January 2004). Accounting for acquisitions before that date has not been restated; goodwill and internally generated intangibles on these acquisitions were charged directly to shareholders’ equity. Goodwill is allocated to reporting units for the purpose of impairment testing. These reporting units represent the lowest level at which goodwill is monitored for internal management purposes. This test is performed annually or more frequently if there are indicators of impairment. Under the impairment tests, the carrying value of the reporting units (including goodwill) is compared to its recoverable amount which is the higher of its fair value less costs to sell and its value in use.
Adjustments to the fair value as at the date of acquisition of acquired assets and liabilities that are identified within one year after acquisition are recognised as an adjustment to goodwill; any subsequent adjustment is recognised as income or expense. However, recognition of deferred tax assets after the acquisition date is recognised as an adjustment to goodwill, even after the first year. On disposal of group companies, the difference between the sale proceeds and book value (including goodwill) and the unrealised results (including the currency translation reserve in equity) is included in the profit and loss account.
Computer softwareComputer software that has been purchased or generated internally for own use is stated at cost less amortisation and any impairment losses. Amortisation is calculated on a straight-line basis over its useful life. This period will generally not exceed three years. Amortisation is included in Other operating expenses.
Value of business acquired (VOBA)VOBA is an asset that reflects the present value of estimated net cash flows embedded in the insurance contracts of an acquired company, which existed at the time the company was acquired. It represents the difference between the fair value of insurance liabilities and their book value. VOBA is amortised in a similar manner to the amortisation of deferred acquisition costs as described in the section ‘Deferred acquisition costs’.
Other intangible assetsOther intangible assets are capitalised and amortised over their expected economic life, which is generally between three and ten years. Intangible assets with an indefinite life are not amortised.
DEFERRED ACQUISITION COSTSDeferred acquisition costs (DAC) are an asset and represent costs of acquiring insurance and investment contracts that are deferred and amortised. The deferred costs, all of which vary with (and are primarily related to) the production of new and renewal business, consist principally of commissions, certain underwriting and contract issuance expenses, and certain agency expenses.
For traditional life insurance contracts, certain types of flexible life insurance contracts, and non-life contracts, DAC is amortised over the premium payment period in proportion to the premium revenue recognised.
For other types of flexible life insurance contracts DAC is amortised over the lives of the policies in relation to the emergence of estimated gross profits. Amortisation is adjusted when estimates of current or future gross profits, to be realised from a group of products, are revised. The estimates and the assumptions are reassessed at the end of each reporting period. For DAC on flexible insurance contracts the approach is that in determining the estimate of future gross profits ING assumes the short-term and long-term separate account growth rate assumption to be the same. Higher/lower expected profits (e.g. reflecting stock market performance or a change in the level of assets under management) may cause a lower/higher amortisation of DAC due to the catch-up of amortisation in previous and future years. This process is known as DAC unlocking. The impact of the DAC unlocking is recognised in the profit and loss account of the period in which the unlocking occurs.
Accounting policies for the consolidated balance sheet and profit and loss account of ING Group (continued)
ING Group Annual Report 2008
100

DAC is evaluated for recoverability at issue. Subsequently it is tested on a regular basis together with the provision for life insurance liabilities and VOBA. The test for recoverability is described in the section ‘Insurance, Investment and Reinsurance Contracts’.
For certain products DAC is adjusted for the impact of unrealised results on allocated investments through equity.
TAXATIONIncome tax on the net result for the year comprises current and deferred tax. Income tax is recognised in the profit and loss account but it is charged or credited directly to equity if the tax relates to items that are credited or charged directly to equity.
Deferred income taxDeferred income tax is provided in full, using the liability method, on temporary differences arising between the tax bases of assets and liabilities and their carrying amounts in the consolidated financial statements. Deferred income tax is determined using tax rates (and laws) that have been enacted or substantially enacted by the balance sheet date and are expected to apply when the related deferred income tax asset is realised or the deferred income tax liability is settled. Deferred tax assets and liabilities are not discounted.
Deferred tax assets are recognised where it is probable that future taxable profit will be available against which the temporary differences can be utilised. Deferred income tax is provided on temporary differences arising from investments in subsidiaries and associates, except where the timing of the reversal of the temporary difference is controlled by the Group and it is probable that the difference will not reverse in the foreseeable future. The tax effects of income tax losses available for carry forward are recognised as an asset where it is probable that future taxable profits will be available against which these losses can be utilised.
Deferred tax related to fair value remeasurement of available-for-sale investments and cash flow hedges, which are charged or credited directly to equity, is also credited or charged directly to equity and is subsequently recognised in the profit and loss account together with the deferred gain or loss.
FINANCIAL LIABILITIESFinancial liabilities at amortised costFinancial liabilities at amortised cost include the following sub-categories: preference shares, other borrowed funds, debt securities in issue, subordinated loans, amounts due to banks and customer deposits and other funds on deposit.
Preference shares, which carry a mandatory coupon or are redeemable on a specific date or at the option of the shareholder, are classified as financial liabilities. The dividends on these preference shares are recognised in the profit and loss account as Interest expense using the effective interest method.
Borrowings are recognised initially at their issue proceeds (fair value of consideration received) net of transaction costs incurred. Borrowings are subsequently stated at amortised cost; any difference between proceeds, net of transaction costs, and the redemption value is recognised in the profit and loss account over the period of the borrowings using the effective interest method.
If the Group purchases its own debt, it is removed from the balance sheet, and the difference between the carrying amount of the liability and the consideration paid is included in the profit and loss account.
Financial liabilities at fair value through profit and lossFinancial liabilities at fair value through profit and loss comprise the following sub-categories: trading liabilities, non-trading derivatives and other financial liabilities designated at fair value through profit and loss by management. Trading liabilities include equity securities, debt securities, funds on deposit and derivatives. Designation by management will take place only if it eliminates a measurement inconsistency or if the related assets and liabilities are managed on a fair value basis. ING has designated an insignificant part of the issued debt, related to market-making activities, at fair value through profit and loss. This issued debt consists mainly of own bonds. The designation as fair value through profit and loss eliminates the inconsistency in the timing of the recognition of gains and losses. All other financial liabilities are measured at amortised cost.
Financial guarantee contractsFinancial guarantee contracts are contracts that require the issuer to make specified payments to reimburse the holder for a loss it incurs because a specified debtor fails to make payments when due, in accordance with the terms of a debt instrument. Such financial guarantees are initially recognised at fair value and subsequently measured at the higher of the discounted best estimate of the obligation under the guarantee and the amount initially recognised less cumulative amortisation to reflect revenue recognition principles.
INSURANCE, INVESTMENT AND REINSURANCE CONTRACTSInsurance contractsInsurance policies which bear significant insurance risk are presented as insurance contracts. Provisions for liabilities under insurance contracts represent estimates of future payouts that will be required for life and non-life insurance claims, including expenses relating to such claims. For some insurance contracts the measurement reflects current market assumptions.
101ING Group Annual Report 2008

2.1 Consolidated annual accounts
Provision for life insuranceThe Provision for life insurance is calculated on the basis of a prudent prospective actuarial method, taking into account the conditions for current insurance contracts. Specific methodologies may differ between business units as they may reflect local regulatory requirements and local practices for specific product features in the local markets.
Insurance provisions on traditional life policies are calculated using various assumptions, including assumptions on mortality, morbidity, expenses, investment returns and surrenders. Assumptions for insurance provisions on traditional life insurance contracts, including traditional whole life and term life insurance contracts, are based on best estimate assumptions including margins for adverse deviations. The assumptions are set initially at the policy issue date and remain constant throughout the life of the policy, except in the case of loss recognition.
Insurance provisions for universal life, variable life and annuity contracts, unit-linked contracts, etc. are generally set equal to the balance that accrues to the benefit of the policyholders. Certain variable annuity products contain minimum guarantees on the amounts payable upon death and/or maturity. The insurance provisions include the impact of these minimum guarantees, taking into account the difference between the potential minimum benefit payable and the total account balance, expected mortality and surrender rates.
The as yet unamortised interest rate rebates on periodic and single premium contracts are deducted from the Provision for life insurance. Interest rate rebates granted during the year are capitalised and amortised in conformity with the anticipated recovery pattern and are recognised in the profit and loss account.
Provision for unearned premiums and unexpired insurance risksThe provision is calculated in proportion to the unexpired periods of risk. For insurance policies covering a risk increasing during the term of the policy at premium rates independent of age, this risk is taken into account when determining the provision. Further provisions are made to cover claims under unexpired insurance contracts, which may exceed the unearned premiums and the premiums due in respect of these contracts.
Claims provisionThe Claims provision is calculated either on a case-by-case basis or by approximation on the basis of experience. Provisions have also been made for claims incurred but not reported (IBNR) and for future claims handling expenses. The adequacy of the Claims provision is evaluated each year using standard actuarial techniques. In addition, ‘IBNR’ reserves are set to recognise the estimated cost of losses that have occurred but which have not yet been notified to the Group.
Deferred profit sharing liabilityFor insurance contracts with discretionary participation features a deferred profit sharing liability is recognised for the full amount of the unrealised revaluation on allocated investments. Upon realisation, the profit sharing on unrealised revaluation is reversed and a deferred profit sharing liability is recognised for the share of realised results on allocated investments that is expected to be shared with policyholders. The deferred profit sharing liability is reduced by the actual allocation of profit sharing to individual policyholders.
Provisions for life insurance for risk of policyholdersThe Provisions for life insurance for risk of policyholder are calculated on the same basis as the Provision for life insurance. For insurance contracts for risk of policyholders the provisions are generally shown at the balance sheet value of the associated investments.
Reinsurance contractsReinsurance premiums, commissions and claim settlements, as well as the reinsurance element of technical provisions are accounted for in the same way as the original contracts for which the reinsurance was concluded. To the extent that the assuming reinsurers are unable to meet their obligations, the Group remains liable to its policyholders for the portion reinsured. Consequently, provisions are made for receivables on reinsurance contracts which are deemed uncollectible.
Adequacy testThe adequacy of the Provision for life insurance, net of unamortised interest rate rebates, DAC and VOBA (the net insurance liabilities), is evaluated regularly by each business unit. The test considers current estimates of all contractual and related cash flows, and future developments. It includes investment income on the same basis as it is included in the profit and loss account.
If, for any business unit, it is determined, using a best estimate (50%) confidence level, that a shortfall exists, and there are no offsetting amounts within other business units in the Business Line, the shortfall is recognised immediately in the profit and loss account.
If, for any business unit, the net insurance liabilities are not adequate using a prudent (90%) confidence level, but there are offsetting amounts within other Group business units, then the business unit is allowed to take measures to strengthen the net insurance liabilities over a period no longer than the expected life of the policies. To the extent that there are no offsetting amounts within other Group business units, any shortfall at the 90% confidence level is recognised immediately in the profit and loss account.
Accounting policies for the consolidated balance sheet and profit and loss account of ING Group (continued)
ING Group Annual Report 2008
102

If the net insurance liabilities are determined to be adequate at above the 90% confidence level, no reduction in the net insurance liabilities is recognised.
Investment contractsInsurance policies without discretionary participation features which do not bear significant insurance risk are presented as Investment contracts. Provisions for liabilities under investment contracts are determined either at amortised cost, using the effective interest method (including certain initial acquisition expenses) or at fair value.
OTHER LIABILITIESEmployee benefits – pension obligationsGroup companies operate various pension schemes. The schemes are generally funded through payments to insurance companies or trustee-administered funds, determined by periodic actuarial calculations. The Group has both defined benefit and defined contribution plans.
A defined benefit plan is a pension plan that defines an amount of pension benefit that an employee will receive on retirement, usually dependent on one or more factors such as age, years of service and compensation.
The liability recognised in the balance sheet in respect of defined benefit pension plans is the present value of the defined benefit obligation at the balance sheet date less the fair value of plan assets, together with adjustments for unrecognised actuarial gains and losses, and unrecognised past service costs. The defined benefit obligation is calculated annually by internal and external actuaries using the projected unit credit method.
The expected value of the assets is calculated using the expected rate of return on plan assets. Differences between the expected return and the actual return on these plan assets and actuarial changes in the deferred benefit obligation are not recognised in the profit and loss account, unless the accumulated differences and changes exceed 10% of the greater of the defined benefit obligation and the fair value of the plan assets. The excess is charged or credited to the profit and loss account over employees’ remaining working lives. The corridor was reset to nil at the date of transition to IFRS-EU.
For defined contribution plans, the Group pays contributions to publicly or privately administered pension insurance plans on a mandatory, contractual or voluntary basis. The Group has no further payment obligations once the contributions have been paid. The contributions are recognised as staff expenses when they are due. Prepaid contributions are recognised as an asset to the extent that a cash refund or a reduction in the future payments is available.
Other post-employment obligationsSome group companies provide post-employment healthcare and other benefits to certain employees and former employees. The entitlement to these benefits is usually conditional on the employee remaining in service up to retirement age and the completion of a minimum service period. The expected costs of these benefits are accrued over the period of employment using an accounting methodology similar to that for defined benefit pension plans.
Other provisionsA provision involves a present obligation arising from past events, the settlement of which is expected to result in an outflow from the company of resources embodying economic benefits, however the timing or the amount is uncertain. Provisions are discounted when the effect of the time value of money is material using a pre-tax discount rate. The determination of provisions is an inherently uncertain process involving estimates regarding amounts and timing of cash flows.
Reorganisation provisions include employee termination benefits when the Group is demonstrably committed to either terminating the employment of current employees according to a detailed formal plan without possibility of withdrawal, or providing termination benefits as a result of an offer made to encourage voluntary redundancy.
INCOME RECOGNITIONGross premium incomePremiums from life insurance policies are recognised as income when due from the policyholder. For non-life insurance policies, gross premium income is recognised on a pro-rata basis over the term of the related policy coverage. Receipts under investment contracts are not recognised as gross premium income.
103ING Group Annual Report 2008

2.1 Consolidated annual accounts
InterestInterest income and expense are recognised in the profit and loss account using the effective interest method. The effective interest method is a method of calculating the amortised cost of a financial asset or a financial liability and of allocating the interest income or interest expense over the relevant period. The effective interest rate is the rate that exactly discounts estimated future cash payments or receipts through the expected life of the financial instrument or, when appropriate, a shorter period to the net carrying amount of the financial asset or financial liability. When calculating the effective interest rate, the Group estimates cash flows considering all contractual terms of the financial instrument (for example, prepayment options) but does not consider future credit losses. The calculation includes all fees and points paid or received between parties to the contract that are an integral part of the effective interest rate, transaction costs and all other premiums or discounts. Once a financial asset or a group of similar financial assets has been written down as a result of an impairment loss, interest income is recognised using the rate of interest used to discount the future cash flows for the purpose of measuring the impairment loss.
All interest income and expenses from trading positions and non-trading derivatives are classified as interest income and interest expenses in the profit and loss account. Changes in the ‘clean fair value’ are included in Valuation results on non-trading derivatives.
Fees and commissionsFees and commissions are generally recognised as the service is provided. Loan commitment fees for loans that are likely to be drawn down are deferred (together with related direct costs) and recognised as an adjustment to the effective interest rate on the loan. Loan syndication fees are recognised as income when the syndication has been completed and the Group has retained no part of the loan package for itself or has retained a part at the same effective interest rate as the other participants. Commission and fees arising from negotiating, or participating in the negotiation of, a transaction for a third party – such as the arrangement of the acquisition of shares or other securities or the purchase or sale of businesses – are recognised on completion of the underlying transaction. Portfolio and other management advisory and service fees are recognised based on the applicable service contracts as the service is provided. Asset management fees related to investment funds and investment contract fees are recognised on a pro-rata basis over the period the service is provided. The same principle is applied for wealth management, financial planning and custody services that are continuously provided over an extended period of time. Fees received and paid between banks for payment services are classified as commission income and expenses.
Lease incomeThe proceeds from leasing out assets under operating leases are recognised on a straight-line basis over the life of the lease agreement. Lease payments received in respect of finance leases when ING is the lessor are divided into an interest component (recognised as interest income) and a repayment component.
EXPENSE RECOGNITIONExpenses are recognised in the profit and loss account as incurred or when a decrease in future economic benefits related to a decrease in an asset or an increase in a liability has arisen that can be measured reliably.
Share-based paymentsShare-based payment expenses are recognised as the employees provide the service. A corresponding increase in equity is recognised if the services are received in an equity-settled share-based payment transaction. A liability is recognised if the services are acquired in a cash-settled share-based payment transaction. The cost of acquiring the services is expensed as a staff expense. Prior to 2007, ING Group generally provided equity-settled share-based payment transactions. However, since 2007, ING Group has generally provided cash-settled share-based payment transactions. The fair value of equity-settled share-based payment transactions is measured at the grant date and the fair value of cash-settled share-based payment transactions is measured at each balance sheet date.
EARNINGS PER ORDINARY SHAREEarnings per ordinary share is calculated on the basis of the weighted average number of ordinary shares outstanding. In calculating the weighted average number of ordinary shares outstanding:
Own shares held by group companies are deducted from the total number of ordinary shares in issue;•The computation is based on daily averages;•In case of exercised warrants, the exercise date is taken into consideration.•
The non-voting equity securities are not ordinary shares, because their terms and conditions (especially with regard to coupons and voting rights) are significantly different. Therefore, the weighted average number of ordinary shares outstanding during the period is not impacted by the non-voting equity securities.
Accounting policies for the consolidated balance sheet and profit and loss account of ING Group (continued)
ING Group Annual Report 2008
104

Diluted earnings per share data are computed as if all convertible instruments outstanding at year-end were exercised at the beginning of the period. It is also assumed that ING Group uses the assumed proceeds thus received to buy its own shares against the average market price in the financial year. The net increase in the number of shares resulting from the exercise is added to the average number of shares used to calculate diluted earnings per share.
Share options with fixed or determinable terms are treated as options in the calculation of diluted earnings per share, even though they may be contingent on vesting. They are treated as outstanding on the grant date. Performance-based employee share options are treated as contingently issuable shares because their issue is contingent upon satisfying specified conditions in addition to the passage of time.
FIDUCIARY ACTIVITIESThe Group commonly acts as trustee and in other fiduciary capacities that result in the holding or placing of assets on behalf of individuals, trusts, retirement benefit plans and other institutions. These assets and income arising thereon are excluded from these financial statements, as they are not assets of the Group.
105ING Group Annual Report 2008

2.1 Consolidated annual accounts
The statement of cash flows has been drawn up in accordance with the indirect method, classifying cash flows as cash flows from operating, investing and financing activities. In the net cash flow from operating activities, the result before tax is adjusted for those items in the profit and loss account, and changes in balance sheet items, which do not result in actual cash flows during the year.
For the purposes of the statement of cash flows, Cash and cash equivalents comprise balances with less than three months’ maturity from the date of acquisition, including cash and non-restricted balances with central banks, treasury bills and other eligible bills, amounts due from other banks and amounts due to banks. Investments qualify as a cash equivalent if they are readily convertible to a known amount of cash and are subject to an insignificant risk of changes in value.
Cash flows arising from foreign currency transactions are translated into the functional currency using the exchange rates at the date of the cash flows.
The net cash flow shown in respect of Loans and advances to customers relates only to transactions involving actual payments or receipts. The Addition to loan loss provision which is deducted from the item Loans and advances to customers in the balance sheet has been adjusted accordingly from the result before tax and is shown separately in the statement of cash flows.
The difference between the net cash flow in accordance with the statement of cash flows and the change in Cash and cash equivalents in the balance sheet is due to exchange rate differences and is accounted for separately as part of the reconciliation of the net cash flow and the balance sheet change in Cash and cash equivalents.
Accounting policies for the consolidated statement of cash flows of ING Group
ING Group Annual Report 2008
106

ASSETS1 CASH AND BALANCES WITH CENTRAL BANKS
Cash and balances with central banks
2008 2007
Amounts held at central banks 16,432 8,376Cash and bank balances 5,052 3,664Short term deposits insurance operations 561 366
22,045 12,406
2 AMOUNTS DUE FROM BANKS
Amounts due from banks
2008 Netherlands
2007 2008International
2007 2008 Total 2007
Loans and advances to banks 15,234 14,451 25,556 31,339 40,790 45,790Cash advances, overdrafts and other balances 4,800 1,065 2,942 2,033 7,742 3,098
20,034 15,516 28,498 33,372 48,532 48,888
Loan loss provision –11 –85 –2 –85 –1320,034 15,505 28,413 33,370 48,447 48,875
As at 31 December 2008, Amounts due from banks included receivables with regard to securities which have been acquired in reverse repurchase transactions amounting to EUR 3,005 million (2007: EUR 2,472 million) and receivables related to finance lease contracts amounting to EUR 100 million (2007: EUR 232 million).
As at 31 December 2008, the non-subordinated receivables amounted to EUR 48,443 million (2007: EUR 48,705 million) and the subordinated receivables amounted to EUR 4 million (2007: EUR 170 million).
No individual amount due from banks has terms and conditions that materially affect the amount, timing or certainty of consolidated cash flows of the Group. For details on significant concentrations see ‘Risk management’ section.
3 FINANCIAL ASSETS AT FAIR VALUE THROUGH PROFIT AND LOSS
Financial assets at fair value through profit and loss
2008 2007
Trading assets 160,378 193,213Investments for risk of policyholders 95,366 114,827Non-trading derivatives 16,484 7,637Designated as at fair value through profit and loss 8,277 11,453
280,505 327,130
Trading assets by type
2008 2007
Equity securities 2,352 11,112Debt securities 26,652 37,345Derivatives 71,925 28,592Loans and receivables 59,449 116,164
160,378 193,213
As at 31 December 2008, the balance sheet value included equity securities which were lent or sold in repurchase transactions amounting to EUR 1 million (2007: EUR 4 million) and nil (2007: nil), respectively. As at 31 December 2008, the balance sheet value included debt securities which were lent or sold in repurchase transactions amounting to EUR 28 million (2007: EUR 386 million) and EUR 1,904 million (2007: EUR 629 million), respectively.
Notes to the consolidated balance sheet of ING Groupamounts in millions of euros, unless stated otherwise
107ING Group Annual Report 2008

2.1 Consolidated annual accounts
As at 31 December 2008, Trading assets included receivables of EUR 57,968 million (2007: EUR 114,897 million) with regard to reverse repurchase transactions.
The large increase in Trading assets–derivatives in 2008 is substantially offset by a similar increase in Trading liabilities–derivatives.
The fair value of credit derivatives included in trading assets and held to mitigate exposure to credit risk was nil (2007: nil), and the change in their fair value in the period was nil (2007: nil).
Investments for risk of policyholders by type
2008 2007
Equity securities 83,208 106,061Debt securities 7,729 7,398Loans and receivables 4,429 1,368
95,366 114,827
The change in the fair value of the loans and receivables included in Investments for risk of policyholders attributable to changes in the credit risk of the financial assets during 2008 was nil (2007: nil) and nil (2007: nil) on a cumulative basis.
The fair value of credit derivatives included in investments for risk of policyholders and held to mitigate exposure to credit risk was EUR –12 million (2007: EUR –7 million), and the change in their fair value in the period was EUR –5 million (2007: EUR –7 million).
The cost of investments for risk of policyholders as at 31 December 2008 was EUR 115,929 million (2007: EUR 105,625 million).
Investments in investment funds (with underlying investments in debt, equity securities, real estate and derivatives) are included under equity securities.
Non-trading derivatives by type
2008 2007
Derivatives used in:– fair value hedges 3,862 1,952– cash flow hedges 5,771 3,417– hedges of net investments in foreign operations 670 281Other non-trading derivatives 6,181 1,987
16,484 7,637
The fair value of credit derivatives included in non-trading derivatives and held to mitigate exposure to credit risk was EUR –17 million (2007: EUR –10 million), and the change in their fair value in the period was EUR –7 million (2007: nil).
Other non-trading derivatives include mainly interest rate swaps for which no hedge accounting is applied. The increase is mainly due to changes in fair value resulting from changes in market interest rates.
The increase is substantially mitigated by a similar increase in Other non-trading derivatives (liabilities) as disclosed in Note 20 ‘Financial liabilities at fair value through profit and loss’.
Designated as at fair value through profit and loss by type
2008 2007
Equity securities 313 306Debt securities 5,445 8,774Loans and receivables 637 428Other 1,882 1,945
8,277 11,453
The change in the fair value of the loans and receivables designated as at fair value through profit and loss attributable to changes in the credit risk of the financial assets during 2008 was nil (2007: nil),and nil (2007: nil) on a cumulative basis.
Other includes investments in private equity funds, hedge funds, other non-traditional investment vehicles and limited partnerships.
Notes to the consolidated balance sheet of ING Group (continued)
ING Group Annual Report 2008
108

4 INVESTMENTS
Investments by type
2008 2007
Available-for-sale– equity securities 8,822 19,947– debt securities 234,030 255,950
242,852 275,897
Held-to-maturity– debt securities 15,440 16,753
15,440 16,753
258,292 292,650
The fair value of the securities classified as held to maturity amounts to EUR 15,566 million as at 31 December 2008 (2007: EUR 16,354 million).
Changes in investments – available-for-sale and held-to-maturity
Available-for-sale equity securities Available-for-sale debt securities Held-to-maturity Total2008 2007 2008 2007 2008 2007 2008 2007
Opening balance 19,947 18,225 255,950 275,696 16,753 17,660 292,650 311,581Additions 4,503 7,788 225,703 275,497 315 230,521 283,285Amortisation –48 –181 –33 –59 –81 –240Transfers and reclassifications 154 512 –1,594 –1,417 –1,440 –905Changes in the composition of the group and other –748 –536 –11,670 –2,903 –12,418 –3,439Changes in unrealised revaluations –4,621 3,379 –14,877 –6,284 –19,498 –2,905Impairments and reversals –1,916 –53 –2,904 –133 –4,820 –186Disposals and redemptions –8,320 –9,093 –217,239 –272,106 –1,640 –822 –227,199 –282,021Exchange rate differences –177 –275 709 –12,219 45 –26 577 –12,520Closing balance 8,822 19,947 234,030 255,950 15,440 16,753 258,292 292,650
Included in transfers and reclassifications of available-for-sale and held-to-maturity investments
Available-for-sale equity securities Available-for-sale debt securities Total2008 2007 2008 2007 2008 2007
To/from available- for-sale 21 –21 To/from loans and advances –1 –1,594 –6 –1,594 –7To/from fair value through profit and loss 52 –1,386 –1,334To/from Investment in associates 154 438 154 438
To/from Other assets/Other liabilities 2 –4 –2
154 512 –1,594 –1,417 –1,440 –905
Following the amendments to IAS 39 and IFRS 7, ‘Reclassification of Financial Assets’ ING Group reclassified certain financial assets from Available-for-sale investments to Loans and advances. During the fourth quarter of 2008 ING Group identified assets, eligible under the amendments, for which, it now has an intent to hold for the foreseeable future. At the reclassifications dates the fair value of the reclassified assets amounted to EUR 1,594 million. As a result of the reclassification, the presentation is better aligned with the nature of the portfolios.
109ING Group Annual Report 2008
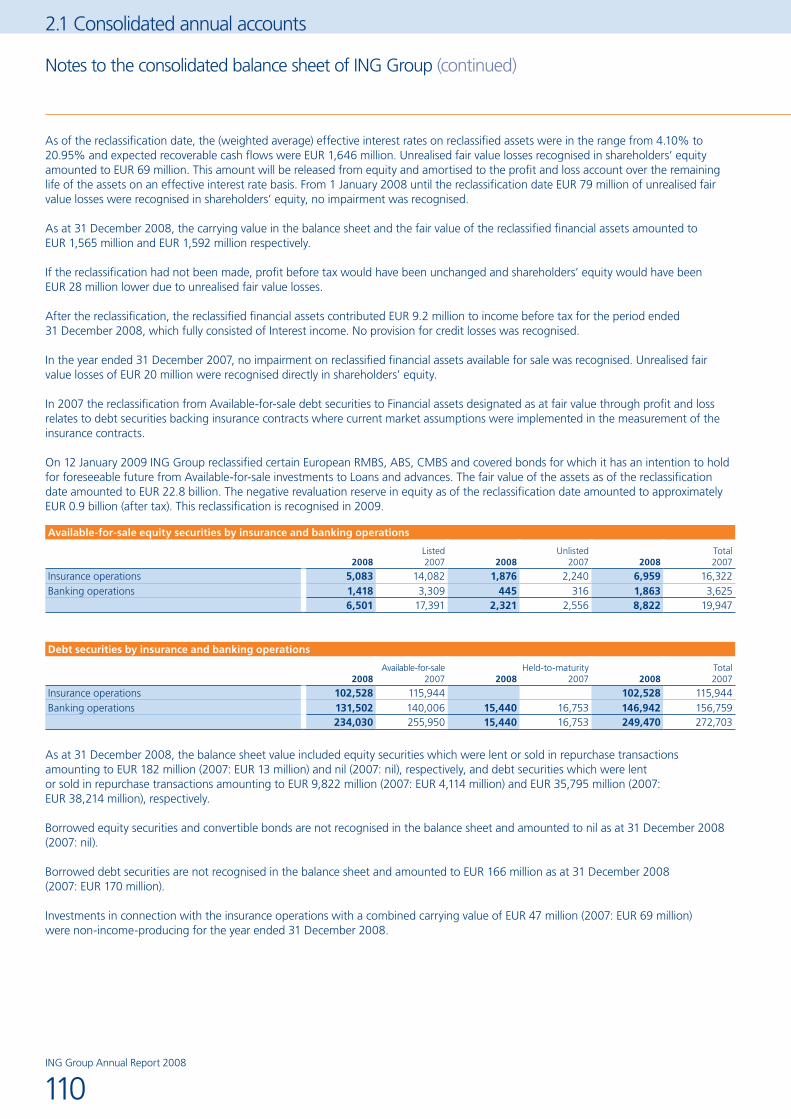
2.1 Consolidated annual accounts
As of the reclassification date, the (weighted average) effective interest rates on reclassified assets were in the range from 4.10% to 20.95% and expected recoverable cash flows were EUR 1,646 million. Unrealised fair value losses recognised in shareholders’ equity amounted to EUR 69 million. This amount will be released from equity and amortised to the profit and loss account over the remaining life of the assets on an effective interest rate basis. From 1 January 2008 until the reclassification date EUR 79 million of unrealised fair value losses were recognised in shareholders’ equity, no impairment was recognised.
As at 31 December 2008, the carrying value in the balance sheet and the fair value of the reclassified financial assets amounted to EUR 1,565 million and EUR 1,592 million respectively.
If the reclassification had not been made, profit before tax would have been unchanged and shareholders’ equity would have been EUR 28 million lower due to unrealised fair value losses.
After the reclassification, the reclassified financial assets contributed EUR 9.2 million to income before tax for the period ended 31 December 2008, which fully consisted of Interest income. No provision for credit losses was recognised.
In the year ended 31 December 2007, no impairment on reclassified financial assets available for sale was recognised. Unrealised fair value losses of EUR 20 million were recognised directly in shareholders’ equity.
In 2007 the reclassification from Available-for-sale debt securities to Financial assets designated as at fair value through profit and loss relates to debt securities backing insurance contracts where current market assumptions were implemented in the measurement of the insurance contracts.
On 12 January 2009 ING Group reclassified certain European RMBS, ABS, CMBS and covered bonds for which it has an intention to hold for foreseeable future from Available-for-sale investments to Loans and advances. The fair value of the assets as of the reclassification date amounted to EUR 22.8 billion. The negative revaluation reserve in equity as of the reclassification date amounted to approximately EUR 0.9 billion (after tax). This reclassification is recognised in 2009.
Available-for-sale equity securities by insurance and banking operations
2008Listed 2007 2008
Unlisted2007 2008
Total 2007
Insurance operations 5,083 14,082 1,876 2,240 6,959 16,322Banking operations 1,418 3,309 445 316 1,863 3,625
6,501 17,391 2,321 2,556 8,822 19,947
Debt securities by insurance and banking operations
2008 Available-for-sale
2007 2008Held-to-maturity
2007 2008 Total 2007
Insurance operations 102,528 115,944 102,528 115,944Banking operations 131,502 140,006 15,440 16,753 146,942 156,759
234,030 255,950 15,440 16,753 249,470 272,703
As at 31 December 2008, the balance sheet value included equity securities which were lent or sold in repurchase transactions amounting to EUR 182 million (2007: EUR 13 million) and nil (2007: nil), respectively, and debt securities which were lent or sold in repurchase transactions amounting to EUR 9,822 million (2007: EUR 4,114 million) and EUR 35,795 million (2007: EUR 38,214 million), respectively.
Borrowed equity securities and convertible bonds are not recognised in the balance sheet and amounted to nil as at 31 December 2008 (2007: nil).
Borrowed debt securities are not recognised in the balance sheet and amounted to EUR 166 million as at 31 December 2008 (2007: EUR 170 million).
Investments in connection with the insurance operations with a combined carrying value of EUR 47 million (2007: EUR 69 million) were non-income-producing for the year ended 31 December 2008.
Notes to the consolidated balance sheet of ING Group (continued)
ING Group Annual Report 2008
110

5 LOANS AND ADVANCES TO CUSTOMERS
Loans and advances to customers by insurance and banking operations
2008 2007
Insurance operations 25,681 27,576Banking operations 601,638 528,540
627,319 556,116Eliminations –7,528 –3,152
619,791 552,964
Loans and advances to customers by type – insurance operations
2008 Netherlands
2007 2008International
2007 2008 Total 2007
Policy loans 52 54 2,908 3,414 2,960 3,468Loans secured by mortgages 6,804 8,532 8,789 8,772 15,593 17,304Personal loans 3,210 2,851 2,058 2,602 5,268 5,453Other 309 378 1,610 1,003 1,919 1,381
10,375 11,815 15,365 15,791 25,740 27,606
Loan loss provisions –27 –14 –32 –16 –59 –3010,348 11,801 15,333 15,775 25,681 27,576
Loans and advances to customers by type – banking operations
2008 Netherlands
2007 2008International
2007 2008 Total 2007
Loans to, or guaranteed by, public authorities 16,288 14,678 10,099 8,961 26,387 23,639Loans secured by mortgages 158,861 141,314 145,090 132,614 303,951 273,928Loans guaranteed by credit institutions 295 1,951 253 591 548 2,542Personal lending 7,158 6,975 20,389 17,784 27,547 24,759Corporate loans 126,772 105,017 118,959 100,643 245,731 205,660
309,374 269,935 294,790 260,593 604,164 530,528
Loan loss provisions –761 –654 –1,765 –1,334 –2,526 –1,988308,613 269,281 293,025 259,259 601,638 528,540
Loans and advances to customers analysed by subordination – banking operations
2008 2007
Non-subordinated 601,434 527,344Subordinated 204 1,196
601,638 528,540
As at 31 December 2008, Loans and advances to customers included receivables with regard to securities which have been acquired in reverse repurchase transactions related to the banking operations amounting to EUR 964 million (2007: EUR 4,569 million).
No individual loan or advance has terms and conditions that materially affect the amount, timing or certainty of the consolidated cash flows of the Group.
111ING Group Annual Report 2008

2.1 Consolidated annual accounts
Loans and advances to customers and Amounts due from banks include finance lease receivables, are detailed as follows:
Finance lease receivables
2008 2007
Maturities of gross investment in finance lease receivables– within 1 year 6,363 6,473– more than 1 year but less than 5 years 9,766 8,448– more than 5 years 4,836 3,753
20,965 18,674
Unearned future finance income on finance leases –3,614 –3,109Net investment in finance leases 17,351 15,565
Maturities of net investment in finance lease receivables– within 1 year 5,157 5,337– more than 1 year but less than 5 years 7,955 7,060– more than 5 years 4,239 3,168
17,351 15,565
Included in Amounts due from banks 100 232Included in Loans and advances to customers 17,251 15,333
17,351 15,565
The allowance for uncollectible finance lease receivables included in the loan loss provisions amounted to EUR 88 million as at 31 December 2008 (2007: EUR 33 million).
No individual finance lease receivable has terms and conditions that materially affect the amount, timing or certainty of the consolidated cash flows of the Group.
Loan loss provisions analysed by type – banking operations
2008 Netherlands
2007 2008International
2007 2008 Total 2007
Loans secured by public authorities 2 1 2 1Loans secured by mortgages 167 96 425 203 592 299Loans guaranteed by credit institutions 11 85 3 85 14Other personal lending 120 181 533 374 653 555Other corporate loans 474 377 805 755 1,279 1,132
761 665 1,850 1,336 2,611 2,001
The closing balance is included in– Amounts due from banks 11 85 2 85 13– Loans and advances to customers 761 654 1,765 1,334 2,526 1,988
761 665 1,850 1,336 2,611 2,001
Changes in loan loss provisions
Insurance operations Banking operations Total2008 2007 2008 2007 2008 2007
Opening balance 30 37 2,001 2,642 2,031 2,679Changes in the composition of the group –4 –3 2 98 –2 95Write-offs –6 –11 –728 –952 –734 –963Recoveries 2 1 91 59 93 60Increase in loan loss provisions 38 8 1,280 125 1,318 133Exchange rate differences –1 –1 –50 –19 –51 –20Other changes –1 15 48 15 47Closing balance 59 30 2,611 2,001 2,670 2,031
Changes in loan loss provisions relating to insurance operations are presented under Investment income. Changes in the loan loss provisions relating to banking operations are presented on the face of the profit and loss account.
Notes to the consolidated balance sheet of ING Group (continued)
ING Group Annual Report 2008
112

6 INVESTMENTS IN ASSOCIATES
Investments in associates
Interest held (%)
Fair value of listed
investment
Balance
sheet value
Total assets
Total liabilities
Total income
Total
expenses2008
TMB Public Company Limited 30 171 443 12,247 11,246 812 589ING Dutch Office Master Fund C.V. 16 219 1,624 258 63 75ING Winkels Basisfonds 16 218 1,736 346 119 51Sul America S.A. 36 168 557 91 2,663 2,348ING Industrial Fund Australia 18 14 164 2,377 1,033 166 147Property Fund Iberica 30 157 1,835 1,301 –2 96Lionbrook Property Partnership 29 145 626 126 –283 15Lion Industrial Trust 10 133 2,898 1,528 98 207Lion Properties Fund 5 125 4,135 1,757 313 771ING Woningen Basisfonds 13 122 1,064 155 58 45ING Real Estate Asia Retail Fund 28 121 850 412 57 72Dutch Office Fund II 16 109 817 136 50 58ING Retail Property Fund Australia 29 109 790 412 13 7ING Vastgoed Kantoren C.V. 10 98 1,006 22 101 93ING Vastgoed Winkels C.V. 10 88 898 22 83 22Property Fund Central Europe 25 83 880 546 69 37Retail Property Fund France Belgium (RPFFB) 15 79 1,602 1,075 71 57
Dutch Residential Fund II 13 74 602 51 62 127ING Retail Property Partnership Southern Europe 21 73 1,218 879 6 67ING REI Investment DOF BV 4 71 2,679 383 197 212ING European Infrastructure Fund 25 70 662 409 2Lion Value Fund 22 68 442 139 7 56ING Logistics Property Fund Europe 25 65 530 269 –5 21ING Re Nordic Property Fund 16 64 979 579 16 62ING Property Fund Central and Eastern Europe 20 55 791 519 32 60ING Vastgoed Woningen C.V. 10 53 528 1 36 25ING Re French Residential Fund 45 50 182 69 3 4Other investments in associates 1,131
4,355
Other investments in associates represents a large number of associates with an individual balance sheet value of less than EUR 50 million.
Accumulated impairments of EUR 46 million (2007: EUR 29 million) have been recognised.
For the above associates in which the interest held is below 20%, significant influence exists based on the combination of ING’s financial interest for own risk and its role as investment manager.
The values presented in the table above could differ from the values presented in the individual annual accounts of the associates, due to the fact that the individual values have been brought in line with ING’s accounting principles.
In general, the reporting dates of all material associates are consistent with the reporting date of the Group. However, for practical reasons, the reporting dates of certain associates differ slightly from with the reporting date of the Group, but, in any case, the difference between the reporting date of the associates and that of the Group is no more than three months.
Where the listed fair value is lower than the balance sheet value, an impairment review and an evaluation of the going concern basis has been performed.
113ING Group Annual Report 2008
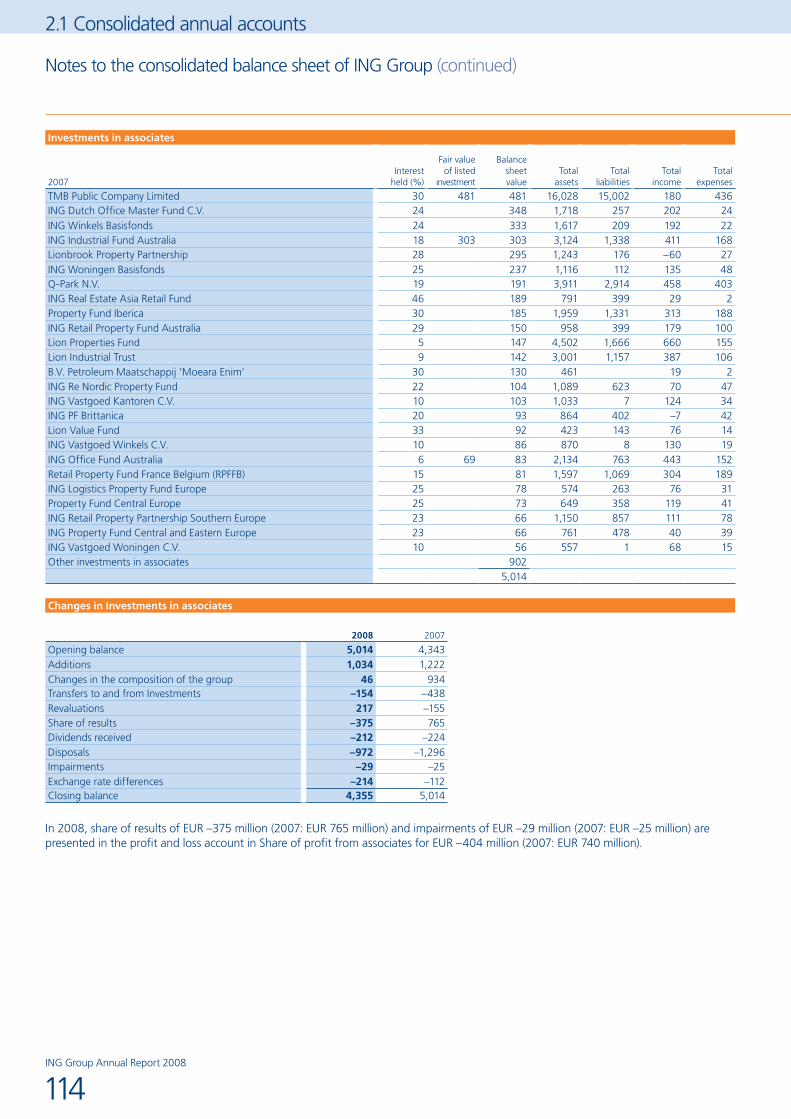
2.1 Consolidated annual accounts
Investments in associates
Interest held (%)
Fair value of listed
investment
Balance sheet value
Total assets
Total liabilities
Total income
Total
expenses2007
TMB Public Company Limited 30 481 481 16,028 15,002 180 436ING Dutch Office Master Fund C.V. 24 348 1,718 257 202 24ING Winkels Basisfonds 24 333 1,617 209 192 22ING Industrial Fund Australia 18 303 303 3,124 1,338 411 168Lionbrook Property Partnership 28 295 1,243 176 –60 27ING Woningen Basisfonds 25 237 1,116 112 135 48Q-Park N.V. 19 191 3,911 2,914 458 403ING Real Estate Asia Retail Fund 46 189 791 399 29 2Property Fund Iberica 30 185 1,959 1,331 313 188ING Retail Property Fund Australia 29 150 958 399 179 100Lion Properties Fund 5 147 4,502 1,666 660 155Lion Industrial Trust 9 142 3,001 1,157 387 106B.V. Petroleum Maatschappij ‘Moeara Enim’ 30 130 461 19 2ING Re Nordic Property Fund 22 104 1,089 623 70 47ING Vastgoed Kantoren C.V. 10 103 1,033 7 124 34ING PF Brittanica 20 93 864 402 –7 42Lion Value Fund 33 92 423 143 76 14ING Vastgoed Winkels C.V. 10 86 870 8 130 19ING Office Fund Australia 6 69 83 2,134 763 443 152Retail Property Fund France Belgium (RPFFB) 15 81 1,597 1,069 304 189ING Logistics Property Fund Europe 25 78 574 263 76 31Property Fund Central Europe 25 73 649 358 119 41ING Retail Property Partnership Southern Europe 23 66 1,150 857 111 78ING Property Fund Central and Eastern Europe 23 66 761 478 40 39ING Vastgoed Woningen C.V. 10 56 557 1 68 15Other investments in associates 902
5,014
Changes in Investments in associates
2008 2007
Opening balance 5,014 4,343Additions 1,034 1,222Changes in the composition of the group 46 934Transfers to and from Investments –154 –438Revaluations 217 –155Share of results –375 765Dividends received –212 –224Disposals –972 –1,296Impairments –29 –25Exchange rate differences –214 –112Closing balance 4,355 5,014
In 2008, share of results of EUR –375 million (2007: EUR 765 million) and impairments of EUR –29 million (2007: EUR –25 million) are presented in the profit and loss account in Share of profit from associates for EUR –404 million (2007: EUR 740 million).
Notes to the consolidated balance sheet of ING Group (continued)
ING Group Annual Report 2008
114

7 REAL ESTATE INVESTMENTS
Changes in real estate investments
2008 2007
Opening balance 4,829 6,974Additions 905 878Changes in the composition of the group –296 –2,919Transfers to and from Property in own use –38 –60Transfers to and from Other assets 117 13Fair value gains/(losses) –400 168Disposals –415 –309Exchange rate differences –402 84Closing balance 4,300 4,829
In 2007, Change in composition of the group relates mainly to the deconsolidation of Real estate funds as a result of the reduction of ING’s shareholding in these funds.
ING’s exposure to real estate is included in various balance sheet lines:
Real estate exposure
2008
Real estate investments 4,300Investments in associates 3,200Other assets – property held for sale 3,143Property and equipment – property in own use 1,841Investments – available-for-sale 663
13,147
Furthermore, the exposure is impacted by third party interests, leverage in funds and off-balance commitments, resulting in an overall exposure of EUR 15.5 billion. Reference is made to the section ‘Risk management’.
Real estate investments by insurance and banking operations
2008 2007
Insurance operations 1,118 1,302Banking operations 3,182 3,527
4,300 4,829
The total amount of rental income recognised in the profit and loss account for the year ended 31 December 2008 was EUR 361 million (2007: EUR 402 million). The total amount of contingent rent recognised in the profit and loss account for the year ended 31 December 2008 was EUR 17 million (2007: EUR 14 million).
The total amount of direct operating expenses (including repairs and maintenance) arising from Real estate investments that generated rental income for the year ended 31 December 2008 was EUR 71 million (2007: EUR 64 million). The total amount of direct operating expenses (including repairs and maintenance) arising from Real estate investments that did not generate rental income for the year ended 31 December 2008 was EUR 36 million (2007: EUR 20 million).
Real estate investments by year of most recent appraisal by independently qualified valuers (in percentages)
2008
Most recent appraisal in 2008 99Most recent appraisal in 2007 0Most recent appraisal in 2006 1Most recent appraisal in 2005 0Most recent appraisal in 2004 0
100
115ING Group Annual Report 2008
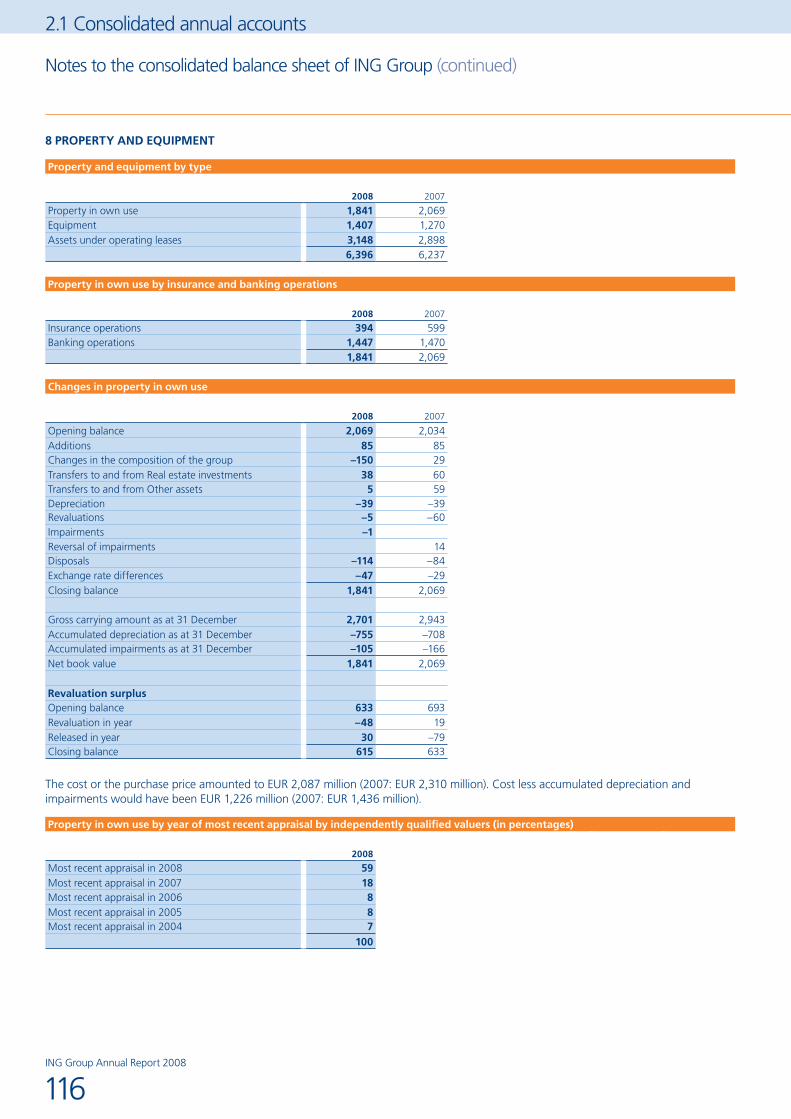
2.1 Consolidated annual accounts
8 PROPERTY AND EQUIPMENT
Property and equipment by type
2008 2007
Property in own use 1,841 2,069Equipment 1,407 1,270Assets under operating leases 3,148 2,898
6,396 6,237
Property in own use by insurance and banking operations
2008 2007
Insurance operations 394 599Banking operations 1,447 1,470
1,841 2,069
Changes in property in own use
2008 2007
Opening balance 2,069 2,034Additions 85 85Changes in the composition of the group –150 29Transfers to and from Real estate investments 38 60Transfers to and from Other assets 5 59Depreciation –39 –39Revaluations –5 –60Impairments –1Reversal of impairments 14Disposals –114 –84Exchange rate differences –47 –29Closing balance 1,841 2,069
Gross carrying amount as at 31 December 2,701 2,943Accumulated depreciation as at 31 December –755 –708Accumulated impairments as at 31 December –105 –166Net book value 1,841 2,069
Revaluation surplusOpening balance 633 693Revaluation in year –48 19Released in year 30 –79Closing balance 615 633
The cost or the purchase price amounted to EUR 2,087 million (2007: EUR 2,310 million). Cost less accumulated depreciation and impairments would have been EUR 1,226 million (2007: EUR 1,436 million).
Property in own use by year of most recent appraisal by independently qualified valuers (in percentages)
2008
Most recent appraisal in 2008 59Most recent appraisal in 2007 18Most recent appraisal in 2006 8Most recent appraisal in 2005 8Most recent appraisal in 2004 7
100
Notes to the consolidated balance sheet of ING Group (continued)
ING Group Annual Report 2008
116

Changes in equipment
Data processing equipmentFixtures and fittings
and other equipment
Total2008 2007 2008 2007 2008 2007
Opening balance 281 283 989 1,029 1,270 1,312Additions 227 177 396 309 623 486Changes in the composition of the group –4 10 10 16 6 26Disposals –2 –24 –20 –44 –22 –68Depreciation –146 –164 –263 –216 –409 –380Impairments –9 –1 –9 –1 –18 –2Exchange rate differences –13 –3 –28 –17 –41 –20Other changes –14 3 12 –87 –2 –84Closing balance 320 281 1,087 989 1,407 1,270
Gross carrying amount as at 31 December 1,562 1,763 2,935 2,950 4,497 4,713Accumulated depreciation as at 31 December –1,231 –1,481 –1,840 –1,959 –3,071 –3,440Accumulated impairments as at 31 December –11 –1 –8 –2 –19 –3Net book value 320 281 1,087 989 1,407 1,270
Changes in assets under operating leases
Cars Other leased-out assets Total2008 2007 2008 2007 2008 2007
Opening balance 2,886 2,671 12 14 2,898 2,685Additions 1,401 1,396 2 1,401 1,398Changes in the composition of the group 172 –2 170Disposals –428 –417 –428 –417Depreciation –764 –720 –2 –4 –766 –724Impairments –3 –3Exchange rate differences –124 –44 –124 –44Closing balance 3,140 2,886 8 12 3,148 2,898
Gross carrying amount as at 31 December 4,466 5,177 28 70 4,494 5,247Accumulated depreciation as at 31 December –1,324 –2,291 –20 –58 –1,344 –2,349Accumulated impairments as at 31 December –2 –2Net book value 3,140 2,886 8 12 3,148 2,898
Depreciation of assets under operating leases is included in the profit and loss account in Other income as a deduction from operating lease income.
No individual operating lease has terms and conditions that materially affect the amount, timing or certainty of the consolidated cash flows of the Group.
The Group leases assets to third parties under operating leases as lessor. The future minimum lease payments to be received under non-cancellable operating leases are as follows:
Future minimum lease payments by maturity
2008 2007
Within 1 year 1,072 1,048More than 1 year but less than 5 years 2,072 1,844More than 5 years 4 6
3,148 2,898
117ING Group Annual Report 2008

2.1 Consolidated annual accounts
Notes to the consolidated balance sheet of ING Group (continued)
9 INTANGIBLE ASSETS
Changes in intangible assets
Value of business acquired Goodwill Software Other Total
2008 2007 2008 2007 2008 2007 2008 2007 2008 2007
Opening balance 2,301 2,641 2,245 305 472 377 722 199 5,740 3,522Additions (bought) 93 1,329 2,040 213 215 244 170 1,786 2,518Capitalised expenses 98 420 124 518 124Amortisation –298 –229 –173 –221 –157 –18 –628 –468Impairments –155 –27 –14 –44 –1 –226 –15Effect of unrealised revaluations in equity 555 32 555 32Changes in the composition of the group –730 25 –3 –28 5 9 229 390 –499 396Exchange rate differences 158 –261 –340 –71 –17 –5 –113 –18 –312 –355Disposals –6 –1 –12 –13 –1 –19 –14Closing balance 2,084 2,301 3,070 2,245 881 472 880 722 6,915 5,740
Gross carrying amount as at 31 December 2,980 2,946 3,225 2,245 1,988 1,379 1,125 766 9,318 7,336Accumulated amortisation as at 31 December –896 –645 –1,051 –878 –200 –43 –2,147 –1,566Accumulated impairments as at 31 December –155 –56 –29 –45 –1 –256 –30Net book value 2,084 2,301 3,070 2,245 881 472 880 722 6,915 5,740
Amortisation of software and other intangible assets is included in the profit and loss account in Other operating expenses and Intangible amortisation and other impairments. Amortisation of VOBA is included in Underwriting expenditure.
Additions to goodwill in 2008 include mainly EUR 371 million related to the acquisition of Interhyp AG, EUR 462 million related to the acquisition of CitiStreet, EUR 285 million related to the acquisition of the pension business of Santander Chile, EUR 69 million related to the acquisition of Oyak Emeklilik and EUR 9 million related to the acquisition of Universal Lease Iberia. The additions to Other intangibles in 2008 includes EUR 31 million related to the acquisition of the pension business of Santander Chile and EUR 73 million related to the acquisition of CitiStreet. Reference is made to Note 29 ‘Companies acquired and companies disposed’. The additions to Other intangibles also include EUR 50 million related to Interhyp AG.
Goodwill is tested for impairment at the lowest level at which it is monitored for internal management purposes (so called ‘reporting units’). Goodwill is allocated to reporting units as follows:
Goodwill allocation to reporting units
2008 2007
Insurance Americas – Latin America 543 473Insurance Americas – United States 501Insurance Americas – Canada 71 84Insurance Asia/Pacific – South Korea 164 107Insurance Asia/Pacific – Rest of Asia 186 224Insurance Europe – Benelux 49 49Insurance Europe – Rest of Europe 124 54Retail Banking – Central Europe 839 1,015Retail Banking – South West Europe 49 49Retail Banking – Netherlands 1ING Direct 456 94Wholesale Banking Leasing & Factoring 61 65Wholesale Banking Real Estate 11 16Wholesale Banking Other 15 15
3,070 2,245
ING Group Annual Report 2008
118

As a result of the nationalisation of AFJP Pension in Argentina goodwill of EUR 155 million was written off.
Goodwill is tested for impairment by comparing the book value of the reporting unit (including goodwill) to the best estimate of the fair value of the reporting unit. As a first step the best estimate of the fair value is determined based on a Sum of the Parts valuation (SOP). If the outcome of the SOP indicates that there is not a significant margin between fair value and book value, a more thorough analysis of the fair value is determined. The main assumptions in the SOP valuation include forecast results, business growth, discount rates, value of new business, market value surplus, etc. For listed companies the relevant market price is used. The more detailed analysis uses valuation models similar to those of the original valuation of an acquisition, European embedded value, peer reviews, etc. The valuation models are validated and include development of the business following the acquisition, the latest management forecasts of income and expenditure and updates of future projections, review of discount rates and terminal growth rates, etc. Peer reviews include analysis of Price/Earnings and Price/Book multiples of comparable listed companies. Assumptions are generally based on past experience, management’s best estimate of future developments and, where available, relevant external information. Market developments during 2008 have significantly impacted estimated fair values of the reporting units. However, the goodwill impairment test as at 31 December 2008, using best estimate assumptions and reasonable likely changes therein, have not resulted in impairment (2007: nil).
Management believes that it may be reasonably possible that if ongoing market volatility adversely impacts the performance of the reporting units Retail Banking – Central Europe and Insurance Americas – United States, compared with what was assumed in the year-end 2008 goodwill impairment test, the book value (including goodwill) of these reporting units may exceed the fair values resulting in impairments.
10 DEFERRED ACQUISITION COSTS
Changes in deferred acquisition costs
Investment contracts Life insurance Non-life insurance Total2008 2007 2008 2007 2008 2007 2008 2007
Opening balance 101 83 10,183 9,645 408 435 10,692 10,163Capitalised 50 31 2,495 2,766 126 257 2,671 3,054Amortisation and unlocking –12 –12 –1,884 –1,294 –130 –274 –2,026 –1,580Effect of unrealised revaluations in equity 1,523 43 1,523 43
Changes in the composition of the group –34 –1,289 –104 –5 –1,427 –5Exchange rate differences –16 –1 461 –938 –35 10 410 –929Disposal of portfolios –39 –15 –54Closing balance 89 101 11,489 10,183 265 408 11,843 10,692
For flexible life insurance contracts the growth rate assumption used to calculate the amortisation of the deferred acquisition costs for 2008 is 6.4% gross and 5.6% net of investment management fees (2007: 6.6% gross and 5.6% net of investment management fees).
In 2008, Changes in the composition of the group related for EUR 1,164 million to the sale of ING Life Taiwan.
11 OTHER ASSETS
Other assets by type
2008 2007
Reinsurance and insurance receivables 3,683 3,664Deferred tax assets 8,034 2,723Property held for sale 3,143 2,993Income tax receivable 776 974Accrued interest and rents 20,156 17,818Other accrued assets 1,758 1,099Pension assets 1,781 439Taiwan – assets held for sale 15,312Other receivables 8,334 10,389
62,977 40,099
Disclosures in respect of deferred tax assets and pension assets are provided in Note 21 ‘Other liabilities’.
119ING Group Annual Report 2008

2.1 Consolidated annual accounts
Notes to the consolidated balance sheet of ING Group (continued)
Accrued interest and rents includes EUR 7,980 million (2007: EUR 8,844 million) accrued interest on assets measured at amortised cost under the IAS 39 classification Loans and receivables.
The total amount of borrowing costs relating to Property under development for third parties, capitalised in 2008 is nil (2007: nil).
Reinsurance and insurance receivables
2008 2007
Receivables on account of direct insurance from:– policyholders 2,750 2,211– intermediaries 191 283Reinsurance receivables 742 1,170
3,683 3,664
Property held for sale
2008 2007
Property held for sale 640 530Other:– property obtained from foreclosures 91 48– property developed for sale 2,412 2,415
3,143 2,993
Gross carrying amount as at 31 December 3,276 3,104Accumulated impairments as at 31 December –133 –111Net book value 3,143 2,993
Taiwan – assets held for sale
2008
Cash and bank balances 80Financial assets at fair value through profit and loss 1,552Available-for-sale Investments 9,801Loans and advances to customers 1,341Property and equipment 41Intangible assets 671Deferred acquisition costs 1,164Other assets 662Taiwan – assets held for sale 15,312
Reference is made to Note 29 ‘Companies acquired and disposed’. As at 31 December 2008 ING Life Taiwan is classified as held for sale in the consolidated balance sheet. Amounts as at 31 December 2007 are presented in the relevant balance sheet lines.
ING Group Annual Report 2008
120
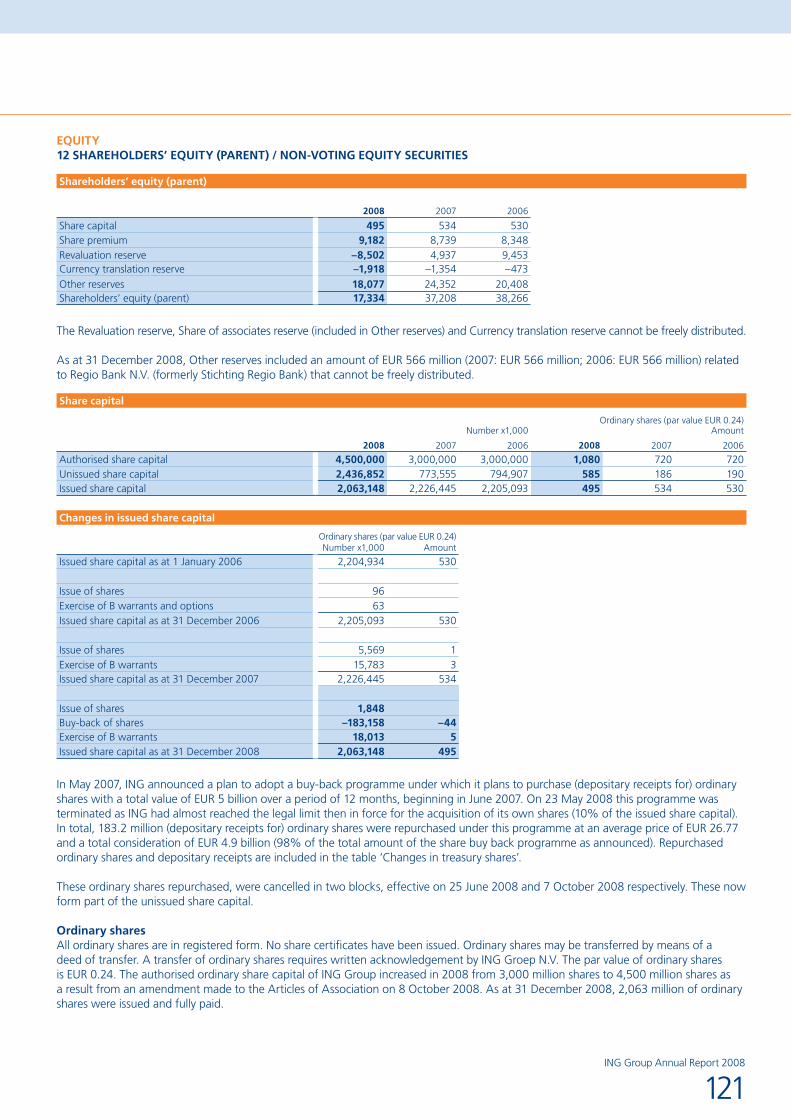
EQUITY12 SHAREHOLDERS’ EQUITY (PARENT) / NON-VOTING EQUITY SECURITIES
Shareholders’ equity (parent)
2008 2007 2006
Share capital 495 534 530Share premium 9,182 8,739 8,348Revaluation reserve –8,502 4,937 9,453Currency translation reserve –1,918 –1,354 –473Other reserves 18,077 24,352 20,408Shareholders’ equity (parent) 17,334 37,208 38,266
The Revaluation reserve, Share of associates reserve (included in Other reserves) and Currency translation reserve cannot be freely distributed.
As at 31 December 2008, Other reserves included an amount of EUR 566 million (2007: EUR 566 million; 2006: EUR 566 million) related to Regio Bank N.V. (formerly Stichting Regio Bank) that cannot be freely distributed.
Share capital
Ordinary shares (par value EUR 0.24)Number x1,000 Amount
2008 2007 2006 2008 2007 2006
Authorised share capital 4,500,000 3,000,000 3,000,000 1,080 720 720Unissued share capital 2,436,852 773,555 794,907 585 186 190Issued share capital 2,063,148 2,226,445 2,205,093 495 534 530
Changes in issued share capital
Ordinary shares (par value EUR 0.24)Number x1,000 Amount
Issued share capital as at 1 January 2006 2,204,934 530
Issue of shares 96Exercise of B warrants and options 63Issued share capital as at 31 December 2006 2,205,093 530
Issue of shares 5,569 1Exercise of B warrants 15,783 3Issued share capital as at 31 December 2007 2,226,445 534
Issue of shares 1,848 Buy-back of shares –183,158 –44Exercise of B warrants 18,013 5Issued share capital as at 31 December 2008 2,063,148 495
In May 2007, ING announced a plan to adopt a buy-back programme under which it plans to purchase (depositary receipts for) ordinary shares with a total value of EUR 5 billion over a period of 12 months, beginning in June 2007. On 23 May 2008 this programme was terminated as ING had almost reached the legal limit then in force for the acquisition of its own shares (10% of the issued share capital). In total, 183.2 million (depositary receipts for) ordinary shares were repurchased under this programme at an average price of EUR 26.77 and a total consideration of EUR 4.9 billion (98% of the total amount of the share buy back programme as announced). Repurchased ordinary shares and depositary receipts are included in the table ‘Changes in treasury shares’.
These ordinary shares repurchased, were cancelled in two blocks, effective on 25 June 2008 and 7 October 2008 respectively. These now form part of the unissued share capital.
Ordinary sharesAll ordinary shares are in registered form. No share certificates have been issued. Ordinary shares may be transferred by means of a deed of transfer. A transfer of ordinary shares requires written acknowledgement by ING Groep N.V. The par value of ordinary shares is EUR 0.24. The authorised ordinary share capital of ING Group increased in 2008 from 3,000 million shares to 4,500 million shares as a result from an amendment made to the Articles of Association on 8 October 2008. As at 31 December 2008, 2,063 million of ordinary shares were issued and fully paid.
121ING Group Annual Report 2008
2.1 Consolidated annual accounts
Depositary receipts for ordinary sharesMore than 99% of the ordinary shares issued by ING Groep N.V. are held by Stichting ING Aandelen (ING Trust Office). In exchange for these shares, the Trust Office has issued depositary receipts in bearer form for ordinary shares. The depositary receipts are listed on various stock exchanges. Depositary receipts can be exchanged for (non-listed) ordinary shares without any restriction.
The holder of a depositary receipt is entitled to receive from the Trust Office payment of dividends and distributions corresponding to the dividends and distributions received by the Trust Office on an ordinary share.
In addition, the holder of a depositary receipt is entitled to attend and to speak at the General Meeting of Shareholders of ING Groep N.V. either in person or by proxy. A holder of a depositary receipt, who thus attends the General Meeting of Shareholders, is entitled to vote as a proxy of the Trust Office but entirely at his own discretion for a number of shares equal to the number of his depositary receipts.
A holder of depositary receipts who does not attend the General Meeting of Shareholders in person or by proxy is entitled to give a binding voting instruction to the Trust Office for a number of shares equal to the number of his depositary receipts.
Depositary receipts for ordinary shares held by ING Group (Treasury shares)As at 31 December 2008, 36.5 million (2007: 126.8 million; 2006: 53.8 million) depositary receipts for ordinary shares ING Groep N.V. with a par value of EUR 0.24 were held by ING Groep N.V. or its subsidiaries. These depositary receipts for ordinary shares were purchased to hedge option rights granted to the Executive Board members and other employees.
Restrictions with respect to dividend and repayment of capitalING Groep N.V. is subject to legal restrictions regarding the amount of dividends it can pay to the holders of its ordinary shares. Pursuant to the Dutch Civil Code, dividends can only be paid up to an amount equal to the excess of the company’s own funds over the sum of the paid-up capital and reserves required by law.
Moreover, ING Groep N.V.’s ability to pay dividends is dependent on the dividend payment ability of its subsidiaries. ING Groep N.V. is legally required to create a non-distributable reserve insofar profits of its subsidiaries are subject to dividend payment restrictions which apply to those subsidiaries themselves. Such restrictions may among others be of a similar nature as the restrictions which apply to ING Groep N.V. Furthermore there can be restrictions as a result of minimum capital requirements that are imposed by industry regulators in the countries in which the subsidiaries operate, or other limitations which may exist in certain countries.
Without prejudice to the authority of the Executive Board to allocate profits to reserves and to the fact that the ordinary shares are the most junior securities issued by ING Groep N.V., no specific dividend payment restrictions with respect to ordinary shares exist.
Furthermore, ING Groep N.V. is subject to legal restrictions with respect to repayment of capital to holders of ordinary shares. Capital may be repaid to the holders of ordinary shares pursuant to an amendment of ING Groep N.V.’s Articles of Association whereby the ordinary shares are written down.
Pursuant to the Dutch Civil Code, capital may only be repaid if none of ING Groep N.V.’s creditors opposes such a repayment within two months following the announcement of a resolution to that effect.
On a distribution of a dividend ING Groep N.V. is in principle required to withhold an income tax on dividends at a rate of 15%.
B warrantsIn 1998, ING Groep N.V. authorised the issue of a maximum of 17,317,132 B warrants, of which 17,220,200 were issued. On 5 January 2008 of the remaining 9,266,097 warrants, 259,484 warrants expired and 9,006,613 were exercised. Accordingly no B warrants were outstanding anymore as at 31 December 2008 (2007: 9,266,097; 2006: 17,157,891). B warrant holders were entitled to obtain from ING Groep N.V., for a fixed price, depositary receipts for ordinary shares in the proportion of one B warrant to two depositary receipts. B warrant holders could exercise their rights at their own discretion but no later than 5 January 2008.
The closing date for exercising warrants B was 5 January 2008. The exercise price of warrants B was EUR 49.92 for two depositary receipts.
Non-voting equity securitiesOn 12 November 2008, ING Groep N.V. issued EUR 10 billion non-voting equity securities to the Dutch government. This was effected by issuing one billion securities with an issue price of EUR 10 each. The nominal value of each security is EUR 0.24.
Notes to the consolidated balance sheet of ING Group (continued)
ING Group Annual Report 2008
122
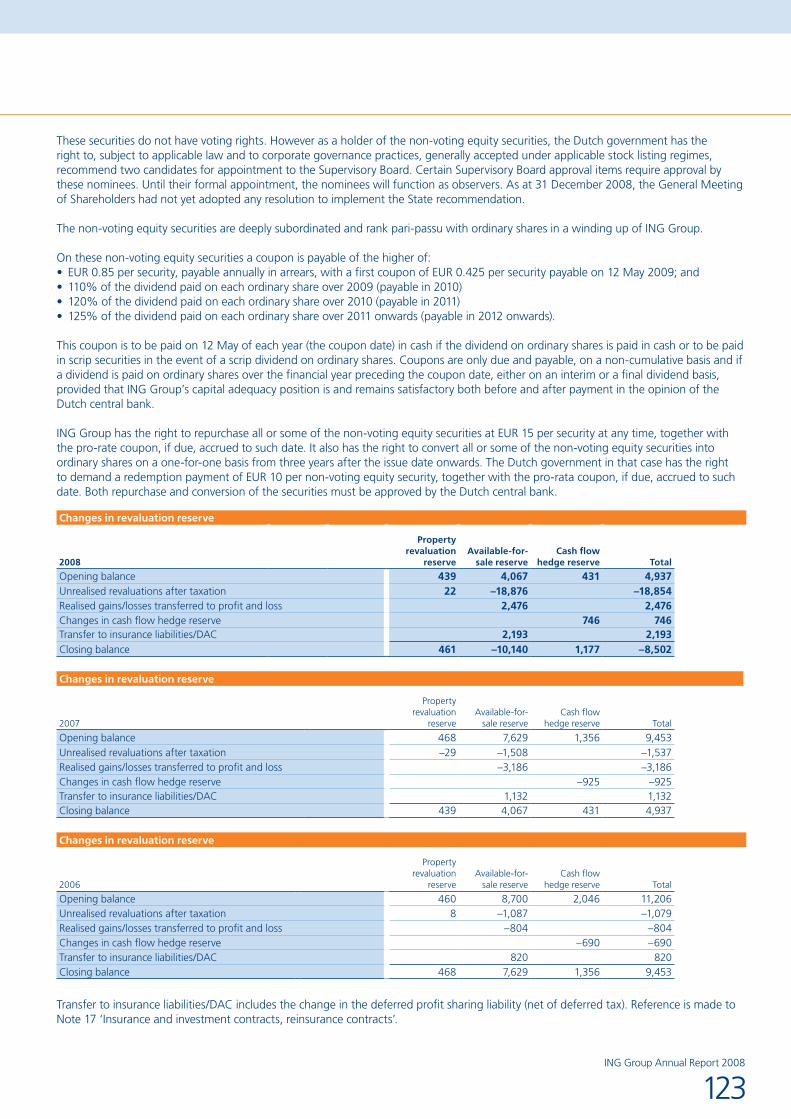
These securities do not have voting rights. However as a holder of the non-voting equity securities, the Dutch government has the right to, subject to applicable law and to corporate governance practices, generally accepted under applicable stock listing regimes, recommend two candidates for appointment to the Supervisory Board. Certain Supervisory Board approval items require approval by these nominees. Until their formal appointment, the nominees will function as observers. As at 31 December 2008, the General Meeting of Shareholders had not yet adopted any resolution to implement the State recommendation.
The non-voting equity securities are deeply subordinated and rank pari-passu with ordinary shares in a winding up of ING Group.
On these non-voting equity securities a coupon is payable of the higher of:EUR 0.85 per security, payable annually in arrears, with a first coupon of EUR 0.425 per security payable on 12 May 2009; and•110% of the dividend paid on each ordinary share over 2009 (payable in 2010)•120% of the dividend paid on each ordinary share over 2010 (payable in 2011)•125% of the dividend paid on each ordinary share over 2011 onwards (payable in 2012 onwards).•
This coupon is to be paid on 12 May of each year (the coupon date) in cash if the dividend on ordinary shares is paid in cash or to be paid in scrip securities in the event of a scrip dividend on ordinary shares. Coupons are only due and payable, on a non-cumulative basis and if a dividend is paid on ordinary shares over the financial year preceding the coupon date, either on an interim or a final dividend basis, provided that ING Group’s capital adequacy position is and remains satisfactory both before and after payment in the opinion of the Dutch central bank.
ING Group has the right to repurchase all or some of the non-voting equity securities at EUR 15 per security at any time, together with the pro-rate coupon, if due, accrued to such date. It also has the right to convert all or some of the non-voting equity securities into ordinary shares on a one-for-one basis from three years after the issue date onwards. The Dutch government in that case has the right to demand a redemption payment of EUR 10 per non-voting equity security, together with the pro-rata coupon, if due, accrued to such date. Both repurchase and conversion of the securities must be approved by the Dutch central bank.
Changes in revaluation reserve
2008
Property revaluation
reserveAvailable-for-
sale reserveCash flow
hedge reserve Total
Opening balance 439 4,067 431 4,937Unrealised revaluations after taxation 22 –18,876 –18,854Realised gains/losses transferred to profit and loss 2,476 2,476Changes in cash flow hedge reserve 746 746Transfer to insurance liabilities/DAC 2,193 2,193Closing balance 461 –10,140 1,177 –8,502
Changes in revaluation reserve
2007
Property revaluation
reserveAvailable-for-
sale reserveCash flow
hedge reserve Total
Opening balance 468 7,629 1,356 9,453Unrealised revaluations after taxation –29 –1,508 –1,537Realised gains/losses transferred to profit and loss –3,186 –3,186Changes in cash flow hedge reserve –925 –925Transfer to insurance liabilities/DAC 1,132 1,132Closing balance 439 4,067 431 4,937
Changes in revaluation reserve
2006
Property revaluation
reserveAvailable-for-
sale reserveCash flow
hedge reserve Total
Opening balance 460 8,700 2,046 11,206Unrealised revaluations after taxation 8 –1,087 –1,079Realised gains/losses transferred to profit and loss –804 –804Changes in cash flow hedge reserve –690 –690Transfer to insurance liabilities/DAC 820 820Closing balance 468 7,629 1,356 9,453
Transfer to insurance liabilities/DAC includes the change in the deferred profit sharing liability (net of deferred tax). Reference is made to Note 17 ‘Insurance and investment contracts, reinsurance contracts’.
123ING Group Annual Report 2008
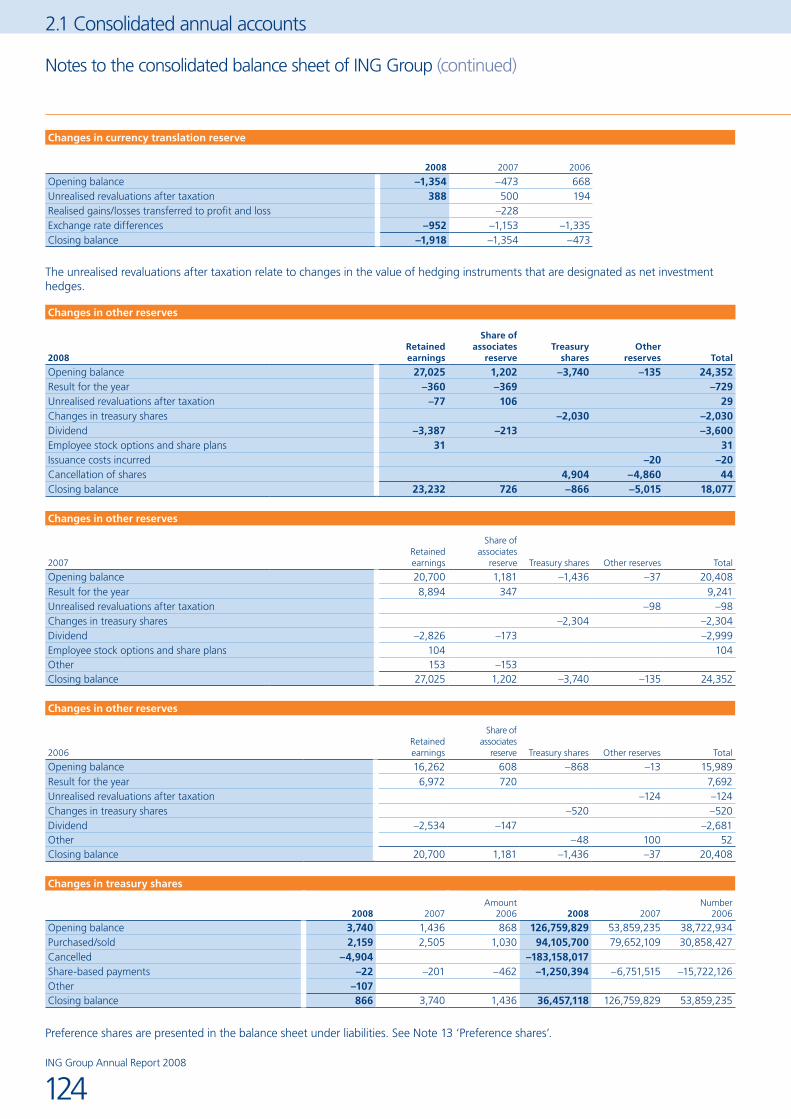
2.1 Consolidated annual accounts
Notes to the consolidated balance sheet of ING Group (continued)
Changes in currency translation reserve
2008 2007 2006
Opening balance –1,354 –473 668Unrealised revaluations after taxation 388 500 194Realised gains/losses transferred to profit and loss –228Exchange rate differences –952 –1,153 –1,335Closing balance –1,918 –1,354 –473
The unrealised revaluations after taxation relate to changes in the value of hedging instruments that are designated as net investment hedges.
Changes in other reserves
2008Retained earnings
Share of associates
reserveTreasury
sharesOther
reserves Total
Opening balance 27,025 1,202 –3,740 –135 24,352Result for the year –360 –369 –729Unrealised revaluations after taxation –77 106 29Changes in treasury shares –2,030 –2,030Dividend –3,387 –213 –3,600Employee stock options and share plans 31 31Issuance costs incurred –20 –20Cancellation of shares 4,904 –4,860 44 Closing balance 23,232 726 –866 –5,015 18,077
Changes in other reserves
2007Retained earnings
Share of associates
reserve Treasury shares Other reserves Total
Opening balance 20,700 1,181 –1,436 –37 20,408Result for the year 8,894 347 9,241Unrealised revaluations after taxation –98 –98Changes in treasury shares –2,304 –2,304Dividend –2,826 –173 –2,999Employee stock options and share plans 104 104Other 153 –153Closing balance 27,025 1,202 –3,740 –135 24,352
Changes in other reserves
2006Retained earnings
Share of associates
reserve Treasury shares Other reserves Total
Opening balance 16,262 608 –868 –13 15,989Result for the year 6,972 720 7,692Unrealised revaluations after taxation –124 –124Changes in treasury shares –520 –520Dividend –2,534 –147 –2,681Other –48 100 52Closing balance 20,700 1,181 –1,436 –37 20,408
Changes in treasury shares
Amount Number2008 2007 2006 2008 2007 2006
Opening balance 3,740 1,436 868 126,759,829 53,859,235 38,722,934Purchased/sold 2,159 2,505 1,030 94,105,700 79,652,109 30,858,427Cancelled –4,904 –183,158,017Share-based payments –22 –201 –462 –1,250,394 –6,751,515 –15,722,126Other –107Closing balance 866 3,740 1,436 36,457,118 126,759,829 53,859,235
Preference shares are presented in the balance sheet under liabilities. See Note 13 ‘Preference shares’.
ING Group Annual Report 2008
124

LIABILITIES13 PREFERENCE SHARESPreference sharesThe authorised preference share capital of ING Groep N.V. was divided into two categories preference A shares and preference B shares. The share capital consisted of 100 million preference A shares with a par value of EUR 1.20 of which as at 31 December 2007 16,012,839 were issued and 1,000 million preference B shares with a par value of EUR 0.24 of which none were issued as at 31 December 2007. As at 31 December 2008 no preference A shares or preference B shares were in issue. The movement in outstanding preference shares is explained under Cancellation of preference shares.
The dividend on the preference A shares was equal to a percentage of the amount (including share premium) for which the preference A shares were originally issued. This percentage was calculated by taking the arithmetic mean of the average effective yield on the five longest-dated Dutch government loans, as determined by a Calculating Agent to be designated by the Executive Board for the last 20 stock exchange days preceding the day on which the first preference A shares are issued, or, as the case may be, preceding the day on which the dividend percentage is adjusted. The percentage thus established could be increased or decreased by not more than 0.5 percentage points, depending on the market conditions then prevailing, as the Executive Board could decide with the approval of the Supervisory Board. The dividend on the preference A shares for the financial years 2004-2013 was set at EUR 0.1582 per share per year.
Cancellation of preference sharesDuring 2008, ING Group repurchased 5,296,015 (depositary receipts for) preference A shares (2007: 57,016,572) at an average price of EUR 3.60 per share or EUR 19.1 million in total (2007: EUR 3.64 per share or EUR 207.5 million). The preference A shares (for which the depositary receipts were) thus repurchased and 10 million preference A shares for which the depositary receipts were acquired from ABN AMRO in 2007, were cancelled in two blocks on 29 February 2008 and 4 September 2008 respectively.
The remaining 716,824 preference A shares were redeemed and cancelled in accordance with ING Groep N.V.’s Articles of Association against payment of EUR 3.40 plus accrued dividend, effective 4 September 2008. From that date, there were no preference shares of ING Groep N.V. outstanding anymore.
Pursuant to an amendment of ING Groep N.V.’s Articles of Association, effected on 8 October 2008, the authorised share capital of ING Groep N.V. was adjusted in such a way that it no longer provided for preference A shares and/or preference B shares, so that such shares may no longer be issued by ING Groep N.V.
Cumulative preference sharesPursuant to the Articles of Association of ING Groep N.V. as amended on 8 October 2008, the authorised cumulative preference share capital consists of 4.5 billion cumulative preference shares, of which none have been issued. The par value of these cumulative preference shares is EUR 0.24.
The cumulative preference shares rank before the preference shares and the ordinary shares in entitlement to dividend and to distributions upon liquidation of ING Groep N.V.
The dividend on the cumulative preference shares will be equal to a percentage, calculated on the amount compulsorily paid up or yet to be paid up. This percentage shall be equal to the average of the Euro OverNight Index Average (EONIA) as calculated by the European Central Bank. During the financial year for which the distribution is made, this percentage is weighted on the basis of the number of days for which it applies, increased by 2.5 percentage points.
If and to the extent that the profit available for distribution is not sufficient to pay the dividend referred to above in full, the shortfall will be made up from the reserves insofar as possible. If, and to the extent that, the dividend distribution cannot be made from the reserves, the profits earned in subsequent years shall first be used to make up the shortfall before any distribution may be made on shares of any other category.
ING Groep N.V.’s Articles of Association make provision for the cancellation of cumulative preference shares. Upon cancellation of cumulative preference shares and upon liquidation of ING Groep N.V., the amount paid up on the cumulative preference shares will be repaid together with the dividend shortfall in preceding years, insofar as this shortfall has not yet been made up.
Restrictions with respect to dividend and repayment of capitalING Groep N.V. is subject to legal restrictions regarding the amount of dividends it can pay to the holders of its cumulative preference shares, when issued. Pursuant to the Dutch Civil Code, dividends can only be paid up to an amount equal to the excess of the company’s own funds over the sum of the paid-up capital, and reserves required by law.
125ING Group Annual Report 2008

2.1 Consolidated annual accounts
Moreover, ING Groep N.V.’s ability to pay dividends is dependent on the dividend payment ability of its subsidiaries. ING Groep N.V. is legally required to create a non-distributable reserve insofar profits of its subsidiaries are subject to dividend payment restrictions which apply to those subsidiaries themselves. Such restrictions may among others be of a similar nature as the restrictions which apply to ING Groep N.V. or may be the result of minimum capital requirements that are imposed by industry regulators in the countries in which the subsidiaries operate, or other limitations which may exist in certain countries.
Without prejudice to the fact that the cumulative preference shares, when issued, will be junior securities of ING Groep N.V., no specific dividend payment restrictions with respect to the cumulative preference shares exist.
Furthermore, ING Groep N.V. is subject to legal restrictions with respect to repayment of capital to holders of cumulative preference shares. Capital may be repaid to the holders of cumulative preference shares pursuant to (i) an amendment of ING Groep N.V.’s articles of association whereby the cumulative preference shares are written down or (ii) a resolution to redeem and cancel the cumulative preference shares.
Pursuant to the Dutch Civil Code, capital may only be repaid if none of ING Groep N.V.’s creditors opposes such a repayment within two months following the announcement of a resolution to that effect.
14 SUBORDINATED LOANS
Subordinated loans
Interest rate Year of Issue Due date
Notional amount in original
currency Balance sheet value2008 2007
9.000% 2008 Perpetual EUR 10 108.500% 2008 Perpetual USD 2,000 1,3938.000% 2008 Perpetual EUR 1,500 1,4747.375% 2007 Perpetual USD 1,500 1,048 9886.375% 2007 Perpetual USD 1,045 731 6905.140% 2006 Perpetual GBP 600 623 8105.775% 2005 Perpetual USD 1,000 711 6746.125% 2005 Perpetual USD 700 487 4624.176% 2005 Perpetual EUR 500 497 497Variable 2004 Perpetual EUR 1,000 939 9376.200% 2003 Perpetual USD 500 348 330Variable 2003 Perpetual EUR 750 684 6827.200% 2002 Perpetual USD 1,100 773 7267.050% 2002 Perpetual USD 800 563 529
10,281 7,325
Subordinated loans consist of perpetual subordinated bonds issued by ING Groep N.V. These bonds have been issued to raise hybrid capital for ING Verzekeringen N.V. and Tier-1 capital for ING Bank N.V. Under IFRS-EU these bonds are classified as liabilities. They are considered capital for regulatory purposes.
Except for the 9% 2008 perpetual of EUR 10 million (a private placement), these loans have been subsequently provided as subordinated loans by ING Groep N.V. to ING Verzekeringen N.V. and ING Bank N.V. under the same conditions as the original bonds as follows:
Subordinated loans provided by ING Groep N.V. to ING Bank N.V. and ING Verzekeringen N.V.
2008 2007
ING Bank N.V. 5,800 5,166ING Verzekeringen N.V. 4,471 2,159
10,271 7,325
The number of subordinated loans held by group companies as at 31 December 2008 was 32,759 with a balance sheet value of EUR 1 million (2007: 35,040 with a balance sheet value of nil).
Notes to the consolidated balance sheet of ING Group (continued)
ING Group Annual Report 2008
126
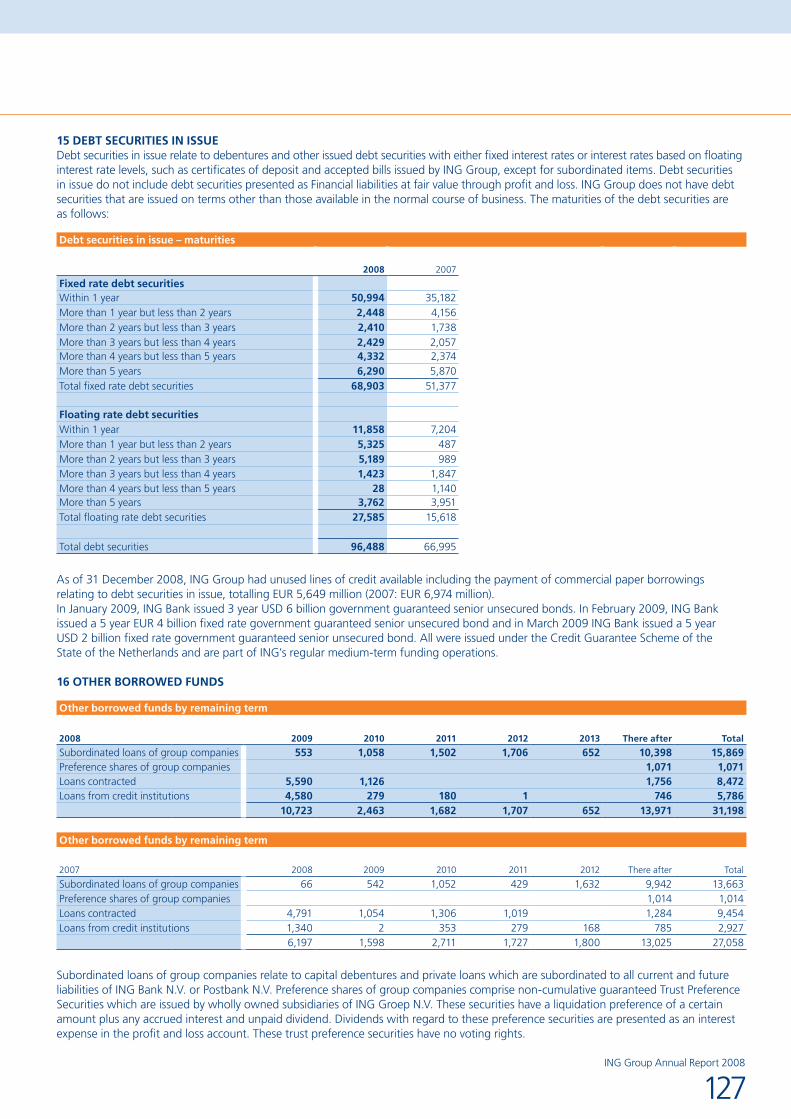
15 DEBT SECURITIES IN ISSUEDebt securities in issue relate to debentures and other issued debt securities with either fixed interest rates or interest rates based on floating interest rate levels, such as certificates of deposit and accepted bills issued by ING Group, except for subordinated items. Debt securities in issue do not include debt securities presented as Financial liabilities at fair value through profit and loss. ING Group does not have debt securities that are issued on terms other than those available in the normal course of business. The maturities of the debt securities are as follows:
Debt securities in issue – maturities
2008 2007
Fixed rate debt securitiesWithin 1 year 50,994 35,182More than 1 year but less than 2 years 2,448 4,156More than 2 years but less than 3 years 2,410 1,738More than 3 years but less than 4 years 2,429 2,057More than 4 years but less than 5 years 4,332 2,374More than 5 years 6,290 5,870Total fixed rate debt securities 68,903 51,377
Floating rate debt securitiesWithin 1 year 11,858 7,204More than 1 year but less than 2 years 5,325 487More than 2 years but less than 3 years 5,189 989More than 3 years but less than 4 years 1,423 1,847More than 4 years but less than 5 years 28 1,140More than 5 years 3,762 3,951Total floating rate debt securities 27,585 15,618
Total debt securities 96,488 66,995
As of 31 December 2008, ING Group had unused lines of credit available including the payment of commercial paper borrowings relating to debt securities in issue, totalling EUR 5,649 million (2007: EUR 6,974 million).In January 2009, ING Bank issued 3 year USD 6 billion government guaranteed senior unsecured bonds. In February 2009, ING Bank issued a 5 year EUR 4 billion fixed rate government guaranteed senior unsecured bond and in March 2009 ING Bank issued a 5 year USD 2 billion fixed rate government guaranteed senior unsecured bond. All were issued under the Credit Guarantee Scheme of the State of the Netherlands and are part of ING’s regular medium-term funding operations.
16 OTHER BORROWED FUNDS
Other borrowed funds by remaining term
2008 2009 2010 2011 2012 2013 There after Total
Subordinated loans of group companies 553 1,058 1,502 1,706 652 10,398 15,869Preference shares of group companies 1,071 1,071Loans contracted 5,590 1,126 1,756 8,472Loans from credit institutions 4,580 279 180 1 746 5,786
10,723 2,463 1,682 1,707 652 13,971 31,198
Other borrowed funds by remaining term
2007 2008 2009 2010 2011 2012 There after Total
Subordinated loans of group companies 66 542 1,052 429 1,632 9,942 13,663Preference shares of group companies 1,014 1,014Loans contracted 4,791 1,054 1,306 1,019 1,284 9,454Loans from credit institutions 1,340 2 353 279 168 785 2,927
6,197 1,598 2,711 1,727 1,800 13,025 27,058
Subordinated loans of group companies relate to capital debentures and private loans which are subordinated to all current and future liabilities of ING Bank N.V. or Postbank N.V. Preference shares of group companies comprise non-cumulative guaranteed Trust Preference Securities which are issued by wholly owned subsidiaries of ING Groep N.V. These securities have a liquidation preference of a certain amount plus any accrued interest and unpaid dividend. Dividends with regard to these preference securities are presented as an interest expense in the profit and loss account. These trust preference securities have no voting rights.
127ING Group Annual Report 2008
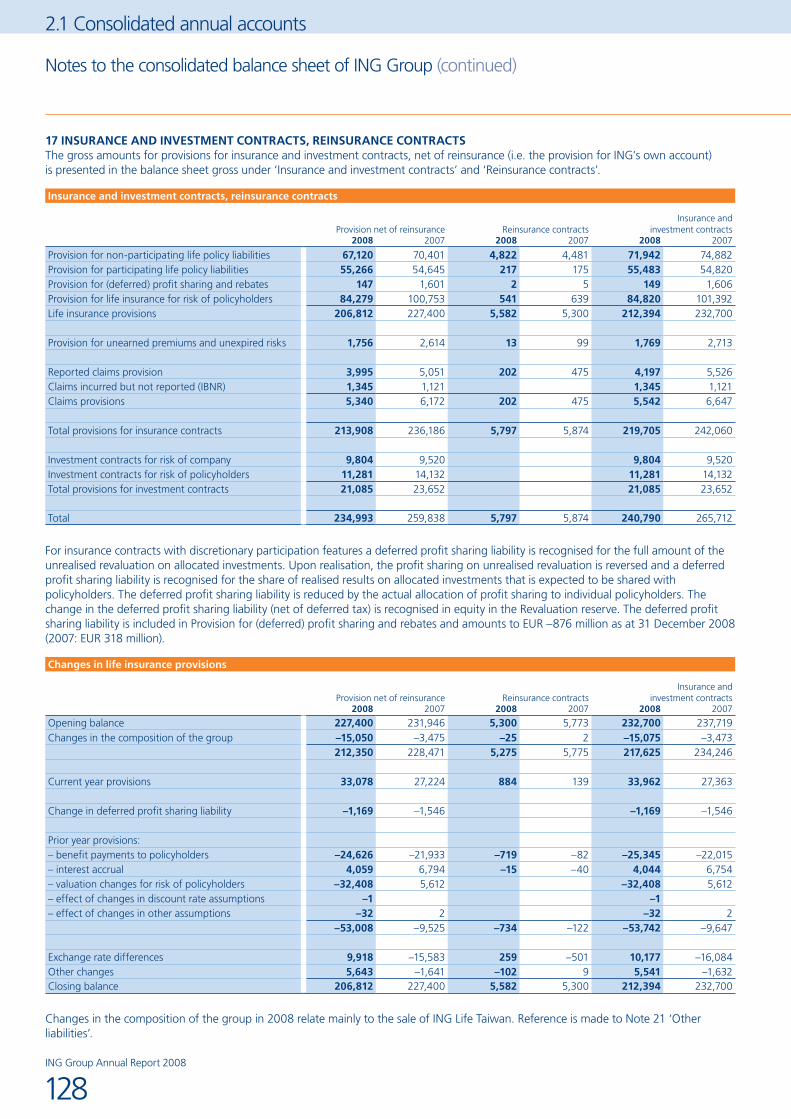
2.1 Consolidated annual accounts
17 INSURANCE AND INVESTMENT CONTRACTS, REINSURANCE CONTRACTSThe gross amounts for provisions for insurance and investment contracts, net of reinsurance (i.e. the provision for ING’s own account) is presented in the balance sheet gross under ‘Insurance and investment contracts’ and ‘Reinsurance contracts’.
Insurance and investment contracts, reinsurance contracts
Provision net of reinsurance Reinsurance contracts
Insurance and
investment contracts2008 2007 2008 2007 2008 2007
Provision for non-participating life policy liabilities 67,120 70,401 4,822 4,481 71,942 74,882Provision for participating life policy liabilities 55,266 54,645 217 175 55,483 54,820Provision for (deferred) profit sharing and rebates 147 1,601 2 5 149 1,606Provision for life insurance for risk of policyholders 84,279 100,753 541 639 84,820 101,392Life insurance provisions 206,812 227,400 5,582 5,300 212,394 232,700
Provision for unearned premiums and unexpired risks 1,756 2,614 13 99 1,769 2,713
Reported claims provision 3,995 5,051 202 475 4,197 5,526Claims incurred but not reported (IBNR) 1,345 1,121 1,345 1,121Claims provisions 5,340 6,172 202 475 5,542 6,647
Total provisions for insurance contracts 213,908 236,186 5,797 5,874 219,705 242,060
Investment contracts for risk of company 9,804 9,520 9,804 9,520Investment contracts for risk of policyholders 11,281 14,132 11,281 14,132Total provisions for investment contracts 21,085 23,652 21,085 23,652
Total 234,993 259,838 5,797 5,874 240,790 265,712
For insurance contracts with discretionary participation features a deferred profit sharing liability is recognised for the full amount of the unrealised revaluation on allocated investments. Upon realisation, the profit sharing on unrealised revaluation is reversed and a deferred profit sharing liability is recognised for the share of realised results on allocated investments that is expected to be shared with policyholders. The deferred profit sharing liability is reduced by the actual allocation of profit sharing to individual policyholders. The change in the deferred profit sharing liability (net of deferred tax) is recognised in equity in the Revaluation reserve. The deferred profit sharing liability is included in Provision for (deferred) profit sharing and rebates and amounts to EUR –876 million as at 31 December 2008 (2007: EUR 318 million).
Changes in life insurance provisions
Provision net of reinsurance Reinsurance contracts
Insurance and
investment contracts2008 2007 2008 2007 2008 2007
Opening balance 227,400 231,946 5,300 5,773 232,700 237,719Changes in the composition of the group –15,050 –3,475 –25 2 –15,075 –3,473
212,350 228,471 5,275 5,775 217,625 234,246
Current year provisions 33,078 27,224 884 139 33,962 27,363
Change in deferred profit sharing liability –1,169 –1,546 –1,169 –1,546
Prior year provisions:– benefit payments to policyholders –24,626 –21,933 –719 –82 –25,345 –22,015– interest accrual 4,059 6,794 –15 –40 4,044 6,754– valuation changes for risk of policyholders –32,408 5,612 –32,408 5,612– effect of changes in discount rate assumptions –1 –1– effect of changes in other assumptions –32 2 –32 2
–53,008 –9,525 –734 –122 –53,742 –9,647
Exchange rate differences 9,918 –15,583 259 –501 10,177 –16,084Other changes 5,643 –1,641 –102 9 5,541 –1,632Closing balance 206,812 227,400 5,582 5,300 212,394 232,700
Changes in the composition of the group in 2008 relate mainly to the sale of ING Life Taiwan. Reference is made to Note 21 ‘Other liabilities’.
Notes to the consolidated balance sheet of ING Group (continued)
ING Group Annual Report 2008
128
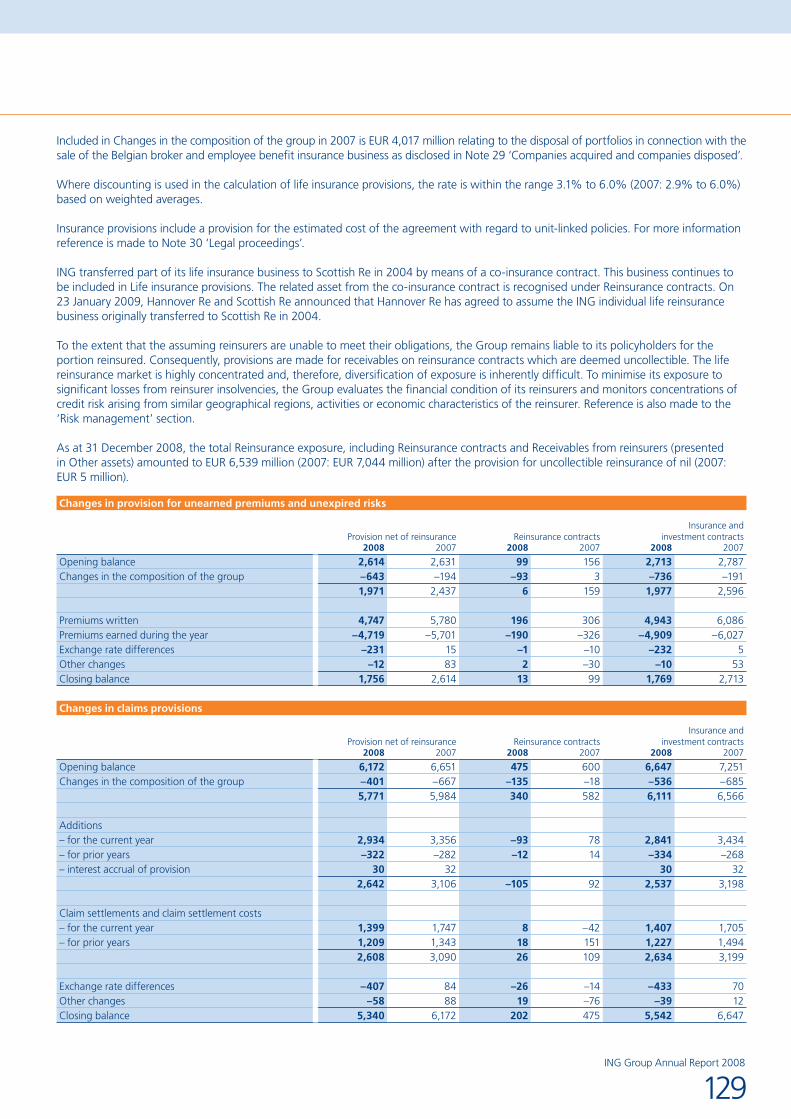
Included in Changes in the composition of the group in 2007 is EUR 4,017 million relating to the disposal of portfolios in connection with the sale of the Belgian broker and employee benefit insurance business as disclosed in Note 29 ‘Companies acquired and companies disposed’.
Where discounting is used in the calculation of life insurance provisions, the rate is within the range 3.1% to 6.0% (2007: 2.9% to 6.0%) based on weighted averages.
Insurance provisions include a provision for the estimated cost of the agreement with regard to unit-linked policies. For more information reference is made to Note 30 ‘Legal proceedings’.
ING transferred part of its life insurance business to Scottish Re in 2004 by means of a co-insurance contract. This business continues to be included in Life insurance provisions. The related asset from the co-insurance contract is recognised under Reinsurance contracts. On 23 January 2009, Hannover Re and Scottish Re announced that Hannover Re has agreed to assume the ING individual life reinsurance business originally transferred to Scottish Re in 2004.
To the extent that the assuming reinsurers are unable to meet their obligations, the Group remains liable to its policyholders for the portion reinsured. Consequently, provisions are made for receivables on reinsurance contracts which are deemed uncollectible. The life reinsurance market is highly concentrated and, therefore, diversification of exposure is inherently difficult. To minimise its exposure to significant losses from reinsurer insolvencies, the Group evaluates the financial condition of its reinsurers and monitors concentrations of credit risk arising from similar geographical regions, activities or economic characteristics of the reinsurer. Reference is also made to the ‘Risk management’ section.
As at 31 December 2008, the total Reinsurance exposure, including Reinsurance contracts and Receivables from reinsurers (presented in Other assets) amounted to EUR 6,539 million (2007: EUR 7,044 million) after the provision for uncollectible reinsurance of nil (2007: EUR 5 million).
Changes in provision for unearned premiums and unexpired risks
Provision net of reinsurance Reinsurance contracts
Insurance and
investment contracts2008 2007 2008 2007 2008 2007
Opening balance 2,614 2,631 99 156 2,713 2,787Changes in the composition of the group –643 –194 –93 3 –736 –191
1,971 2,437 6 159 1,977 2,596
Premiums written 4,747 5,780 196 306 4,943 6,086Premiums earned during the year –4,719 –5,701 –190 –326 –4,909 –6,027Exchange rate differences –231 15 –1 –10 –232 5Other changes –12 83 2 –30 –10 53Closing balance 1,756 2,614 13 99 1,769 2,713
Changes in claims provisions
Provision net of reinsurance Reinsurance contracts
Insurance and
investment contracts2008 2007 2008 2007 2008 2007
Opening balance 6,172 6,651 475 600 6,647 7,251Changes in the composition of the group –401 –667 –135 –18 –536 –685
5,771 5,984 340 582 6,111 6,566
Additions– for the current year 2,934 3,356 –93 78 2,841 3,434– for prior years –322 –282 –12 14 –334 –268– interest accrual of provision 30 32 30 32
2,642 3,106 –105 92 2,537 3,198
Claim settlements and claim settlement costs– for the current year 1,399 1,747 8 –42 1,407 1,705– for prior years 1,209 1,343 18 151 1,227 1,494
2,608 3,090 26 109 2,634 3,199
Exchange rate differences –407 84 –26 –14 –433 70Other changes –58 88 19 –76 –39 12Closing balance 5,340 6,172 202 475 5,542 6,647
129ING Group Annual Report 2008

2.1 Consolidated annual accounts
Notes to the consolidated balance sheet of ING Group (continued)
ING Group had an outstanding balance of EUR 52 million as at 31 December 2008 (2007: EUR 66 million) relating to environmental and asbestos claims of the insurance operations. In establishing the liability for unpaid claims and claims adjustment expenses related to asbestos related illness and toxic waste clean-up, the management of ING Group considers facts currently known and current legislation and coverage litigation. Liabilities are recognised for IBNR claims and for known claims (including the costs of related litigation) when sufficient information has been obtained to indicate the involvement of a specific insurance policy, and management can reasonably estimate its liability. In addition, liabilities are reviewed and updated regularly.
Where discounting is used in the calculation of the claims provisions, based on weighted averages, the rate is within the range of 3.0% to 4.0% (2007: 3.8% to 4.3%).
Changes in investment contracts liabilities
2008 2007
Opening balance 23,652 20,750Changes in the composition of the group –548 –277
23,104 20,473
Current year liabilities 8,635 12,890
Prior year provisions– payments to contract holders –8,472 –9,697– interest accrual 268 408– valuation changes investments –1,535 576
–9,739 –8,713
Exchange rate differences –1,111 –1,147Other changes 196 149Closing balance 21,085 23,652
Gross claims development table
Underwriting year2004 2005 2006 2007 2008 Total
Estimate of cumulative claims:At the end of underwriting year 2,023 1,891 1,889 1,898 2,851 1 year later 1,785 1,754 1,821 1,798 2 years later 1,594 1,620 1,708 3 years later 1,537 1,568 4 years later 1,520 Estimate of cumulative claims 1,520 1,568 1,708 1,798 2,851 9,445
Cumulative payments –1,153 –1,077 –1,072 –833 –1,343 –5,478367 491 636 965 1,508 3,967
Effect of discounting –35 –51 –63 –82 –125 –356Liability recognised 332 440 573 883 1,383 3,611
Liability relating to prior underwriting years 1,931Total amount recognised in the balance sheet 5,542
The Group applies the exemption provided for in IFRS-EU not to present Gross claims development for annual periods beginning before 1 January 2004 (the date of transition to IFRS-EU) as it is impracticable to obtain such information.
ING Group Annual Report 2008
130

131ING Group Annual Report 2008
18 AMOUNTS DUE TO BANKSAmounts due to banks include non-subordinated debt due to banks, other than amounts in the form of debt securities. As at 31 December 2008, liabilities concerning securities sold in repurchase transactions amounted to EUR 41,336 million (2007: EUR 29,604 million).
Amounts due to banks by type
Netherlands International Total2008 2007 2008 2007 2008 2007
Non-interest bearing 1,108 3,527 2,482 3,580 3,590 7,107Interest bearing 74,580 72,257 74,095 87,608 148,675 159,865
75,688 75,784 76,577 91,188 152,265 166,972
19 CUSTOMER DEPOSITS AND OTHER FUNDS ON DEPOSIT
Customer deposits and other funds on deposit
2008 2007
Savings accounts 263,637 275,127Credit balances on customer accounts 174,141 161,204Corporate time deposits 80,230 86,151Other 4,775 2,734
522,783 525,216
Customer deposits and other funds on deposit by type
Netherlands International Total2008 2007 2008 2007 2008 2007
Non-interest bearing 14,220 15,100 5,330 3,905 19,550 19,005Interest bearing 195,727 192,808 307,506 313,403 503,233 506,211
209,947 207,908 312,836 317,308 522,783 525,216
No funds have been entrusted to the Group by customers on terms other than those prevailing in the normal course of business. As at 31 December 2008, Customer deposits and other funds on deposit included liabilities with regard to securities sold in repurchase transactions amounting to EUR 5,759 million (2007: EUR 3,725 million).
Savings accounts relate to the balances on savings accounts, savings books, savings deposits and time deposits of personal customers. The interest payable on savings accounts, which is contractually added to the accounts, is also included.
20 FINANCIAL LIABILITIES AT FAIR VALUE THROUGH PROFIT AND LOSS
Financial liabilities at fair value through profit and loss
2008 2007
Trading liabilities 152,616 148,988Non-trading derivatives 21,773 6,951Designated as at fair value through profit and loss 14,009 13,882
188,398 169,821
Trading liabilities by type
2008 2007
Equity securities 3,338 12,271Debt securities 12,448 10,301Funds on deposit 64,463 97,857Derivatives 72,367 28,559
152,616 148,988
As at 31 December 2008, the Funds on deposit include amounts payable of EUR 63,107 million (2007: EUR 93,781 million) with regard to repurchase transactions.

ING Group Annual Report 2008
132
2.1 Consolidated annual accounts
Notes to the consolidated balance sheet of ING Group (continued)
Non-trading derivatives by type
2008 2007
Derivatives used in:– fair value hedges 8,912 958– cash flow hedges 6,089 3,188– hedges of net investments in foreign operations 370 352Other non-trading derivatives 6,402 2,453
21,773 6,951
Designated as at fair value through profit and loss by type
2008 2007
Debt securities 9,963 10,902Funds entrusted 1,972 756Subordinated liabilities 1,733 1,876Other 341 348
14,009 13,882
The change in the fair value of financial liabilities designated as at fair value through profit and loss attributable to changes in the credit risk of that liability during 2008 was EUR 230 million (2007: EUR 20 million). This change has been determined as the amount of change in fair value of the financial liability that is not attributable to changes in market conditions that gave rise to market risk (i.e. mainly interest rate risk based on yield curves).
The amount that ING Group is contractually required to pay at maturity to the holders of financial liabilities designated as at fair value through profit and loss is EUR 14,336 million (2007: EUR 13,845 million).
21 OTHER LIABILITIES
Other liabilities by type
2008 2007
Deferred tax liabilities 3,602 3,432Income tax payable 940 877Pension benefits 609 425Post-employment benefits 219 232Other staff-related liabilities 342 355Other taxation and social security contributions 1,104 1,123Deposits from reinsurers 909 427Accrued interest 17,552 13,606Costs payable 3,764 2,744Amounts payable to brokers 89 114Amounts payable to policyholders 2,231 2,283Reorganisation provision 583 619Other provisions 969 781Share-based payment plan liabilities 11 14Property under development for third parties 175 284Amounts to be settled 3,753 4,156Dividend payable 425Taiwan – liabilities held for sale 15,020Other 8,235 12,387
60,532 43,859
Other staff-related liabilities include vacation leave provisions, jubilee provisions and disability/illness provisions.
Other mainly relates to year-end accruals in the normal course of business, none of which are individually material.
Deferred taxes are calculated on all temporary differences under the liability method using tax rates applicable to the jurisdictions in which the Group is liable to taxation.

133ING Group Annual Report 2008
Changes in deferred tax
Net liability
2007
Change through
equity
Change through
net result
Changes in the
composition of the group
Exchangerate
differences OtherNet
liability2008
Investments 258 –5,409 –463 114 –268 350 –5,418Financial assets and liabilities at fair value through profit and loss 156 –2 –303 17 –10 170 28
Deferred acquisition costs and VOBA 3,047 778 36 –632 266 –14 3,481Fiscal reserve 15 –3 –1 –11 Depreciation –11 1 3 22 –4 4 15Insurance provisions –871 450 –104 571 –56 –484 –494Cash flow hedges 43 154 –10 12 78 277Other provisions –1,146 19 –255 41 –70 –11 –1,422Receivables 100 –41 –12 –1 –107 –61Loans and advances to customers 96 494 –1 –4 –25 560Unused tax losses carried forward –932 –633 97 –20 –165 –1,653Other –46 –52 24 41 –77 365 255
709 –4,061 –1,255 257 –232 150 –4,432
Comprising:– deferred tax liabilities 3,432 3,602– deferred tax assets –2,723 –8,034
709 –4,432
Changes in deferred tax
Net liability
2006
Change through
equity
Change through
net result
Changes in the
composition of the group
Exchangerate
differences OtherNet
liability2007
Investments 1,375 –1,243 213 –17 56 –126 258Financial assets and liabilities at fair value through profit and loss 119 –40 82 –11 –2 8 156Deferred acquisition costs and VOBA 3,201 3 151 –312 4 3,047Fiscal reserve 3 8 4 15Depreciation 28 3 –26 –5 1 –12 –11Insurance provisions –1,490 116 339 93 71 –871Other provisions –1,081 238 –174 –28 109 –210 –1,146Receivables 196 –128 1 –2 33 100Loans and advances to customers 102 5 –7 –1 –3 96Unused tax losses carried forward –909 –15 –26 1 76 –59 –932Other 626 –767 27 117 3 –9 –3
2,170 –1,700 459 58 21 –299 709
Comprising:– deferred tax liabilities 4,042 3,432– deferred tax assets –1,872 –2,723
2,170 709
Other in Net liability 2006 and Change through equity in 2007 mainly relates to the cash flow hedge reserve in equity.
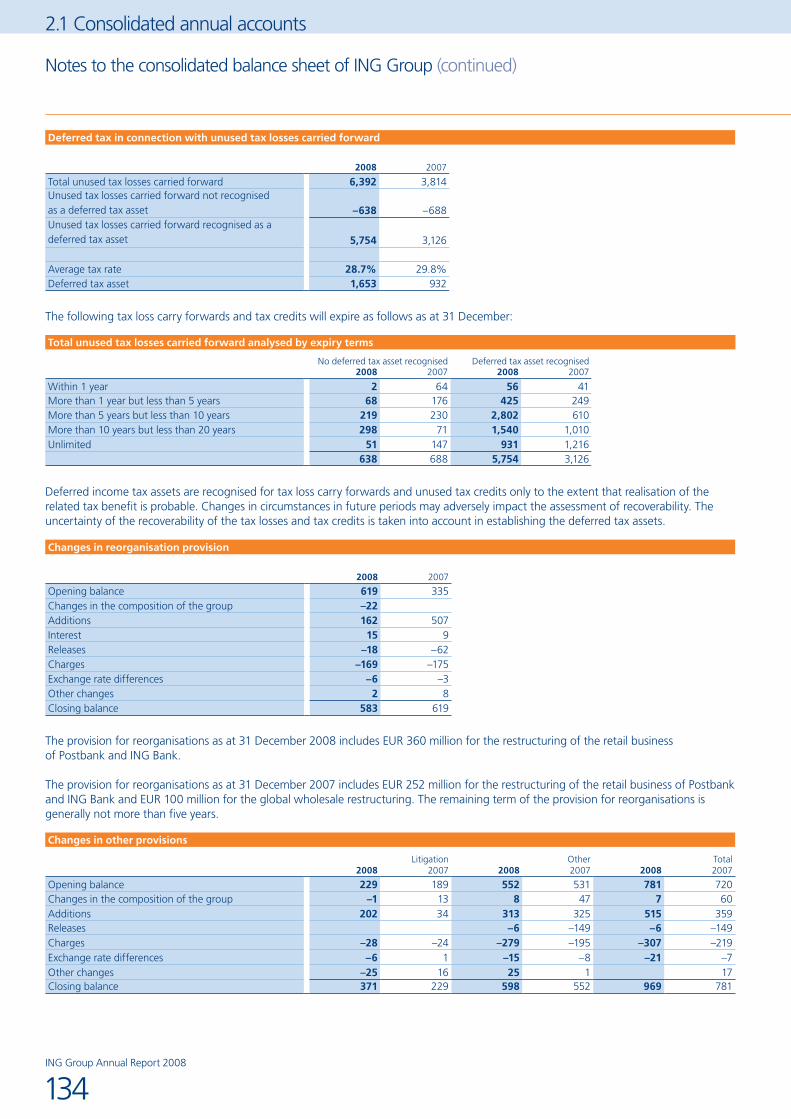
ING Group Annual Report 2008
134
2.1 Consolidated annual accounts
Notes to the consolidated balance sheet of ING Group (continued)
Deferred tax in connection with unused tax losses carried forward
2008 2007
Total unused tax losses carried forward 6,392 3,814Unused tax losses carried forward not recognised as a deferred tax asset –638 –688Unused tax losses carried forward recognised as a deferred tax asset 5,754 3,126
Average tax rate 28.7% 29.8%Deferred tax asset 1,653 932
The following tax loss carry forwards and tax credits will expire as follows as at 31 December:
Total unused tax losses carried forward analysed by expiry terms
No deferred tax asset recognised Deferred tax asset recognised2008 2007 2008 2007
Within 1 year 2 64 56 41More than 1 year but less than 5 years 68 176 425 249More than 5 years but less than 10 years 219 230 2,802 610More than 10 years but less than 20 years 298 71 1,540 1,010Unlimited 51 147 931 1,216
638 688 5,754 3,126
Deferred income tax assets are recognised for tax loss carry forwards and unused tax credits only to the extent that realisation of the related tax benefit is probable. Changes in circumstances in future periods may adversely impact the assessment of recoverability. The uncertainty of the recoverability of the tax losses and tax credits is taken into account in establishing the deferred tax assets.
Changes in reorganisation provision
2008 2007
Opening balance 619 335Changes in the composition of the group –22Additions 162 507Interest 15 9Releases –18 –62Charges –169 –175Exchange rate differences –6 –3Other changes 2 8Closing balance 583 619
The provision for reorganisations as at 31 December 2008 includes EUR 360 million for the restructuring of the retail business of Postbank and ING Bank.
The provision for reorganisations as at 31 December 2007 includes EUR 252 million for the restructuring of the retail business of Postbank and ING Bank and EUR 100 million for the global wholesale restructuring. The remaining term of the provision for reorganisations is generally not more than five years.
Changes in other provisions
Litigation Other Total2008 2007 2008 2007 2008 2007
Opening balance 229 189 552 531 781 720Changes in the composition of the group –1 13 8 47 7 60Additions 202 34 313 325 515 359Releases –6 –149 –6 –149Charges –28 –24 –279 –195 –307 –219Exchange rate differences –6 1 –15 –8 –21 –7Other changes –25 16 25 1 17Closing balance 371 229 598 552 969 781

135ING Group Annual Report 2008
Included in Other provisions in 2008 is a provision for a loss of EUR 292 million relating to the agreed disposal of ING Life Taiwan as disclosed in Note 29 ‘Companies acquired and companies disposed’.
Included in Other provisions in 2007 is a provision for a loss of EUR 129 million relating to the agreed disposal of NRG as disclosed in Note 29 ‘Companies acquired and companies disposed’.
In general, Other provisions are of a short-term nature.
The amounts included in other provisions are based on best estimates with regard to amounts and timing of cash flows required to settle the obligation.
Pension and post-employment benefits
Summary of pension benefits
2008 2007 2006 2005
Defined benefit obligation 14,271 14,499 15,758 15,782Fair value of plan assets 13,366 14,708 14,361 12,937
905 –209 1,397 2,845
Unrecognised past service costs –5 –3Unrecognised actuarial gains/(losses) –2,072 198 –687 –1,778
–1,172 –14 710 1,067
Presented as:– Other liabilities 609 425 961 1,067– Other assets –1,781 –439 –251
–1,172 –14 710 1,067
Summary of post-employment benefits
2008 2007 2006 2005
Defined benefit obligation 210 220 239 441210 220 239 441
Unrecognised past service costs 2 4 10 –6Unrecognised actuarial gains/(losses) 7 8 –2 –27
219 232 247 408
Presented as:– Other liabilities 219 232 247 408
219 232 247 408
The Group maintains defined benefit retirement plans in its major countries of operation. These plans generally cover all employees and provide benefits that are related to the remuneration and service of employees upon retirement. The benefits in some of these plans are subject to various forms of indexation. The indexation is, in some cases, at the discretion of management; in other cases it is dependent upon the sufficiency of plan assets.
Annual contributions are paid to the funds at a rate necessary to adequately finance the accrued liabilities of the plans calculated in accordance with local legal requirements. Plans in all countries comply with applicable local regulations governing investments and funding levels.
The Group provides other post-employment employee benefits to certain employees and former employees. These are primarily post-employment healthcare benefits and discounts on ING products provided to employees and former employees.
Certain group companies sponsor defined contribution pension plans. The assets of all ING Group’s defined contribution plans are held in independently administered funds. Contributions are generally determined as a percentage of pay. These plans do not give rise to balance sheet provisions, other than relating to short-term timing differences included in current liabilities. The amount incurred in 2008 was EUR 68 million (2007: EUR 68 million).

ING Group Annual Report 2008
136
2.1 Consolidated annual accounts
Notes to the consolidated balance sheet of ING Group (continued)
Actuarial gains and losses related to pensions and post-employment benefits for the year ended 31 December 2008 include EUR –2,647 million (2007: EUR –789 million; 2006: EUR –180 million) experience gain adjustments for assets and EUR –70 million (2007: EUR 83 million; 2006: EUR –163 million) experience gain adjustments for liabilities.
Changes in defined benefit obligations
Pension benefitsPost-employment benefits
other than pensions2008 2007 2008 2007
Opening balance 14,499 15,758 220 239Current service cost 356 408 –1 11Interest cost 787 739 12 13Employer’s contribution 2Participants contributions 7 2 Benefits paid –601 –556 –8 –13Actuarial gains and losses –369 –1,727 1 –8Past service cost 79 –83 1Changes in the composition of the group and other changes –169 207 –18 –11Effect of curtailment or settlement –135 –32 Exchange rate differences –183 –217 1 –11Closing balance 14,271 14,499 210 220
Relating to:– funded plans 14,219 14,441 – unfunded plans 52 58 210 220
14,271 14,499 210 220
The estimated unrecognised past services cost and unrecognised actuarial gains and losses for the defined benefit plans to be amortised to pension and other staff related liability costs during 2009 are nil and EUR 46 million, respectively.
Changes in fair value of plan assets
2008Pension benefits
2007
Opening balance 14,708 14,361Expected return on plan assets 886 869Employer’s contribution 1,366 816Participants contributions 7 6Benefits paid –584 –540Actuarial gains and losses –2,647 –789Changes in the composition of the group and other changes –127 176
Exchange rate differences –243 –191Closing balance 13,366 14,708
The actual return on the plan assets amounted to EUR –1,761 million (2007: EUR 80 million).
No plan assets are expected to be returned to ING Group during 2009.
Pension investment strategyThe primary financial objective of ING Employee Benefit Plans (the Plans) is to secure participant retirement benefits. As such, the key objective in the Plans’ financial management is to promote stability and, where appropriate, growth in funded status (i.e. the ratio of market value of assets to liabilities). The investment strategy for the Plans’ portfolios of assets (the Funds) balances the requirement to generate returns with the need to control risk. The asset mix is recognised as the primary mechanism to influence the reward and risk structure of the Funds in an effort to accomplish the Plans’ funding objectives. Desirable target allocations amongst identified asset classes are set and within each asset class, careful consideration is given to balancing the portfolios among industry sectors, geographical areas, interest rate sensitivity, dependence on economic growth, currency and other factors affecting investment returns. The assets are managed by professional investment firms. They are bound by precise mandates and are measured against specific benchmarks. Factors considered by the fund managers include balancing security concentration, investment style, and reliance on particular active investment strategies. The asset mixes of the Funds are reviewed on a regular basis. Generally, the Funds’ asset mixes will be rebalanced to the target mixes as individual portfolios approach their minimum or maximum levels.
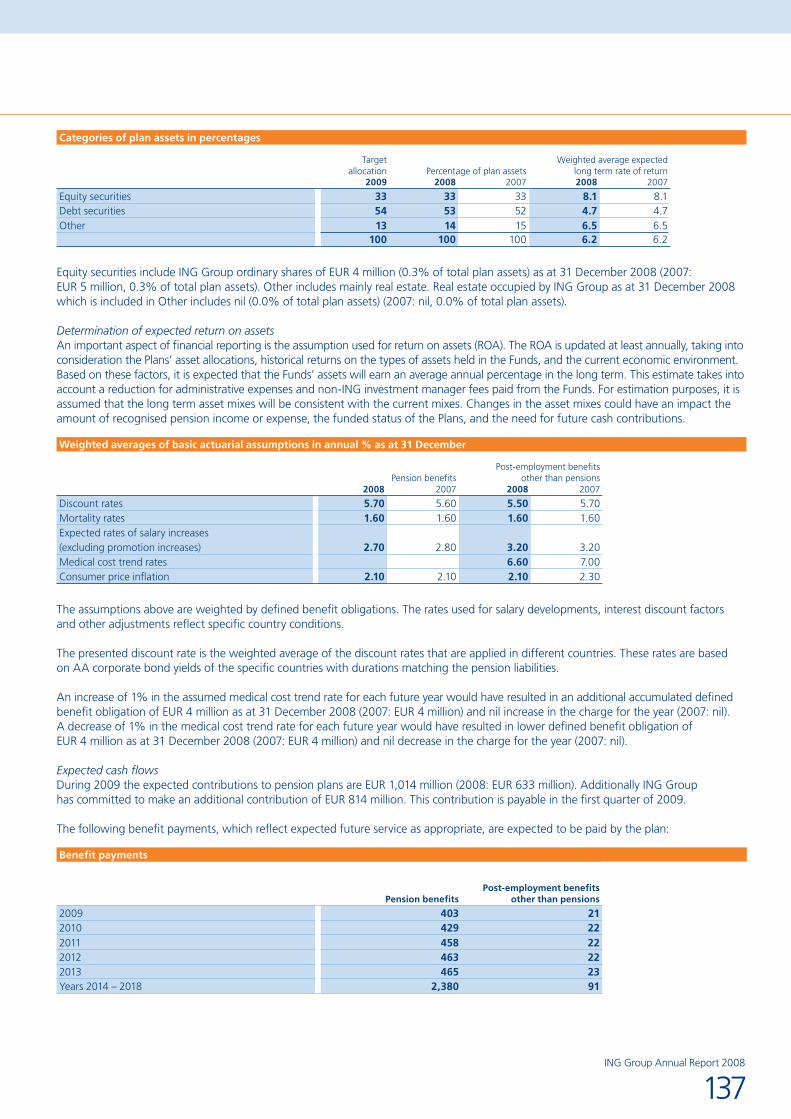
137ING Group Annual Report 2008
Categories of plan assets in percentages
Target allocation Percentage of plan assets
Weighted average expected long term rate of return
2009 2008 2007 2008 2007
Equity securities 33 33 33 8.1 8.1Debt securities 54 53 52 4.7 4.7Other 13 14 15 6.5 6.5
100 100 100 6.2 6.2
Equity securities include ING Group ordinary shares of EUR 4 million (0.3% of total plan assets) as at 31 December 2008 (2007: EUR 5 million, 0.3% of total plan assets). Other includes mainly real estate. Real estate occupied by ING Group as at 31 December 2008 which is included in Other includes nil (0.0% of total plan assets) (2007: nil, 0.0% of total plan assets).
Determination of expected return on assetsAn important aspect of financial reporting is the assumption used for return on assets (ROA). The ROA is updated at least annually, taking into consideration the Plans’ asset allocations, historical returns on the types of assets held in the Funds, and the current economic environment. Based on these factors, it is expected that the Funds’ assets will earn an average annual percentage in the long term. This estimate takes into account a reduction for administrative expenses and non-ING investment manager fees paid from the Funds. For estimation purposes, it is assumed that the long term asset mixes will be consistent with the current mixes. Changes in the asset mixes could have an impact the amount of recognised pension income or expense, the funded status of the Plans, and the need for future cash contributions.
Weighted averages of basic actuarial assumptions in annual % as at 31 December
Pension benefitsPost-employment benefits
other than pensions2008 2007 2008 2007
Discount rates 5.70 5.60 5.50 5.70Mortality rates 1.60 1.60 1.60 1.60Expected rates of salary increases (excluding promotion increases) 2.70 2.80 3.20 3.20Medical cost trend rates 6.60 7.00Consumer price inflation 2.10 2.10 2.10 2.30
The assumptions above are weighted by defined benefit obligations. The rates used for salary developments, interest discount factors and other adjustments reflect specific country conditions.
The presented discount rate is the weighted average of the discount rates that are applied in different countries. These rates are based on AA corporate bond yields of the specific countries with durations matching the pension liabilities.
An increase of 1% in the assumed medical cost trend rate for each future year would have resulted in an additional accumulated defined benefit obligation of EUR 4 million as at 31 December 2008 (2007: EUR 4 million) and nil increase in the charge for the year (2007: nil). A decrease of 1% in the medical cost trend rate for each future year would have resulted in lower defined benefit obligation of EUR 4 million as at 31 December 2008 (2007: EUR 4 million) and nil decrease in the charge for the year (2007: nil).
Expected cash flowsDuring 2009 the expected contributions to pension plans are EUR 1,014 million (2008: EUR 633 million). Additionally ING Group has committed to make an additional contribution of EUR 814 million. This contribution is payable in the first quarter of 2009.
The following benefit payments, which reflect expected future service as appropriate, are expected to be paid by the plan:
Benefit payments
Pension benefitsPost-employment benefits
other than pensions
2009 403 212010 429 222011 458 222012 463 222013 465 23Years 2014 – 2018 2,380 91

ING Group Annual Report 2008
138
2.1 Consolidated annual accounts
Taiwan – liabilities held for sale
2008
Insurance and investments contracts 14,294Financial liabilities at fair value through profit and loss 126Other liabilities 600Taiwan – liabilities held for sale 15,020
Reference is made to Note 29 ‘Companies acquired and disposed’. As at 31 December 2008 ING Life Taiwan is classified as held for sale in the consolidated balance sheet. Amounts as at 31 December 2007 are presented in the relevant balance sheet lines.
Notes to the consolidated balance sheet of ING Group (continued)

139ING Group Annual Report 2008
22 ASSETS AND LIABILITIES BY CONTRACTUAL MATURITY
Assets and liabilities by contractual maturity
Less than 1 month
1-3months
3-12
months1-5
yearsOver 5
years
Maturity not
applicable
Total2008ASSETSCash and balances with central banks 22,045 22,045Amounts due from banks 32,620 3,086 5,019 6,299 1,423 48,447Financial assets at fair value through profit and loss– trading assets 52,759 13,871 22,061 36,396 34,784 507 160,378– investments for risk of policyholders (1) 95,366 95,366– non-trading derivatives 2,456 1,024 1,521 3,907 7,531 45 16,484– designated as at fair value through profit and loss 703 232 829 2,057 2,154 2,302 8,277Investments– available-for-sale 4,508 10,485 14,589 77,844 101,595 33,831 242,852– held-to-maturity 74 139 1,109 10,758 3,360 15,440Loans and advances to customers 145,911 16,390 30,279 111,262 314,858 1,091 619,791Reinsurance contracts 30 46 204 886 1,148 3,483 5,797Intangible assets 3 7 315 810 2,268 3,512 6,915Deferred acquisition costs 11,843 11,843Other assets 15,446 19,981 9,526 7,075 8,254 2,695 62,977Remaining assets (where maturities are not applicable) (2) 15,051 15,051Total assets 276,555 65,261 85,452 257,294 477,375 169,726 1,331,663
LIABILITIESPreference shares Subordinated loans 10,281 10,281Debt securities in issue 25,666 24,299 11,886 24,585 10,052 96,488Other borrowed funds 3,354 4,700 2,668 6,505 13,971 31,198Insurance and investment contracts 2,345 2,485 9,289 33,569 93,538 99,564 240,790Amounts due to banks 83,456 38,600 17,626 9,454 3,129 152,265Customer deposits and other funds on deposit 438,451 18,801 49,951 12,843 2,737 522,783Financial liabilities at fair value through profit and loss– trading liabilities 62,251 13,121 16,632 31,011 29,598 3 152,616– non-trading derivatives 1,316 882 1,134 7,831 10,575 35 21,773– designated as at fair value through profit and loss 573 833 2,429 5,935 4,239 14,009Other liabilities 17,053 20,802 9,540 7,855 3,715 1,567 60,532Total liabilities 634,465 124,523 121,155 139,588 171,554 111,450 1,302,735(1) Investments for risk of policyholders are managed on behalf of policyholders on a fair value basis. Although individual instruments may (or may not) have a
maturity depending on their nature, this does not impact the liquidity position of ING.(2) Included in remaining assets where maturities are not applicable are:
– property and equipment – real estate investments – investments in associates.
Note: Due to their nature remaining assets consist mainly of assets expected to be recovered after more than 12 months.
Amounts presented in this table by contractual maturity are on an undiscounted basis, excluding interest receivable/payable.
Additional information to the consolidated balance sheet of ING Group amounts in millions of euros, unless stated otherwise

ING Group Annual Report 2008
140
2.1 Consolidated annual accounts
Additional information to the consolidated balance sheet of ING Group (continued)
Assets and liabilities by contractual maturity
Less than 1 month
1-3months
3-12
months1-5
yearsOver 5
years
Maturity not
applicable
Total2007ASSETSCash and balances with central banks 12,406 12,406Amounts due from banks 25,939 5,736 8,705 6,591 1,904 48,875Financial assets at fair value through profit and loss– trading assets 111,771 11,512 15,003 24,061 29,893 973 193,213– investments for risk of policyholders (1) 114,827 114,827– non-trading derivatives 403 115 758 2,651 3,708 2 7,637– designated as at fair value through profit and loss 1,504 610 1,894 1,999 5,043 403 11,453Investments– available-for-sale 4,184 7,016 13,267 71,107 135,992 44,331 275,897– held-to-maturity 232 287 1,093 8,504 6,637 16,753Loans and advances to customers 131,610 17,234 26,654 93,545 280,738 3,183 552,964Reinsurance contracts 21 36 308 307 2,725 2,477 5,874Intangible assets 2 4 111 391 1,120 4,112 5,740Deferred acquisition costs 10,692 10,692Other assets 14,399 2,771 15,838 4,195 2,845 51 40,099Remaining assets (where maturities are not applicable) (2) 16,080 16,080Total assets 302,471 45,321 83,631 213,351 470,605 197,131 1,312,510
LIABILITIESPreference shares 21 21Subordinated loans 7,325 7,325Debt securities in issue 22,277 13,899 6,210 14,787 9,822 66,995Other borrowed funds 434 4,847 916 7,059 13,802 27,058Insurance and investment contracts 1,855 3,907 10,712 33,854 97,244 118,140 265,712Amounts due to banks 117,179 28,758 12,935 6,862 1,238 166,972Customer deposits and other funds on deposit 463,995 23,988 26,864 8,369 2,000 525,216Financial liabilities at fair value through profit and loss– trading liabilities 94,966 8,085 12,963 12,410 20,492 72 148,988– non-trading derivatives 255 317 521 2,937 2,921 6,951– designated as at fair value through profit and loss 873 771 2,395 5,912 3,931 13,882Other liabilities 14,292 4,920 12,067 6,420 2,844 3,316 43,859Total liabilities 716,126 89,492 85,583 98,610 154,294 128,874 1,272,979(1) Investments for risk of policyholders are managed on behalf of policyholders on a fair value basis. Although individual instruments may (or may not)
have a maturity depending on their nature, this does not impact the liquidity position of ING. (2) Included in remaining assets where maturities are not applicable are:
– property and equipment – real estate investments – investments in associates.
Note: Due to their nature remaining assets consist mainly of assets expected to be recovered after more than 12 months.
Amounts presented in this table by contractual maturity are on an undiscounted basis, excluding interest receivable/payable.
23 DERIVATIVES AND HEDGE ACCOUNTINGUse of derivatives and hedge accountingAs described in the ‘Risk management’ section, ING Group uses derivatives (principally interest rate swaps and cross currency interest rate swaps) for economic hedging purposes in the management of its asset and liability portfolios and structural positions. The objective of economic hedging is to enter into positions with an opposite risk profile to an identified exposure to reduce that exposure. The impact of ING Group’s hedging activities is to optimise the overall cost to the Group of accessing debt capital markets and to mitigate the market risk which would otherwise arise from structural imbalances in the duration and other profiles of its assets and liabilities. In addition, hedging activities are undertaken to hedge against the interest rate risk in the mortgage offer period in relation to retail mortgages and to lock-in the interest margin in relation to interest bearing assets and the related funding.
The accounting treatment of hedge transactions varies according to the nature of the instrument hedged and whether the hedge qualifies under the IFRS-EU hedge accounting rules. Derivatives that qualify for hedge accounting under IFRS-EU are classified and accounted for according to the nature of the instrument hedged and the type of IFRS-EU hedge model that is applicable. The three models applicable under IFRS-EU are: fair value hedge accounting, cash flow hedge accounting and net investment hedge accounting. These are described under the relevant headings below. The company’s detailed accounting policies for these three hedge models are set out in section ‘Principles of valuation and determination of results’.
141ING Group Annual Report 2008
To qualify for hedge accounting under IFRS-EU, strict criteria must be met. Certain hedges that are economically effective from a risk management perspective do not qualify for hedge accounting under IFRS-EU. The fair value changes of derivatives relating to such non qualifying hedges are taken to the profit and loss account. However, in certain cases, the Group mitigates the resultant profit and loss account volatility by designating hedged assets and liabilities at fair value through profit and loss. If hedge accounting is applied under IFRS-EU, it is possible that during the hedge a hedge relationship no longer qualifies for hedge accounting and hedge accounting cannot be continued, even if the hedge remains economically effective. As a result, the volatility arising from undertaking economic hedging in the profit and loss account may be higher than would be expected from an economic point of view.
With respect to exchange rate and interest rate derivative contracts, the notional or contractual amounts of these instruments is indicative of the nominal value of transactions outstanding at the balance sheet date; however they do not represent amounts at risk. ING Group uses credit derivatives to manage its exposure to credit risk, including total return swaps and credit default swaps, to sell or buy protection for credit risk exposures in the loan, investment and trading portfolios. Hedge accounting is not applied in relation to credit derivatives.
Fair value hedge accountingING Group’s fair value hedges principally consist of interest rate swaps and cross-currency interest rate swaps that are used to protect against changes in the fair value of fixed-rate instruments due to movements in market interest rates.
Gains and losses on derivatives designated under fair value hedge accounting are recognised in the profit and loss account. The effective portion of the fair value change on the hedged item is also recognised in the profit and loss account. As a result, only the net accounting ineffectiveness has an impact on the net result.
For the year ended 31 December 2008, ING Group recognised EUR –5,492 million (2007: EUR 697 million) of fair value changes on derivatives designated under fair value hedge accounting in the profit and loss account. This amount was partly offset by EUR –5,697 million (2007: EUR 663 million) fair value changes recognised on hedged items. This resulted in EUR 205 million (2007: EUR 34 million) net accounting ineffectiveness recognised in the profit and loss account. As at 31 December 2008, the fair values of outstanding derivatives designated under fair value hedge accounting was EUR –5,050 million (2007: EUR 994 million), presented in the balance sheet as EUR 3,862 million (2007: EUR 1,952 million) positive fair values under assets and EUR 8,912 million (2007: EUR 958 million) negative fair values under liabilities.
ING Group applies fair value hedge accounting for portfolio hedges of interest rate risk (macro hedging) under the EU ‘carve out’ of IFRS-EU. The EU ‘carve-out’ macro hedging enables a group of derivatives (or proportions) to be viewed in combination and jointly designated as the hedging instrument and removes some of the limitations in fair value hedge accounting relating to hedging core deposits and under-hedging strategies. Under the IFRS-EU ‘carve-out’, hedge accounting may be applied to core deposits and ineffectiveness only arises when the revised estimate of the amount of cash flows in scheduled time buckets falls below the designated amount of that bucket. ING applies the IFRS-EU ‘carve-out’ to its retail operations in which the net exposure of retail funding (savings and current accounts) and retail lending (mortgages) is hedged. The hedging activities are designated under a portfolio fair value hedge on the mortgages, using the IFRS-EU provisions.
Cash flow hedge accountingING Group’s cash flow hedges principally consist of (forward) interest rate swaps and cross-currency interest rate swaps that are used to protect against its exposure to variability in future interest cash flows on non-trading assets and liabilities that bear interest at variable rates or are expected to be refunded or reinvested in the future. The amounts and timing of future cash flows, representing both principal and interest flows, are projected for each portfolio of financial assets and liabilities, based on contractual terms and other relevant factors including estimates of prepayments and defaults. The aggregate principal balances and interest cash flows for the respective portfolios form the basis for identifying the notional amount subject to interest rate risk that is designated under cash flow hedge accounting.
Gains and losses on the effective portions of derivatives designated under cash flow hedge accounting are recognised in Shareholders’ equity. Interest cash flows on these derivatives are recognised in the profit and loss account in interest income consistent with the manner in which the forecast cash flows affect net result. The gains and losses on ineffective portions of such derivatives are recognised immediately in the profit and loss account.
For the year ended 31 December 2008, ING Group recognised EUR 746 million (2007: EUR –925 million) after tax in equity as effective fair value changes on derivatives under cash flow hedge accounting. As a consequence, the balance of the cash flow hedge reserve in equity as at 31 December 2008 was EUR 1,457 million (2007: EUR 574 million) gross and EUR 1,177 million (2007: EUR 431 million) after deferred tax. This cash flow hedge reserve will fluctuate with the fair value changes of the underlying derivatives and will be reflected in the profit and loss account under Interest income/expense over the remaining term of the underlying hedged items. The cash flow hedge reserve relates to a large number of derivatives and hedged items with varying maturities, up to 40 years for insurance operations and 21 years for banking operations, with the largest concentrations in the range of 20 to 30 years and 35 to 40 years for insurance operations and 1 to 15 years for banking operations. Accounting ineffectiveness on derivatives designated under cash flow hedge accounting of EUR 22 million (2007: EUR –9 million) was recognised in the profit and loss account.

ING Group Annual Report 2008
142
2.1 Consolidated annual accounts
Additional information to the consolidated balance sheet of ING Group (continued)
As at 31 December 2008, the fair values of outstanding derivatives designated under cash flow hedge accounting was EUR –318 million (2007: EUR 229 million), presented in the balance sheet as EUR 5,771 million (2007: EUR 3,417 million) positive fair values under assets and EUR 6,089 million (2007: EUR 3,188 million) negative fair values under liabilities.
As at 31 December 2008 and 31 December 2007, there were no non-derivatives designated as hedging instruments for cash flow hedge accounting purposes.
Included in Interest income and interest expense on non-trading derivatives is EUR 3,082 million (2007: EUR 1,533 million) and EUR 2,744 million (2007: EUR 1,242 million), respectively, relating to derivatives used in cash flow hedges.
Hedges of net investments in foreign operationsING Group’s net investment hedges principally consist of derivatives (including currency forwards and swaps) and non-derivative financial instruments such as foreign currency denominated funding that are used to protect against foreign currency exposures on foreign subsidiaries.
Gains and losses on the effective portions of derivatives designated under net investment hedge accounting are recognised in Shareholders’ equity. The balance in equity is recognised in the profit and loss account when the related foreign subsidiary is disposed. The gains and losses on ineffective portions are recognised immediately in the profit and loss account.
As at 31 December 2008, the fair values of outstanding derivatives designated under net investment hedge accounting was EUR 300 million (2007: EUR –71 million), presented in the balance sheet as EUR 670 million (2007: EUR 281 million) positive fair values under assets and EUR 370 million (2007: EUR 352 million) negative fair values under liabilities.
As at 31 December 2008, the fair values of outstanding non-derivatives designated under net investment hedge accounting was EUR –881 million (2007: EUR –1,318 million), presented in the balance sheet as negative fair values under liabilities. Non-derivatives designated as hedging instruments consist mainly of loan agreements.
Accounting ineffectiveness recognised in the profit and loss account for the year ended 31 December 2008 on derivatives and non-derivatives designated under net investment hedge accounting was EUR –6 million (2007: EUR –14 million).
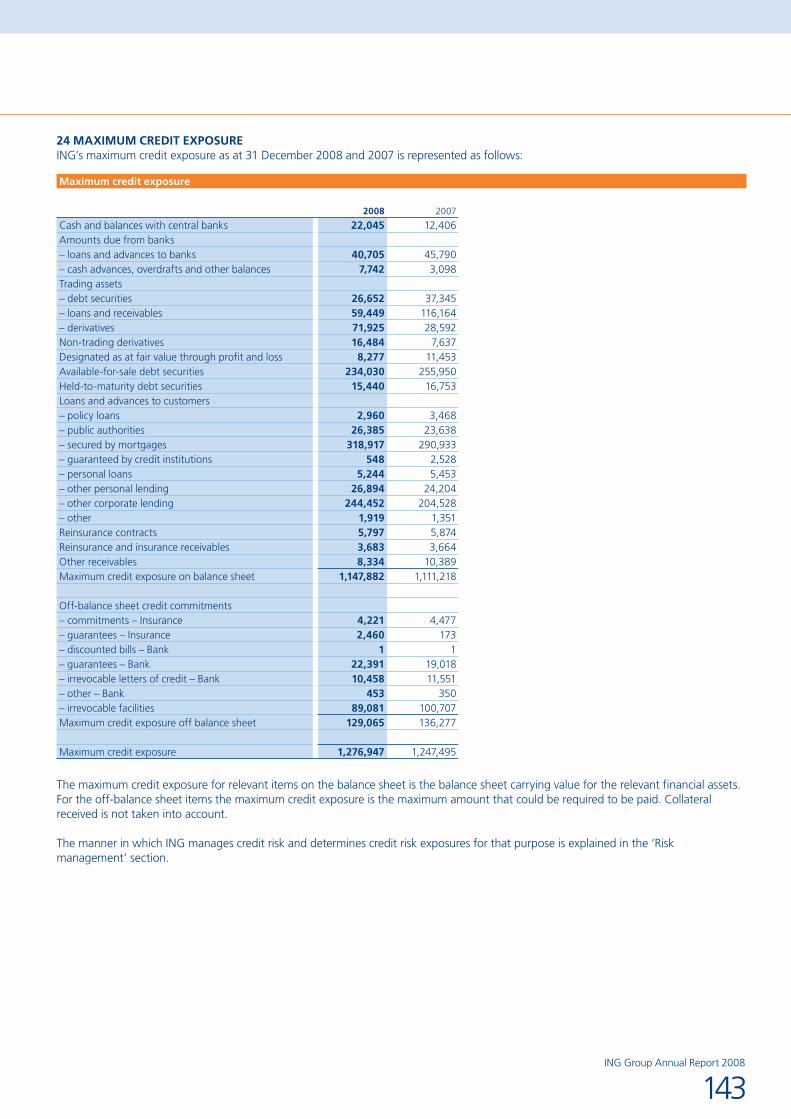
143ING Group Annual Report 2008
24 MAXIMUM CREDIT EXPOSUREING’s maximum credit exposure as at 31 December 2008 and 2007 is represented as follows:
Maximum credit exposure
2008 2007
Cash and balances with central banks 22,045 12,406Amounts due from banks– loans and advances to banks 40,705 45,790– cash advances, overdrafts and other balances 7,742 3,098Trading assets– debt securities 26,652 37,345– loans and receivables 59,449 116,164– derivatives 71,925 28,592Non-trading derivatives 16,484 7,637Designated as at fair value through profit and loss 8,277 11,453Available-for-sale debt securities 234,030 255,950Held-to-maturity debt securities 15,440 16,753Loans and advances to customers– policy loans 2,960 3,468– public authorities 26,385 23,638– secured by mortgages 318,917 290,933– guaranteed by credit institutions 548 2,528– personal loans 5,244 5,453– other personal lending 26,894 24,204– other corporate lending 244,452 204,528– other 1,919 1,351Reinsurance contracts 5,797 5,874Reinsurance and insurance receivables 3,683 3,664Other receivables 8,334 10,389Maximum credit exposure on balance sheet 1,147,882 1,111,218
Off-balance sheet credit commitments– commitments – Insurance 4,221 4,477– guarantees – Insurance 2,460 173– discounted bills – Bank 1 1– guarantees – Bank 22,391 19,018– irrevocable letters of credit – Bank 10,458 11,551– other – Bank 453 350– irrevocable facilities 89,081 100,707Maximum credit exposure off balance sheet 129,065 136,277
Maximum credit exposure 1,276,947 1,247,495
The maximum credit exposure for relevant items on the balance sheet is the balance sheet carrying value for the relevant financial assets. For the off-balance sheet items the maximum credit exposure is the maximum amount that could be required to be paid. Collateral received is not taken into account.
The manner in which ING manages credit risk and determines credit risk exposures for that purpose is explained in the ‘Risk management’ section.

ING Group Annual Report 2008
144
2.1 Consolidated annual accounts
Additional information to the consolidated balance sheet of ING Group (continued)
25 ASSETS NOT FREELY DISPOSABLEThe assets not freely disposable consist primarily of interest bearing securities pledged to secure deposits from De Nederlandsche Bank (the Dutch central bank) and other banks and serve to secure margin accounts or are used for other purposes required by law. The assets not freely disposable and the items for which they are held are as follows:
Assets not freely disposable
2008 2007
Investments 6,521 5,807Loans and advances to customers 3,136 911Banks 6,889 1,602Other assets 5,677 4,609
22,223 12,929
Banks includes Amounts due from banks and balances with central banks. ING Bank N.V. has an obligation to maintain a reserve with an average monthly balance with the Dutch central bank. In December 2008 the required monthly average was EUR 5,810 million (2007: EUR 5,676 million). As at 31 December 2008 the balance on this reserve was EUR 3,529 million (2007: EUR 1,375 million).
There are no material terms and conditions relating to the collateral represented in the above table which are individually significant.
26 CONTINGENT LIABILITIES AND COMMITMENTSIn the normal course of business the Group is a party to activities whose risks are not reflected in whole or part in the consolidated financial statements. In response to the needs of its customers, the Group offers financial products related to loans. These products include traditional off-balance sheet credit-related financial instruments.
Contingent liabilities and commitments
2008 2007
Insurance operationsCommitments 4,221 4,477Guarantees 2,460 173
6,681 4,650
Banking operationsContingent liabilities in respect of– discounted bills 1 1– guarantees 22,391 19,018– irrevocable letters of credit 10,458 11,551– other 453 350
33,303 30,920
Irrevocable facilities 89,081 100,707129,065 136,277
Guarantees relate both to credit and non-credit substitute guarantees. Credit substitute guarantees are guarantees given by ING Group in respect of credit granted to customers by a third party. Many of them are expected to expire without being drawn on and therefore do not necessarily represent future cash outflows. The guarantees are generally of a short-term nature. In addition to the items included in contingent liabilities, ING Group has issued guarantees as a participant in collective arrangements of national industry bodies and as a participant in government required collective guarantee schemes which apply in different countries.
Irrevocable letters of credit mainly secure payments to third parties for a customer’s foreign and domestic trade transactions in order to finance a shipment of goods. ING Group’s credit risk in these transactions is limited since these transactions are collateralised by the commodity shipped and are of a short duration.
Other contingent liabilities include acceptances of bills and are of a short-term nature. Other contingent liabilities also include contingent liabilities resulting from the normal operations of the Real Estate business including obligations under development and construction contracts. None of the items included in Other contingent liabilities are individually significant.

145ING Group Annual Report 2008
Irrevocable facilities mainly constitute unused portions of irrevocable credit facilities granted to corporate clients. Many of these facilities are for a fixed duration and bear interest at a floating rate. ING Group’s credit risk and interest rate risk in these transactions is limited. Most of the unused portion of irrevocable credit facilities is secured by customers’ assets or counter-guarantees by the central governments and exempted bodies under the regulatory requirements. Irrevocable facilities also include commitments made to purchase securities to be issued by governments and private issuers.
Future rental commitments for operating lease contracts
2009 2092010 1822011 1662012 1522013 129years after 2013 166
27 SPECIAL PURPOSE ENTITIES AND SECURITISATIONSecuritisationING as originatorING Group enters into synthetic securitisation programmes in order to reduce credit risk on certain assets. In synthetic securitisations, ING enters into a credit default swap with securitisation Special Purpose Entities (SPEs), in relation to which ING purchases credit protection in respect of residential mortgage loans and loans to small and medium-sized enterprises. The SPEs have in turn hedged their exposure with investors through the issue of credit linked notes or credit linked commercial paper. As a result of these transactions, ING Group has transferred a substantial part of the credit risk related to these loan portfolios to third-party investors. In general, the third-party investors in securities issued by the SPE have recourse only to the assets of the SPE and not to ING Group.
After securitisation of these assets ING Group continues to recognise them on its balance sheet under Loans and advances to customers. These transactions are therefore not off-balance sheet arrangements.
Assets under synthetic securitisation programmes
2008 2007
Loans to small and medium-sized enterprises 8,603 8,946Corporate loans 430Mortgages 6,101 6,488Total 14,704 15,864
ING as sponsor of multi-seller conduitIn the normal course of business, ING Group structures financing transactions for its clients by assisting them in obtaining sources of liquidity by selling the clients’ receivables or other financial assets to an SPE. The SPE issues asset-backed commercial paper to the market to fund the purchases. ING Group, in its role as administrative agent, facilitates these transactions by providing structuring, accounting, funding and operations services.
ING Group supports the commercial paper programmes by providing the SPE with short-term standby liquidity facilities. These liquidity facilities are intended primarily to cover temporarily disruptions in the commercial paper market. Once drawn these facilities bear normal credit risk. A number of programmes are supported by granting structured liquidity facilities to the SPE, in which ING Group covers at least some of the credit risk incorporated in these programmes itself (in addition to normal liquidity facilities), and might suffer credit losses as a consequence. Furthermore, under a Programme Wide Credit Enhancement ING Group guarantees to a limited amount all remaining losses incorporated in the SPE to the commercial paper investors. All facilities, which vary in risk profile, are granted to the SPE subject to normal ING Group credit and liquidity risk analysis procedures. The fees received for services provided and for facilities are charged subject to market conditions. The SPE is included in the consolidation of ING Group. This transaction is therefore not an off-balance sheet arrangement.
The normal non-structured standby liquidity facilities and the structured facilities are reported under irrevocable facilities.

ING Group Annual Report 2008
146
2.1 Consolidated annual accounts
Additional information to the consolidated balance sheet of ING Group (continued)
Collateralised debt obligations (CDO)-transactionsWithin ING Group, SPEs are used for CDO transactions. In a typical CDO transaction an SPE is used to issue structured, rated securities which are backed (or collateralised) by a pool of transferable debt securities. Besides investing in CDOs ING often has different roles in these transactions:
the arranger of the transaction; ING structures the SPE, acquires the assets for the SPE and sells the CDOs to investors;•collateral manager of the assets in the SPE; ING manages the assets based on strict conditions of the SPEs charter.•
ING Group receives market-rate fees for structuring, asset managing and distributing CDO-securities to investors. The total amount of these fees is not significant.
ING as investorAs part of its investment activities, ING invests in securitisations by purchasing notes from securitisation SPEs. For certain own asset securitisation programmes ING acts as a market maker and holds limited positions in this capacity.
Non-cash investments are made by ING by selling credit protection in the market using credit default swaps.
Other entitiesING Group is also a party to other SPEs used, for example, in structured finance and leasing transactions.
Investment fundsING as fund manager and investorING Group sets up investment funds for which it acts as a fund manager and sole investor at the inception of the fund. Subsequently, ING will seek third-party investors to invest in the fund, thereby reducing the interest of ING Group. In general, ING Group will maintain a small percentage of interest in these funds. These funds are included in the consolidated financial statements of the Group if and when control exists, taking into account both ING’s financial interests for own risk and its role as investment manager.
ING as fund managerING acts as fund manager for several funds. Fees related to these management activities are charged on an at arm’s-length basis. In general, as a fund manager ING will hold these funds in a fiduciary capacity. These funds are therefore generally not included in the consolidated financial statements of the Group.
28 PRINCIPAL SUBSIDIARIESThe principal subsidiaries of ING Groep N.V. are as follows:
Companies treated as part of the insurance operationsING Verzekeringen N.V. The NetherlandsING Verzekeringen Nederland N.V. The NetherlandsING Vastgoed Belegging B.V. The NetherlandsNationale-Nederlanden Levensverzekering Maatschappij N.V. The NetherlandsNationale-Nederlanden Schadeverzekering Maatschappij N.V. The NetherlandsParcom Ventures B.V. The NetherlandsPostbank Levensverzekering N.V. The NetherlandsPostbank Schadeverzekering N.V. The NetherlandsRVS Levensverzekering N.V. The NetherlandsRVS Schadeverzekering N.V. The NetherlandsMovir N.V. The NetherlandsING Zivotna Poistovna a.s. SlovakiaING Nationale-Nederlanden Polska S.A. PolandING Nationale-Nederlanden Polska Powszechne Towarzystwo Emerytaine S.A. PolandING Asigurari de Viata S.A. RomaniaING Greek Life Insurance Company S.A. GreeceING Greek General Insurance Company S.A. GreeceING Nationale-Nederlanden Magyarorszagi Biztosito Rt. HungaryNationale-Nederlanden Vida, Compañia de Seguros y Reaseguros S.A. SpainNationale-Nederlanden Generales, Compañia de Seguros y Reaseguros S.A. SpainING Canada Inc. CanadaBelair Insurance Company Inc. CanadaING Insurance Company of Canada CanadaING Novex Insurance Company of Canada CanadaING America Insurance Holdings, Inc. United States of AmericaING International Insurance Holdings, Inc. United States of AmericaING Life Insurance and Annuity Company United States of America
147ING Group Annual Report 2008
ING North America Insurance Corporation United States of AmericaLion Connecticut Holdings Inc. United States of AmericaReliaStar Life Insurance Company United States of AmericaReliaStar Life Insurance Company of New York United States of AmericaSecurity Life of Denver Insurance Company United States of AmericaING USA Annuity and Life Insurance Company United States of AmericaING Seguros de Vida S.A. ChileAFP Capital S.A. ChileING Afore S.A. de C.V. MexicoING Life Insurance Company (Japan) Limited JapanING Life Insurance Company (Korea) Limited South KoreaING Life Insurance Company of America United States of AmericaING Australia Holdings Limited AustraliaING Australia Pty Limited AustraliaING Re (Netherlands) N.V. The Netherlands
Companies treated as part of the banking operationsING Bank N.V. The NetherlandsING Bank Nederland N.V. The NetherlandsBank Mendes Gans N.V. The NetherlandsING Lease Holding B.V. The NetherlandsING Corporate Investments B.V. The NetherlandsING Vastgoed Management Holding B.V. The NetherlandsInterAdvies N.V. The NetherlandsNationale-Nederlanden Financiële Diensten B.V. The NetherlandsING Commercial Finance B.V. The NetherlandsPostbank N.V. The NetherlandsPostbank Groen N.V. The NetherlandsWestland Utrecht Hypotheekbank N.V. The NetherlandsING België N.V. BelgiumING Bank Slaski S.A. PolandING Bank Deutschland A.G. GermanyING Financial Holdings Corporation United States of AmericaING Middenbank Curaçao N.V. Netherlands AntillesING Vysya Bank Ltd. IndiaING Direct N.V. Canada, Germany, Spain, Australia, France, United States of America, Italy, United KingdomING Bank A.S. Turkey

ING Group Annual Report 2008
148
2.1 Consolidated annual accounts
Additional information to the consolidated balance sheet of ING Group (continued)
29 COMPANIES ACQUIRED AND COMPANIES DISPOSEDThe initial accounting for the fair value of the net assets of the companies acquired during the year has been determined only provisionally. The initial accounting shall be completed within a year of acquisition.
Most significant companies acquired in 2008
Chile Pension business of Santander CitiStreet
Oyak Emeklilik Interhyp AG
UniversalLease Iberia Total
GeneralPrimary line of business Insurance Insurance Insurance Bank Bank
Date of acquisition16 January
20081 July 2008
1 December 2008
1 August 2008
1 October 2008
Percentage of voting shares acquired 100% 100% 100% 99% 100%
Purchase pricePurchase price 397 578 110 418 1,503Costs directly attributable to the acquisition 4 5 9Cash purchase price 401 583 110 418 1,512
Cash in company acquired 45 35 80Cash outflow on acquisition (2) 401 538 75 418 1,432
AssetsCash assets 45 35 80Investments 8 8Loans and advances to customers 6 6Amounts due from banks 43 43Financial assets at fair value through profit and loss 78 78Intangible assets 31 73 104Miscellaneous other assets 2 24 8 20 235 289
LiabilitiesInsurance and investment contracts 7 7Customer deposits and other funds on deposit 224 224Miscellaneous other liabilities 6 26 2 16 20 70
Net assets 112 116 41 47 –9 307Minority interests Net assets acquired 112 116 41 47 –9 307
Goodwill recognised (1) 285 462 69 371 9 1,196
Profit since date of acquisition 3 –7 –7 –11Income if acquisition effected at start of year 17 275 12 61 42 407Profit if acquisition effected at start of year 1 8 –20 –1 –12(1) Goodwill recognised in 2008 on immaterial acquisitions and real estate portfolios was EUR 133 million, resulting in total Goodwill recognised in 2008 of
EUR 1,329 million as disclosed in Note 9 ‘Intangible assets’.(2) Cash outflow/inflow on group companies in the cash flow statement includes cash outflows/inflows on individually immaterial acquisitions and real estate
portfolios in addition to the cash flows presented herein.

149ING Group Annual Report 2008
Acquisitions effective in 2008In December 2008, ING acquired 100% of the voluntary pension fund Oyak Emeklilik for a total consideration of EUR 110 million. Goodwill of EUR 69 million was recognised on the acquisition and is mainly attributable to the operational synergies and the future business potential resulting from the acquisition.
In August 2008, ING acquired approximately 97% of Interhyp AG, Germany’s largest independent residential mortgage distributor for a total consideration of EUR 418 million. Goodwill of EUR 371 million was recognised on the acquisition and is mainly attributable to the future potential for enhancing ING’s distribution platforms in Europe resulting from the acquisition.
In July 2008, ING acquired 100% of CitiStreet, a leading retirement plan and benefit service and administration organisation in the US defined contribution marketplace for a total consideration of EUR 578 million. Goodwill of EUR 462 million was recognised on the acquisition and is mainly attributable to the operational synergies and the future business potential resulting from the acquisition, making ING one of the largest defined contribution businesses in the US.
In January 2008, ING closed the final transaction to acquire 100% of Banco Santander’s Latin American pension and annuity businesses through the acquisition of the pension business in Chile. See Acquisitions effective in 2007 (see page 152) for full details of the entire deal.
Most significant companies disposed in 2008
NRGMexican non-life
business Total
General
Primary line of business Insurance Insurance
Sales proceedsSales proceeds 272 950 1,222Cash proceeds 272 950 1,222
Cash in company disposed 12 26 38Cash inflow on disposal (1) 260 924 1,184
AssetsCash assets 12 26 38Investments 461 1,146 1,607Loans and advances to customers 137 65 202Financial assets at fair value through profit and loss 41 41Miscellaneous other assets 26 1,261 1,287
LiabilitiesInsurance and investment contracts 210 1,497 1,707
Miscellaneous other liabilities 10 274 284
Net assets 416 768 1,184% disposed 100% 100% Net assets disposed 416 768 1,184
Gain/loss on disposal (2) –144 182 38(1) Cash outflow/inflow on group companies in the cash flow statement includes cash outflows/inflows on individually immaterial disposals in addition
to the cash flows presented.(2) The gain/loss on disposal comprises the sales proceed, the net assets disposed, the expenses directly related to the disposal and the realisation
of unrealised reserves.
Disposals effective in 2008In December 2007, ING reached an agreement with Berkshire Hathaway Group to sell its reinsurance unit NRG N.V. for EUR 272 million. The sale resulted in a net loss of EUR 144 million. As disclosed in note 21 ‘Other liabilities’ a loss on disposal of EUR 129 million was reported in 2007 (see page 135). In 2008 EUR 15 million additional losses, predominantly relating to currency exchange rate changes were recognised.
In July 2008, ING announced it had completed the sale of part of its Mexican business, Seguros ING SA de CV and subsidiaries, to AXA as announced in February 2008, for a total consideration of EUR 950 million (USD 1.5 billion). The sale resulted in a gain of EUR 182 million.
In January 2008 ING completed the sale of its health business in Chile, ING Salud, to Said Group and Linzor Capital Partners, resulting in a gain on disposal of EUR 55 million.
ING Group Annual Report 2008
150
2.1 Consolidated annual accounts
Additional information to the consolidated balance sheet of ING Group (continued)
Disposals announced and occurring or expected to occur in 2009In October 2008 ING announced that it had reached agreement to sell its entire Taiwanese life insurance business, ING Life Taiwan, to Furbon Financial Holding Co. Ltd. for approximately EUR 447 million. As at 31 December 2008 ING Life Taiwan qualified as a disposal group held for sale. The sale was completed on 13 February 2009. Consequently ING Life Taiwan will be deconsolidated in the first quarter of 2009. ING will be paid in a fixed number of shares with the difference between the fair value of those shares at the closing date and the sale price being paid in subordinated debt securities of the acquirer. ING Life Taiwan is included in the segment Insurance Asia/Pacific. This transaction is expected to result in a loss of EUR 292 million. A provision has been recognised for this loss in Other liabilities. The loss has been recognised in 2008 in ‘Net gains/losses on disposal of group companies’ in the profit and loss account.
ING Life Taiwan will be deconsolidated in 2009 when ING loses control. It qualifies as a disposal group held for sale at 31 December 2008 as ING expects to recover the carrying amount principally through the sale transaction. ING Life Taiwan is available for sale in its immediate condition subject to terms that are usual and customary for sales of such assets and the sale is highly probably.
As mentioned in Acquisitions effective in 2007 ING acquired the AFJP Pension (Origenes AFJP S.A.) company in Argentina as part of the Santander transaction. In November 2008 the Government of Argentina passed legislation to nationalise the private pension system (AFJPs). Under the law, all client balances held by the private pension system would be transferred to the Argentina Government and AFJP’s pension business would be terminated. The law became effective in December 2008 when the Argentine Social Security Administration (ANSES) took ownership over the affiliate accounts. The nationalisation impacted the pension assets only, thus leaving ING responsible for the ongoing operating costs and liabilities including severance obligations. This resulted in a loss of EUR 188 million being recognised in 2008.
In February 2009, ING announced that it had agreed to sell its 70% stake in ING Canada for net proceeds of approximately EUR 1,265 million (CAD 2,163 million). The transaction was closed on 19 February 2009 and will be booked in 2009. This transaction will result in a decrease in Total assets of approximately EUR 5,471 million and a decrease of Total liabilities of approximately EUR 3,983 million.

151ING Group Annual Report 2008
Most significant companies acquired in 2007
Landmark
Latin American Pension business
of Santander Oyak BankSharebuilder Corporation Total
GeneralPrimary line of business Insurance Insurance Bank Bank
Date of acquisition 31 July 2007 4 December 2007 31 December 2007 15 November 2007
Percentage of voting shares acquired 100% 100% 100% 100%
Purchase pricePurchase price 255 692 1,903 152 3,002Costs directly attributable to the acquisition 2 8 2 1 13Cash purchase price 257 700 1,905 153 3,015
Cash in company acquired 29 28 75 12 144Cash outflow on acquisition (2) 228 672 1,830 141 2,871
AssetsCash assets 29 28 75 12 144Investments 86 1,332 1,418Loans and advances to customers 4,824 15 4,839Amounts due from banks 508 508Financial assets at fair value through profit and loss 520 41 2 563Intangible assets 154 236 390Miscellaneous other assets 18 85 474 80 657
LiabilitiesInsurance and investment contracts 500 500Amounts due to banks 632 632Customer deposits and other funds on deposit 5,369 5,369Miscellaneous other liabilities 182 601 51 834Net assets 47 191 888 58 1,184Minority interestsTotal net assets acquired 47 191 888 58 1,184
Goodwill recognised (1) 208 501 1,015 94 1,818
Profit since date of acquisition 1 8 –1 8Income if acquisition effected at start of year 15 209 38 262Profit if acquisition effected at start of year (3) 4 46 80 –2 128(1) Goodwill recognised in 2007 on immaterial acquisitions and real estate portfolios was EUR 222 million, resulting in total Goodwill recognised in 2007 of
EUR 2,040 million as disclosed in Note 9 ‘Intangible assets’.(2) Cash outflow/inflow on group companies in the cash flow statement includes cash outflows/inflows on individually immaterial acquisitions and real estate
portfolios in addition to the cash flows presented herein.(3) Estimate of full year profit of acquired company based on local accounting principles.

ING Group Annual Report 2008
152
2.1 Consolidated annual accounts
Acquisitions effective in 2007In September 2007, ING paid EUR 20 million to increase its shareholding in ING Piraeus Life (the joint venture between ING and Piraeus Bank) from 50 to 100%.
In April 2007, ING acquired 100% of AZL, an independent Dutch provider of pension fund management services, for EUR 65 million.
In July 2007, ING announced that it had reached agreement to acquire full ownership of Landmark Investment Co Ltd, the twelfth largest asset manager in South Korea. The purchase price paid for Landmark was EUR 255 million. Goodwill of approximately EUR 208 million was recognised on acquisition and is mainly attributable to the operational synergies and to the future business potential resulting from the acquisition. There was no significant difference in the carrying values of the net assets acquired immediately before the acquisition and their fair values. All significant intangibles were recognised separately from goodwill and are included in Intangible assets. No significant adjustments were made in 2008 to amounts recognised provisionally in 2007.
In November 2007, ING acquired 100% of Sharebuilder Corporation, a Seattle-based brokerage company for EUR 152 million, to extend its retail investment products range and geographical spread in the United States. Goodwill of approximately EUR 94 million was recognised on acquisition and is mainly attributable to the operational synergies and to the future business potential resulting from the acquisition. There was no significant difference in the carrying values of the net assets acquired immediately before the acquisition and their fair values. All significant intangibles were recognised separately from goodwill and are included in Intangible assets. No significant adjustments were made in 2008 to amounts recognised provisionally in 2007.
In November and December 2007, ING acquired the Latin American pension businesses of Banco Santander in Mexico for EUR 349 million, in Columbia for EUR 88 million, in Uruguay for EUR 20 million and in Argentina for EUR 235 million. As mentioned in Acquisitions effective in 2008, the pension business in Chile was acquired in January 2008 for EUR 450 million. The total costs of the entire deal were approximately EUR 1,142 million. Goodwill of approximately EUR 786 million was recognised on acquisition and is mainly attributable to the operational synergies and to the future business potential resulting from the acquisition. The Latin American pension businesses acquired represented the acquisition of leading positions in retirement services in high growth emerging markets, giving ING a sustainable, scalable platform in Latin America. There was no significant difference in the carrying values of the net assets acquired immediately before the acquisition and their fair values. All significant intangibles were recognised separately from goodwill and are included in Intangible assets. Except for the effect of the nationalisation of the Argentinean pension business as disclosed in Disposals announced and expected to occur in 2009 above, no significant adjustments were made in 2008 to amounts recognised provisionally in 2007.
In December 2007, ING announced the completion of the acquisition of 100% of the shares in Oyak Bank for an amount of EUR 1,903 million. Oyak Bank is a leading bank in the Turkish market, offering a full range of banking services with a focus on retail banking. Goodwill of EUR 1,015 million was recognised on acquisition and is mainly attributable to the future business potential resulting from the acquisition, as Oyak is a major bank, also offering a platform to distribute insurance, asset management and retirement products, in one of Europe’s fastest growing economies. There was no significant difference in the carrying values of the net assets acquired immediately before the acquisition and their fair values. All significant intangibles were recognised separately from goodwill and are included in Intangible assets. The profit for the year (before amortisation of the intangibles recognised on purchase accounting) was approximately EUR 80 million, but no profit or loss was included in the ING Group net result over 2007.
Additional information to the consolidated balance sheet of ING Group (continued)

Most significant companies disposed in 2007
Belgian Broker & employee benefits ING Trust ING Regio B.V. Total
GeneralPrimary line of business Insurance Bank Bank
Sales proceedsSales proceeds 777 25 51 853Cash proceeds 777 25 51 853
Cash in company disposed 11 11Cash inflow on disposal (1) 766 25 51 842
AssetsCash assets 11 11Investments 4,622 4,622Loans and advances to customers 301 4 1,156 1,461Financial assets at fair value through profit and loss 350 350Miscellaneous other assets 463 10 110 583
LiabilitiesInsurance and investment contracts 5,075 5,075Customer deposits and other funds on deposit 2,052 2,052Miscellaneous other liabilities 178 –4 –811 –637
Net assets 494 18 25 537% disposed 100% 100% 100% Net assets disposed 494 18 25 537
Gain/loss on disposal (2) 418 7 26 451(1) Cash outflow/inflow on group companies in the cash flow statement includes cash outflows/inflows on individually immaterial disposals in
addition to the cash flows presented.(2) The gain/loss on disposal comprises the sales proceed, the net assets disposed, the expenses directly related to the disposal and the realisation
of unrealised reserves.
Disposals effective in 2007In June 2007, ING sold its investment in Nationale Borg, a specialist provider of guarantee insurance, to HAL Investments BV and Egeria.
In July 2007, ING sold ING Trust to management and Foreman Capital, an independent investment company based in the Netherlands. The sale is part of ING’s strategy to focus on its investment, life insurance and retirement services.
In July 2007, ING sold its entire shareholding in ING Regio B.V., a subsidiary of Regio Bank N.V. to SNS REAAL for EUR 50.5 million, resulting in a gain of EUR 26 million. This entity conducts most of the business of Regio Bank. The legal entity Regio Bank N.V. itself was not part of the transaction.
In September 2007, ING sold its Belgian broker and employee benefits insurance business to P&V Verzekeringen for EUR 777 million, resulting in a gain of EUR 418 million.
153ING Group Annual Report 2008

2.1 Consolidated annual accounts
Additional information to the consolidated balance sheet of ING Group (continued)
Most significant companies acquired in 2006
ABN AMRO Asset Management
(Taiwan) Ltd Appleyard Summit REIT Total
GeneralPrimary line of business Insurance Bank Bank
Date of acquisition 27 October 2006 1 July 2006 5 October 2006
Percentage of voting shares acquired 100% 100% 56%
Purchase pricePurchase price 65 110 2,132 2,307Cash purchase price 65 110 2,132 2,307
Cash in company acquired 19 19Cash outflow on acquisition (2) 46 110 2,132 2,288
AssetsCash assets 23 23Investments 2 2,132 2,134Amounts due from banks 1 1Financial assets at fair value through profit and loss 2 793 795Miscellaneous other assets 332 34 366
LiabilitiesAmounts due to banks 238 238Miscellaneous other liabilities 4 52 73 129Net assets 24 42 2,886 2,952Minority interests 754 754Net assets acquired 24 42 2,132 2,198
Goodwill recognised (1) 41 54 95
Profit since date of acquisition –1 1 8 8Income if acquisition effected at start of year 2 33 131 166(1) Goodwill recognised in 2006 on immaterial acquisitions and real estate portfolios was EUR 74 million, resulting in total Goodwill recognised in 2006
of EUR 169 million as disclosed in Note 9 ‘Intangible assets’.(2) Cash outflow/inflow on group companies in the cash flow statement includes cash outflows/inflows on individually immaterial acquisitions and
real estate portfolios in addition to the cash flows presented herein.
In July 2006, ING acquired 100% of Appleyard Vehicles Contracts, a UK based car leasing company. The purchase price paid for Appleyard was EUR 110 million.
In October 2006, ING acquired 56% of Summit Real Estate Investment Trust (Summit REIT) for an amount of EUR 2,132 million. Summit REIT owns a portfolio of high-quality light industrial properties in major markets across Canada.
In October 2006, ING acquired 100% of ABN AMRO Asset Management (Taiwan) Ltd, a registered Securities Investment Trust Enterprise, for EUR 65 million. The purchase will strengthen ING’s existing position as the Taiwanese largest overall asset manager.
ING Group Annual Report 2008
154

Most significant companies disposed in 2006
Williams de Broë Deutsche
Hypothekenbank AG Degussa Bank Total
GeneralPrimary line of business Bank Bank Bank
Sales proceedsSales proceeds 19 275 195 489Cash proceeds 19 275 195 489
Cash in company disposed 11 27 38Cash inflow on disposal (1) 19 264 168 451
AssetsCash assets 11 27 38Investments 9,556 9,556Loans and advances to customers 228 16,884 2,334 19,446Amounts due from banks 14 5,928 187 6,129Financial assets at fair value through profit and loss 5 3,280 162 3,447Miscellaneous other assets 27 747 163 937
LiabilitiesAmounts due to banks 64 2,439 198 2,701Customer deposits and other funds on deposit 8,984 2,184 11,168Miscellaneous other liabilities 198 24,541 286 25,025Net assets 12 442 205 659% disposed 100% 84% 100%Net assets disposed 12 370 205 587(1) Cash outflow/inflow on group companies in the cash flow statement includes cash outflows/inflows on individually immaterial disposals in addition
to the cash flows presented.
In June 2006, ING sold its UK brokerage unit Williams de Broë Plc for EUR 22 million. The sale is part of ING Group’s strategy to focus on core businesses. The result on the sale is subject to closing adjustments.
In September 2006, ING sold its 87.5% stake in Deutsche Hypothekenbank AG, a publicly listed mortgage bank in Germany, as part of ING’s strategy to focus on its core business. The sale resulted in a loss of EUR 83 million.
In December 2006, ING sold its stake in Degussa Bank, a unit of ING-DiBa specialising in worksite banking for private customers. The sale resulted in a loss of EUR 23 million.
30 LEGAL PROCEEDINGSING Group companies are involved in litigation and arbitration proceedings in the Netherlands and in a number of foreign jurisdictions, including the United States, involving claims by and against them which arise in the ordinary course of their businesses, including in connection with their activities as insurers, lenders, employers, investors and taxpayers. In certain of such proceedings, very large or indeterminate amounts are sought, including punitive and other damages. While it is not feasible to predict or determine the ultimate outcome of all pending or threatened legal and regulatory proceedings, management does not believe that their outcome will have a material adverse effect on the Group’s financial position or results of operations.
These proceedings include complaints and lawsuits concerning the performance of certain interest sensitive products that were sold by a former subsidiary of ING in Mexico. These matters are being defended vigorously; however, at this time, we are unable to assess their final outcome. In addition, a subsidiary is a garnishee in proceedings in the United States brought by judgement creditors of the Republic of Argentina who seek to levy on assets that were managed by that subsidiary before the Republic nationalised the private pension business in Argentina. Appropriate steps are being taken to address this matter. Further, litigation commenced in February 2009, purportedly on behalf of classes, challenges the adequacy of the disclosures made in connection with the 2007 and 2008 issuance and sale of the ING’s Perpetual Hybrid Capital Securities, and additional purported class litigation challenges the operation of the ING’s American Savings, ESOP and 401(k) Plans. These matters are at very preliminary stages, and while we are not able to assess their final outcome, we intend to vigorously defend against them.
155ING Group Annual Report 2008

2.1 Consolidated annual accounts
Additional information to the consolidated balance sheet of ING Group (continued)
In November 2006, the issue of amongst others, the costs charged by the insurance industry to customers in respect of unit-linked products (commonly referred to as ‘beleggingsverzekeringen’) has received attention both in the Dutch public media and from the Dutch regulator for the insurance industry and consumer protection organisations. Mid November 2008 ING reached an outline agreement with consumer organisations in the Netherlands to resolve a dispute regarding individual unit-linked products sold to customers in the Netherlands by ING’s Dutch insurance subsidiaries. It was agreed ING’s Dutch insurance subsidiaries will offer compensation to policy holders where individual unit-linked policies have a cost charge in excess of an agreed maximum. The costs of the settlement have been valued at EUR 365 million. Although the agreement is not binding for policyholders, ING believes a significant step was set towards resolving the issue.
Like many other companies in the mutual funds, brokerage, investment, and insurance industries, several of our companies have received informal and formal requests for information from various governmental and self-regulatory agencies or have otherwise identified issues arising in connection with fund trading, compensation, conflicts of interest, anti-competitive practices, insurance risk transfer and sales practices. ING is responding to the requests and working to resolve issues with regulators. We believe that any issues that have been identified thus far do not represent a systemic problem in the ING businesses involved and in addition that the outcome of the investigations will not have a material effect on ING Group.
Because of the geographic spread of its business, ING may be subject to tax audits in numerous jurisdictions at any point in time. Although ING believes that it has adequately provided for all its tax positions, the ultimate resolution of these audits may result in liabilities which are different from the amounts recognised.
31 JOINT VENTURESJoint ventures are included proportionally in the consolidated financial statements as follows:
Most significant joint ventures
2008Interest held (%) Assets Liabilities Income Expenses
ING Australia Ltd 51 6,690 6,218 406 317Postkantoren B.V. 50 161 169 226 266KB Life Insurance Company 49 498 462 254 257ING (NZ) Holdings Ltd 51 95 3 38 34Capital Life Insurance Company Ltd 50 200 186 94 105Total 7,644 7,038 1,018 979
Most significant joint ventures
2007Interest
held (%) Assets Liabilities Income Expenses
ING Australia Ltd 51 9,735 9,252 474 348Postkantoren B.V. 50 159 126 205 203KB Life Insurance Company 49 412 394 231 228ING (NZ) Holdings Ltd 51 128 14 44 33Capital Life Insurance Company Ltd 50 150 117 42 36Total 10,584 9,903 996 848
32 RELATED PARTIESIn the normal course of business, the Group enters into various transactions with related companies. Parties are considered to be related if one party has the ability to control or exercise significant influence over the other party in making financial or operating decisions. Transactions have taken place on an arm’s length basis and include rendering or receiving of services, leases, transfers under finance arrangements and provisions of guarantees or collateral.
Transactions with joint ventures and associates
Joint ventures Associates2008 2007 2008 2007
Receivables 204 336 389 885Liabilities 122 85 164 94Guarantees issued in favour of 20
Income received 35 16 158 213Expenses paid 82 58 31 32
ING Group Annual Report 2008
156

Transactions with ING Verzekeringen N.V. and ING Bank N.V.
ING Verzekeringen N.V. ING Bank N.V.2008 2007 2008 2007
Receivables 4,564 2,315 8,764 8,137Liabilities 2 1,252 201
Income received 248 112 675 619Expenses paid 226 228
Receivables on ING Verzekeringen N.V. and ING Bank N.V. mainly include long term funding. Liabilities to ING Bank N.V. mainly include short term deposits.
Transactions with key management personnel (Executive Board and Supervisory Board) and post-employment benefit plans are transactions with related parties. These transactions are disclosed in more detail in the remuneration report in the annual report. For the post-employment benefit plans see Note 21 ‘Other liabilities’.
Key management personnel compensation
amounts in thousands of eurosExecutive Board Supervisory Board Total
2008 2007 2008 2007 2008 2007
Base salary and short-term bonus 7,052 16,898 986 673 8,038 17,571Pension costs 3,580 3,334 3,580 3,334Retirement benefit 1,222 1,222Fair market value of long-term incentives 9,072 9,072Total compensation 10,632 30,526 986 673 11,618 31,199
Loans and advances to key management personnel
amounts in thousands of eurosAmount outstanding 31 December Average interest rate Repayments
2008 2007 2008 2007 2008 2007
Executive Board members 2,341 2,376 4.6% 4.8% 35 216Total 2,341 2,376 35 216
The total number of stock options on ING Groep N.V. shares held by the Executive Board members amounted to 3,436,583 as at 31 December 2008 (2007: 2,744,887). As at 31 December 2008, members of the Executive Board held 250,969 ING Groep N.V. shares (2007: 201,252). As at 31 December 2008, members of the Supervisory Board held 8,940 ING Groep N.V. shares (2007: 17,370).
There are no significant provisions for doubtful debts or individually significant bad debt expenses.
157ING Group Annual Report 2008
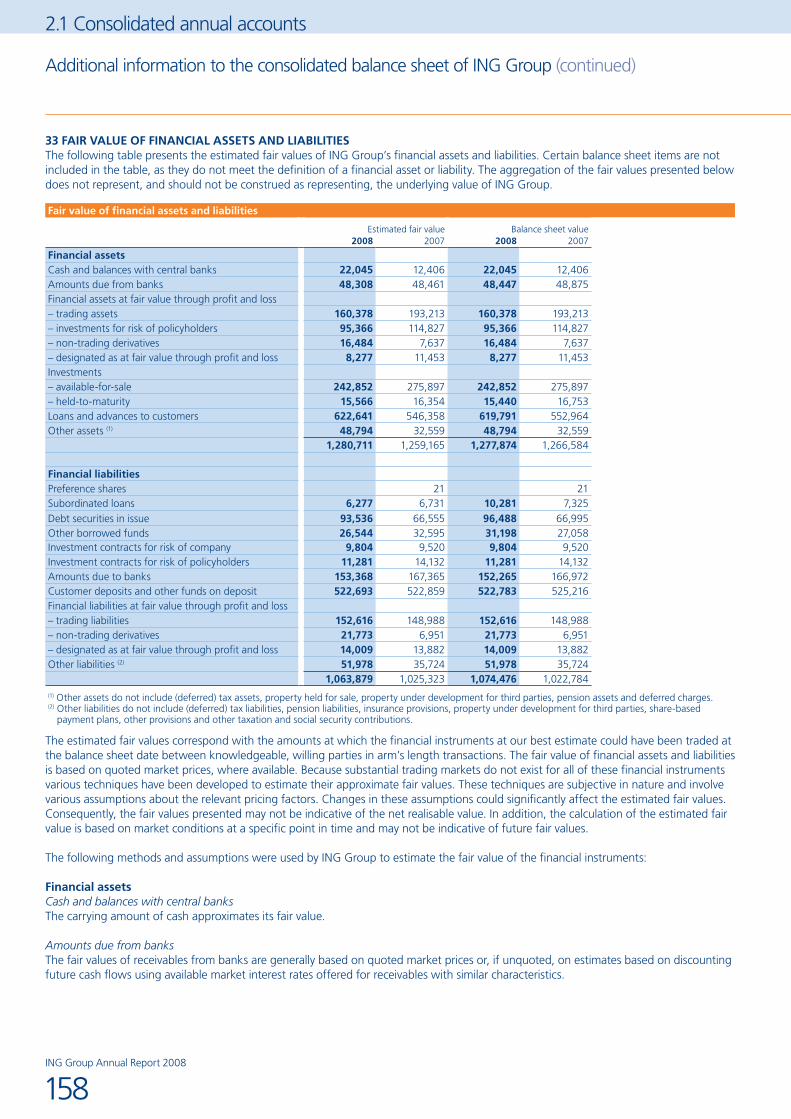
2.1 Consolidated annual accounts
Additional information to the consolidated balance sheet of ING Group (continued)
33 FAIR VALUE OF FINANCIAL ASSETS AND LIABILITIESThe following table presents the estimated fair values of ING Group’s financial assets and liabilities. Certain balance sheet items are not included in the table, as they do not meet the definition of a financial asset or liability. The aggregation of the fair values presented below does not represent, and should not be construed as representing, the underlying value of ING Group.
Fair value of financial assets and liabilities
Estimated fair value Balance sheet value2008 2007 2008 2007
Financial assetsCash and balances with central banks 22,045 12,406 22,045 12,406Amounts due from banks 48,308 48,461 48,447 48,875Financial assets at fair value through profit and loss– trading assets 160,378 193,213 160,378 193,213– investments for risk of policyholders 95,366 114,827 95,366 114,827– non-trading derivatives 16,484 7,637 16,484 7,637– designated as at fair value through profit and loss 8,277 11,453 8,277 11,453Investments– available-for-sale 242,852 275,897 242,852 275,897– held-to-maturity 15,566 16,354 15,440 16,753Loans and advances to customers 622,641 546,358 619,791 552,964Other assets (1) 48,794 32,559 48,794 32,559
1,280,711 1,259,165 1,277,874 1,266,584
Financial liabilitiesPreference shares 21 21Subordinated loans 6,277 6,731 10,281 7,325Debt securities in issue 93,536 66,555 96,488 66,995Other borrowed funds 26,544 32,595 31,198 27,058Investment contracts for risk of company 9,804 9,520 9,804 9,520Investment contracts for risk of policyholders 11,281 14,132 11,281 14,132Amounts due to banks 153,368 167,365 152,265 166,972Customer deposits and other funds on deposit 522,693 522,859 522,783 525,216Financial liabilities at fair value through profit and loss– trading liabilities 152,616 148,988 152,616 148,988– non-trading derivatives 21,773 6,951 21,773 6,951– designated as at fair value through profit and loss 14,009 13,882 14,009 13,882Other liabilities (2) 51,978 35,724 51,978 35,724
1,063,879 1,025,323 1,074,476 1,022,784(1) Other assets do not include (deferred) tax assets, property held for sale, property under development for third parties, pension assets and deferred charges.(2) Other liabilities do not include (deferred) tax liabilities, pension liabilities, insurance provisions, property under development for third parties, share-based
payment plans, other provisions and other taxation and social security contributions.
The estimated fair values correspond with the amounts at which the financial instruments at our best estimate could have been traded at the balance sheet date between knowledgeable, willing parties in arm’s length transactions. The fair value of financial assets and liabilities is based on quoted market prices, where available. Because substantial trading markets do not exist for all of these financial instruments various techniques have been developed to estimate their approximate fair values. These techniques are subjective in nature and involve various assumptions about the relevant pricing factors. Changes in these assumptions could significantly affect the estimated fair values. Consequently, the fair values presented may not be indicative of the net realisable value. In addition, the calculation of the estimated fair value is based on market conditions at a specific point in time and may not be indicative of future fair values.
The following methods and assumptions were used by ING Group to estimate the fair value of the financial instruments:
Financial assetsCash and balances with central banksThe carrying amount of cash approximates its fair value.
Amounts due from banksThe fair values of receivables from banks are generally based on quoted market prices or, if unquoted, on estimates based on discounting future cash flows using available market interest rates offered for receivables with similar characteristics.
ING Group Annual Report 2008
158
Non-trading derivativesThe fair values of derivatives held for non-trading purposes are based on quoted market prices. For those securities not actively traded, fair values are estimates based on valuation techniques.
Financial assets at fair value through profit and lossThe fair values of securities in the trading portfolio and other assets at fair value through profit and loss are based on quoted market prices, where available. For those securities not actively traded, fair values are estimated based on internal valuation techniques.
InvestmentsThe fair values of equity securities are based on quoted market prices or, if unquoted, on estimated market values generally based on quoted prices for similar securities as determined by management. Fair values for fixed interest securities are based on quoted market prices, where available. For those securities not actively traded, fair values are determined by management based on an analysis of available market inputs, which may include values obtained from one or more pricing services or by discounting expected future cash flows using a current market rate applicable to the yield, credit quality and maturity of the investment. Reference is made to the comments on investments in asset backed securities in the United States in Sensitivities of fair values below.
Loans and advances to customersFor loans and advances that are repriced frequently and have had no significant changes in credit risk, carrying amounts represent a reasonable estimate of fair values. The fair values of other loans are estimated by discounting expected future cash flows using interest rates offered for similar loans to borrowers with similar credit ratings.
The fair values of mortgage loans are estimated by taking into account prepayment behaviour and discounting future cash flows using interest rates currently being offered for similar loans to borrowers with similar credit ratings. The fair values of fixed-rate policy loans are estimated by discounting cash flows at the interest rates charged on policy loans of similar policies currently being issued. Loans with similar characteristics are aggregated for calculations purposes. The carrying values of variable rate policy loans approximate their fair value.
Other assetsThe carrying amount of other assets is not materially different from their fair value.
Financial liabilitiesSubordinated loansThe fair value of the subordinated loans is estimated using discounted cash flows based on interest rates that apply to similar instruments.
Investment contractsFor investment contracts for risk of company the fair values have been estimated using a discounted cash flow approach based on interest rates currently being offered for similar contracts with maturities consistent with those remaining for the contracts being valued. For investment contracts for risk of policyholder the fair value generally equals the fair value of the underlying assets.
Amounts due to banksThe fair values of payables to banks are generally based on quoted market prices or, if unquoted, on estimates based on discounting future cash flows using available market interest rates for payables to banks with similar characteristics.
Customer deposits and other funds on depositThe carrying values of customer deposits and other funds on deposit with no stated maturity approximate their fair values. The fair values of deposits with stated maturities have been estimated based on discounting future cash flows using the interest rates currently applicable to deposits of similar maturities.
Financial liabilities at fair value through profit and lossThe fair values of securities in the trading portfolio and other liabilities at fair value through profit and loss are based on quoted market prices, where available. For those securities not actively traded, fair values are estimated based on internal valuation techniques.
Debt securities in issue and other borrowed fundsThe fair value of debt securities in issue and other borrowed funds is generally based on quoted market prices or, if unquoted, on estimated prices by discounting expected future cash flows using a current market rate applicable to the yield, credit quality and maturity.
Other liabilitiesThe carrying amount of other liabilities are stated at their book value which is not materially different than fair value.
ING Group has categorised its financial instruments into a three level hierarchy based on the priority of the inputs to the valuation. The fair value hierarchy gives the highest priority to quoted prices in active markets for identical assets or liabilities and the lowest priority to unobservable inputs. An active market for the asset or liability is a market in which transactions for the asset or liability occur with sufficient frequency and volume to provide reliable pricing information on an ongoing basis.
159ING Group Annual Report 2008

2.1 Consolidated annual accounts
Additional information to the consolidated balance sheet of ING Group (continued)
The fair values of the financial instruments carried at fair value were determined as follows:
Methods applied in determining fair values of financial assets and liabilities
2008
Reference to published
price quotations in
active markets
Valuation technique
supported by market inputs
Valuation technique not supported by market inputs Total
AssetsTrading assets 97,946 61,220 1,212 160,378Investments for risk of policyholders 94,170 893 303 95,366Non-trading derivatives 15,478 1,003 3 16,484Financial assets designated at fair value through profit and loss 3,658 2,746 1,873 8,277
Available-for-sale investments 150,496 67,740 24,616 242,852361,748 133,602 28,007 523,357
LiabilitiesTrading liabilities 91,308 60,951 357 152,616Non-trading derivatives 19,845 1,903 25 21,773Financial liabilities designated at fair value through profit and loss 5,591 8,354 64 14,009Investment contracts (for contracts carried at fair value) 11,182 99 11,281
127,926 71,208 545 199,679
Methods applied in determining fair values of financial assets and liabilities
2007
Reference to published price
quotations in active markets
Valuation technique
supported by market inputs
Valuation technique not
supported by market inputs Total
AssetsTrading assets 122,448 70,279 486 193,213Investments for risk of policyholders 111,723 2,976 128 114,827Non-trading derivatives 6,928 693 16 7,637Financial assets designated at fair value through profit and loss 5,012 4,608 1,833 11,453
Available-for-sale investments 204,838 69,306 1,753 275,897450,949 147,862 4,216 603,027
LiabilitiesTrading liabilities 75,131 73,841 16 148,988Non-trading derivatives 6,234 620 97 6,951Financial liabilities designated at fair value through profit and loss 7,723 6,159 13,882Investment contracts (for contracts carried at fair value) 12,074 2,058 14,132
101,162 82,678 113 183,953
Reference to published price quotations in active marketsThis category includes financial instruments whose fair value is determined directly by reference to published quotes in an active market. A financial instrument is regarded as quoted in an active market if quoted prices are readily and regularly available from an exchange, dealer, broker, industry group, pricing service or regulatory agency, and those prices represent actual and regularly occurring market transactions on an arm’s length basis.
This category includes financial instruments for which it is market convention to price these based on a single published reference rate (e.g. a published yield curve in the case of plain vanilla interest rate swaps). The total amount of these types of financial instruments is EUR 4,786 million in assets and EUR 4,996 million in liabilities. Certain reverse repos with a very short tenor (i.e. a matter of days) for which the valuation is based on the actual prices on issuance and maturity, are included in this category on the basis that their valuation is highly objective and based on a third-party source.
ING Group Annual Report 2008
160
Valuation technique supported by market inputsThis category includes financial instruments whose fair value is determined using a valuation technique (a model), where inputs in the model are taken from an active market or are market observable. If certain inputs in the model are not market observable, but all significant inputs are, the instrument is still classified in this category, provided that the impact of those elements on the overall valuation is insignificant. Included in this category are items whose value is derived from quoted prices of similar instruments, but for which the prices are (more than insignificantly) modified based on other market observable external data.
Valuation technique not supported by market inputsThis category includes financial assets/liabilities whose fair value is determined using a valuation technique (model) for which more than an insignificant level of the input in terms of the overall valuation are not market observable. This category also includes financial assets and liabilities whose fair value is determined by reference to price quotes but for which the market is considered inactive.
The total amount of changes in fair value estimated using a valuation technique not supported by market inputs recognised in net result in 2008 was EUR –261 million (2007: EUR 74 million).
Sensitivities of fair valuesReasonably likely changes in the assumptions used in the valuation techniques not supported by recent market transactions would not have a significant impact on equity and net result, other than explained below for investments in asset backed securities in the United States.
Assets classified in Valuation technique not supported by market inputs consist mainly (approximately 87%) of investments in asset backed securities in the United States. These assets are valued using external price sources that are obtained from third party pricing services and brokers. As at 31 December 2007, these assets were classified in Reference to published price quotations in active markets as valuation was based on independent quotes and trading in the relevant markets was active at that time. During 2008, the trading volumes in the relevant markets reduced significantly and these have now become inactive. The dispersion between prices for the same security from different price sources increased significantly. As a result, an amount of EUR 25 billion of asset backed securities in the United States was reclassified from Reference to published price quotations in active markets to Valuation technique not supported by market inputs in the third quarter of 2008. In order to ensure that the most accurate and relevant sources available are used in determining the fair value of these securities, the valuation process was further enhanced during 2008 by using information from more pricing sources and enhancing the process of selecting the most appropriate price.
Generally up to four different pricing services are utilised. Management carefully reviews the prices obtained in conjunction with other information available, including, where relevant, trades in the market, quotes from brokers and internal evaluations. If the dispersion between different prices for the same securities is limited, a hierarchy exists that ensures consistent selection of the most appropriate price. If the dispersion between different prices for the same security is significant, additional processes are applied to select the most appropriate price, including an internally developed price validation matrix and a process to challenge the price source.
As a result of the low trading volumes in the market and the widened disparity between prices for the same security from different price sources, valuation for these securities is inherently complex and subjective. Although each security in the portfolio is priced based on an external price, without modification by the ING Group, and management is confident that it has selected the most appropriate price in the current market circumstances, the valuation of these portfolios would have been significantly different had different prices been selected. The sensitivity of the valuation in this respect is illustrated as follows:
had the valuation been based on the highest available market price for each and every security in these portfolios, the overall valuation •would have been approximately 10% higher than the valuation applied by the ING Group; had the valuation been based on the lowest available market price for each and every security in these portfolios, the overall valuation •would have been approximately 15% lower than the valuation applied by the ING Group; had the valuation been based on the weighted average available market price for these portfolios, the overall valuation would have •been approximately 5% lower than the valuation applied by the ING Group.
These are indicators of sensitivity and not alternatives for fair value under IFRS-EU.
Reference is made to the ‘Risk management’ section with regard to the exposure of these asset backed securities as at 31 December 2008 and the impact from these asset backed securities on net result in 2008.
Futhermore, the ‘Risk management’ section provides under Impact of financial crisis a breakdown of the methods applied in determining fair values of pressurised assets.
161ING Group Annual Report 2008

2.1 Consolidated annual accounts
34 INTEREST RESULT BANKING OPERATIONS
Interest result banking operations
2008 2007 2006
Interest income on loans 31,174 26,390 21,970Interest income on impaired loans –24 –26 13Total interest income on loans 31,150 26,364 21,983
Interest income on available-for-sale securities 7,449 7,397 6,989Interest income on held-to-maturity securities 669 736 755Interest income on trading portfolio 45,510 32,443 21,414Interest income on non-trading derivatives 7,076 6,190 5,231Other interest income 5,157 3,619 2,798Interest income banking operations 97,011 76,749 59,170
Interest expense on deposits by banks 4,856 5,131 3,559Interest expense on customer deposits and other funds on deposit 19,594 18,563 15,107
Interest expense on debt securities 4,109 3,648 3,173Interest expense on subordinated loans 1,784 1,167 1,132Interest on trading liabilities 44,093 29,383 18,821Interest on non-trading derivatives 7,391 6,115 5,159Other interest expense 4,142 3,766 3,027Interest expense banking operations 85,969 67,773 49,978
Interest result banking operations 11,042 8,976 9,192
Interest margin
in percentages 2008 2007 2006
Interest margin 1.07 0.94 1.06
In 2008, the growth in average total assets led to an increase of the interest result amounting to EUR 811 million (2007: EUR 753 million; 2006: EUR 1,040 million). The increase of the interest margin by 13 basis points led to an increase of the interest result with EUR 1,440 million (in 2007 the decrease of the interest margin by 12 basis points led to a decrease of the interest result with EUR 1,051 million; in 2006 the decrease of the interest margin by 10 basis points led to a decrease of the interest result with EUR 867 million).
35 GROSS PREMIUM INCOME
Gross premium income
2008 2007 2006
Gross premium income from life insurance policies 38,869 40,732 40,502Gross premium income from non-life insurance policies 4,943 6,086 6,333
43,812 46,818 46,835
Gross premium income has been presented before deduction of reinsurance and retrocession premiums granted. Gross premium income excludes premium received for investment contracts, for which deposit accounting is applied.
Effect of reinsurance on premiums written
Non-life Life Total2008 2007 2006 2008 2007 2006 2008 2007 2006
Direct gross premiums written 4,920 6,062 6,279 37,487 39,170 38,838 42,407 45,232 45,117Reinsurance assumed gross premiums written 23 24 54 1,382 1,562 1,664 1,405 1,586 1,718Total gross premiums written 4,943 6,086 6,333 38,869 40,732 40,502 43,812 46,818 46,835
Reinsurance ceded –196 –306 –339 –1,802 –1,968 –2,004 –1,998 –2,274 –2,3434,747 5,780 5,994 37,067 38,764 38,498 41,814 44,544 44,492
Notes to the consolidated profit and loss account of ING Groupamounts in millions of euros, unless stated otherwise
ING Group Annual Report 2008
162

Effect of reinsurance on non-life premiums earned
2008 2007 2006
Direct gross premiums earned 4,889 6,003 6,248Reinsurance assumed gross premiums earned 20 24 58Total gross premiums earned 4,909 6,027 6,306
Reinsurance ceded –190 –326 –3774,719 5,701 5,929
36 INVESTMENT INCOME
Investment income by insurance and banking operations
Insurance operations Banking operations Total2008 2007 2006 2008 2007 2006 2008 2007 2006
Income from real estate investments 75 80 184 196 252 134 271 332 318Dividend income 646 750 604 84 70 84 730 820 688
721 830 788 280 322 218 1,001 1,152 1,006
Income from investments in debt securities 6,535 6,857 6,359 6,535 6,857 6,359Income from loans – personal loans 209 76 200 209 76 200– mortgage loans 1,044 1,313 1,640 1,044 1,313 1,640– policy loans 200 215 212 200 215 212– other 92 323 345 18 92 323 363Income from investments in debt securities and loans 8,080 8,784 8,756 18 8,080 8,784 8,774
Realised gains/losses on disposal of debt securities 48 –9 –56 40 138 93 88 129 37Reversals/Impairments of available-for-sale debt securities –777 –76 36 –2,127 –57 –2,904 –133 36Realised gains/losses and impairments of debt securities –729 –85 –20 –2,087 81 93 –2,816 –4 73
Realised gains/losses on disposal of equity securities 685 2,975 772 30 330 149 715 3,305 921Impairments of available-for-sale equity securities –1,585 –36 –25 –331 –17 –17 –1,916 –53 –42Realised gains/losses and impairments of equity securities –900 2,939 747 –301 313 132 –1,201 3,252 879
Change in fair value of real estate investments –50 75 108 –350 93 67 –400 168 175Investment income 7,122 12,543 10,379 –2,458 809 528 4,664 13,352 10,907
Reference is made to the ‘Risk management’ section for further information on impairments.
37 COMMISSION INCOME
Gross fee and commission income
Insurance operations Banking operations Total2008 2007 2006 2008 2007 2006 2008 2007 2006
Funds transfer 888 746 704 888 746 704Securities business 891 1,049 1,064 891 1,049 1,064Insurance broking 87 124 92 175 180 171 262 304 263Asset management fees 2,129 2,025 1,760 934 1,140 944 3,063 3,165 2,704
Brokerage and advisory fees 763 1,014 951 256 233 207 1,019 1,247 1,158Other 531 364 270 850 818 704 1,381 1,182 974
3,510 3,527 3,073 3,994 4,166 3,794 7,504 7,693 6,867
Asset management fees related to the management of investments held for the risk of policyholders of EUR 1,174 million (2007: EUR 1,261 million; 2006: EUR 1,069 million) are included in Commission income.
Other include commission fees of EUR 21 million (2007: EUR 26 million; 2006: EUR 42 million) in respect of underwriting syndication loans.
163ING Group Annual Report 2008

2.1 Consolidated annual accounts
Notes to the consolidated profit and loss account of ING Group (continued)
Fee and commission expenses
Insurance operations Banking operations Total2008 2007 2006 2008 2007 2006 2008 2007 2006
Funds transfer 185 144 140 185 144 140Securities business 268 370 347 268 370 347Insurance broking 574 686 551 –4 570 686 551Management fees 217 182 188 169 230 204 386 412 392Brokerage and advisory fees 573 673 624 5 5 2 578 678 626Other 76 85 75 476 491 420 552 576 495
1,440 1,626 1,438 1,099 1,240 1,113 2,539 2,866 2,551
Other include commission expenses of nil (2007: nil; 2006: nil) in respect of underwriting syndication loans.
38 VALUATION RESULTS ON NON-TRADING DERIVATIVES
Valuation results on non-trading derivatives
Insurance operations Banking operations Total2008 2007 2006 2008 2007 2006 2008 2007 2006
Change in fair value of derivatives relating to:– fair value hedges –193 –227 –162 –5,299 924 203 –5,492 697 41– cash-flow hedges (ineffective portion) 22 –5 –4 –7 22 –9 –7– hedges of net investment in foreign entities
(ineffective portion) –6 –14 –12 –6 –14 –12– other non-trading derivatives 2,412 –753 –85 –28 36 391 2,384 –717 306Net result on non-trading derivatives 2,235 –999 –259 –5,327 956 587 –3,092 –43 328
Change in fair value of assets and liabilities (hedged items) 164 223 211 5,533 –886 –203 5,697 –663 8Valuation results on assets and liabilities designated as at fair value through profit and loss (excluding trading) –432 89 127 56 –247 –305 145 –247Net valuation results 1,967 –687 –48 333 126 137 2,300 –561 89
39 NET TRADING INCOME
Net trading income
Insurance operations Banking operations Total2008 2007 2006 2008 2007 2006 2008 2007 2006
Securities trading results –239 246 159 130 –2,147 –804 –109 –1,901 –645Foreign exchange transactions results –90 174 120 274 401 282 184 575 402Derivatives trading results 79 30 –8 –766 2,469 1,270 –687 2,499 1,262Other –94 –80 1 –43 26 152 –137 –54 153
–344 370 272 –405 749 900 –749 1,119 1,172
Securities trading results includes the results of making markets in instruments such as government securities, equity securities, corporate debt securities, money-market instruments, and interest rate derivatives such as swaps, options, futures and forward contracts. Foreign exchange transactions results include gains and losses from spot and forward contracts, options, futures, and translated foreign currency assets and liabilities.
The portion of trading gains and losses for the year ended 31 December 2008 relating to trading securities still held as at 31 December amounted to EUR –246 million (2007: EUR –60 million; 2006: EUR –121 million).
The majority of the risks involved in security and currency trading is economically hedged with derivatives. The securities trading results are partly offset by results on these derivatives. The result of these derivatives is included in Derivatives trading results.
ING Group Annual Report 2008
164

40 OTHER INCOME
Other income
Insurance operations Banking operations Total2008 2007 2006 2008 2007 2006 2008 2007 2006
Net operating lease income 195 79 65 195 79 65Income from real estate development projects 124 95 220 124 95 220Income post office 144 148 156 144 148 156Other 153 305 –5 28 258 35 181 563 30
153 305 –5 491 580 476 644 885 471
Net operating lease income comprises income of EUR 961 million (2007: EUR 803 million; 2006: EUR 691 million), depreciation of EUR 766 million (2007: EUR 724 million; 2006: EUR 626 million) and other expenses of nil (2007: nil; 2006: nil).
41 UNDERWRITING EXPENDITURE
Underwriting expenditure
2008 2007 2006
Gross underwriting expenditure:– before effect of investment result for risk
of policyholders 51,239 50,739 50,363– effect of investment result risk of policyholders –32,408 1,079 2,702
18,831 51,818 53,065Investment result for risk of policyholders 32,408 –1,079 –2,702Reinsurance recoveries –1,754 –1,906 –2,175Underwriting expenditure 49,485 48,833 48,188
The investment income and valuation results regarding investment result for risk of policyholders of EUR –32,408 million (2007: EUR 1,079 million; 2006: EUR 2,702 million) have not been recognised in Investment income and valuation results on assets and liabilities designated at fair value through profit and loss but are recognised in Underwriting expenditure together with the equal amount of change in insurance provisions for risk of policyholders.
Underwriting expenditure by class
2008 2007 2006
Expenditure from life underwritingReinsurance and retrocession premiums 1,802 1,968 2,004Gross benefits 27,159 28,877 26,234Reinsurance recoveries –1,662 –1,749 –1,705Change in life insurance provisions for risk of company 17,407 11,979 13,420Costs of acquiring insurance business 1,877 1,098 1,083Other underwriting expenditure 462 457 439Profit sharing and rebates –416 424 801
46,629 43,054 42,276
Expenditure from non-life underwritingReinsurance and retrocession premiums 196 306 339Gross claims 2,846 3,589 3,848Reinsurance recoveries –92 –157 –470Change in provision for unearned premiums 28 79 65Change in claims provision 54 13 –209Costs of acquiring insurance business 742 979 1,043Other underwriting expenditure –22 –50 –71
3,752 4,759 4,545
Expenditure from investment contractsCosts of acquiring investment contracts 9 19 31Profit sharing and rebates 16 64Other changes in investment contract liabilities –905 985 1,272
–896 1,020 1,367
49,485 48,833 48,188
165ING Group Annual Report 2008

2.1 Consolidated annual accounts
Notes to the consolidated profit and loss account of ING Group (continued)
Profit sharing and rebates
2008 2007 2006
Distributions on account of interest or underwriting results –576 –133 458Bonuses added to policies 131 411 369Deferred profit sharing expense 29 146 –26
–416 424 801
Underwriting expenditure includes an amount of EUR 3,804 million in 2008 (2007: EUR 4,275 million; 2006: EUR 4,141 million) in respect of commission paid and payable with regard to the insurance operations. Amortisation of deferred acquisition costs amounted to EUR 2,026 million in 2008 (2007: EUR 1,552 million; 2006: EUR 1,444 million).
Expenditure from Life underwriting includes an amount of EUR 136 million in 2008 (2007: EUR 110 million; 2006: EUR 181 million) in relation to reserve strengthening for Insurance Asia/Pacific as described in further detail under Segment reporting.
ING transferred part of its life insurance business to Scottish Re in 2004 by means of a co-insurance contract. A loss amounting to EUR 160 million was recognised in Underwriting expenditure in 2004 on this transaction. This loss represented the reduction of the related deferred acquisition costs. In addition, an amount of EUR 240 million is being amortised over the life of the underlying business, starting in 2005 and gradually decreasing in subsequent years as the business tails off. The amount amortised in 2008 was EUR 12 million (2007: EUR 15 million; 2006: EUR 32 million). The cumulative amortisation as at 31 December 2008 was EUR 96 million (2007: EUR 81 million; 2006: EUR 66 million). On 23 January 2009, Hannover Re and Scottish Re announced that Hannover Re has agreed to assume the ING individual life reinsurance business originally transferred to Scottish Re in 2004. 42 INTANGIBLE AMORTISATION AND OTHER IMPAIRMENTS
Intangible amortisation and (reversals of) impairments
Impairment losses Reversals of impairments Total2008 2007 2006 2008 2007 2006 2008 2007 2006
Property and equipment 19 2 1 –14 –4 19 –12 –3Property under development for third parties 93 41 19 –31 –43 62 –2 19Goodwill 155 155Software and other intangible assets 71 15 10 71 15 10Other 3 –4 –2 –4 1
(Reversals of) other impairments 338 58 33 –31 –61 –6 307 –3 27
Amortisation of intangible assets 157 18 8464 15 35
Impairments on Loans and advances to customers are presented under Addition to loan loss provision. Impairments on investments are presented under Investment income. Reference is made to the ‘Risk management’ section for further information on impairments.
No individual principal event or circumstance has led to a material recognition or reversal of the impairment losses.
Amortisation of intangible assets relates to intangible assets recognised as part of companies acquired. Until 2007, these were classified in Other operating expenses. The comparatives for 2007 and 2006 have been amended to reflect the revised presentation. There is no impact on Total expenses.
ING Group Annual Report 2008
166
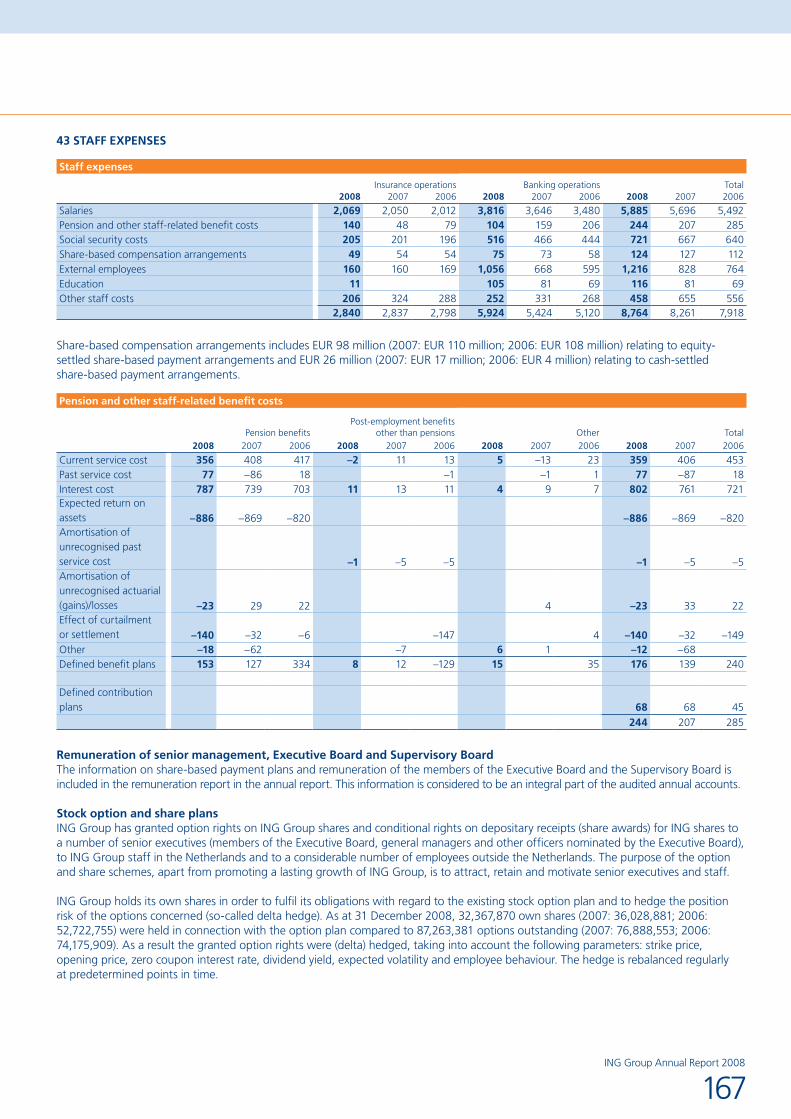
43 STAFF EXPENSES
Staff expenses
Insurance operations Banking operations Total2008 2007 2006 2008 2007 2006 2008 2007 2006
Salaries 2,069 2,050 2,012 3,816 3,646 3,480 5,885 5,696 5,492Pension and other staff-related benefit costs 140 48 79 104 159 206 244 207 285Social security costs 205 201 196 516 466 444 721 667 640Share-based compensation arrangements 49 54 54 75 73 58 124 127 112External employees 160 160 169 1,056 668 595 1,216 828 764Education 11 105 81 69 116 81 69Other staff costs 206 324 288 252 331 268 458 655 556
2,840 2,837 2,798 5,924 5,424 5,120 8,764 8,261 7,918
Share-based compensation arrangements includes EUR 98 million (2007: EUR 110 million; 2006: EUR 108 million) relating to equity-settled share-based payment arrangements and EUR 26 million (2007: EUR 17 million; 2006: EUR 4 million) relating to cash-settled share-based payment arrangements.
Pension and other staff-related benefit costs
Pension benefitsPost-employment benefits
other than pensions Other Total2008 2007 2006 2008 2007 2006 2008 2007 2006 2008 2007 2006
Current service cost 356 408 417 –2 11 13 5 –13 23 359 406 453Past service cost 77 –86 18 –1 –1 1 77 –87 18Interest cost 787 739 703 11 13 11 4 9 7 802 761 721Expected return on assets –886 –869 –820 –886 –869 –820Amortisation of unrecognised past service cost –1 –5 –5 –1 –5 –5Amortisation of unrecognised actuarial (gains)/losses –23 29 22 4 –23 33 22Effect of curtailment or settlement –140 –32 –6 –147 4 –140 –32 –149Other –18 –62 –7 6 1 –12 –68Defined benefit plans 153 127 334 8 12 –129 15 35 176 139 240
Defined contribution plans 68 68 45
244 207 285
Remuneration of senior management, Executive Board and Supervisory BoardThe information on share-based payment plans and remuneration of the members of the Executive Board and the Supervisory Board is included in the remuneration report in the annual report. This information is considered to be an integral part of the audited annual accounts.
Stock option and share plansING Group has granted option rights on ING Group shares and conditional rights on depositary receipts (share awards) for ING shares to a number of senior executives (members of the Executive Board, general managers and other officers nominated by the Executive Board), to ING Group staff in the Netherlands and to a considerable number of employees outside the Netherlands. The purpose of the option and share schemes, apart from promoting a lasting growth of ING Group, is to attract, retain and motivate senior executives and staff.
ING Group holds its own shares in order to fulfil its obligations with regard to the existing stock option plan and to hedge the position risk of the options concerned (so-called delta hedge). As at 31 December 2008, 32,367,870 own shares (2007: 36,028,881; 2006: 52,722,755) were held in connection with the option plan compared to 87,263,381 options outstanding (2007: 76,888,553; 2006: 74,175,909). As a result the granted option rights were (delta) hedged, taking into account the following parameters: strike price, opening price, zero coupon interest rate, dividend yield, expected volatility and employee behaviour. The hedge is rebalanced regularly at predetermined points in time.
167ING Group Annual Report 2008
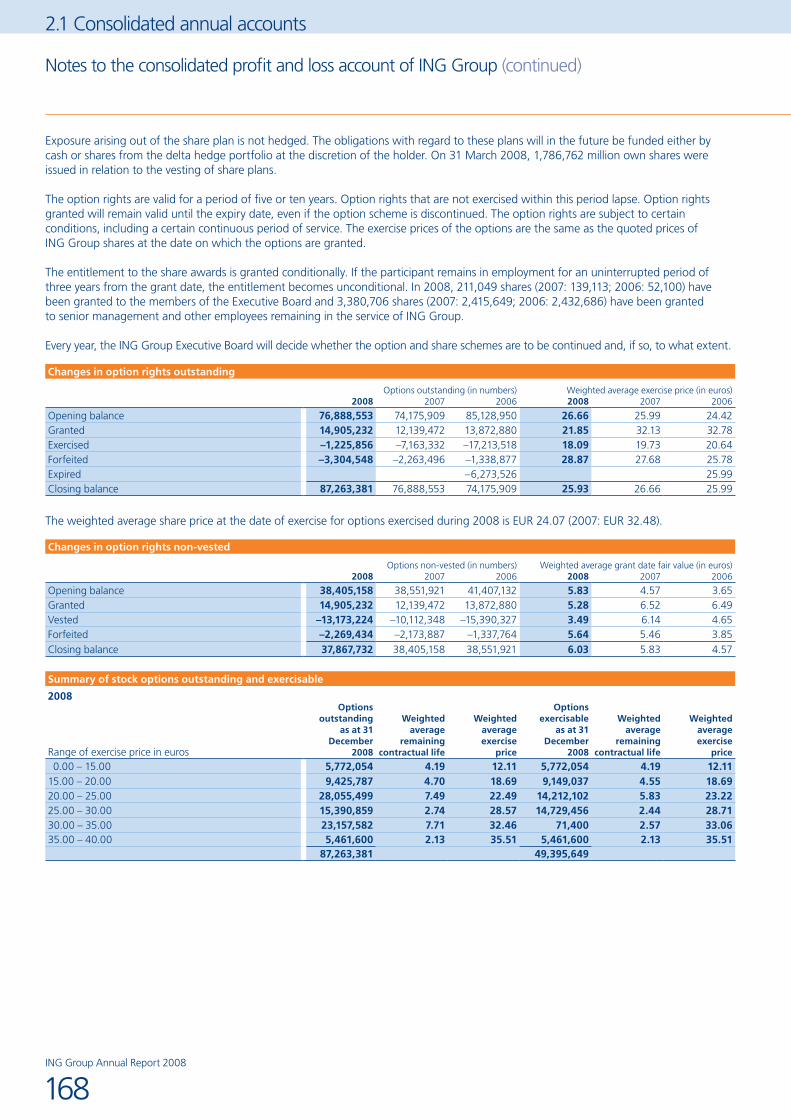
2.1 Consolidated annual accounts
Exposure arising out of the share plan is not hedged. The obligations with regard to these plans will in the future be funded either by cash or shares from the delta hedge portfolio at the discretion of the holder. On 31 March 2008, 1,786,762 million own shares were issued in relation to the vesting of share plans.
The option rights are valid for a period of five or ten years. Option rights that are not exercised within this period lapse. Option rights granted will remain valid until the expiry date, even if the option scheme is discontinued. The option rights are subject to certain conditions, including a certain continuous period of service. The exercise prices of the options are the same as the quoted prices of ING Group shares at the date on which the options are granted.
The entitlement to the share awards is granted conditionally. If the participant remains in employment for an uninterrupted period of three years from the grant date, the entitlement becomes unconditional. In 2008, 211,049 shares (2007: 139,113; 2006: 52,100) have been granted to the members of the Executive Board and 3,380,706 shares (2007: 2,415,649; 2006: 2,432,686) have been granted to senior management and other employees remaining in the service of ING Group.
Every year, the ING Group Executive Board will decide whether the option and share schemes are to be continued and, if so, to what extent.
Changes in option rights outstanding
Options outstanding (in numbers) Weighted average exercise price (in euros)2008 2007 2006 2008 2007 2006
Opening balance 76,888,553 74,175,909 85,128,950 26.66 25.99 24.42Granted 14,905,232 12,139,472 13,872,880 21.85 32.13 32.78Exercised –1,225,856 –7,163,332 –17,213,518 18.09 19.73 20.64Forfeited –3,304,548 –2,263,496 –1,338,877 28.87 27.68 25.78Expired –6,273,526 25.99Closing balance 87,263,381 76,888,553 74,175,909 25.93 26.66 25.99
The weighted average share price at the date of exercise for options exercised during 2008 is EUR 24.07 (2007: EUR 32.48).
Changes in option rights non-vested
Options non-vested (in numbers) Weighted average grant date fair value (in euros)2008 2007 2006 2008 2007 2006
Opening balance 38,405,158 38,551,921 41,407,132 5.83 4.57 3.65Granted 14,905,232 12,139,472 13,872,880 5.28 6.52 6.49Vested –13,173,224 –10,112,348 –15,390,327 3.49 6.14 4.65Forfeited –2,269,434 –2,173,887 –1,337,764 5.64 5.46 3.85Closing balance 37,867,732 38,405,158 38,551,921 6.03 5.83 4.57
Summary of stock options outstanding and exercisable
2008
Range of exercise price in euros
Options outstanding
as at 31 December
2008
Weighted average
remaining contractual life
Weighted averageexercise
price
Options exercisable
as at 31 December
2008
Weighted average
remaining contractual life
Weighted averageexercise
price
0.00 – 15.00 5,772,054 4.19 12.11 5,772,054 4.19 12.1115.00 – 20.00 9,425,787 4.70 18.69 9,149,037 4.55 18.6920.00 – 25.00 28,055,499 7.49 22.49 14,212,102 5.83 23.2225.00 – 30.00 15,390,859 2.74 28.57 14,729,456 2.44 28.7130.00 – 35.00 23,157,582 7.71 32.46 71,400 2.57 33.0635.00 – 40.00 5,461,600 2.13 35.51 5,461,600 2.13 35.51
87,263,381 49,395,649
Notes to the consolidated profit and loss account of ING Group (continued)
ING Group Annual Report 2008
168

Summary of stock options outstanding and exercisable2007
Range of exercise price in euros
Options outstanding as
at 31 December 2007
Weighted average
remaining contractual life
Weighted averageexercise
price
Options exercisable as
at 31 December 2007
Weighted average
remaining contractual life
Weighted averageexercise
price
0.00 – 15.00 6,236,710 5.19 12.02 6,236,710 5.19 12.0215.00 – 20.00 9,773,356 5.55 18.47 9,773,356 5.55 18.4720.00 – 25.00 15,180,545 6.84 23.10 1,556,832 3.21 21.8325.00 – 30.00 15,338,397 3.46 28.72 15,206,363 3.42 28.7430.00 – 35.00 24,726,711 8.69 32.47 77,300 3.59 33.0835.00 – 40.00 5,632,834 3.14 35.51 5,632,834 3.14 35.51
76,888,553 38,483,395
Summary of stock options outstanding and exercisable2006
Range of exercise price in euros
Options outstanding as
at 31 December 2006
Weighted average
remaining contractual life
Weighted averageexercise
price
Options exercisable as
at 31 December 2006
Weighted average
remaining contractual life
Weighted averageexercise
price
0.00 – 15.00 7,953,108 6.18 12.72 7,953,108 6.19 12.7215.00 – 20.00 10,162,164 7.20 18.69 121,471 6.66 18.4920.00 – 25.00 14,820,967 8.24 23.25 44,875 5.65 23.1225.00 – 30.00 19,937,148 4.44 28.73 19,796,024 4.43 28.7430.00 – 35.00 13,696,046 9.20 32.78 102,034 4.59 32.9335.00 – 40.00 7,606,476 4.09 35.58 7,606,476 4.16 35.58
74,175,909 35,623,988
The aggregate intrinsic value of options outstanding and exercisable as at 31 December 2008 was nil and nil, respectively.
As at 31 December 2008 total unrecognised compensation costs related to stock options amounted to EUR 94 million (2007: EUR 69 million; 2006: EUR 90 million). These costs are expected to be recognised over a weighted average period of 1.8 years (2007: 1.7 years; 2006: 1.9 years). Cash received from stock option exercises for the year ended 31 December 2008 was EUR 22 million (2007: EUR 131 million; 2006: EUR 355 million).
The fair value of options granted is recognised as an expense under staff expenses and is allocated over the vesting period of the options. The fair values of the option awards have been determined by using a Monte Carlo simulation. This model takes the risk free interest rate into account (3.55% to 4.92%), as well as the expected life of the options granted (5 year to 8 years), the exercise price, the current share price (EUR 18.70 – EUR 33.92), the expected volatility of the certificates of ING Group shares (25% – 39%) and the expected dividends yield (3.57% to 8.99%). The source for implied volatilities used for the valuation of the stock options is ING’s trading system. The implied volatilities in this system are determined by ING’s traders and are based on market data implied volatilities not on historical volatilities.
Due to timing differences in granting option rights and buying shares to hedge them, an equity difference can occur if shares are purchased at a different price than the exercise price of the options. However, ING Group does not intentionally create a position and occurring positions are closed as soon as possible. If option rights expire, the results on the (sale of) shares which were bought to hedge these option rights are recognised in Shareholders’ equity.
Changes in share awards
Share awards (in numbers) Weighted average grant date fair value (in euros)2008 2007 2006 2008 2007 2006
Opening balance 7,133,714 8,373,146 6,499,469 27.52 24.90 22.92Granted 3,591,755 2,554,762 2,484,786 16.74 19.74 29.62Performance effect –451,070 2,463,058 27.44 19.35Vested –1,945,092 –5,569,061 –155,522 27.51 19.35 22.48Forfeited –537,298 –688,191 –455,587 25.92 26.39 23.10Closing balance 7,792,009 7,133,714 8,373,146 22.60 27.52 24.90
The fair value of share awards granted is recognised as an expense under staff expenses and is allocated over the vesting period of the share awards. The fair values of share awards have been determined by using a Monte Carlo simulation based valuation model. The model takes into account the risk free interest rate, the current stock prices, expected volatilities and current divided yields of the performance peer group used to determine ING’s Total Shareholder Return (TSR) ranking.
169ING Group Annual Report 2008

2.1 Consolidated annual accounts
As at 31 December 2008 total unrecognised compensation costs related to share awards amounted to EUR 56 million (2007: EUR 53 million; 2006: EUR 88 million). These costs are expected to be recognised over a weighted average period of 1.8 years (2007: 1.7 years; 2006: 1.8 years).
44 OTHER INTEREST EXPENSESOther interest expenses mainly consist of interest in connection with the insurance operations, including interest on the perpetual subordinated loans.
Other interest expenses include EUR 1 million and EUR 94 million dividends paid on preference shares and trust preferred securities (2007: EUR 7 million and EUR 92 million; 2006: EUR 10 million and EUR 101 million).
Total interest income and total interest expense for items not valued at fair value through profit and loss for 2008 were EUR 52,505 million (2007: EUR 46,900 million; 2006: EUR 41,281 million) and EUR 33,507 million (2007: EUR 31,173 million; 2006: EUR 27,014 million) respectively. Net interest income of EUR 18,144 million is presented in the following lines in the profit and loss account.
Net interest income
2008 2007 2006
Interest result bank 34 11,042 8,976 9,192Investment income – insurance 36 8,080 8,784 8,756Interest expense –978 –1,102 –1,016
18,144 16,658 16,932
45 OTHER OPERATING EXPENSES
Other operating expenses
Insurance operations Banking operations Total2008 2007 2006 2008 2007 2006 2008 2007 2006
Depreciation of property and equipment 95 98 102 353 321 361 448 419 463Amortisation of software 70 104 100 103 117 100 173 221 200Computer costs 297 289 231 733 561 605 1,030 850 836Office expenses 599 660 629 687 628 634 1,286 1,288 1,263Travel and accommodation expenses 101 102 102 163 153 139 264 255 241Advertising and public relations 204 258 177 833 759 722 1,037 1,017 899External advisory fees 373 455 581 459 491 449 832 946 1,030Postal charges 130 113 117 130 113 117
Addition/(releases) of provision for reorganisations and relocations 8 11 –16 136 434 63 144 445 47Other 836 684 565 627 969 760 1,463 1,653 1,325
2,583 2,661 2,471 4,224 4,546 3,950 6,807 7,207 6,421
Other operating expenses include lease and sublease payments in respect of operating leases of EUR 172 million (2007: EUR 156 million; 2006: EUR 229 million) in which ING is the lessee. Other operating expenses also include EUR 85 million related to integration costs of CitiStreet and EUR 143 million related to premium taxes.
No individual operating lease has terms and conditions that materially affect the amount, timing and certainty of the consolidated cash flows of the Group.
The External advisory fees include fees for audit services and non-audit services provided by the Group’s auditors.
Fees of Group’s auditors
2008 2007 2006
Audit fees 46 61 63Audit related fees 3 7 4Tax fees 3 5 4All other fees 7 2 3Total 59 75 74
Notes to the consolidated profit and loss account of ING Group (continued)
ING Group Annual Report 2008
170

46 TAXATION
Taxation by type
Netherlands International Total2008 2007 2006 2008 2007 2006 2008 2007 2006
Current taxation –329 112 469 863 963 970 534 1,075 1,439Deferred taxation –122 144 95 –1,133 316 373 –1,255 460 468
–451 256 564 –270 1,279 1,343 –721 1,535 1,907
Reconciliation of the weighted average statutory income tax rate to ING Group’s effective income tax rate
2008 2007 2006
Result before taxation –1,487 11,043 9,940Weighted average statutory tax rate 49.9% 28.7% 30.9%Weighted average statutory tax amount –742 3,169 3,071
Associates exemption 69 –814 –255Other income not subject to tax –210 –577 –336Expenses not deductible for tax purposes 106 93 121Impact on deferred tax from change in tax rates –25 –9 –170Deferred tax benefit from previously unrecognised amounts –64 –30Current tax benefit from previously unrecognised amounts –222 –447Write down/reversal of deferred tax assets 360 8 –6Adjustment to prior periods –279 –49 –41Effective tax amount –721 1,535 1,907
Effective tax rate 48.5% 13.9% 19.2%
The weighted average statutory tax rate increased significantly in 2008 compared to 2007 caused by the fact that most of the losses in 2008 were incurred in high tax jurisdictions.
The effective tax rate in 2008 was slightly lower than the weighted average statutory tax. Main reasons for this are tax exempt income and releases of tax provisions, partly offset by non deductible expenses and a reduction of the deferred tax assets.
47 EARNINGS PER ORDINARY SHARE
Earnings per ordinary share
Amount (in millions of euros)
Weighted averagenumber of ordinary shares
outstanding during the period(in millions)
Per ordinary share(in euros)
2008 2007 2006 2008 2007 2006 2008 2007 2006
Basic earnings –729 9,241 7,692 2,042.7 2,141.1 2,155.0 –0.36 4.32 3.57Attribution to non-voting equity securities –425Earnings – after attribution to non-voting equity securities –1,154 9,241 7,692 2,042.7 2,141.1 2,155.0 –0.56 4.32 3.57
Effect of dilutive securities:Non-voting equity securities 425Warrants 3.2 7.6Stock option and share plans 0.8 12.3 14.4
0.8 15.5 22.0
Diluted earnings –729 9,241 7,692 2,043.5 2,156.6 2,177.0 –0.36 4.28 3.53
Diluted earnings per share data are computed as if the stock options and warrants outstanding at year-end had been exercised at the beginning of the period. It is also assumed that ING Group uses the cash received from exercised stock options and warrants exercised or non-voting equity securities converted to buy its own shares against the average market price in the financial year. The net increase in the number of shares resulting from exercising warrants and stock options or converting non-voting equity securities is added to the average number of shares used for the calculation of net earnings per share.
171ING Group Annual Report 2008

2.1 Consolidated annual accounts
The potential conversion of the non-voting equity securities has an antidilutive effect on the earnings per share calculation (the diluted earnings per share becoming less negative than the basic earnings per share). Therefore, the potential conversion is not taken into account in determining the weighted average number of shares for the calculation of diluted earnings per share.
48 DIVIDEND PER ORDINARY SHARE
Dividend per ordinary share
2008 (1) 2007 2006
Per ordinary share (in euros) 0.74 1.48 1.32Per non-voting equity security (in euros) (2) 0.425Total amount of dividend declared (in millions of euros) 1,500 3,180 2,865(1) The Executive Board, with the approval of the Supervisory Board, has proposed, subject to the ratification by the General Meeting of Shareholders, a cash
dividend of EUR 0.74 per share for the year 2008. In August 2008, an interim dividend of EUR 0.74 per ordinary share of EUR 0.24 was made payable.(2) Dividend is payable per non-voting equity security of EUR 0.425. This amount is payable on 12 May 2009 provided that ING Group’s capital adequacy position
is and remains satisfactory both before and after payment in the opinion of the Dutch central bank. The full amount of EUR 425 million is recognised as a liability as at 31 December 2008.
Notes to the consolidated profit and loss account of ING Group (continued)
ING Group Annual Report 2008
172

49 PRIMARY REPORTING FORMAT – BUSINESS SEGMENTS ING Group’s business segments relate to the internal segmentation by business lines. These include the business lines: Insurance Europe, Insurance Americas, Insurance Asia/Pacific, Wholesale Banking, Retail Banking and ING Direct. Other mainly includes items not directly attributable to the business lines.
Each business line is headed by a member of the Executive Board. The Executive Board sets the performance targets and approves and monitors the budgets prepared by the business lines. Business lines formulate strategic, commercial and financial policies in conformity with the strategy and performance targets set by the Executive Board.
The accounting policies of the business segments are the same as those described under Accounting policies for the consolidated balance sheet and profit and loss account. Transfer prices for inter-segment transactions are set at arm’s length. Corporate expenses are allocated to business lines based on time spent by head office personnel, the relative number of staff, or on the basis of income and/or assets of the segment. With regard to investments in equity securities, a fixed return of 3% is allocated to the insurance business lines. The differences between the actual dividend income, capital gains and impairments and the allocated return are included in Other.
ING applies a system of capital charging that makes the results of the banking business units globally comparable, irrespective of the book equity they have and the currency they operate in. ING’s policy for the banking business units is that equity may only be invested locally at the local risk free rate. Banking business units are charged by the Corporate Line for the income that they make on the invested equity and are given a benefit based on the risk free euro rate on the economic capital they employ. Consequently, the results of the businesses as disclosed are the local results after Group overhead charges while the investment returns on equity are based on the risk free euro rate on economic capital.
ING Group evaluates the results of its business segments using a financial performance measure called underlying result before taxation. Underlying result before taxation is defined as result before taxation excluding the impact of divestments and special items.
Segment reportingamounts in millions of euros, unless stated otherwise
173ING Group Annual Report 2008

2.1 Consolidated annual accounts
Segment reporting (continued)
Business segments
2008Insurance
EuropeInsurance Americas
Insurance Asia/
PacificWholesale
BankingRetail
Banking ING Direct OtherTotal
segments Eliminations Total
Income– external 14,053 27,656 13,384 4,050 8,758 1,138 –2,748 66,291 66,291– inter-segment 436 82 774 57 –1,359 –260 1,832 1,562 –1,562 Total income 14,489 27,738 14,158 4,107 7,399 878 –916 67,853 –1,562 66,291
Segment result before taxation 651 –590 –213 609 1,420 –1,155 –2,209 –1,487 –1,487Divestments –265 329 15 79 79Special items 321 271 30 622 622Underlying result before taxation 651 –534 116 609 1,691 –1,125 –2,194 –786 –786
Segment assets 96,392 141,355 66,228 1,173,150 581,538 275,829 286,430 2,620,922 –1,289,259 1,331,663Segment liabilities 88,469 138,009 61,716 1,163,301 575,369 271,778 242,168 2,540,810 –1,238,075 1,302,735
Share in profit or loss of associates –227 31 –1 –217 10 –404 –404Book value of associates 2,086 460 4 1,385 414 6 4,355 4,355
Cost incurred to acquire property, equipment and intangibles 272 1,161 58 256 767 516 –17 3,013 3,013
Significant non-cash expenses
– Depreciation and amortisation 48 98 38 154 224 97 119 778 778
– Other impairments 2 204 94 4 33 1 338 338– Reversal of
impairments 31 31 31– Deferred acquisition
costs and VOBA 195 1,567 562 2,324 2,324– Increase in provisions
for Insurance and investment contracts 2,113 7,098 7,339 –187 16,363 16,363
– Addition to loan loss provision 596 401 283 1,280 1,280
Impairments on investments are presented within Investment income, which is part of Total income. In 2008, total impairments of EUR 4,820 million are included in the following segments: EUR 2 million in Insurance Europe, EUR 692 million in Insurance Americas, and EUR 79 million in Insurance Asia Pacific, EUR 267 million in Wholesale Banking, EUR 4 million in Retail Banking, EUR 1,891 million in ING Direct and EUR 1,885 million in Other.
ING Group Annual Report 2008
174
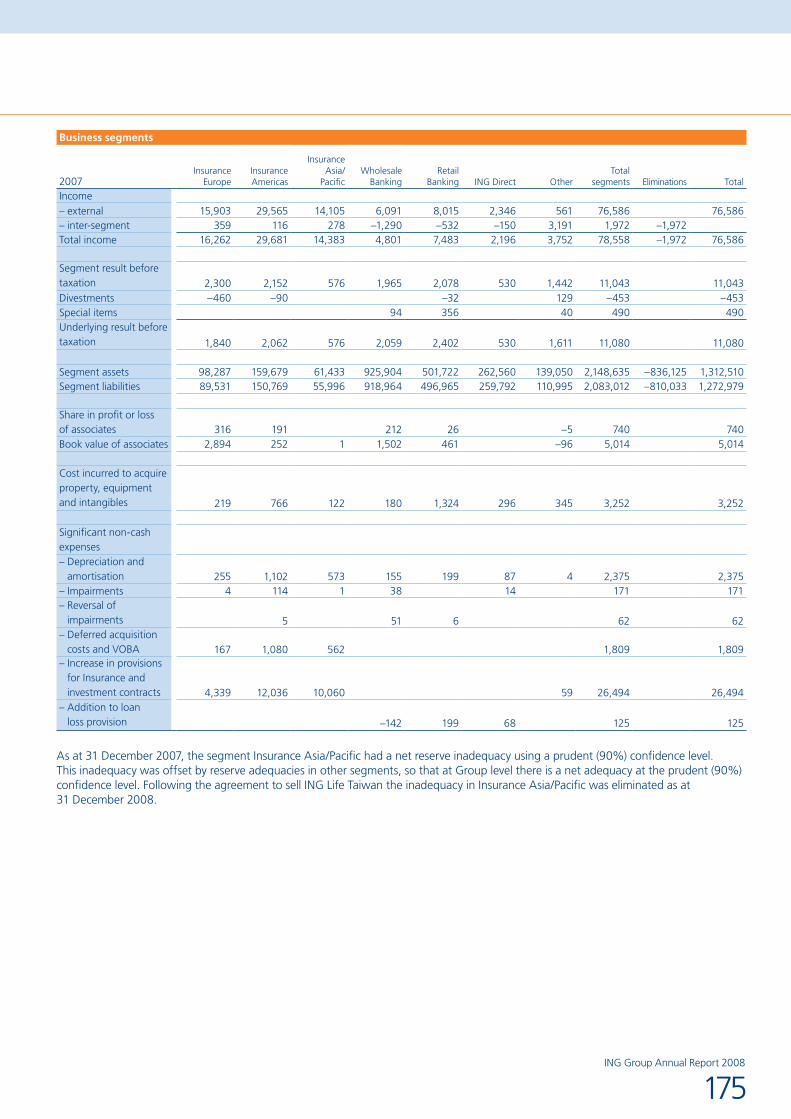
Business segments
2007Insurance
EuropeInsurance Americas
Insurance Asia/
PacificWholesale
BankingRetail
Banking ING Direct OtherTotal
segments Eliminations Total
Income– external 15,903 29,565 14,105 6,091 8,015 2,346 561 76,586 76,586– inter-segment 359 116 278 –1,290 –532 –150 3,191 1,972 –1,972Total income 16,262 29,681 14,383 4,801 7,483 2,196 3,752 78,558 –1,972 76,586
Segment result before taxation 2,300 2,152 576 1,965 2,078 530 1,442 11,043 11,043Divestments –460 –90 –32 129 –453 –453Special items 94 356 40 490 490Underlying result before taxation 1,840 2,062 576 2,059 2,402 530 1,611 11,080 11,080
Segment assets 98,287 159,679 61,433 925,904 501,722 262,560 139,050 2,148,635 –836,125 1,312,510Segment liabilities 89,531 150,769 55,996 918,964 496,965 259,792 110,995 2,083,012 –810,033 1,272,979
Share in profit or loss of associates 316 191 212 26 –5 740 740Book value of associates 2,894 252 1 1,502 461 –96 5,014 5,014
Cost incurred to acquire property, equipment and intangibles 219 766 122 180 1,324 296 345 3,252 3,252
Significant non-cash expenses– Depreciation and
amortisation 255 1,102 573 155 199 87 4 2,375 2,375– Impairments 4 114 1 38 14 171 171– Reversal of
impairments 5 51 6 62 62– Deferred acquisition
costs and VOBA 167 1,080 562 1,809 1,809– Increase in provisions
for Insurance and investment contracts 4,339 12,036 10,060 59 26,494 26,494
– Addition to loan loss provision –142 199 68 125 125
As at 31 December 2007, the segment Insurance Asia/Pacific had a net reserve inadequacy using a prudent (90%) confidence level. This inadequacy was offset by reserve adequacies in other segments, so that at Group level there is a net adequacy at the prudent (90%) confidence level. Following the agreement to sell ING Life Taiwan the inadequacy in Insurance Asia/Pacific was eliminated as at 31 December 2008.
175ING Group Annual Report 2008
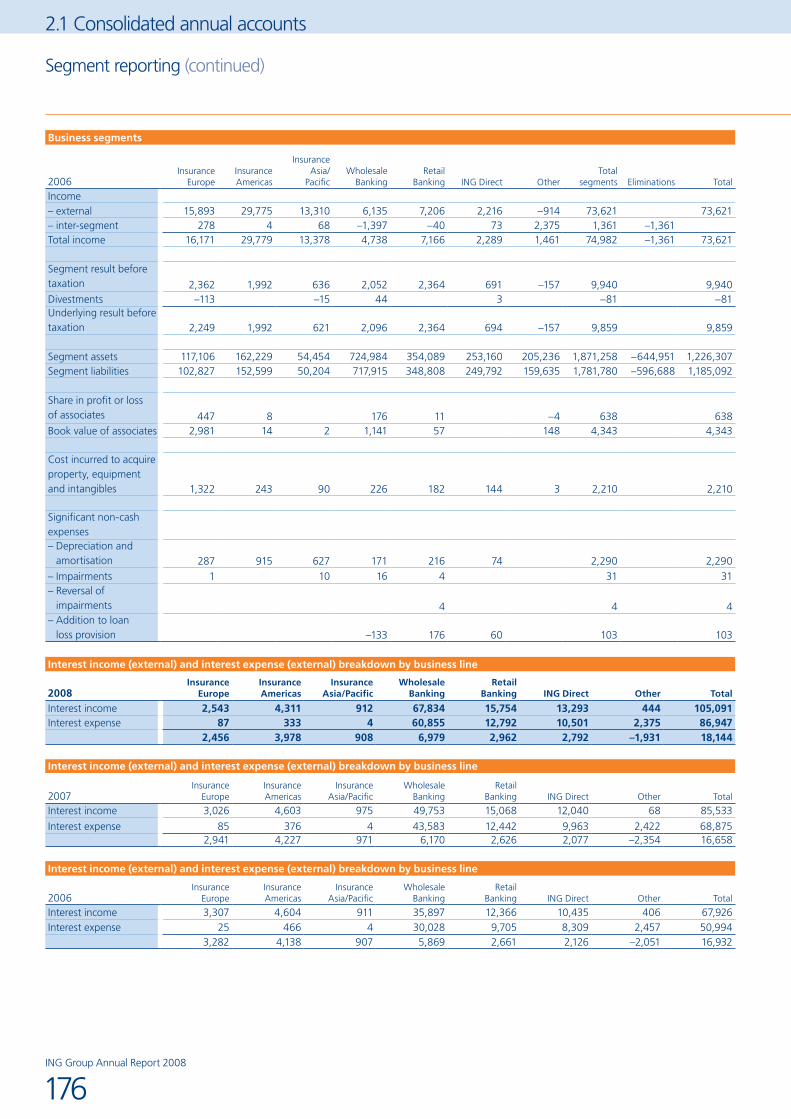
2.1 Consolidated annual accounts
Segment reporting (continued)
Business segments
2006Insurance
EuropeInsurance Americas
Insurance Asia/
PacificWholesale
BankingRetail
Banking ING Direct OtherTotal
segments Eliminations Total
Income– external 15,893 29,775 13,310 6,135 7,206 2,216 –914 73,621 73,621– inter-segment 278 4 68 –1,397 –40 73 2,375 1,361 –1,361Total income 16,171 29,779 13,378 4,738 7,166 2,289 1,461 74,982 –1,361 73,621
Segment result before taxation 2,362 1,992 636 2,052 2,364 691 –157 9,940 9,940Divestments –113 –15 44 3 –81 –81Underlying result before taxation 2,249 1,992 621 2,096 2,364 694 –157 9,859 9,859
Segment assets 117,106 162,229 54,454 724,984 354,089 253,160 205,236 1,871,258 –644,951 1,226,307Segment liabilities 102,827 152,599 50,204 717,915 348,808 249,792 159,635 1,781,780 –596,688 1,185,092
Share in profit or loss of associates 447 8 176 11 –4 638 638Book value of associates 2,981 14 2 1,141 57 148 4,343 4,343
Cost incurred to acquire property, equipment and intangibles 1,322 243 90 226 182 144 3 2,210 2,210
Significant non-cash expenses– Depreciation and
amortisation 287 915 627 171 216 74 2,290 2,290– Impairments 1 10 16 4 31 31– Reversal of
impairments 4 4 4– Addition to loan
loss provision –133 176 60 103 103
Interest income (external) and interest expense (external) breakdown by business line
2008Insurance
EuropeInsurance Americas
Insurance Asia/Pacific
Wholesale Banking
Retail Banking ING Direct Other Total
Interest income 2,543 4,311 912 67,834 15,754 13,293 444 105,091Interest expense 87 333 4 60,855 12,792 10,501 2,375 86,947
2,456 3,978 908 6,979 2,962 2,792 –1,931 18,144
Interest income (external) and interest expense (external) breakdown by business line
2007Insurance
EuropeInsurance Americas
Insurance Asia/Pacific
Wholesale Banking
Retail Banking ING Direct Other Total
Interest income 3,026 4,603 975 49,753 15,068 12,040 68 85,533
Interest expense 85 376 4 43,583 12,442 9,963 2,422 68,8752,941 4,227 971 6,170 2,626 2,077 –2,354 16,658
Interest income (external) and interest expense (external) breakdown by business line
2006Insurance
EuropeInsurance Americas
Insurance Asia/Pacific
Wholesale Banking
Retail Banking ING Direct Other Total
Interest income 3,307 4,604 911 35,897 12,366 10,435 406 67,926Interest expense 25 466 4 30,028 9,705 8,309 2,457 50,994
3,282 4,138 907 5,869 2,661 2,126 –2,051 16,932
ING Group Annual Report 2008
176

50 SECONDARY REPORTING FORMAT – GEOGRAPHICAL SEGMENTSING Group’s six business lines operate in seven main geographical areas: the Netherlands, Belgium, Rest of Europe, North America, Latin America, Asia and Australia. Geographical distribution of income is based on the origin of revenue.
Geographical segments
2008 Netherlands BelgiumRest of Europe
North America
Latin America Asia Australia Other Eliminations Total
Income– external 12,072 4,070 7,560 26,372 2,567 13,687 746 –783 66,291– inter-segment 1,816 382 –1,414 –69 537 40 270 –1,562 Total income 13,888 4,070 7,942 24,958 2,498 14,224 786 –513 –1,562 66,291
Segment result before taxation –392 801 1,694 –2,209 202 –250 150 –1,483 –1,487
Segment assets 740,436 173,064 428,722 290,340 25,199 108,074 37,124 45,139 –516,435 1,331,663Cost incurred to acquire property, equipment and intangibles 833 102 662 756 448 56 41 115 3,013
Geographical segments
2007 Netherlands BelgiumRest of Europe
North America
Latin America Asia Australia Other Eliminations Total
Income– external 15,577 5,850 6,424 28,240 3,186 13,999 1,005 2,307 –2 76,586– inter-segment 686 –701 727 –463 178 304 20 1,219 –1,970 Total income 16,263 5,149 7,151 27,777 3,364 14,303 1,025 3,526 –1,972 76,586
Segment result before taxation 2,252 1,542 1,987 2,233 523 551 452 1,503 11,043
Segment assets 676,676 177,716 363,178 313,263 23,631 89,079 40,915 36,243 –408,191 1,312,510Cost incurred to acquire property, equipment and intangibles 467 62 1,218 316 679 113 56 341 3,252
Geographical segments
2006 Netherlands BelgiumRest of Europe
North America
Latin America Asia Australia Other Eliminations Total
Income– external 16,079 5,358 5,920 29,472 2,712 13,155 841 84 73,621– inter-segment 765 –436 586 –1,039 355 117 11 1,002 –1,361 Total income 16,844 4,922 6,506 28,433 3,067 13,272 852 1,086 –1,361 73,621
Segment result before taxation 3,585 1,115 1,785 2,315 318 583 340 –101 9,940
Segment assets 608,949 180,694 339,683 319,233 21,567 72,515 33,373 44,459 –394,166 1,226,307Cost incurred to acquire property, equipment and intangibles 1,506 62 253 228 40 75 46 2,210
177ING Group Annual Report 2008

2.1 Consolidated annual accounts
Result before taxation by geographical area
Insurance operations Banking operations Total2008 2007 2006 2008 2007 2006 2008 2007 2006
Netherlands 242 1,446 2,182 –634 806 1,403 –392 2,252 3,585Belgium 80 523 160 721 1,019 955 801 1,542 1,115Rest of Europe 329 332 309 1,365 1,655 1,476 1,694 1,987 1,785North America –843 1,826 1,564 –1,366 407 751 –2,209 2,233 2,315Latin America 254 326 178 –52 197 140 202 523 318Asia –340 362 468 90 189 115 –250 551 583Australia 126 215 176 24 237 164 150 452 340Other –1,483 1,503 –101 –1,483 1,503 –101Total –1,635 6,533 4,936 148 4,510 5,004 –1,487 11,043 9,940
Geographical analysis of claims, expense ratio and combined ratio for non-life insurance policies
Claims ratio Expense ratio Combined ratio2008 2007 2006 2008 2007 2006 2008 2007 2006
Netherlands 55.8 50.2 44.7 41.8 41.2 40.3 97.6 91.4 85.0Belgium 49.1 70.3 65.0 44.7 31.5 33.7 93.8 101.8 98.7Rest of Europe 49.7 44.1 46.8 44.1 44.8 41.3 93.8 88.9 88.1North America 69.5 65.7 59.2 29.1 28.5 29.9 98.6 94.2 89.1Latin America 70.4 81.6 74.2 16.7 27.3 26.8 87.1 108.9 101.0Asia 53.1 50.1 50.2 38.3 42.7 40.7 91.4 92.8 90.9Other 26.9 144.3 60.1 –46.6 18.7 –36.4 –19.7 163.0 23.7Total 64.3 65.3 58.6 32.2 31.8 31.8 96.5 97.1 90.4
The claims ratio relates to claims, including claims handling expenses, expressed as a percentage of net earned premiums. The expense ratio relates to costs expressed as a percentage of net premiums written. The claims ratio and the expense ratio together form the combined ratio. A combined ratio of more than 100% does not necessarily mean that there is a loss on non-life insurance policies, because the result also includes the allocated investment income.
Segment reporting (continued)
ING Group Annual Report 2008
178
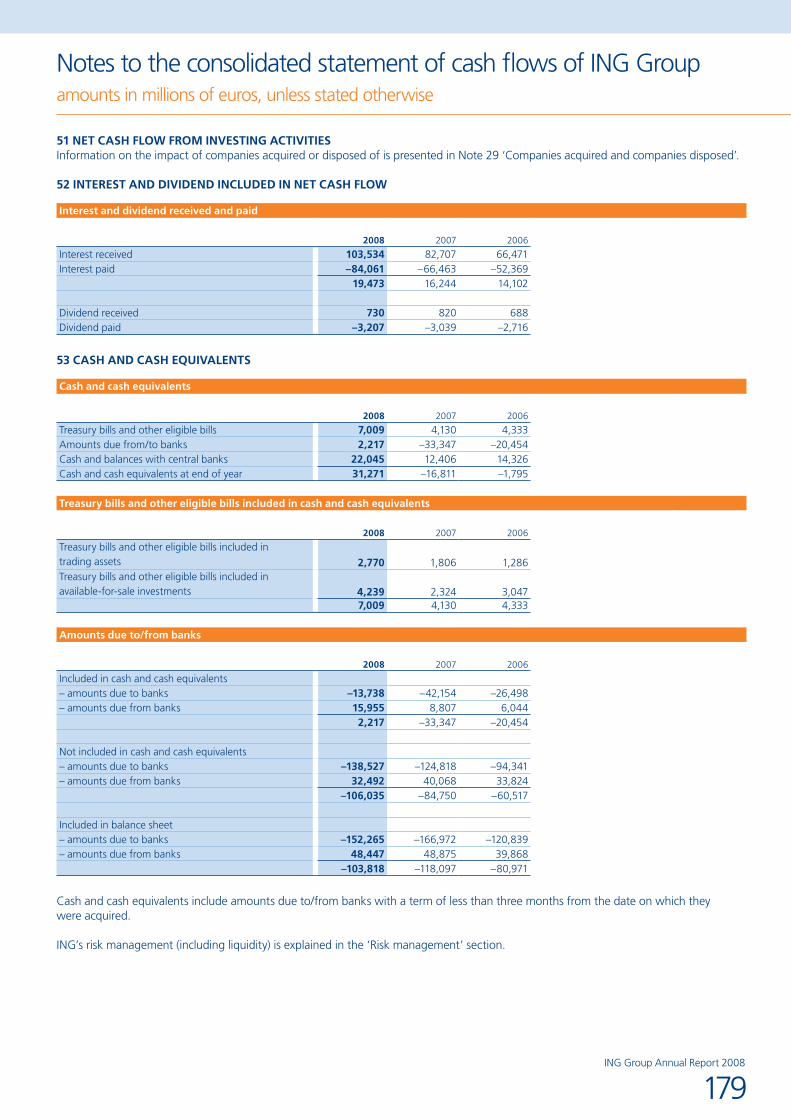
Notes to the consolidated statement of cash flows of ING Groupamounts in millions of euros, unless stated otherwise
51 NET CASH FLOW FROM INVESTING ACTIVITIES Information on the impact of companies acquired or disposed of is presented in Note 29 ‘Companies acquired and companies disposed’.
52 INTEREST AND DIVIDEND INCLUDED IN NET CASH FLOW
Interest and dividend received and paid
2008 2007 2006
Interest received 103,534 82,707 66,471Interest paid –84,061 –66,463 –52,369
19,473 16,244 14,102
Dividend received 730 820 688Dividend paid –3,207 –3,039 –2,716
53 CASH AND CASH EQUIVALENTS
Cash and cash equivalents
2008 2007 2006
Treasury bills and other eligible bills 7,009 4,130 4,333Amounts due from/to banks 2,217 –33,347 –20,454Cash and balances with central banks 22,045 12,406 14,326Cash and cash equivalents at end of year 31,271 –16,811 –1,795
Treasury bills and other eligible bills included in cash and cash equivalents
2008 2007 2006
Treasury bills and other eligible bills included in trading assets 2,770 1,806 1,286Treasury bills and other eligible bills included in available-for-sale investments 4,239 2,324 3,047
7,009 4,130 4,333
Amounts due to/from banks
2008 2007 2006
Included in cash and cash equivalents– amounts due to banks –13,738 –42,154 –26,498– amounts due from banks 15,955 8,807 6,044
2,217 –33,347 –20,454
Not included in cash and cash equivalents– amounts due to banks –138,527 –124,818 –94,341– amounts due from banks 32,492 40,068 33,824
–106,035 –84,750 –60,517
Included in balance sheet– amounts due to banks –152,265 –166,972 –120,839– amounts due from banks 48,447 48,875 39,868
–103,818 –118,097 –80,971
Cash and cash equivalents include amounts due to/from banks with a term of less than three months from the date on which they were acquired.
ING’s risk management (including liquidity) is explained in the ‘Risk management’ section.
179ING Group Annual Report 2008

2.1 Consolidated annual accounts
Risk managementamounts in millions of euros, unless stated otherwise
STRUCTURE OF RISK MANAGEMENT SECTION – Risk Management in 2008 – ING Group Risk Governance ING Group Risk Profile – ING Bank ING Bank Risk Profile ING Bank – Credit risks ING Bank – Market risks ING Bank – Liquidity risk – ING Insurance ING Insurance Risk Profile ING Insurance – Market risks ING Insurance – Insurance risks ING Insurance – Credit risks – ING Group – Non-financial Risks Operational risks Compliance risk– Model Disclosures
RISK MANAGEMENT IN 2008Taking measured risks is part of ING Group’s business. As a financial services company active in banking, investments, life insurance and retirement services. ING Group is naturally exposed to a variety of risks. To ensure measured risk-taking ING Group has integrated risk management in its daily business activities and strategic planning. Risk Management assists with the formulation of risk appetite, strategies, policies and limits and provides a review, oversight and support function throughout the Group on risk-related issues. The main financial risks ING Group is exposed to are credit risk (including transfer risk), market risk (including interest rate, equity, real estate, and foreign exchange risks), insurance risk and liquidity risk. In addition, ING Group is exposed to non-financial risks, e.g. operational and compliance risks. The way ING Group manages these risks on a day-to-day basis is described in this risk management section.
Despite the fact that the ongoing crisis claims most of the management attention on a daily basis throughout the risk management organisation, ING Group continued its long-term investments in risk management, including investments in people, governance, processes, measurement tools and systems. The Non-Financial Risk Dashboard, which was introduced internally and piloted in 2007 was implemented and presented to the Executive Board and the Audit Committee for the first time in November 2008.
MARKET DEVELOPMENTS 2008Although the whole of 2008 was characterised by significant turmoil, it was in the second half of the year, after the default of Lehman Brothers, Washington Mutual and three Icelandic banks, that volatility in financial markets intensified. Throughout the world the prices of most major asset classes fell sharply. Equity markets came down significantly: year on year the S&P 500 declined 38% and the Dutch Amsterdam Exchange Index (AEX) declined 52%. Real estate prices were also under pressure. At 31 December 2008 the most prominent real estate index in the United States, the S&P Case-Shiller Index, was 18.6% lower than at the end of 2007. Moreover, credit spreads in the financial and corporate sector widened materially, both in the US and in Europe. The second half of 2008 showed a steep increase in corporate credit spreads which was for a major part driven by the auto and industrial sectors. Both short and long term interest rates dropped in Europe and more profoundly in the United States.
In response to these movements governments all over the world stepped in with rescue plans to buy pressurised assets, deposit guarantee programmes, capital injections or full nationalisations. In October 2008 ING Group and the Dutch state announced that an agreement had been reached on a EUR 10 billion capital injection from the Dutch State. See Note 12 Shareholders’ equity (parent)/non-voting equity securities for details.
Risk mitigationTo counter the implications of the financial crisis ING Group decided to take several measures over the course of the year to reduce risk:
Deleveraging •ING is working to reduce the bank balance sheet by 10% by decreasing the non-lending part by 25%. ING intends to reduce the available for sale portfolio over time as proceeds from maturing securities will be used to fund ING-originated loans. Reducing trading activities, deposits at other banks and reverse-repos are expected to make up most of the remaining reduction. At the same time, lending activities will be maintained with focus on the Corporate and Retail business. Reduction of credit risk •In January 2009, ING Group entered into an Illiquid Assets Back-up Facility term sheet with the Dutch State covering ING’s Alt-A residential mortgage backed securities (RMBS) portfolio. Through this transaction, which is expected to close in the first quarter of 2009, subject to final documentation and regulatory approval, the Dutch State will become the economic owner of 80% of the Alt-A RMBS portfolio. This transaction is expected to be concluded at 90% of the par value with respect to the 80% portion of the portfolio
ING Group Annual Report 2008
180

of which the Dutch State will become the economic owner. Par value of the portfolio is approximately EUR 30 billion. Following the deteriorated economic outlook in the third and fourth quarter market prices for these securities had become depressed as liquidity dried up, which had an impact on ING’s results and equity far in excess of estimated credit losses. The transaction with the Dutch State is expected to significantly reduce the uncertainty regarding the impact on ING of any future losses in the portfolio. As condition to the Facility ING will commit to support the growth of the Dutch lending business for an amount of EUR 25 billion at market-conforming conditions. The Dutch State will also acquire certain consent rights with respect to the sale or transfer of the 20% proportion of the Alt-A RMBS portfolio that is retained by ING. Reduction of equity exposure (available-for-sale) •Direct public exposure was reduced from EUR 15.8 billion at the end of 2007 to EUR 5.8 billion at year-end 2008. The reduction in exposure was due to negative revaluations, and sales. ING Insurance holds EUR 3.9 billion balance sheet exposure which was partially hedged against further market losses. In addition, a temporary hedging programme was put in place to reduce earnings volatility resulting from potential DAC (Deferred Acquisition Cost) unlocking. Reduction of interest rate risk• ING sold ING Life Taiwan which resulted into a significant reduction of its interest rate risk exposure. This divestment was in line with the strategy to allocate capital to those businesses that generate the highest return. In addition, ING lengthened its asset duration in order to mitigate the impact of declining interest rates, herewith further reducing its interest rate risk exposure.
A more detailed disclosure of outstanding risk factors facing ING and the financial industry is given in the Risk Factor section in the Additional Information part of the Annual Report.
Impact of financial crisisImpact on pressurised asset classes As a result of the deteriorating market conditions throughout 2008 ING Group incurred negative revaluations on its investment portfolio, which impacted shareholders’ equity. Furthermore, ING Group incurred impairments, fair value changes and trading losses, which impacted its profit and loss account (P&L).The table below shows the exposures and negative revaluations and losses taken on US sub-prime and US Alt-A residential mortgage backed securities (RMBS), Collateralised Debt Obligations (CDOs) and Collateralised Loan Obligations (CLOs) during 2008.
US Subprime RMBS, US Alt-A RMBS, CDOs/CLOs exposures, revaluations and losses31 December 2008 Change in 2008 31 December 2007
Market Value
Revaluation through Equity
(pre-tax)
Write-downs through P&L
(pre-tax) Other changes Market value
Revaluation through Equity
(pre-tax)
US Subprime RMBS 1,778 –839 –120 –52 2,789 –307US Alt-A RMBS 18,847 –6,538 –2,064 –33 27,482 –936CDOs/CLOs 3,469 –218 –394 2,186 1,895 –134Total 24,094 –7,595 –2,578 2,101 32,166 –1,377
ING Group’s total EUR 1.8 billion exposure to US sub-prime assets relates to non originated loans acquired as investments in RMBS •and represents 0.1% of total assets. At 31 December 2008 approximately 77% of ING’s US sub-prime portfolio was rated AA or higher. ING Group does not originate sub-prime mortgages. The vast majority of the total mortgage backed securities (MBS) are (residential) mortgages that are not classified as sub-prime. ING Group’s total US Alt-A RMBS exposure at 31 December 2008 was EUR 18.8 billion. About 65% of this portfolio was AAA rated. •The majority of the exposure (EUR 16.3 billion) was held by ING Direct. ING’s Available-for-Sale Alt-A investments are measured at fair value in the balance sheet. The substantial amount of negative pre-tax revaluation and impairments on this portfolio are mainly caused by the illiquid market. Net investments in CDOs/CLOs at 31 December 2008 were 0.3% of total assets. The vast majority of the CDOs/CLOs has investment •grade corporate credit as underlying assets, only EUR 1 million has US subprime mortgages underlying. Other changes includes purchases and sales of CDOs/CLOs, as well as foreign currency effects.
EUR 23.7 billion of the EUR 24.1 billion exposure on US Subprime RMBS, US Alt-A RMBS and CDOs/CLOs is booked at fair value. An analysis of the method applied in determining the fair values of financial assets and liabilities is provided in Note 33 ‘Fair value of Financial Assets and Liabilities’. At 31 December 2008 the fair value of US Subprime RMBS, US Alt-A RMBS and CDOs/CLOs was as follows:
Fair value of US subprime RMBS, US Alt-A RMBS and CDOs/CLOs
2008
Reference to published price
quotations in active markets
Valuation technique
supported by market inputs
Valuation technique not supported by market inputs Total
US Subprime RMBS 20 26 1,732 1,778US Alt-A RMBS 244 18,244 18,488CDOs/CLOs 3,273 162 34 3,469Total 3,293 432 20,010 23,735
181ING Group Annual Report 2008
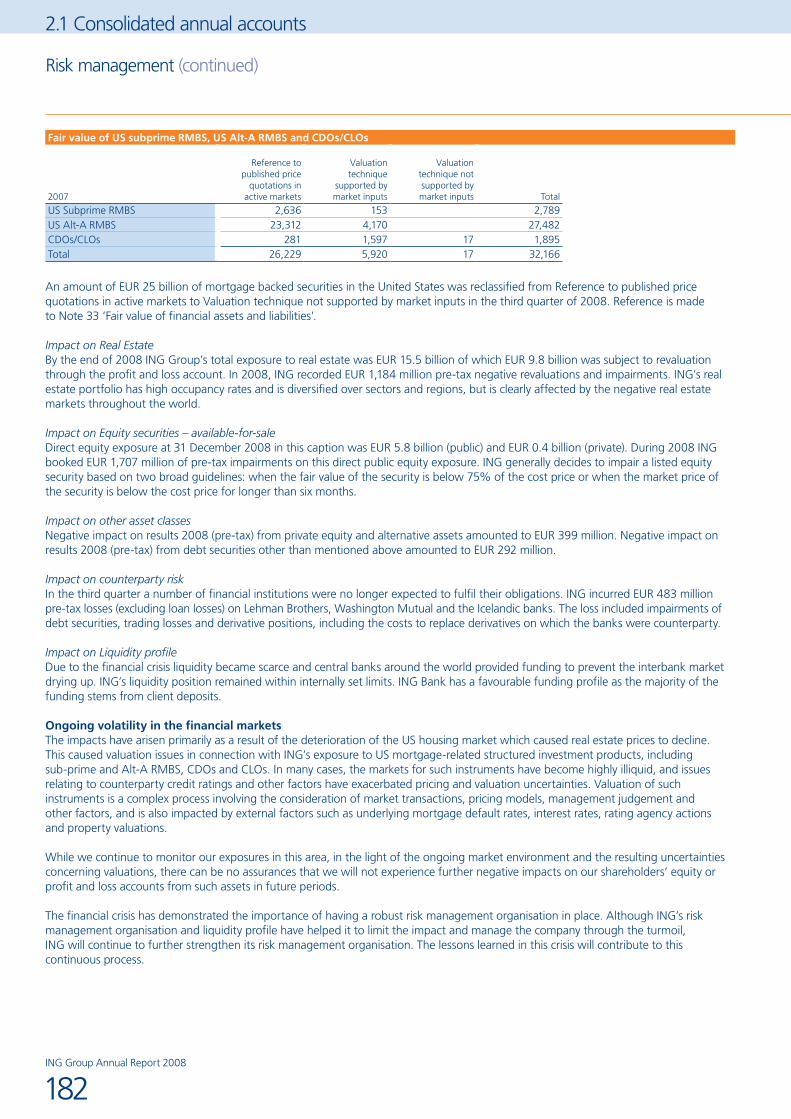
2.1 Consolidated annual accounts
Fair value of US subprime RMBS, US Alt-A RMBS and CDOs/CLOs
2007
Reference to published price
quotations in active markets
Valuation technique
supported by market inputs
Valuation technique not supported by market inputs Total
US Subprime RMBS 2,636 153 2,789US Alt-A RMBS 23,312 4,170 27,482CDOs/CLOs 281 1,597 17 1,895Total 26,229 5,920 17 32,166
An amount of EUR 25 billion of mortgage backed securities in the United States was reclassified from Reference to published price quotations in active markets to Valuation technique not supported by market inputs in the third quarter of 2008. Reference is made to Note 33 ‘Fair value of financial assets and liabilities’.
Impact on Real EstateBy the end of 2008 ING Group’s total exposure to real estate was EUR 15.5 billion of which EUR 9.8 billion was subject to revaluation through the profit and loss account. In 2008, ING recorded EUR 1,184 million pre-tax negative revaluations and impairments. ING’s real estate portfolio has high occupancy rates and is diversified over sectors and regions, but is clearly affected by the negative real estate markets throughout the world.
Impact on Equity securities – available-for-saleDirect equity exposure at 31 December 2008 in this caption was EUR 5.8 billion (public) and EUR 0.4 billion (private). During 2008 ING booked EUR 1,707 million of pre-tax impairments on this direct public equity exposure. ING generally decides to impair a listed equity security based on two broad guidelines: when the fair value of the security is below 75% of the cost price or when the market price of the security is below the cost price for longer than six months.
Impact on other asset classesNegative impact on results 2008 (pre-tax) from private equity and alternative assets amounted to EUR 399 million. Negative impact on results 2008 (pre-tax) from debt securities other than mentioned above amounted to EUR 292 million.
Impact on counterparty riskIn the third quarter a number of financial institutions were no longer expected to fulfil their obligations. ING incurred EUR 483 million pre-tax losses (excluding loan losses) on Lehman Brothers, Washington Mutual and the Icelandic banks. The loss included impairments of debt securities, trading losses and derivative positions, including the costs to replace derivatives on which the banks were counterparty.
Impact on Liquidity profileDue to the financial crisis liquidity became scarce and central banks around the world provided funding to prevent the interbank market drying up. ING’s liquidity position remained within internally set limits. ING Bank has a favourable funding profile as the majority of the funding stems from client deposits.
Ongoing volatility in the financial marketsThe impacts have arisen primarily as a result of the deterioration of the US housing market which caused real estate prices to decline. This caused valuation issues in connection with ING’s exposure to US mortgage-related structured investment products, including sub-prime and Alt-A RMBS, CDOs and CLOs. In many cases, the markets for such instruments have become highly illiquid, and issues relating to counterparty credit ratings and other factors have exacerbated pricing and valuation uncertainties. Valuation of such instruments is a complex process involving the consideration of market transactions, pricing models, management judgement and other factors, and is also impacted by external factors such as underlying mortgage default rates, interest rates, rating agency actions and property valuations.
While we continue to monitor our exposures in this area, in the light of the ongoing market environment and the resulting uncertainties concerning valuations, there can be no assurances that we will not experience further negative impacts on our shareholders’ equity or profit and loss accounts from such assets in future periods.
The financial crisis has demonstrated the importance of having a robust risk management organisation in place. Although ING’s risk management organisation and liquidity profile have helped it to limit the impact and manage the company through the turmoil, ING will continue to further strengthen its risk management organisation. The lessons learned in this crisis will contribute to this continuous process.
Risk management (continued)
ING Group Annual Report 2008
182

The following paragraphs provide a high level overview of the risk management governance and risk profile from an ING Group perspective. This is followed by a more detailed overview, split into the different risk types (credit, market, liquidity, insurance, operational and compliance risk) both for ING Bank and ING Insurance. The section concludes with disclosures on models for Earnings at Risk (EaR), Capital at Risk (CaR) and Economic Capital (EC).
ING GROUPTo ensure measured risk-taking throughout the organisation, ING Group operates through a comprehensive risk management framework. This ensures the identification, measurement and control of risks at all levels of the organisation so that ING Group’s financial strength is safeguarded.
The mission of ING Group’s risk management function is to build a sustainable competitive advantage by fully integrating risk management into daily business activities and strategic planning. This mission is fully embedded in ING Group’s business processes.
The following principles support this objective: Products and portfolios are structured, underwritten, priced, approved and managed appropriately and compliance with internal •and external rules and guidelines is monitored;ING Group’s risk profile is transparent, has ’no surprises’, and is consistent with delegated authorities;•Delegated authorities are consistent with the overall Group strategy and risk appetite;•Transparent communication to internal and external stakeholders on risk management and value creation.•
RISK GOVERNANCEING’s risk management framework is based on the ‘three lines of defence’ concept which ensures that risk is managed in line with the risk appetite as defined by the Executive Board and is cascaded throughout the Group. This concept provides a clear allocation of responsibilities for the ownership and management of risk, to avoid overlaps and/or gaps in risk governance. Business line management and the regional and local managers have primary responsibility for the day-to-day management of risk and form the first line of defence. The risk management function, both at corporate and regional/local level, belongs to the second line of defence and has the primary responsibility to align risk taking with strategic planning e.g. in limit setting. Risk managers in the business lines have a functional reporting line to the Corporate Risk General Managers described below. The internal audit function provides an ongoing independent (i.e. outside of the risk organisation) and objective assessment of the effectiveness of internal controls, including financial and operational risk management and forms the third line of defence.
Group Risk Management FunctionThe risk management function is embedded in all levels of the ING Group organisation.
Chief Risk OfficerThe Chief Risk Officer (CRO), who is a member of the Executive Board, bears primary overall responsibility for the Group risk management function. The CRO is responsible for the management and control of risk on a consolidated level to ensure that ING’s group risk profile is consistent with its financial resources and the risk appetite defined by the Executive Board. The CRO is also responsible for establishing and maintaining a robust organisational basis for the management of risk throughout the ING organisation.
Group Risk OrganisationThe organisation chart below illustrates the functional reporting lines within the ING Group risk organisation.
The risk organisation is structured independently from the business lines and is organised through five risk departments:Corporate Credit Risk Management (CCRM) is responsible for the credit risk management of ING Bank and ING Insurance;• Corporate Market Risk Management (CMRM) is responsible for the market risk management and liquidity risk management of ING Bank;• Corporate Insurance Risk Management (CIRM) is responsible for the insurance, market and liquidity risk management of ING Insurance;•Corporate Operational Risk Management (CORM) is responsible for the operational risk management of ING Bank and ING Insurance;• Group Compliance Risk Management (GCRM) supports and advises management in fulfilling its compliance responsibilities, advises •employees on their (personal) compliance obligations and oversees and reports on the embedding of Compliance policies in both ING Bank and ING Insurance.
Chief Risk Officer
Corporate InsuranceRisk Management
(Insurance)
Corporate Market Risk Management
(Bank)
Corporate Credit Risk Management(Bank & Insurance)
Group ComplianceRisk Management(Bank & Insurance)
Corporate OperationalRisk Management(Bank & Insurance)
183ING Group Annual Report 2008

2.1 Consolidated annual accounts
The heads of these departments (Corporate Risk General Managers) report to the CRO and bear direct responsibility for risk (mitigating) decisions at the Group level. The Corporate Risk General Managers and the CRO are responsible for the harmonisation and standardisation of risk management practices.
In addition two staff departments report to the CRO: The Risk Integration and Analytics department is responsible for inter-risk aggregation processes and for providing group-wide risk •information to the CRO and Executive Board; The Model Validation department reviews the performance of all material risk models applied within ING. This department carries •out periodic model validations of all material risk models used by ING. To ensure independence from the business and the other risk departments, the head of this department reports directly to the CRO.
The risk management function assists with the formulation of risk appetite, strategies, policies and limits. It also provides a review, oversight and support function throughout the Group on risk related issues.
Group Risk CommitteesThe Group risk committees described below are also part of the second line of defence. They act within the overall risk policy and delegated authorities granted by the Executive Board and have an advisory role to the CRO. To ensure a close link between the business lines and the risk management function, the business line heads and the respective General Managers Corporate Risk are represented on each committee (except for the ORRC were the business is not represented).
ING Group Credit Committee – Policy (GCCP): Discusses and approves policies, methodologies and procedures related to credit, •country and reputation risks within ING Group. The GCCP meets on a monthly basis; ING Group Credit Committee – Transaction Approval (GCCTA): Discusses and approves transactions which entail taking credit risk •(including issuer investment risk). The GCCTA meets two times a week; ING Group Investment Committee (GIC): Discusses and approves investment proposals for ING Real Estate. The GIC meets on a •monthly basis; Asset and Liability Committee ING Bank (ALCO Bank): Discusses and approves the overall risk profile of all ING Bank’s market risks that •occur in its Wholesale Banking, Retail Banking and ING Direct activities. ALCO Bank defines the policy regarding funding, liquidity, interest rate mismatch and solvency for ING Bank. ALCO Bank meets on a monthly basis; Asset and Liability Committee ING Insurance (ALCO Insurance): Discusses and approves all risks associated with ING’s Insurance •activities. This includes volatility (affecting earnings and value), exposure (required capital and market risk) and insurance risks. ALCO Insurance meets six times a year; Operational and Residual Risk Committee (ORRC): Discuss and approve issues related to Methods, Models and Parameters related to •Operational risk, Business risk in Banking, inter-risk diversification and consistency across risk types and businesses. The committee meets at least twice a year.
In addition, the Finance and Risk Committee (F&RC) is a platform for the CRO and the CFO, along with their respective direct reports, to discuss and decide on issues that relate to both the finance and risk domains. F&RC meets every two weeks.
ING Group uses risk assessment and risk measurement to guide decision making. As a result, the quality of risk models is important. The governance process for approval of risk models, methods and parameters ensures business and regulatory requirements, via a clear assignment of responsibility and accountability.
Board level risk oversightAt the highest level of the ING organisation, there are board committees which oversee risk taking, and have ultimate approval authority. ING Group has a two-tier board structure consisting of the Executive Board and the Supervisory Board; both tiers play an important role in managing and monitoring the risk management framework.
The Executive Board is responsible for managing risks associated with the activities of ING Group. Its responsibilities include ensuring •that internal risk management and control systems are effective and that ING Group complies with relevant legislation and regulations. On a regular basis, the Executive Board reports on these issues and discusses the internal risk management and control systems with the Supervisory Board. On a quarterly basis, the Executive Board reports on the Group’s risk profile versus its risk appetite to the Audit Committee, explaining changes in the risk profile. The Audit Committee is a sub-committee of the Supervisory Board. It assists the Supervisory Board in reviewing and assessing ING Group’s •major risk exposures and the operation of internal risk management and control systems. Audit Committee membership is such that specific business know-how and expertise relating to the activities of ING is available. The CRO attends the Audit Committee meetings.
The CRO makes sure that the board committees are well informed and understand ING Group’s risk position at all times. Every quarter the CRO reports to the board committees on ING’s risk appetite levels and on ING Group’s risk profile. In addition the CRO briefs the board committees on developments in internal and external risk related issues and makes sure the board committees understand specific risk concepts.
Risk management (continued)
ING Group Annual Report 2008
184

ING has integrated risk management into the annual strategic planning process. This process aligns strategic goals, business strategies and resources throughout ING Group. The process is such that the Executive Board issues a Planning Letter which provides the organisation with the corporate strategic direction, and addresses key risk issues. Based on this Planning Letter the business lines and business units develop their business plans which align with the Group’s strategic direction. The process includes a qualitative and quantitative assessment of the risks involved in the plans. It is part of the process to explicitly discuss strategic limits and group risk appetite levels. At each level, strategies and metrics are identified to measure success in achieving objectives and to assure adherence to the strategic plan. Based on the business unit and line of business plans, the Executive Board formulates the Group Strategic Plan which is submitted to the Supervisory Board for approval.
Group risk policiesING has a framework of risk management policies, procedures and standards in place to create consistency throughout the organisation, and to define minimum requirements that are binding on all business units. The governance framework of the business units aligns with the Group level framework and meets local (regulatory) requirements. Senior Management is responsible to ensure policies, procedures and standards are implemented and adhered to. Employees globally have access to the Group’s governance framework through an internal website. Policies, procedures and standards are regularly reviewed and updated via the relevant risk committees to reflect changes in markets, products and emerging best practices.
ING GROUP RISK PROFILEING Group uses an integrated risk management approach. The risk dashboard captures the risks in all Banking and Insurance business lines in terms of Earnings at Risk and Capital at Risk, and shows the impact of diversification across the Group. The Executive Board uses the risk dashboard to monitor and manage the actual risk profile in relation to the Group risk appetite. It enables the Executive Board to identify possible risk concentrations and to support strategic decision making. The risk dashboard is reported to the Executive Board on a quarterly basis and is subsequently presented to the Audit Committee.
ING Group’s risk appetite is defined by the Executive Board as part of the strategic planning process. Strict boundaries are established with regard to acceptable risk types and levels. ING’s ‘three lines of defence’ governance framework ensures that risk is managed in line with the risk appetite as defined by the EB. Risk appetite is cascaded throughout the Group, thereby safeguarding controlled risk taking. The role of the business lines is to maximise the value within established risk boundaries. Each quarter, the Executive Board monitors that the financial and non-financial risks are within the boundaries of the risk appetite as set in the strategic planning process.
ING Group risk metricsThe Group’s risk appetite is captured in three different metrics which are disclosed below:
Earnings at Risk; the potential reduction in IFRS earnings over the next year relative to expected IFRS earnings, during a moderate •(i.e. ‘1 in 10’) stress scenario. Maintaining a high quality of earnings helps ING to safeguard against being downgraded by the rating agencies; Capital at Risk; the potential reduction of the current net asset value (based on fair values) over the next year relative to the expected •value during a moderate (i.e. ‘1 in 10’) stress scenario; Economic Capital; the amount of capital that is required to absorb unexpected losses in times of severe stress given ING Group’s ‘AA’ •target rating.
ING Group’s risk metrics cover the most important aspects in terms of different severities (moderate vs. extreme stress) and performance measures where risk can materialise (value vs. earnings). The Earnings and Capital at Risk metrics are important metrics from a shareholder point of view since they provide insight in the level of risk ING takes under ‘moderate stress’ market expectations to generate return. From the debt and policy holder point of view, Economic Capital is more important since it is the buffer against extreme losses.
The main differences and similarities between the risk metrics are illustrated below;
Earnings at Risk Capital at Risk Economic CapitalConfidence interval 90% 90% 99.95% (based on AA target rating)Stressed metric IFRS earnings Value ValueDeviation from Expected IFRS earnings
(over next year)Current net asset value based on fair values (over next year)
Current net asset value based on fair values (over next year)
Interpretation Potential IFRS earnings reduction against expectation during a ‘moderate’ stress scenario (i.e. 1 in 10)
Potential value reduction of net value during a ‘moderate’ stress scenario (i.e. 1 in 10)
Potential value reduction of net value during an ‘extreme’ stress scenario (i.e. 1 in 2000)
When interpreting the Earnings and Capital at Risk metrics it is important to note that these are not loss estimates of a specific adverse scenario. Further, the metrics do not take into account discretionary management intervention in a specific crisis situation, and are based on instantaneous shock scenarios.
185ING Group Annual Report 2008
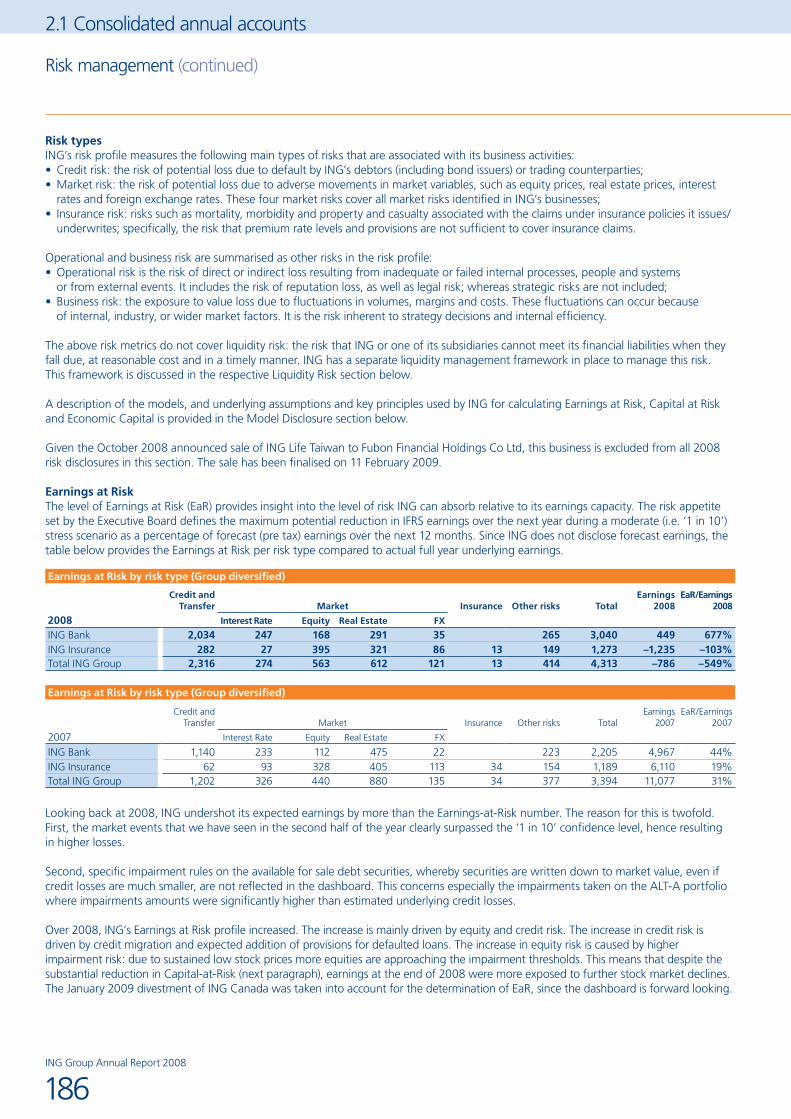
2.1 Consolidated annual accounts
Risk typesING’s risk profile measures the following main types of risks that are associated with its business activities:
Credit risk: the risk of potential loss due to default by ING’s debtors (including bond issuers) or trading counterparties;• Market risk: the risk of potential loss due to adverse movements in market variables, such as equity prices, real estate prices, interest •rates and foreign exchange rates. These four market risks cover all market risks identified in ING’s businesses; Insurance risk: risks such as mortality, morbidity and property and casualty associated with the claims under insurance policies it issues/•underwrites; specifically, the risk that premium rate levels and provisions are not sufficient to cover insurance claims.
Operational and business risk are summarised as other risks in the risk profile: Operational risk is the risk of direct or indirect loss resulting from inadequate or failed internal processes, people and systems •or from external events. It includes the risk of reputation loss, as well as legal risk; whereas strategic risks are not included; Business risk: the exposure to value loss due to fluctuations in volumes, margins and costs. These fluctuations can occur because •of internal, industry, or wider market factors. It is the risk inherent to strategy decisions and internal efficiency.
The above risk metrics do not cover liquidity risk: the risk that ING or one of its subsidiaries cannot meet its financial liabilities when they fall due, at reasonable cost and in a timely manner. ING has a separate liquidity management framework in place to manage this risk. This framework is discussed in the respective Liquidity Risk section below.
A description of the models, and underlying assumptions and key principles used by ING for calculating Earnings at Risk, Capital at Risk and Economic Capital is provided in the Model Disclosure section below.
Given the October 2008 announced sale of ING Life Taiwan to Fubon Financial Holdings Co Ltd, this business is excluded from all 2008 risk disclosures in this section. The sale has been finalised on 11 February 2009.
Earnings at RiskThe level of Earnings at Risk (EaR) provides insight into the level of risk ING can absorb relative to its earnings capacity. The risk appetite set by the Executive Board defines the maximum potential reduction in IFRS earnings over the next year during a moderate (i.e. ‘1 in 10’) stress scenario as a percentage of forecast (pre tax) earnings over the next 12 months. Since ING does not disclose forecast earnings, the table below provides the Earnings at Risk per risk type compared to actual full year underlying earnings.
Earnings at Risk by risk type (Group diversified)
Credit and Transfer Market Insurance Other risks Total
Earnings 2008
EaR/Earnings 2008
2008 Interest Rate Equity Real Estate FX
ING Bank 2,034 247 168 291 35 265 3,040 449 677%ING Insurance 282 27 395 321 86 13 149 1,273 –1,235 –103%Total ING Group 2,316 274 563 612 121 13 414 4,313 –786 –549%
Earnings at Risk by risk type (Group diversified)
Credit and Transfer Market Insurance Other risks Total
Earnings 2007
EaR/Earnings 2007
2007 Interest Rate Equity Real Estate FX
ING Bank 1,140 233 112 475 22 223 2,205 4,967 44%ING Insurance 62 93 328 405 113 34 154 1,189 6,110 19%Total ING Group 1,202 326 440 880 135 34 377 3,394 11,077 31%
Looking back at 2008, ING undershot its expected earnings by more than the Earnings-at-Risk number. The reason for this is twofold. First, the market events that we have seen in the second half of the year clearly surpassed the ‘1 in 10’ confidence level, hence resulting in higher losses.
Second, specific impairment rules on the available for sale debt securities, whereby securities are written down to market value, even if credit losses are much smaller, are not reflected in the dashboard. This concerns especially the impairments taken on the ALT-A portfolio where impairments amounts were significantly higher than estimated underlying credit losses.
Over 2008, ING’s Earnings at Risk profile increased. The increase is mainly driven by equity and credit risk. The increase in credit risk is driven by credit migration and expected addition of provisions for defaulted loans. The increase in equity risk is caused by higher impairment risk: due to sustained low stock prices more equities are approaching the impairment thresholds. This means that despite the substantial reduction in Capital-at-Risk (next paragraph), earnings at the end of 2008 were more exposed to further stock market declines.The January 2009 divestment of ING Canada was taken into account for the determination of EaR, since the dashboard is forward looking.
Risk management (continued)
ING Group Annual Report 2008
186

Capital at RiskThe level of Capital at Risk (CaR) measured against ING’s financial position provides understanding as to whether ING can maintain a sound financial position under a ‘moderate’ (i.e. 1 in 10) stress scenario. The risk appetite set by the Executive Board defines the maximum potential value reduction over the next year during a (non extreme) stress scenario as a percentage of Available Financial Resources (AFR) (the definition of AFR is provided in the Capital Management section below).The tables below show the Capital at Risk per risk type.
Capital at Risk by risk type (Group diversified)
Credit and Transfer Market Insurance
Other risks Total
Available financial
resources
CaR/Available financial
resources
2008 Interest Rate Equity Real Estate FX
ING Bank 2,145 1,110 405 504 164 213 4,541 34,849 13%ING Insurance 534 1,464 893 308 240 70 173 3,682 14,456 25%Total ING Group 2,679 2,574 1,298 812 404 70 386 8,223 42,135(1) 20%(1) Total ING Group is comprised of ING Bank and ING Insurance, excluding core debt of EUR 7,170 million within ING Group.
Capital at Risk by risk type (Group diversified)
Credit and Transfer Market Insurance
Otherrisks Total
Available financial
resources
CaR/Available financial
resources
2007 Interest Rate Equity Real Estate FX
ING Bank 1,282 716 675 505 81 169 3,428 31,733 11%ING Insurance 307 3,365 2,439 378 169 273 172 7,103 22,710 31%Total ING Group 1,589 4,081 3,114 883 250 273 341 10,531 49,715(1) 21%(1) Total ING Group is comprised of ING Bank and ING Insurance, excluding core debt of EUR 4,728 million within ING Group.
The Capital at Risk figure substantially decreased over 2008 as ING initiated several de-risking initiatives. Group CaR decreased because increased credit risk was more than offset by lower interest rate and equity risk.
In 2007 the Capital at Risk figure was dominated by ING Insurance, mainly due to interest rate risk related to long-term client guarantees and equity risk. Although these risks are still dominant for ING Insurance in the overall ING risk profile these risks have decreased significantly, while increased credit risk became the largest contributor to CaR during 2008.
The credit and transfer risk increase is mainly due to downgrades and lower initial ratings for unrated facilities. These increases will be only partially offset by the risk reducing impact of the Illiquid Assets Back-up Facility through which the Dutch State will become the economic owner of 80% of the Alt-A Portfolio. This transaction is expected to close in the first quarter of 2009 subject to final documentation and regulatory approval. The effect of this deal has already been included since the dashboard is forward looking.
Total CaR for interest rate risk decreased. The large decrease in interest rate CaR for ING Insurance is primarily caused by the sale of ING Life Taiwan, which is also the main reason for the decrease in Insurance risk. The ING Bank interest rate risk increase is primarily caused by increased volatility in the market.
The decrease in equity risk is the result of the declining equity markets and de-risking activities and hedges put in place near the end of 2008.
Capital at Risk and Earnings at Risk by line of business (Group diversified)
Earnings at Risk Capital at Risk2008 2007 2008 2007
Wholesale Banking 1,937 1,551 2,321 1,634Retail Banking 581 438 1,055 939ING Direct 453 158 893 566Corporate Line Bank 69 58 272 289ING Bank 3,040 2,205 4,541 3,428
Insurance Americas 571 430 1,855 2,022Insurance Asia/Pacific 137 183 502 2,258Insurance Europe 442 469 910 2,004Corporate Line Insurance 122 107 415 819ING Insurance 1,273 1,189 3,682 7,103
ING Group 4,313 3,394 8,223 10,531
187ING Group Annual Report 2008

2.1 Consolidated annual accounts
Earnings at Risk increased considerably on group level with the rise of ING Bank and ING Insurance similar in magnitude. For ING Bank this was mainly caused by credit migration and clearly visible in ING Direct and Wholesale Banking. For ING Insurance the EaR impact is caused by higher impairment risk for listed equity and therefore most notable in the corporate line.
Overall Capital at Risk decreased with a significant decrease in ING Insurance and an increase in ING Bank. Credit migration explains most of the increase in CaR Wholesale Banking and in ING Direct.
CaR Insurance Americas goes down slightly due to a significant decrease in equity risk (due to lower exposures and de-risking activities).
The sharp decrease in Insurance Asia/Pacific CaR was almost completely the result of the decrease in interest rate risk due to the sale of ING Life Taiwan. CaR Insurance Europe decreased due to a decrease in equity risk resulting from lower exposures and hedging activities.
Economic Capital ING GroupSince 1999 ING Bank has been disclosing Economic Capital information externally, whereas ING Insurance disclosed Economic Capital information for the first time in 2007. Although the fundamental principles are the same, ING Bank and ING Insurance Economic Capital information is currently calculated based on (partly) separately developed models (see Model Disclosure section below) that may differ in the calculation and aggregation approach due to different market practices and standards used in the banking and insurance industries.
ING’s Group Economic Capital is determined by applying one common aggregation approach to bank and insurance. ING Group Economic Capital is 15% lower than the sum of the parts (bank and insurance). Three different factors contribute to this consolidation benefit:1. offsetting positions between bank and insurance: especially on the interest rate risk side, where the long duration assets of the bank
are offset by the long duration liabilities of the Insurance2. diversification between bank and insurance asset classes based on observed correlations: e.g. less than 1 correlation between
insurance equity positions and bank real estate positions3. diversification between bank and insurance risk drivers based on expert opinion correlations: e.g. less than perfect correlation between
operational risk incidents at the bank and interest rate risk in insurance
ING has calculated this consolidation benefit to be 15% (2007: 15%).The table below shows the contribution of the different risk drivers to the consolidation benefit:
Contribution to consolidated Benefit
Interest Rate risk 60%Equity risk 7%Foreign Exchange risk 1%Real Estate risk 4%Credit risk 3%Other risks* 25%Total 100%
* Other risks includes operational risk as well as business risk.
The table below shows the build up of ING Group Economic Capital. Please refer to the bank and insurance paragraphs below for further explanation on the respective EC numbers.
Group Economic Capital (in EUR billion)
2008 2007*
ING Bank 22.4 18.7ING Insurance 13.7 23.2Consolidated Benefit –5.4 –5.9Total ING Group Economic Capital 30.7 36.0
* In 2007 a group add-on of EUR 0.8 billion related to investments backing Bank Equity was added at Group Level and is now included in Bank EC. The remaining EUR 0.2 billion add-on in 2007 is no longer applicable in 2008 (for comparison it was included in the diversification benefit).
The potential risk capital impact for ING Group of the ING employee pension liability is currently not included in the aggregated group risk metrics. The standalone Economic Capital impact for ING employee pension liabilities is calculated separately, and from a capital management perspective there is currently no need to reserve any additional capital for ING pension liabilities.
Risk management (continued)
ING Group Annual Report 2008
188

Risk measurement ING Bank and ING InsuranceThe overall ING Group risk appetite is translated into specific limits which are cascaded down into the organisation, e.g.
Credit risk limits for bank and insurance business;•Market Value at Risk limits for the insurance business;•ALM/Value at Risk limits for bank operations;•Mortality and concentration limits for insurance operations.•
The following risk disclosures provide more insight into how the risk measures used by the risk organisation are linked to the Group risk dashboard and Economic Capital.
ING BANKING Bank is engaged in selling a broad range of products. The financial risks that arise from selling these products are managed by the Corporate Credit and Market Risk departments. Operational risks are managed by the Corporate Operational Risk department.
ING BANK RISK PROFILEEconomic Capital ING BankOne of the main risk management tools for ING Bank is Economic Capital which is used to determine the amount of capital that a transaction or business unit requires to support the economic risks it faces. ING Bank implemented Economic Capital for internal use in 1998. Since 1999 ING Bank has been disclosing Economic Capital information externally. The tables below provide ING Bank’s Economic Capital by risk type and business line. Figures shown reflect all diversification effects within ING Bank, including risk reduction between the risk categories. Diversification effects that arise as a result of combining ING Bank and ING Insurance activities are not taken into account. Business risk is included in the other risks category to cover unexpected losses that may arise as a result of changes in volumes, margins and costs.
The ING Bank Economic Capital model is described in more detail in the Model Disclosure section.
The following table provides the Economic Capital break down by risk category including diversification benefits proportionally allocated to the risk types:
Economic Capital (Bank diversified only) by risk category
2008 2007
Credit risk (including Transfer risk) 8,686 7,503Market risk 10,349 7,407Other risks (1) 3,372 3,017Total banking operations 22,407 17,927(1) Other risks includes operational risk as well as business risk.
The overall increase in Economic Capital is mainly due to the inclusion of the core equity investments in market risk Economic Capital Bank, whereas previously it was taken as an add-on at Group level. Furthermore the increased Economic Capital can be explained by credit migrations, increased market volatility and model enhancements.
The following table provides the Economic Capital break down by business line including diversification benefits proportionally allocated to the risk types:
Economic Capital (Bank diversified only) by Line of Business
2008 2007
Wholesale Banking 9,849 8,646Retail Banking 6,169 5,360ING Direct 4,050 2,831Corporate Line Bank (1) 2,339 1,090Total banking operations 22,407 17,927(1) Corporate Line includes funding activities at ING Bank level, internal transactions between business units and the Corporate Line, and is managed by
Capital Management.
The growth of the Economic Capital figure for the Wholesale Banking business line can be mainly explained by the credit migrations, market volatility and model enhancements. The Retail Banking Economic Capital figure increased predominantly due to the finalisation of the acquisition of Oyak Bank in the risk systems. The material increase in ING Direct is due to credit migration, model enhancements and increased market volatility.
189ING Group Annual Report 2008

2.1 Consolidated annual accounts
The increase of the Economic Capital allocated to the Corporate Line can be explained by the inclusion of the core equity investments in Economic Capital Bank, previously taken as an add-on at Group level.
ING BANK – CREDIT RISKSCredit risk is the risk of loss from default by debtors (including bond issuers) or trading counterparties. Credit risks are split into five principal risk categories: a) lending (including guarantees and letters of credit); b) investments; c) pre-settlement (derivatives, securities financing and foreign exchange trades); d) money markets and e) settlement. Corporate Credit Risk Management (CCRM) is responsible for the measurement and management of credit risk incurred by all ING Group entities, including country-related risks. CCRM is organised along the three business lines of ING Bank (e.g. Retail Banking, Wholesale Banking and ING Direct) and ING Insurance. The CCRM General Manager is functionally responsible for the global network of credit risk staff, while the heads of the credit risk management functions for the business lines report directly to him.Credit risk management is supported by dedicated credit risk information systems and internal credit risk measurement methodologies for debtors, issuers and counterparties. CCRM creates consistency throughout the credit risk organisation by providing common credit risk policies, methodologies, manuals and tools across the Group.
ING Group’s credit policy is to maintain an internationally diversified loan and bond portfolio, while avoiding large risk concentrations. The emphasis is on managing business developments within the business lines by means of top-down concentration limits for countries, individual borrowers and borrower groups. The aim within the banking sector is to expand relationship-banking activities, while maintaining stringent internal risk/return guidelines and controls.
Credit analysis is risk/reward-oriented in that the level of credit analysis is a function of the risk amount, tenor, structure (e.g. covers received) of the facility, and the risks entered into. For credit risk management purposes, financial obligations are classified into lending, investments, pre-settlement, money market and settlement. ING Bank applies a Risk Adjusted Return on Capital framework (RAROC) which measures the performance of different activities and links to shareholder value creation. The use of RAROC increases focus on risks versus rewards in the decision making process, and consequently stimulates the use of scarce capital in the most efficient way. More sophisticated RAROC-based tools are used internally to ensure a proper balance of risk and reward within the portfolio and concentration parameters. ING’s credit analysts make use of publicly available information in combination with in-house analysis based on information provided by the customer, peer group comparisons, industry comparisons and other quantitative techniques.
Lending riskLending risk arises when ING grants a loan to a customer, or issues guarantees on behalf of a customer. This is the most common risk category, and includes term loans, mortgages, revolving credits, overdrafts, guarantees, letters of credit, etc. The risk is measured at the notional amount of the financial obligation that the customer has to repay to ING, excluding any accrued and unpaid interest, discount/premium amortisations or impairments.
Investment riskInvestment risk is the credit default and risk rating migration risk that is associated with ING’s investments in bonds, commercial paper, securitisations, and other similar publicly traded securities. Investment risk arises when ING purchases a (synthetic) bond with the intent to hold the bond for a longer period of time (generally through maturity). Bonds that are purchased with the intent to re-sell in a short period of time are considered to be trading risks, which are measured and monitored by the Corporate Market Risk Management department. For credit risk purposes, Investment risk is measured at original cost (purchase price) less any prepayments or amortisations and excluding any accrued and unpaid interest or the effects of any impairment.
Money market riskMoney market risk arises when ING places short term deposits with a counterparty in order to manage excess liquidity, as such, money market deposits tend to be short term in nature (1-7 days is common). In the event of a counterparty default, ING may lose the deposit placed. Money market risk is therefore measured simply as the notional value of the deposit, excluding any accrued and unpaid interest or the effect of any impairment.
Pre-settlement riskPre-settlement risk arises when a counterparty defaults on a transaction before settlement and ING has to replace the contract by a trade with another counterparty at the then prevailing (possibly unfavourable) market price. The pre-settlement risk (potential or expected risk) is the cost of ING replacing a trade in the market. This credit risk category is associated with dealing room products such as options, swaps, and securities financing transactions. Where there is a mutual exchange of value, the amount of credit risk outstanding is generally based on the replacement value (mark-to-market) plus a potential future volatility concept, using an historical 7 year time horizon and a 99% confidence level.
Settlement riskSettlement risk arises when there is an exchange of value (funds, instruments or commodities) for the same or different value dates and receipt is not verified or expected until ING has paid or delivered its side of the trade. The risk is that ING delivers, but does not receive delivery from the counterparty. Settlement risk can most commonly be contained and reduced by entering into transactions with delivery-versus-payment (DVP) settlement methods, as is common with most clearing houses, or settlement netting agreements.
Risk management (continued)
ING Group Annual Report 2008
190

For those transactions where DVP settlement is not possible, ING establishes settlement limits through the credit approval process. Settlement risk is then monitored and managed by the credit risk management units. Risk is further mitigated by operational procedures requiring trade confirmations to counterparties with all transaction details, and by entering into internationally accepted documentation, such as International Swaps and Derivatives Association (ISDA) Master Agreements for derivative transactions. Additionally, ING regularly participates in projects with other financial institutions to improve and develop new clearing systems and clearing mechanisms to further reduce the level of settlement risk. Due to the very short term nature of settlement exposure (daily), settlement risks do not attract economic or regulatory capital and are excluded from risk reporting disclosures.
Country riskCountry risk is the risk specifically attributable to events in a specific country (or group of countries). It can occur within each of the five above described risk categories. All transactions and trading positions generated by ING include country risk which is further divided into economic and transfer risk. Economic risk is the concentration risk relating to any event in the risk country which may affect transactions and any other exposure in that country, regardless of the currency. Transfer risk is the risk incurred through the inability of ING or its counterparties to meet their respective foreign currency obligations due to a specific country event.
In countries where ING is active, the relevant country’s risk profile is regularly evaluated, resulting in a country rating. Country limits are based on this rating and ING’s risk appetite. Exposures derived from lending, investment pre-settlement and money market activities are then measured and reported against these country limits on a daily basis. Country risk limits are assigned for transfer risk mainly for emerging markets.
Determination of credit risk outstandingsFigures associated with Money Market and Lending activities are generally the nominal amounts, while amounts associated with Investment activities are based on the original amount invested less repayments. Off-Balance Sheet exposures include the letters of credits and guarantees, which are associated with the Lending Risk Category. Additionally, Off-Balance Sheet exposures include a portion of the unused limits, associated with the statistically expected use of the unused portion of the limit between the moment of measurement and the theoretical moment of statistical default. Collectively, these amounts are called ‘credit risk oustandings’.Exposures associated with Securitisations (Asset Backed Financing, Commercial/Residential Mortgage Backed Securities and Covered Bonds) are shown separately. These amounts also relate to the amount invested prior to any impairment activity or mark-to-market adjustments. This amount is also considered to be ‘outstandings’.
Collateral policiesAs with all financial institutions and banks in particular, ING is in the business of taking credit risks in an informed and measured fashion. As such, the creditworthiness of our customers, trading partners and investments is continually evaluated for their ability to meet their financial obligations to ING. During the assessment process of creating new loans, trading limits, or making investments, as well as reviewing existing loans trading positions and investments, ING determines the amount and type of collateral, if any, that a customer may be required to pledge to ING. Generally, the lower the perceived creditworthiness of a borrower or financial counterparty, the more collateral the customer or counterparty will have to provide. Within counterparty trading activities, ING actively enters into various legal arrangements whereby ING and/or counterparties may have to post collateral to one another to cover market fluctuations of their relative positions. Laws in various jurisdictions also affect the type and amount of collateral that ING can receive or pledge. Additionally, ING will sometimes enter into credit default swaps, and other similar instruments, in order to reduce the perceived credit risk on a given borrower or portfolio. The type of collateral which is held as security is determined by the structure of the loan or position. Consequently, since ING’s portfolio is diversified, the profile of collateral it receives is also diversified in nature and does not reflect any particular collateral type more than others.
ING BANK CREDIT RISK PROFILEING Bank’s credit exposure is mainly related to traditional lending to individuals and businesses followed by investments in bonds and other securitised assets. Loans to individuals are mainly mortgage loans secured by residential property. Loans (including guarantees issued) to businesses are often collateralised, but can be unsecured based on internal analysis of the borrowers’ creditworthiness. Bonds in the investment portfolio are generally unsecured. Securitised assets such as Mortgage Backed Securities (MBS) and Asset Backed Securities (ABS) are secured by the pro rata portion of the underlying diversified pool of assets (commercial or residential mortgages, car loans and other assets) held by the issuer of the security. The last major area of credit risk involves pre-settlement credit exposures which arise from trading activities, including derivatives, repurchase transactions and securities lending/borrowing and foreign exchange transactions.
For the banking operations, ING uses various market pricing and measurement techniques to determine the amount of credit risk on pre-settlement activities. These techniques estimate ING’s potential future exposure on individual and portfolios of trades. Master agreements and collateral agreements are frequently entered into to reduce these credit risks.
191ING Group Annual Report 2008

2.1 Consolidated annual accounts
Problem loansRenegotiated LoansING’s credit restructuring activities focus on managing the client relationships, improving the borrower’s risk profile, maximising collection opportunities and, if possible, avoiding foreclosure or repossession. These activities are pro-actively pursued and primarily relate to Wholesale and Small and Medium Enterprise (SME) borrowers (‘Business’), which are not yet in default. Common actions taken include, but are not limited to, revising or extending repayment arrangements, assisting in financial reorganisation and/or turnaround management plans, deferring foreclosure, modifying loan conditions and deferring certain payments pending a change in circumstances. For consumer and residential mortgage loans (‘Consumer’) the approach is more portfolio oriented.
Restructuring activities for Business borrowers normally start with a watch list indication. Borrowers on the watch list maintain their rating (1-19). A watch list indication may develop into a restructuring status (15-19) or even a recovery status (20-22). Most borrowers with a watch list indication return to a regular status. For Consumer clients the watch list of ‘potential problem loan’ status is usually caused by payment arrears (more than 1 month) which are subsequently reflected in the risk rating of 18-19 (or comparable status based on an increased probability of default). Following restructuring relationship management is either transferred to the regular commercial banking departments or terminated.ING’s renegotiated loans that would otherwise be past due or impaired are reflected below:
ING Bank renegotiated loans that would otherwise be past due or impaired (outstandings)
2008 2007
From restructuring (18-19) to regular (1-17) status 1,183 1,414From recovery (20-22) to regular or restructuring status (1-19) 3,556 3,123Total of renegotiated loans 4,739 4,537
This total is broken down by Business and Consumer clients as follows:
Renegotiated business loans that would otherwise be past due or impaired (outstandings)
2008 2007
From restructuring (18-19) to regular (1-17) status 1,183 1,414From recovery (20-22) to regular or restructuring status (1-19) 978 1,170Total of renegotiated Business loans 2,161 2,584
For Business clients, ING has taken a proactive approach to restructuring loans that may have otherwise experienced financial difficulties, which has led to an increase in the level of restructuring loans returning to a regular status. Restructuring is generally a time consuming process that can take several years. Through early 2008, ING’s inventory of problem loans and restructuring clients declined at a steady pace which is then reflected in the level of restructured Business Loans in 2008.
Renegotiated consumer and mortgage loans that would otherwise be past due or impaired (outstandings)
2008 2007
From recovery (20-22) to regular or restructuring status (1-19) 2,578 1,953
Total of renegotiated consumer and mortgages loans (‘Consumer’) 2,578 1,953
The increase in the total amount of renegotiated consumer and mortgage loans is a reflection of the growth of the portfolio and of ING’s proactive (portfolio) management approach involving the automation of reminder and warning letters to Consumer borrowers who may otherwise be facing financial difficulties. Consumer borrowers do not have a restructuring status.
Past-due obligationsING continually measures its portfolio in terms of payment arrears. Particularly the retail portfolios are closely monitored on a monthly basis to determine if there are any significant changes in the level of arrears. Generally, an obligation is considered ‘past-due’ if a payment of interest or principal is more than one day late. In practice, the first 5-7 days after an obligation becomes past due are considered to be operational in nature for the retail loans and small businesses. After this period, letters are sent to the obligor reminding the obligor of its (past due) payment obligations. If the arrear still exists after 90 days, the obligation is transferred to one of the ‘problem loan’ units. In order to reduce the number of arrears, ING banking units encourage their obligors to set up automatic debits from their (current) accounts to ensure timely payments.
Risk management (continued)
ING Group Annual Report 2008
192

Credit quality: ING Bank portfolio, outstandings
2008 2007
Neither past due nor impaired 817,069 750,049Past due but not impaired (1-90 days) (1) 7,224 5,416Impaired 8,592 5,219
832,885 760,684(1) Based on lending (consumer loans and residential mortgages only).
Aging analysis (past due but not impaired): ING Bank portfolio, outstandings (1,2)
2008 2007
Past due for 1-30 days 5,844 4,709Past due for 31-60 days 1,223 633Past due for 61-90 days 157 74
7,224 5,416(1) Based on lending (consumer loans and residential mortgages only).(2) The amount of past due but not impaired financial assets in respect of non-lending activities was not material.
There is no significant concentration of a particular type of loan structure in the past due or the impaired loan portfolio.
ING tracks past due but not impaired loans most closely for the consumer loan and residential mortgage portfolios. Generally, all loans with past due financial obligations of more than 90 days are automatically reclassified as impaired. For the wholesale lending portfolios and securities obligations, there are generally reasons for declaring a loan impaired prior to being 90 days past due. These include, but are not limited to, ING’s assessment of the customer’s perceived inability to meet its financial obligations, or the customer filing for bankruptcy or bankruptcy protection. In some cases, a material breach of financial covenants will also trigger a reclassification of a loan to the impaired category.
Repossession policyIt is ING’s general policy not to take possession of assets of defaulted debtors. Rather, ING attempts to sell the assets from within the legal entity that has pledged these assets to ING, in accordance with the respective collateral or pledge agreements signed with the obligors. In those cases where ING does take possession of the collateral, ING generally attempts to sell the assets as quickly as possible to prospective buyers. Based on internal assessments to determine the highest and quickest return for ING, the sale of repossessed assets could be the sale of the obligor’s business as a whole (or at least all of its assets), or the assets could be sold piecemeal.
Impaired Loans: ING Bank portfolio, outstandings by economic sector2008 2007
Private individuals 3,718 2,356Construction, Infrastructure and Real Estate 1,770 635General Industries 1,036 270Food, Beverages and Personal Care 397 264Financial Institutions 372 538Automotive 322 200Services 270 219Retail 176 131Other 531 606Total 8,592 5,219
The table above represents the economic sector breakdown of credit risk outstandings (including impaired amounts) for loans and positions that have been classified as problem loans and for which provisions have been made. Against this portfolio, ING holds specific and collective provisions of EUR 1,067 million and EUR 799 million, respectively (2007 EUR 711 million and EUR 680 million respectively), representing the difference between the amortised cost of the portfolio and the estimated recoverable amount discounted at the effective rate of interest.
ProvisionsThe credit portfolio is under constant review. A formal analysis takes place quarterly to determine the provisions for possible bad debts, using a bottom-up approach. Conclusions are discussed by the ING Provisioning Committee (IPC), which advises the Executive Board on specific provisioning levels. ING Bank identifies as impaired loans those loans for which it is probable, based on current information and events that the principal and interest amounts contractually due will not be collected in accordance with the contractual terms of the loan agreements.
193ING Group Annual Report 2008

2.1 Consolidated annual accounts
Provisions: ING Bank portfolio
Wholesale Banking Retail Banking ING Direct Total ING Bank2008 2007 2008 2007 2008 2007 2008 2007
Opening balance 921 1,610 771 741 309 291 2,001 2,642
Changes in the composition of the group 2 2 95 1 2 98Write-offs –260 –593 –399 –302 –69 –57 –728 –952Recoveries 24 30 63 26 4 3 91 59Increase/(decrease) in loan loss provision 596 –115 401 172 283 68 1,280 125Exchange differences –17 –23 –36 5 3 –1 –50 –19Other changes –242 10 270 34 –13 4 15 48Closing balance 1,024 921 1,070 771 517 309 2,611 2,001
After three years of declining annual risk costs, the trend turned in 2008 as a result of the global credit crisis. Other changes includes a provision reclassification of mid-sized corporates and wholesale SME from Wholesale Banking to Retail Banking.
CollateralAs part of its securities financing business, ING entities actively enter into agreements to sell and buy back marketable securities. These transactions can take many legal forms. Repurchase and reverse repurchase agreements, buy/sellback and sell/buyback agreements, and securities borrowing and lending agreements are the most common. The amount of marketable securities that ING held as collateral under these types of agreements was EUR 82.1 billion at 31 December 2008 and EUR 120.2 billion at 31 December 2007. The reduction is commensurate with the overall decline in open securities financing trades at year end 2008 compared to year end 2007. These amounts exclude the cash leg of the respective transactions, as well as any pledges of securities under Tri-Party agreements (as the underlying is not directly pledged to or owned by ING). As a general rule, the marketable securities that have been received under these transactions are eligible to be resold or repledged in other (similar) transactions. ING is obliged to return equivalent securities in such cases.
Risk classes are defined based upon the quality of the exposures in terms of creditworthiness, varying from investment grade to problem grade expressed in S&P equivalents.
Risk classes ING Bank portfolio by business line, as % of total outstandings (1)
Wholesale Banking Retail Banking ING Direct (2) Total ING Bank2008 2007 2008 2007 2008 2007 2008 2007
1 (AAA) 9.3% 5.6% 1.3% 0.2% 27.6% 31.5% 12.6% 12.8%2-4 (AA) 19.3% 26.2% 5.7% 4.8% 17.1% 19.3% 14.5% 18.6%5-7 (A) 16.7% 14.5% 4.0% 3.4% 15.6% 14.4% 12.5% 11.8%8-10 (BBB) 23.2% 21.4% 34.3% 35.3% 22.2% 21.0% 26.2% 24.7%11-13 (BB) 23.3% 24.5% 42.9% 46.0% 14.8% 12.3% 26.6% 25.8%14-16 (B) 5.8% 5.9% 6.9% 6.3% 1.5% 0.8% 4.8% 4.3%17-22 (CCC &
Problem Grade) 2.4% 1.9% 4.9% 4.0% 1.2% 0.7% 2.8% 2.0%100.0% 100.0% 100.0% 100.0% 100.0% 100.0% 100.0% 100.0%
(1) Based on credit risk measurement contained in lending, pre-settlement, money market and investment activities. The ratings reflect probabilities of default and does not take collateral into consideration.
(2) Covered bonds are presented on the basis of the external credit rating of the issuer in question. Covered bond issues generally possess a better external credit rating than the issuer standalone, given structural features of such covered bonds.
Risk classes ING Bank portfolio, as % of total outstandings (1)
Lending Investment Money Market Pre-settlement Total ING Bank2008 2007 2008 2007 2008 2007 2008 2007 2008 2007
1 (AAA) 1.3% 1.9% 49.8% 48.4% 7.1% 5.9% 8.1% 5.4% 12.6% 12.8%2-4 (AA) 4.2% 6.0% 28.8% 35.2% 57.3% 61.4% 48.3% 58.2% 14.5% 18.6%5-7 (A) 10.2% 9.5% 15.0% 13.7% 26.3% 16.8% 21.5% 22.3% 12.5% 11.8%8-10 (BBB) 36.1% 35.7% 3.6% 1.5% 4.8% 8.2% 11.2% 7.1% 26.2% 24.7%11-13 (BB) 37.8% 37.7% 1.5% 0.9% 4.4% 7.1% 7.2% 5.3% 26.6% 25.8%14-16 (B) 6.6% 6.3% 0.6% 0.1% 0.1% 0.3% 2.7% 1.2% 4.8% 4.3%17-22 (CCC &
Problem Grade) 3.8% 2.9% 0.7% 0.2% 0.3% 1.0% 0.5% 2.8% 2.0%100.0% 100.0% 100.0% 100.0% 100.0% 100.0% 100.0% 100.0% 100.0% 100.0%
(1) Based on credit risk measurement contained in lending, pre-settlement, money market and investment activities. The ratings reflect probabilities of default and does not take collateral into consideration.
Risk management (continued)
ING Group Annual Report 2008
194
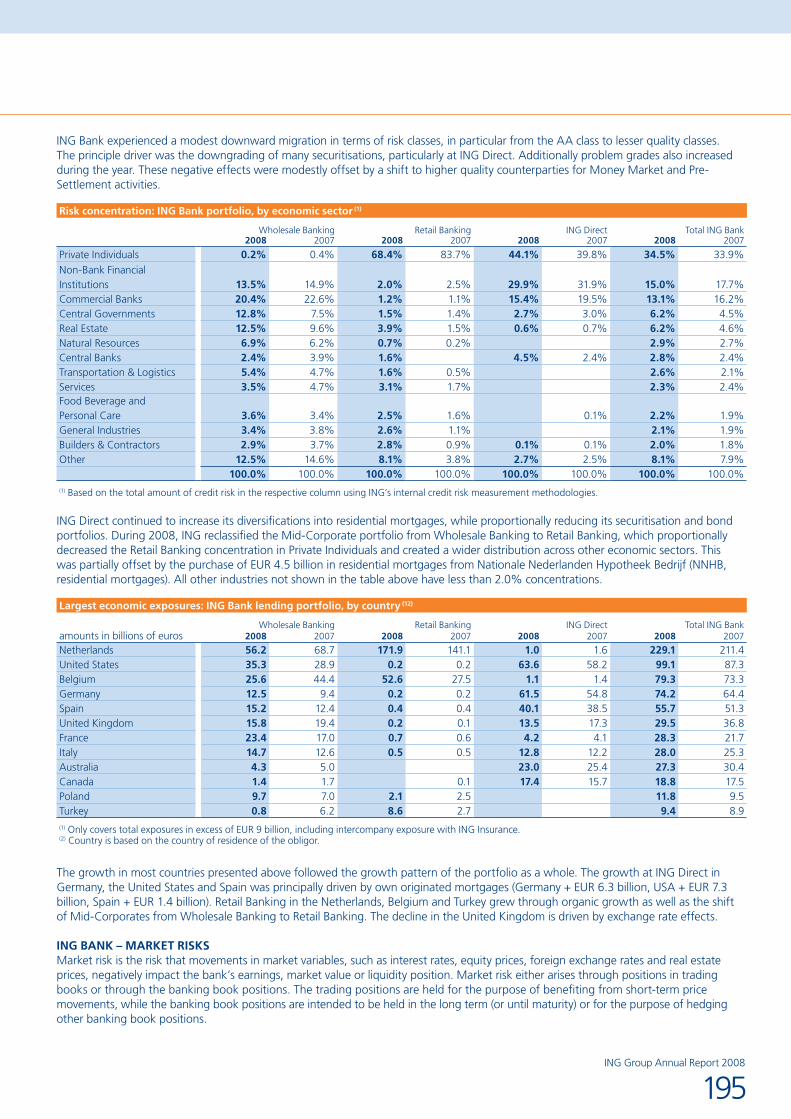
ING Bank experienced a modest downward migration in terms of risk classes, in particular from the AA class to lesser quality classes. The principle driver was the downgrading of many securitisations, particularly at ING Direct. Additionally problem grades also increased during the year. These negative effects were modestly offset by a shift to higher quality counterparties for Money Market and Pre-Settlement activities.
Risk concentration: ING Bank portfolio, by economic sector (1)
Wholesale Banking Retail Banking ING Direct Total ING Bank2008 2007 2008 2007 2008 2007 2008 2007
Private Individuals 0.2% 0.4% 68.4% 83.7% 44.1% 39.8% 34.5% 33.9%Non-Bank Financial Institutions 13.5% 14.9% 2.0% 2.5% 29.9% 31.9% 15.0% 17.7%Commercial Banks 20.4% 22.6% 1.2% 1.1% 15.4% 19.5% 13.1% 16.2%Central Governments 12.8% 7.5% 1.5% 1.4% 2.7% 3.0% 6.2% 4.5%Real Estate 12.5% 9.6% 3.9% 1.5% 0.6% 0.7% 6.2% 4.6%Natural Resources 6.9% 6.2% 0.7% 0.2% 2.9% 2.7%Central Banks 2.4% 3.9% 1.6% 4.5% 2.4% 2.8% 2.4%Transportation & Logistics 5.4% 4.7% 1.6% 0.5% 2.6% 2.1%Services 3.5% 4.7% 3.1% 1.7% 2.3% 2.4%Food Beverage and Personal Care 3.6% 3.4% 2.5% 1.6% 0.1% 2.2% 1.9%General Industries 3.4% 3.8% 2.6% 1.1% 2.1% 1.9%Builders & Contractors 2.9% 3.7% 2.8% 0.9% 0.1% 0.1% 2.0% 1.8%Other 12.5% 14.6% 8.1% 3.8% 2.7% 2.5% 8.1% 7.9%
100.0% 100.0% 100.0% 100.0% 100.0% 100.0% 100.0% 100.0%(1) Based on the total amount of credit risk in the respective column using ING’s internal credit risk measurement methodologies.
ING Direct continued to increase its diversifications into residential mortgages, while proportionally reducing its securitisation and bond portfolios. During 2008, ING reclassified the Mid-Corporate portfolio from Wholesale Banking to Retail Banking, which proportionally decreased the Retail Banking concentration in Private Individuals and created a wider distribution across other economic sectors. This was partially offset by the purchase of EUR 4.5 billion in residential mortgages from Nationale Nederlanden Hypotheek Bedrijf (NNHB, residential mortgages). All other industries not shown in the table above have less than 2.0% concentrations.
Largest economic exposures: ING Bank lending portfolio, by country (12)
Wholesale Banking Retail Banking ING Direct Total ING Bankamounts in billions of euros 2008 2007 2008 2007 2008 2007 2008 2007
Netherlands 56.2 68.7 171.9 141.1 1.0 1.6 229.1 211.4United States 35.3 28.9 0.2 0.2 63.6 58.2 99.1 87.3Belgium 25.6 44.4 52.6 27.5 1.1 1.4 79.3 73.3Germany 12.5 9.4 0.2 0.2 61.5 54.8 74.2 64.4Spain 15.2 12.4 0.4 0.4 40.1 38.5 55.7 51.3United Kingdom 15.8 19.4 0.2 0.1 13.5 17.3 29.5 36.8France 23.4 17.0 0.7 0.6 4.2 4.1 28.3 21.7Italy 14.7 12.6 0.5 0.5 12.8 12.2 28.0 25.3Australia 4.3 5.0 23.0 25.4 27.3 30.4Canada 1.4 1.7 0.1 17.4 15.7 18.8 17.5Poland 9.7 7.0 2.1 2.5 11.8 9.5Turkey 0.8 6.2 8.6 2.7 9.4 8.9(1) Only covers total exposures in excess of EUR 9 billion, including intercompany exposure with ING Insurance.(2) Country is based on the country of residence of the obligor.
The growth in most countries presented above followed the growth pattern of the portfolio as a whole. The growth at ING Direct in Germany, the United States and Spain was principally driven by own originated mortgages (Germany + EUR 6.3 billion, USA + EUR 7.3 billion, Spain + EUR 1.4 billion). Retail Banking in the Netherlands, Belgium and Turkey grew through organic growth as well as the shift of Mid-Corporates from Wholesale Banking to Retail Banking. The decline in the United Kingdom is driven by exchange rate effects.
ING BANK – MARKET RISKSMarket risk is the risk that movements in market variables, such as interest rates, equity prices, foreign exchange rates and real estate prices, negatively impact the bank’s earnings, market value or liquidity position. Market risk either arises through positions in trading books or through the banking book positions. The trading positions are held for the purpose of benefiting from short-term price movements, while the banking book positions are intended to be held in the long term (or until maturity) or for the purpose of hedging other banking book positions.
195ING Group Annual Report 2008

2.1 Consolidated annual accounts
Within ING Bank, market risk (including liquidity risk) falls under the supervision of the ALCO function with ALCO Bank as the highest approval authority. ALCO Bank determines the overall risk appetite for market risk. The ALCO function is regionally organised with the exception of ING Direct, which has a separate ALCO. The business lines Retail Banking and Wholesale Banking are represented within the respective regional and local ALCO’s. The ALCO structure within ING Bank facilitates top-down risk management, limit setting and the monitoring and control of market risk. This ensures a correct implementation of the ING Bank risk appetite.
The Corporate Market Risk Management department (CMRM) is the designated independent department that is responsible for the design and execution of the bank’s market risk management functions in support of the ALCO function. The CMRM structure recognises that risk management to a large extent occurs at the regional/local level. Bottom-up reporting allows each management level to fully assess the market risk relevant at the respective levels.
CMRM is responsible for determining adequate policies and procedures for managing market risk and for monitoring the compliance with these guidelines. An important element of the market risk management function is the assessment of market risk in new products and businesses. Furthermore CMRM maintains an adequate limit framework in line with ING Bank’s risk appetite. The businesses are responsible for adhering to the limits that ultimately are approved by ALCO Bank. Limit breaches are reported to senior management on a timely basis and the business is required to take the appropriate actions to reduce the risk position.
Market risk in trading portfoliosOrganisationWithin the trading portfolios, positions are maintained in the professional financial markets for the purpose of benefiting from short term price movements. Market risk arises in the trading portfolios through the exposure to various market risk factors, including interest rates, equity prices and foreign exchange rates.
The Financial Markets Risk Committee (FMRC) is a market risk committee that, within the guidelines set by ALCO Bank, sets market risk limits both on an aggregated level and on a desk level, and approves new products. CMRM advises both the FMRC and ALCO Bank on the market risk appetite of Wholesale Banking activities.
CMRM Trading focuses on the management of market risks in the trading portfolios of Wholesale Banking (mainly Financial Markets) as this is the only business line where significant trading activities take place. Trading activities include facilitation of client business, market making and proprietary position taking in cash and derivatives markets. CMRM Trading is responsible for the development and implementation of trading risk policies and risk measurement methodologies, the reporting and monitoring of risk exposures against approved trading limits and the validation of pricing models. CMRM also reviews trading mandates and limits, and performs the gatekeeper role in the product review process. The management of trading market risk is performed at various organisational levels, from CMRM Trading overall down to specific business areas and trading offices.
MeasurementCMRM uses the Value-at-Risk (VaR) methodology as its primary risk measure. The VaR for market risk quantifies, with a one-sided confidence level of 99%, the maximum overnight loss that could occur due to changes in risk factors (e.g. interest rates, foreign exchange rates, equity prices, credit spreads, implied volatilities) if positions remain unchanged for a time period of one day. The impact of historical market movements on today’s portfolio is estimated, based on equally weighted observed market movements of the previous year. ING uses VaR with a 1-day horizon for internal risk measurement, control and backtesting, and VaR with a 10-day horizon for determining regulatory capital. ING’s VaR model has been approved by the Dutch Central Bank to be used for the regulatory capital calculation of its most important trading activities.
Market risk management for the fixed income and equity markets is split into two components: general market risk and specific market risk. The general market risk component estimates the VaR resulting from general market-value movements (e.g. interest rate movements). The specific market risk component estimates the VaR resulting from market-value movements that relate to e.g. the underlying issuer of securities in the portfolios. This specific risk relates to all value movements not related to general market movements.
The VaR for linear portfolios is calculated using a variance – covariance approach. The market risk of all the important option portfolios within ING is measured by Monte Carlo and historical simulation methods.
LimitationsVaR as a risk measure has some limitations. VaR quantifies the potential loss under the assumption of normal market conditions. This assumption may not always hold true in reality, especially when market events occur, and therefore could lead to an underestimation of the potential loss. VaR also uses historical data to forecast future price behaviour. Future price behaviour could differ substantially from past behaviour. Moreover, the use of a one-day holding period (or ten days for regulatory calculations) assumes that all positions in the portfolio can be liquidated or hedged in one day. In periods of illiquidity or market events, this assumption may not hold true. Also, the use of 99% confidence level means that VaR does not take into account any losses that occur beyond this confidence level.
Risk management (continued)
ING Group Annual Report 2008
196

BacktestingBacktesting is a technique for the ongoing monitoring of the plausibility of the VaR model in use. Although VaR models estimate potential future results, estimates are based on historical market data. In a backtest, the actual daily result is compared with the 1-day VaR. In addition to using actual results for backtesting, ING also uses hypothetical results, which measure results excluding the effect of intraday trading, fees and commissions. When the actual or hypothetical loss exceeds the VaR an ‘occurrence’ has taken place. Based on ING’s one-sided confidence level of 99% an occurrence is expected once in every 100 business days. In 2008, there was no occurrence (2007: none) where a daily trading loss exceeded the daily consolidated VaR of ING Wholesale Banking. ING reports the results of this backtesting to the Dutch Central Bank on a quarterly basis. Stress testingStress tests are used for the monitoring of market risks under extreme market conditions. Since VaR in general does not produce an estimate of the potential losses that can occur as a result of extreme market movements, ING uses structured stress tests for monitoring the market risk under these extreme conditions. Stress scenarios are based on historical and hypothetical extreme events. The result of the stress testing is an event risk number, which is an estimate of the profit and loss account effect caused by a potential event and its world-wide impact for ING Wholesale Banking. The event risk number for the ING Wholesale Banking trading activity is generated on a weekly basis. Like VaR, event risk is limited by ALCO Bank. The event-risk policy (and its technical implementation) is specific to ING as there is no event risk calculation method that is generally accepted by other banks and regulators (like the Value-at-Risk model). ING’s event risk policy basically consists of defined stress parameters per country and per market (fixed income, equity, foreign exchange, credit and related derivative markets). The scenarios and stress parameters are back-tested against extreme market movements that actually occurred in the markets. The market developments in 2008 will be taken into account in the definition of scenarios and stress parameters during 2009. If and when necessary, ING evaluates specific stress scenarios, as an addition to its structured stress tests. These specific scenarios relate to current concerns, like political instability in certain regions, terrorist attacks or extreme movements in energy prices.
Other trading controlsVaR and event risk limits are the most important limits to control the trading portfolios. Furthermore, ING uses a variety of other limits to supplement VaR and event risk. Position and sensitivity limits are used to prevent large concentrations in specific issuers, sectors or countries. In addition to this, other risk limits are set with respect to the activities in exotic derivatives trading. The market risk of these products is controlled by product specific limits and constraints.
Development of trading market risksThe following chart shows the development of the overnight VaR under a 99% confidence interval and a 1-day horizon. The overnight VaR is presented for the ING Wholesale Banking trading portfolio which was risk managed by CMRM Trading during 2007 and 2008. Several banking books are governed by the trading risk process and are therefore excluded from the non-trading risk table and included in the trading risk graph and table below.
Consolidated trading VaR ING Wholesale Banking 2007-2008in EUR millions
Q1 2007
0
10
20
30
40
50
60
70
80
Q2 2007 Q3 2007 Q4 2007 Q1 2008 Q2 2008 Q3 2008 Q4 2008
VaR Limit
Date
Value at Risk
During 2007 and 2008 the overnight VaR for the ING Wholesale Banking trading portfolio ranged from EUR 29 to EUR 72 million.
197ING Group Annual Report 2008

2.1 Consolidated annual accounts
The average exposure over 2008 was substantially higher than 2007 (average VaR 2008: EUR 53 million and average VaR 2007: EUR 34 million). This increase is to a large extent related to the increase of volatility in the different financial markets, as well as the changes in the correlation between different markets and products. As a result, the consolidated trading VaR exceeded the EUR 60 million limit in the fourth quarter. ALCO Bank approved a temporary increase of the limit to 66 million to accommodate the changed market circumstances and a gradual reduction of the exposure. The consolidated trading VaR peaked at a level of EUR 72 million on October 24th. The management of CMRM and Wholesale Banking/Financial Markets have taken further actions to bring back the exposure within the limit. As the VaR decreased during the last two months of the year, the limit was reduced to its original level of EUR 60 million per mid December.
More details on the VaR of the ING Wholesale Banking trading portfolio for 2008 and 2007 are provided in the table below.
Consolidated trading VaR: ING Wholesale Bank
Minimum Maximum Average Year-end2008 2007 2008 2007 2008 2007 2008 2007
Foreign exchange 4 2 9 7 5 4 7 4Equities 5 5 13 13 8 9 7 6Interest rate 33 22 58 43 45 27 43 43Diversification (1) –5 –6 –3 –5Total VaR 53 34 54 48(1) The total VaR for the columns Minimum and Maximum can not be calculated by taking the sum of the individual components since the observations for both
the individual markets as well as total VaR may occur on different dates. Note: the above captions are consistent with those used for internal risk management purposes and do not relate to financial statement captions.
In general, the level of the trading VaR was not only higher in 2008, but also showed larger movements. The interest rate market, which includes both the general interest rate and credit spread exposures, provided the largest contribution to the trading VaR.
The following table shows the largest trading positions in foreign exchange, interest rate and corporate credit spread positions. The corporate credit spread sensitivities are furthermore split in different risk classes and sectors.
Most important foreign exchange, interest rate and credit spread positions (year end 2008)
2008
Foreign exchangeSingapore dollar –91Mexican peso 69South Korean won –68US dollar 55Chinese yuan 46
Interest Rate (Bpv (1))Eurozone –1.272Mexico –0.289United States 0.241South Korea –0.111Taiwan 0.060
Credit Spread (Bpv (1))Eurozone –0.247United States –0.187Mexico –0.097Japan –0.056United Kingdom –0.032(1) Bpv (or basis point value) refers to profit and loss account sensitivity per 1bp increase in the interest rate or credit spread.
Risk management (continued)
ING Group Annual Report 2008
198

Credit spread sensitivities per risk class and sector (year end 2008)
In EUR thousands Corporate FinancialCredit Spread (Bpv (1))
Risk classes1 (AAA) –20 –402-4 (AA) –19 –1155-7 (A) 4 –888-10 (BBB) –75 –10311-13 (BB) –37 –5414-16 (B) –6 –1817-22 (CCC and
Problem Grade) –21 –2No rating –19 –28(1) Bpv (or basis point value) refers to profit and loss account sensitivity per 1bp increase in the credit spread.
Market risk in Non-Trading PortfoliosOrganisationWithin ING Bank, positions are either labelled as trading or non-trading (banking book) positions. The most important aspect in segregating the banking from the trading books is the intent of the positions held in these books. The banking book positions are intended to be held for the long-term (or until maturity) or for the purpose of hedging other banking positions emerging from commercial business, as for instance in the mortgage book.
Interest rate risk in banking booksThe interest rate risk of the banking books is the risk that ING Bank’s earnings or market value resulting from the non-trading positions is negatively impacted by movements in interest rates. To assign clear responsibilities for risk and return within the banking book structure an Asset and Liability Management (ALM) framework has been implemented by ALCO Bank. This framework enables a clear separation of three types of activities: the investment of own capital, the commercial business and the management of the bank’s strategic interest rate risk position in the designated ALM books. The figure below presents the ALM framework of ING Bank within which the interest rate risk is measured and monitored:
ING Bank’s capital management positions, i.e. the own funds (core capital) and the investments of these own funds, are isolated in the ING Bank corporate line. ALCO Bank determines the target maturity profile over which ING Bank’s own funds must be invested. This maturity profile reflects the long term nature of the rate of return required by ING Bank’s investors and aims for both earnings maximisation and stabilisation. ALCO Bank considers a well balanced portfolio of long-dated fixed income investments as the risk neutral position in its internal risk transfer framework.
ING Bank
Wholesale BankingRetail BankingING Direct
Risk transfer to market
Model risk(replication,
prepayments)
Risk transfer toFM ALM
Model risk(replication,
prepayments)
Commercial Bank
Financial MarketsALM
Financial MarketsTrading
Proprietaryrisk taking
Risk transfer toFM ALM
CapitalManagement
199ING Group Annual Report 2008
2.1 Consolidated annual accounts
The risk transfer principle forms the basis of ING Bank’s ALM framework. This refers to the principle whereby the outright interest rate risk resulting from the commercial business is transferred to the ALM books. The interest rate risk from the commercial business arises from the fact that own originated assets and liabilities do not reprice simultaneously with respect to interest rate characteristics. The transfer of the outright interest rate risk is to a large degree based on modelling client behaviour. Within CMRM, extensive research is being done in order to optimise this modelling. For this purpose, several methods are in place to replicate the interest rate risk, taking into account both the contractual and behavioural characteristics of demand deposits, saving accounts and mortgages. All models and assumptions are back-tested regularly and results are presented to the designated ALCO.
For the determination of the interest rate sensitivity of savings accounts and current accounts, several methods depending on the focus of the risk analysis have been developed, e.g. historical simulation, Earnings at Risk analysis and valuation models. Pricing strategies, outstanding volumes and the level and shape of the yield curve are taken into account in these models. Based on these analyses, investment rules are determined for the various portfolios.
The hedging of the embedded prepayment options within mortgage portfolios is based on prepayment prediction models. These models include the incentive for clients to prepay. The parameters of these models are based on historical data and are regularly updated. The interest sensitivity of the embedded offered rate options is determined as well for the mortgage portfolio and a hedging process is in place to minimise the resulting interest rate risk.
After transferring the outright interest rate risk position to the ALM books, the residual interest rate risk that remains in the commercial banking books is caused by basis risk and optionality. The commercial business units bear responsibility for these residual interest rate risks that result from banking products of which future cash flows depend on client behaviour (e.g. optionality in mortgages) and from banking products of which the client rate earned and paid imperfectly correlate with the changing market rates (basis risk). Examples of products in which these risks are inherent are current accounts, saving accounts and mortgages.
Within ING Direct the interest rate risk is managed and measured at the level of the local ING Direct entities. The interest rate risk that remains in the ING Direct entities also largely results from basis risk and optionality as the outright interest rate risk is to a large extent hedged.
The ALM books are managed within ING Wholesale Banking and contain the strategic interest rate risk position of ING Bank. The main objective is to maximise the economic value of the book and to generate adequate and stable yearly earnings within the risk appetite boundaries of ING Bank.
In the following sections, the risk figures for interest rate risk in the banking books are presented. In line with the group risk metrics, ING Bank uses several risk measures to manage interest rate risk both from an earnings and a value perspective. Earnings-at-Risk (EaR) is used to provide the earnings perspective and the Net Present Value (NPV)-at-Risk and Basis Point Value (BPV) figures provide the value perspective. Several banking books are governed by the trading risk process and are therefore excluded from the following non-trading risk tables and are included in the trading risk graph and table under ‘Market Risk in Trading Books’.
Earnings at Risk (EaR)EaR measures the impact on (pre tax) IFRS earnings resulting from changes of market rates over a time period of one year. Changes in balance sheet dynamics and management interventions are not incorporated in these calculations. The EaR figures in the table below are determined on the basis of an instantaneous upward 1% parallel shock in market rates. This shock is assumed to take place at the beginning of the year and the market rates are assumed to remain stable for the remainder of the year. For the ALM books EaR measures the potential loss of earnings due to the structural mismatch in interest rate positions. The calculations for the ALM books capture the EaR resulting from the current positions. For the commercial banking books the EaR captures the interest rate risks resulting from savings, current accounts and the main mortgage portfolios. The impact of new business is included in the EaR calculations for the savings and demand deposits portfolios, as it is most relevant for these portfolios. The EaR of the Corporate Line, i.e. the investment of ING Bank’s own funds, reflects the interest risk profile of the investments only. This is in line with the accounting based definition of (pre tax) EaR.
Risk management (continued)
ING Group Annual Report 2008
200

Earnings at Risk (1% instantaneous upward shock to interest rates)
2008 2007
By Business LineING Wholesale Banking –91 –87ING Retail Banking –102 –121ING Direct 5 –5ING Bank Corporate Line 46 26ING Bank Total –142 –187
By CurrencyEuro –220 –125US dollar 80 9Pound sterling 5 –13Other –7 –58Total –142 –187
Note: Compared to EaR figures in the group risk dashboard, the above figures exclude diversification with other bank risk types and group/insurance risks.
The total EaR figure, as result of an upward shock of the market rates of 1%, improved compared to last year by EUR 45 million to EUR –142 million. Especially the last quarter in 2008 was dominated by a decreasing interest rate environment due to substantial interest rate cuts of central banks. This was of strong influence on the lower EaR under this scenario as several units within Retail Banking and ING Direct invested assets more short term and, as a consequence, will benefit more from increasing interest rates.
This dynamic in mainly non-EUR units is also the main driver for the strong increase in the positive EaR generated by USD exposure to EUR 80 million (from EUR 9 million) and the strong improvement in negative EaR in other currencies to EUR –7 million (from EUR –58 million). The negative EaR based on the EUR exposure substantially increased by EUR 95 million to EUR –220 million mainly driven by Wholesale Banking ALM positions that were, in comparison to year end 2007, more positioned to benefit from interest rate decreases.
Net Present Value-at-Risk (NPV)The Net Present Value (NPV)-at-Risk figures represent the full value impact (i.e. including convexity) to the banking books resulting from changing interest rates. This full value impact cannot be linked directly to the balance sheet or profit and loss account as the fair value movements in banking books are generally not reported through the profit and loss account or through equity. The largest part, namely the value mutations of the amortised cost balances, is neither recognised in the balance sheet nor directly in the profit and loss account. These mutations would be expected to materialise over time in e.g. the profit and loss account, if interest rates develop according to forward rates throughout the remaining maturity of the portfolio. The NPV-at-Risk figures in the table below are determined on the basis of an instantaneous upward 1% parallel shock of market rates in line with the EaR calculations. For the ALM books the NPV-at-Risk figures again capture the potential change of value due to the structural mismatch in interest rate positions. For the commercial banking books the NPV-at-Risk calculations capture the convexity resulting from the optionality in the main mortgage portfolios, e.g. the option for clients to prepay in case of moving house. In these calculations it is assumed that savings and other demand deposits of Retail and Wholesale Banking are perfectly represented via the replicating methods and therefore are fully hedged. The NPV-at-Risk of the Corporate Line again only reflects the interest risk profile of the investments of the bank’s own funds.
NPV-at-Risk (1% instantaneous upward shock to interest rates)
2008 2007
By Business LineING Wholesale Banking –674 –442ING Retail Banking –100 –222ING Direct –232 –234ING Bank Corporate Line –1,388 –892ING Bank Total –2,394 –1,790
By CurrencyEuro –2,105 –1,498US dollar –238 –439Pound sterling –40 74Other –11 73Total –2,394 –1,790
201ING Group Annual Report 2008

2.1 Consolidated annual accounts
The end-of-year overall NPV-at-Risk figure as result of an upward shock of market rates of 1% is on a higher level compared to last year. This is mainly driven by Wholesale Banking’s ALM positions and the Corporate Line that increased in line with ING Bank’s higher capital position after the capital injection from the Dutch State in October 2008.
Basis Point Values (BPV)The Basis Point Value (BPV) figures below represent the value impact to the banking books resulting from a change in interest rates of 1 basis point. The BPV figures represent the directional position under a small upward shift in interest rates and do not capture the convexity resulting from the optionality in mortgages under larger interest rate movements.
BPVs per currencyIn EUR thousands Currency 2008 2007
Euro –19,176 –15,165US dollar 337 –2,055Pound sterling –582 778Other –373 706Total –19,794 –15,736
The outright interest rate risk that is represented through the BPV positions in the table above is mainly caused by the investments of the Bank’s core capital. This only holds under the view that this capital is not sensitive to interest movements but ignores ALCO Bank’s assumption that its shareholders expect ING Bank to invest the funds in such a way that it produces a long-term and stable income. The remaining outright risk is mainly maintained in the Bank’s ALM books in which the strategic position is maintained.
Foreign exchange risk in non-trading booksForeign exchange (FX) exposures in non-trading books result from commercial banking business (business units doing business in other currencies than their base currency), realised non-EUR results and FX translation risk on foreign currency investments. The policy regarding these exposures is briefly explained below.
Commercial banking businessEvery business unit hedges the FX risk as result of their commercial activities into the base currency of the unit. Consequently assets and liabilities are matched in terms of currency.
Realised resultsEvery unit hedges realised results to the base currency of the unit. On a monthly basis the central Capital Management department hedges the non-EUR results to EUR. ING does not hedge the future EUR value of projected results in non-EUR currency.
FX Translation resultING’s strategy is to protect its Tier-1 ratio against unfavourable currency fluctuations. The protection is largely achieved by the issuance of USD and GBP denominated Tier-1 capital and furthermore by taking structural foreign currency positions. In general, open positions are deliberately taken in order to achieve protection of the Tier-1 ratio by establishing the right ratio of non-EUR denominated capital and risk weighted assets in these currencies. The US dollar, Pound sterling, Polish zloty, Australian dollar and Turkish lira are the main currencies in this respect. For other currencies the objective is to substantially mitigate the translation risk.
The following tables present the non-trading currency exposures of the central Capital Management department. As a consequence of the layered hedging policy described above, the net position of Capital Management in principle equals the aggregated non-trading currency exposure of the entire bank. Exception is the 2008 US dollar exposure which will be explained below. Note: all amounts are in EUR millions (equivalents).
Overnight non-trading currency exposures ING Bank
2008Foreign
investments Tier-1 Gross exposure Hedges Net position
US dollar 9,061 –3,757 5,304 –745 4,559Pound sterling –1,132 –628 –1,760 1,741 –19Polish zloty 1,027 1,027 –490 537Australian dollar 1,031 1,031 –700 331Turkish lira 1,687 1,687 –193 1,494Other currency 4,897 4,897 –3,794 1,103Total 16,571 –4,385 12,186 –4,181 8,005
Risk management (continued)
ING Group Annual Report 2008
202

Overnight non-trading currency exposures ING Bank
2007Foreign
investments Tier-1 Gross exposure Hedges Net position
US dollar 2,644 –3,630 –986 –483 –1,469Pound sterling –848 –817 –1,665 1,635 –30Polish zloty 1,076 1,076 –656 420Australian dollar 1,228 1,228 –136 1,092Turkish lira 1,848 1,848 1,848Other currency 5,719 5,719 –3,871 1,848Total 11,667 –4,447 7,220 –3,511 3,709
The US dollar position at the end of 2007 was adjusted (reduced) in order to match with lower risk-weighted assets under the new Basel II rules starting January 1 2008. As a result of changing market circumstances this reduction was undone and the net position in US dollars increased significantly in 2008, for two reasons. Firstly, on the back of the credit crisis, the (credit) risk-weighted assets in US dollars increased significantly. The second reason is because of negative market value revaluations of Alt-A RMBS positions within ING Direct US, US dollar funding of ING Direct Holding was converted to EUR in order to avoid P/L volatility. As a consequence, a (net) long US dollar position emerged at ING Direct Holding level which has been added to the Capital Management position in the 2008 table above.
The net position in Australian dollar dropped by EUR 762 million. This is a consequence of a large drop in risk-weighted assets under Basel II (compared to Basel I).
The drop in the Turkish lira position is caused by a depreciation of the currency. The position in local currency did not change significantly.
The FX risk in the non-trading books is measured by using the Value-at-Risk methodology as explained in the trading risk section. The VaR for FX quantifies with a one-sided confidence interval of 99%, the maximum overnight loss in 99% of the cases that could occur due to changes in foreign exchange rates.
Consolidated non-trading FX VaR ING Bank
2008Low
2007 2008High2007 2008
Average2007 2008
Year-end2007
FX VaR 36 14 135 62 72 22 112 62
During 2008, the FX VaR increased significantly. The major contributor was the long position in US dollars.
Equity Price Risk in Banking BooksEquity price risk arises from the possibility that equity security prices will fluctuate, affecting the value of equity securities and other instruments whose price reacts similarly to a particular security, a defined basket of securities, or a securities index. ING Bank maintains a strategic portfolio with substantial equity exposure in its banking books. This equity exposure mainly consists of the investments in associates of EUR 1,813 million (2007: EUR 2,010 million) and equity securities held in the Available-for-Sale portfolio of EUR 1,863 million (2007: EUR 3,627 million). The value of equity securities held in the Available-for-Sale portfolio is directly linked to equity security prices with increases/decreases being recognised (except in the case of impairment) in the revaluation reserve. During the year ended 31 December 2008 the revaluation reserve relating to equity securities held in the Available-for-Sale portfolio fluctuated between a month-end low amount of EUR 776 million (2007: EUR 518 million) and a high amount of EUR 1,969 million (2007: EUR 2,580 million). Investments in associates are measured in accordance with the equity method of accounting and the balance sheet value is therefore not directly linked to equity security prices.
Real EstateReal estate price risk arises from the possibility that real estate prices will fluctuate affecting both the value of real estate assets and earnings related to real estate activities.
ING Bank has three different categories of real estate exposure on its banking books. First, ING Bank owns buildings it occupies. Second, ING Bank has a Real Estate Development company for which results are dependent on the overall real estate market, although the general policy is to mitigate risk by pre-sale agreements where possible.
Third, ING Bank is one of the largest real estate investment management companies in the world in terms of assets under management. For various real estate funds, ING Bank has co-invested seed capital and bridge capital to support the launch of new funds. A decrease in real estate prices will cause the value of this seed and bridge capital to decrease and will lower the level of third party assets under management, which in turn will reduce the fee income from this activity.
203ING Group Annual Report 2008
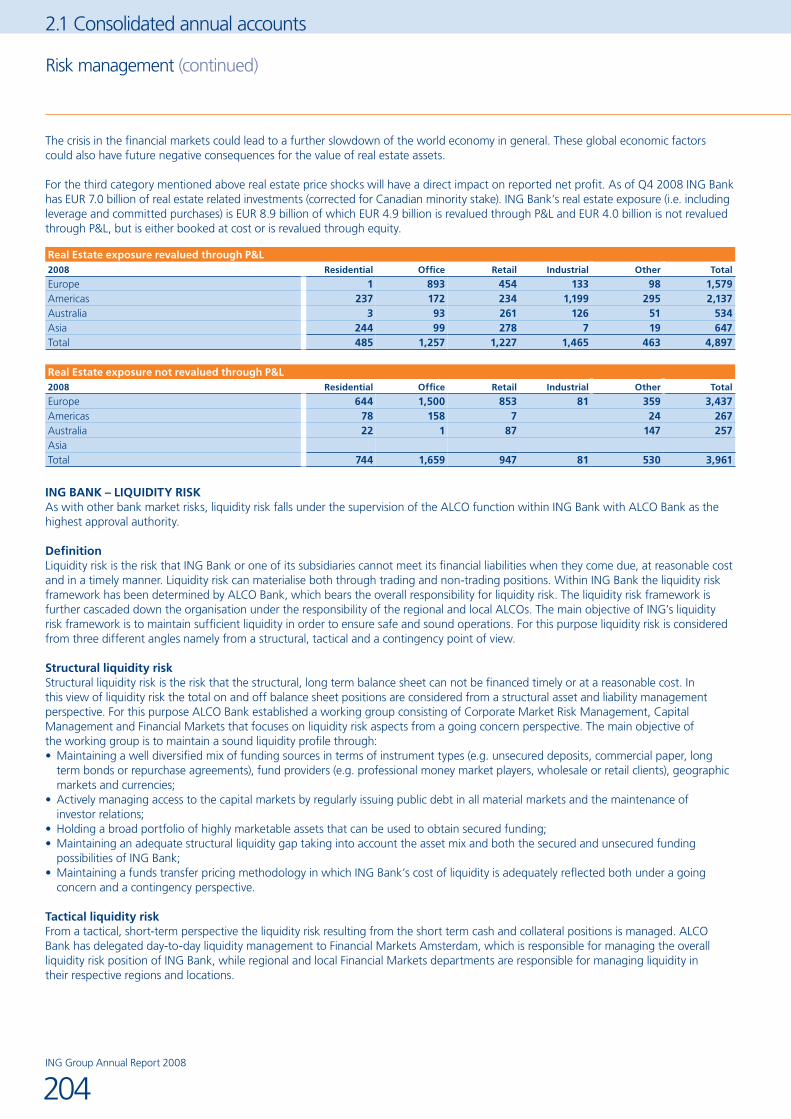
2.1 Consolidated annual accounts
The crisis in the financial markets could lead to a further slowdown of the world economy in general. These global economic factors could also have future negative consequences for the value of real estate assets.
For the third category mentioned above real estate price shocks will have a direct impact on reported net profit. As of Q4 2008 ING Bank has EUR 7.0 billion of real estate related investments (corrected for Canadian minority stake). ING Bank’s real estate exposure (i.e. including leverage and committed purchases) is EUR 8.9 billion of which EUR 4.9 billion is revalued through P&L and EUR 4.0 billion is not revalued through P&L, but is either booked at cost or is revalued through equity.
Real Estate exposure revalued through P&L2008 Residential Office Retail Industrial Other Total
Europe 1 893 454 133 98 1,579Americas 237 172 234 1,199 295 2,137Australia 3 93 261 126 51 534Asia 244 99 278 7 19 647Total 485 1,257 1,227 1,465 463 4,897
Real Estate exposure not revalued through P&L2008 Residential Office Retail Industrial Other Total
Europe 644 1,500 853 81 359 3,437Americas 78 158 7 24 267Australia 22 1 87 147 257AsiaTotal 744 1,659 947 81 530 3,961
ING BANK – LIQUIDITY RISKAs with other bank market risks, liquidity risk falls under the supervision of the ALCO function within ING Bank with ALCO Bank as the highest approval authority.
DefinitionLiquidity risk is the risk that ING Bank or one of its subsidiaries cannot meet its financial liabilities when they come due, at reasonable cost and in a timely manner. Liquidity risk can materialise both through trading and non-trading positions. Within ING Bank the liquidity risk framework has been determined by ALCO Bank, which bears the overall responsibility for liquidity risk. The liquidity risk framework is further cascaded down the organisation under the responsibility of the regional and local ALCOs. The main objective of ING’s liquidity risk framework is to maintain sufficient liquidity in order to ensure safe and sound operations. For this purpose liquidity risk is considered from three different angles namely from a structural, tactical and a contingency point of view.
Structural liquidity riskStructural liquidity risk is the risk that the structural, long term balance sheet can not be financed timely or at a reasonable cost. In this view of liquidity risk the total on and off balance sheet positions are considered from a structural asset and liability management perspective. For this purpose ALCO Bank established a working group consisting of Corporate Market Risk Management, Capital Management and Financial Markets that focuses on liquidity risk aspects from a going concern perspective. The main objective of the working group is to maintain a sound liquidity profile through:
Maintaining a well diversified mix of funding sources in terms of instrument types (e.g. unsecured deposits, commercial paper, long •term bonds or repurchase agreements), fund providers (e.g. professional money market players, wholesale or retail clients), geographic markets and currencies; Actively managing access to the capital markets by regularly issuing public debt in all material markets and the maintenance of •investor relations;Holding a broad portfolio of highly marketable assets that can be used to obtain secured funding;• Maintaining an adequate structural liquidity gap taking into account the asset mix and both the secured and unsecured funding •possibilities of ING Bank; Maintaining a funds transfer pricing methodology in which ING Bank’s cost of liquidity is adequately reflected both under a going •concern and a contingency perspective.
Tactical liquidity riskFrom a tactical, short-term perspective the liquidity risk resulting from the short term cash and collateral positions is managed. ALCO Bank has delegated day-to-day liquidity management to Financial Markets Amsterdam, which is responsible for managing the overall liquidity risk position of ING Bank, while regional and local Financial Markets departments are responsible for managing liquidity in their respective regions and locations.
Risk management (continued)
ING Group Annual Report 2008
204
Within Financial Markets the focus is mainly on the daily and intraday cash and collateral positions and it is policy to sufficiently spread day-to-day funding requirements. For this purpose the Treasury function monitors all maturing cash flows along with expected changes in core business funding requirements.
The liquidity risk management function is delegated to CMRM, which bears the responsibility for liquidity risk stress testing and for the identification, measurement and monitoring of the liquidity risk position. For the measurement and monitoring of the actual liquidity position the focus is on the daily cash and collateral position. For stress testing purposes the liquidity risk positions are calculated in line with the regulatory reporting requirements for liquidity risk of the Dutch Central Bank. For this purpose ING Bank’s weekly and monthly liquidity positions are stress tested under a scenario that is a mix between a market event and an ING specific event. The resulting liquidity positions are corrected for liquidity surpluses in inconvertible currencies and in locations with restrictions on capital transfer.
Contingency liquidity riskContingency liquidity risk relates to the organisation and planning for liquidity management in times of stress. Within ING a specific crisis team is responsible for the liquidity management in times of crisis. This crisis team consists of the CRO, the CFO, the Executive Board member responsible for Wholesale Banking, the Directors of CMRM and Capital Management and all the main treasurers of both ING Bank and ING Insurance. Within ING it is policy to have adequate and up-to-date contingency funding plans in place throughout the organisation. The main objective of ING’s contingency funding plans is to enable senior management to act effectively and efficiently at times of crisis. The contingency funding plans are established for addressing temporary and long-term liquidity disruptions caused by a general event in the market or an ING specific event. These plans ensure that all roles and responsibilities are clearly defined and all necessary management information is in place. The contingency funding plans are regularly tested both on consolidated and local level in order to be best prepared for potential liquidity risk issues.
ING INSURANCEING is engaged in selling a broad range of life and non-life insurance products. Risks from these products arise with respect to the adequacy of insurance premium rate levels and provisions for insurance liabilities and capital position, as well as uncertainty as to the future returns on investments of the insurance premiums. Risks are classified as insurance risk (actuarial and underwriting), market risk, liquidity risk, credit risk, business risk and operational risk.
The responsibility for measurement and management of credit risk and operational risk resides with Corporate Credit Risk Management (CCRM) and Corporate Operational Risk Management (CORM) respectively. Corporate Insurance Risk Management (CIRM) is responsible for insurance risk (actuarial and underwriting) market risk and liquidity risk measurement and management, business risk measurement, as well as ensuring that investment mandates adequately address credit portfolio risk.
Risk management governanceING’s Insurance Risk Management (IRM) is organised along a functional line comprising three levels within the organisation: the corporate, business line and business unit levels. The General Manager of CIRM, the Chief Insurance Risk Officer, heads the functional line and reports to the Corporate CRO. Each of the business lines and business units has a similar function headed by a Chief Insurance Risk Officer (business line and business unit CIRO). This layered, functional approach ensures consistent application of guidelines and procedures, regular reporting and appropriate communication vertically through the risk management function, as well as providing ongoing support for the business. The scope, roles, responsibilities and authorities of the risk management function at different levels are clearly described in an Insurance Risk Management Governance Framework to which all consolidated business units and business lines must adhere.
The objective of the insurance risk management function is to provide the business a sustainable competitive advantage by fully integrating risk management into the tactical daily business activities as well as ING’s broader business strategy. Insurance Risk Management accomplishes this through four core activities. First, the IRM function ensures that products and portfolios are structured, underwritten, priced, approved and managed appropriately in compliance with internal and external rules and guidelines. Second, IRM ensures that the ING Insurance risk profile is transparent and well understood by management and stays within delegated authorities, with a ‘no surprises’ approach to reporting and monitoring risks. Third, IRM ensures that both risk and reward are adequately considered in the development of business strategy, for example by supporting the planning and allocation of Economic Capital and limits during the strategic planning process. Finally, IRM ensures that these steps are understood by ING’s stakeholders, including shareholders, rating agencies, regulators and policy holders. Risk management policies and toolsTo ensure appropriate risk management, CIRM in close co-operation with the business line CIROs, has developed Standards of Practice guidelines and tools to manage risks. While these standards are principle based, they include mandatory requirements to which the business unit CIRO must adhere.
205ING Group Annual Report 2008
2.1 Consolidated annual accounts
A critical aspect of risk management is that all new products are designed, underwritten and priced appropriately. This is explicitly covered by the Standard of Practice for the Product Approval and Review Process (PARP). This standard includes requirements related to risk profile, traditional and value-oriented pricing metrics and targets, and documentation. In addition to insurance and market risks, the requirements refer to operational risk, legal and compliance risk, etc. For these risks, the IRM network works closely together with the other relevant risk departments. The PARP also includes requirements to assess sensitivities to changes in financial markets, insurance risk (e.g. mortality and claims development), compliance risks and operational risks, as well as assessment of the administration and accounting aspects of the product.
Other standards prescribe quarterly insurance risk reporting, ALM procedures and reporting, actuarial and economic assumption setting, reserve adequacy testing and embedded value measurement and reporting, amongst others.
ING Insurance has developed an Economic Capital approach similar to that used within ING Bank as one of its core risk measurement tools. More details on the Economic Capital model are described below. In 2007, ING Insurance introduced ECAPS, a new intranet-based Economic Capital reporting system which is based on replicating portfolio techniques. The ECAPS system provides a well controlled and automated basis for Economic Capital and risk reporting, and also provides greatly enhanced market risk analysis tools for business units and corporate reporting purposes. ECAPS relies on an innovative replicating portfolio methodology. CIRM expects this system to be the foundation of its internal fair value and solvency model, including the calculation of capital requirements following the introduction of Solvency II. Through 2008 the system has been enhanced and functionality expanded.
To further manage risk, ING Insurance has implemented several limit structures. Examples include but are not limited to the following: Market Value at Risk (MVaR) limits that provide the fundamental framework to manage the market and credit risks resulting from •the Insurance operations’ asset/liability mismatch;Credit risk concentration limits;•Mortality concentration limits;•Catastrophe and mortality exposure retention limits for its insurance risk; and•Investment and derivative guidelines.•
More information on some of these limits is included in the sections below.
Reserve adequacyCIRM instructs and supervises all ING entities to ensure that the total insurance liabilities of ING Insurance (both reserves and capital) are tested for adequacy taking into account the insurance premium rate levels and the uncertainty of future returns on investments. This is done by evaluating insurance liabilities on current best estimate actuarial assumptions plus a risk margin, ensuring that the reserves remain adequate based on current assumptions. The assumed investment earnings are a combination of the run-off of portfolio yields on existing assets and new money and reinvestment rates. For new money and reinvestments long-term best estimate assumptions are taken into account, although current new money rates are used for the short-term reinvestments. For most products stochastic testing is required, taking the 90% point as the testing outcome. In the case where deterministic testing is used the 90% confidence level is achieved by subtracting risk margins of 20% of the best-estimate interest rates or 1%, whichever is higher.
ING’s policy for reserve adequacy testing is disclosed in the ’Principles of valuation and determination of results’ section. As of 31 December 2008 (and 31 December 2007), reserves for ING’s insurance businesses in aggregate are adequate at a 90% confidence level. All business lines are adequate on a stand alone basis at a 90% confidence level as well. However, as a result of the severe economic downturn during late 2008 and its effects on products that are sensitive to interest and equity markets movements, the net insurance liabilities for US retail annuity products and ING Life Japan were insufficient at both the 90th percentile and 50th percentile level of the stochastic test. For US retail annuity the inadequacy was EUR 1.6 billion (90th percentile) and EUR 0.6 billion (50th percentile). For ING Life Japan the inadequacy was EUR 0.4 billion at the 90th percentile and less than EUR 0.1 billion at the 50th percentile. In both cases management is investigating various actions to improve the reserve adequacy, including de-risking the variable annuity products.
Risk management (continued)
ING Group Annual Report 2008
206
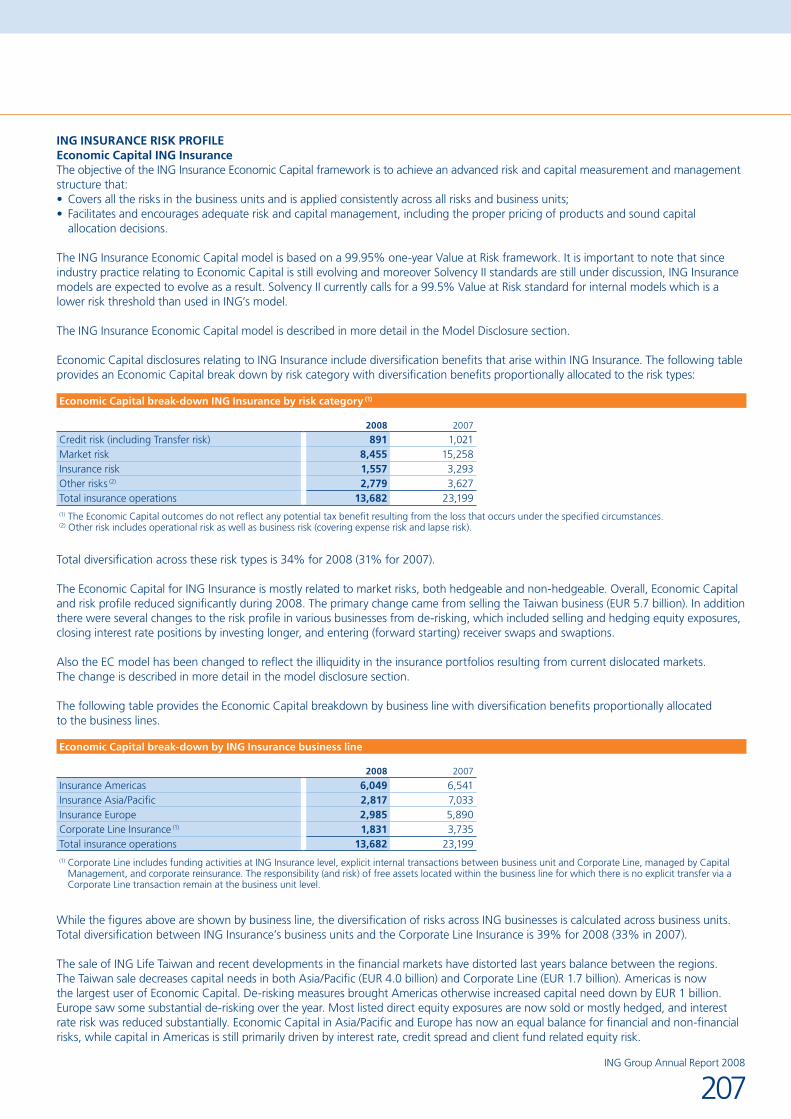
ING INSURANCE RISK PROFILEEconomic Capital ING InsuranceThe objective of the ING Insurance Economic Capital framework is to achieve an advanced risk and capital measurement and management structure that:
Covers all the risks in the business units and is applied consistently across all risks and business units;• Facilitates and encourages adequate risk and capital management, including the proper pricing of products and sound capital •allocation decisions.
The ING Insurance Economic Capital model is based on a 99.95% one-year Value at Risk framework. It is important to note that since industry practice relating to Economic Capital is still evolving and moreover Solvency II standards are still under discussion, ING Insurance models are expected to evolve as a result. Solvency II currently calls for a 99.5% Value at Risk standard for internal models which is a lower risk threshold than used in ING’s model.
The ING Insurance Economic Capital model is described in more detail in the Model Disclosure section.
Economic Capital disclosures relating to ING Insurance include diversification benefits that arise within ING Insurance. The following table provides an Economic Capital break down by risk category with diversification benefits proportionally allocated to the risk types:
Economic Capital break-down ING Insurance by risk category (1)
2008 2007
Credit risk (including Transfer risk) 891 1,021Market risk 8,455 15,258Insurance risk 1,557 3,293Other risks (2) 2,779 3,627Total insurance operations 13,682 23,199(1) The Economic Capital outcomes do not reflect any potential tax benefit resulting from the loss that occurs under the specified circumstances.(2) Other risk includes operational risk as well as business risk (covering expense risk and lapse risk).
Total diversification across these risk types is 34% for 2008 (31% for 2007).
The Economic Capital for ING Insurance is mostly related to market risks, both hedgeable and non-hedgeable. Overall, Economic Capital and risk profile reduced significantly during 2008. The primary change came from selling the Taiwan business (EUR 5.7 billion). In addition there were several changes to the risk profile in various businesses from de-risking, which included selling and hedging equity exposures, closing interest rate positions by investing longer, and entering (forward starting) receiver swaps and swaptions.
Also the EC model has been changed to reflect the illiquidity in the insurance portfolios resulting from current dislocated markets. The change is described in more detail in the model disclosure section.
The following table provides the Economic Capital breakdown by business line with diversification benefits proportionally allocated to the business lines.
Economic Capital break-down by ING Insurance business line
2008 2007
Insurance Americas 6,049 6,541Insurance Asia/Pacific 2,817 7,033Insurance Europe 2,985 5,890Corporate Line Insurance (1) 1,831 3,735Total insurance operations 13,682 23,199(1) Corporate Line includes funding activities at ING Insurance level, explicit internal transactions between business unit and Corporate Line, managed by Capital
Management, and corporate reinsurance. The responsibility (and risk) of free assets located within the business line for which there is no explicit transfer via a Corporate Line transaction remain at the business unit level.
While the figures above are shown by business line, the diversification of risks across ING businesses is calculated across business units. Total diversification between ING Insurance’s business units and the Corporate Line Insurance is 39% for 2008 (33% in 2007).
The sale of ING Life Taiwan and recent developments in the financial markets have distorted last years balance between the regions. The Taiwan sale decreases capital needs in both Asia/Pacific (EUR 4.0 billion) and Corporate Line (EUR 1.7 billion). Americas is now the largest user of Economic Capital. De-risking measures brought Americas otherwise increased capital need down by EUR 1 billion. Europe saw some substantial de-risking over the year. Most listed direct equity exposures are now sold or mostly hedged, and interest rate risk was reduced substantially. Economic Capital in Asia/Pacific and Europe has now an equal balance for financial and non-financial risks, while capital in Americas is still primarily driven by interest rate, credit spread and client fund related equity risk.
207ING Group Annual Report 2008
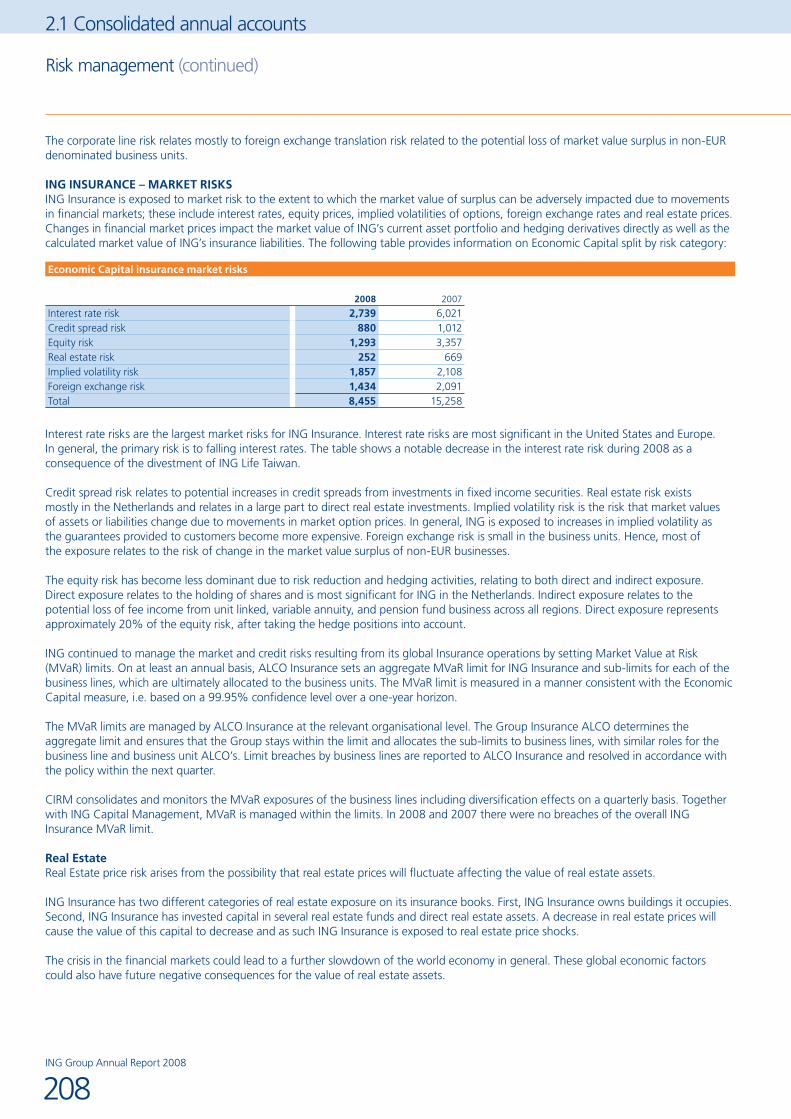
2.1 Consolidated annual accounts
The corporate line risk relates mostly to foreign exchange translation risk related to the potential loss of market value surplus in non-EUR denominated business units.
ING INSURANCE – MARKET RISKSING Insurance is exposed to market risk to the extent to which the market value of surplus can be adversely impacted due to movements in financial markets; these include interest rates, equity prices, implied volatilities of options, foreign exchange rates and real estate prices. Changes in financial market prices impact the market value of ING’s current asset portfolio and hedging derivatives directly as well as the calculated market value of ING’s insurance liabilities. The following table provides information on Economic Capital split by risk category:
Economic Capital insurance market risks
2008 2007
Interest rate risk 2,739 6,021Credit spread risk 880 1,012Equity risk 1,293 3,357Real estate risk 252 669Implied volatility risk 1,857 2,108Foreign exchange risk 1,434 2,091Total 8,455 15,258
Interest rate risks are the largest market risks for ING Insurance. Interest rate risks are most significant in the United States and Europe. In general, the primary risk is to falling interest rates. The table shows a notable decrease in the interest rate risk during 2008 as a consequence of the divestment of ING Life Taiwan.
Credit spread risk relates to potential increases in credit spreads from investments in fixed income securities. Real estate risk exists mostly in the Netherlands and relates in a large part to direct real estate investments. Implied volatility risk is the risk that market values of assets or liabilities change due to movements in market option prices. In general, ING is exposed to increases in implied volatility as the guarantees provided to customers become more expensive. Foreign exchange risk is small in the business units. Hence, most of the exposure relates to the risk of change in the market value surplus of non-EUR businesses.
The equity risk has become less dominant due to risk reduction and hedging activities, relating to both direct and indirect exposure. Direct exposure relates to the holding of shares and is most significant for ING in the Netherlands. Indirect exposure relates to the potential loss of fee income from unit linked, variable annuity, and pension fund business across all regions. Direct exposure represents approximately 20% of the equity risk, after taking the hedge positions into account.
ING continued to manage the market and credit risks resulting from its global Insurance operations by setting Market Value at Risk (MVaR) limits. On at least an annual basis, ALCO Insurance sets an aggregate MVaR limit for ING Insurance and sub-limits for each of the business lines, which are ultimately allocated to the business units. The MVaR limit is measured in a manner consistent with the Economic Capital measure, i.e. based on a 99.95% confidence level over a one-year horizon.
The MVaR limits are managed by ALCO Insurance at the relevant organisational level. The Group Insurance ALCO determines the aggregate limit and ensures that the Group stays within the limit and allocates the sub-limits to business lines, with similar roles for the business line and business unit ALCO’s. Limit breaches by business lines are reported to ALCO Insurance and resolved in accordance with the policy within the next quarter.
CIRM consolidates and monitors the MVaR exposures of the business lines including diversification effects on a quarterly basis. Together with ING Capital Management, MVaR is managed within the limits. In 2008 and 2007 there were no breaches of the overall ING Insurance MVaR limit.
Real EstateReal Estate price risk arises from the possibility that real estate prices will fluctuate affecting the value of real estate assets.
ING Insurance has two different categories of real estate exposure on its insurance books. First, ING Insurance owns buildings it occupies. Second, ING Insurance has invested capital in several real estate funds and direct real estate assets. A decrease in real estate prices will cause the value of this capital to decrease and as such ING Insurance is exposed to real estate price shocks.
The crisis in the financial markets could lead to a further slowdown of the world economy in general. These global economic factors could also have future negative consequences for the value of real estate assets.
Risk management (continued)
ING Group Annual Report 2008
208
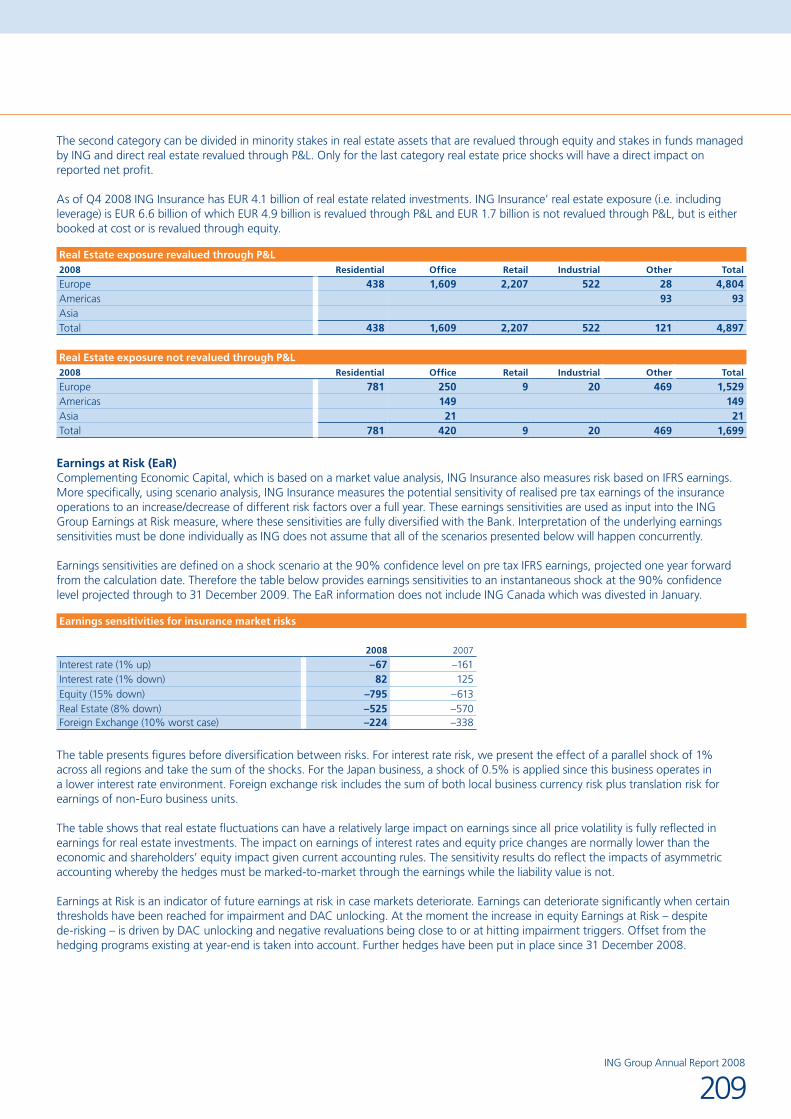
The second category can be divided in minority stakes in real estate assets that are revalued through equity and stakes in funds managed by ING and direct real estate revalued through P&L. Only for the last category real estate price shocks will have a direct impact on reported net profit.
As of Q4 2008 ING Insurance has EUR 4.1 billion of real estate related investments. ING Insurance’ real estate exposure (i.e. including leverage) is EUR 6.6 billion of which EUR 4.9 billion is revalued through P&L and EUR 1.7 billion is not revalued through P&L, but is either booked at cost or is revalued through equity.
Real Estate exposure revalued through P&L2008 Residential Office Retail Industrial Other Total
Europe 438 1,609 2,207 522 28 4,804Americas 93 93AsiaTotal 438 1,609 2,207 522 121 4,897
Real Estate exposure not revalued through P&L2008 Residential Office Retail Industrial Other Total
Europe 781 250 9 20 469 1,529Americas 149 149Asia 21 21Total 781 420 9 20 469 1,699
Earnings at Risk (EaR)Complementing Economic Capital, which is based on a market value analysis, ING Insurance also measures risk based on IFRS earnings. More specifically, using scenario analysis, ING Insurance measures the potential sensitivity of realised pre tax earnings of the insurance operations to an increase/decrease of different risk factors over a full year. These earnings sensitivities are used as input into the ING Group Earnings at Risk measure, where these sensitivities are fully diversified with the Bank. Interpretation of the underlying earnings sensitivities must be done individually as ING does not assume that all of the scenarios presented below will happen concurrently.
Earnings sensitivities are defined on a shock scenario at the 90% confidence level on pre tax IFRS earnings, projected one year forward from the calculation date. Therefore the table below provides earnings sensitivities to an instantaneous shock at the 90% confidence level projected through to 31 December 2009. The EaR information does not include ING Canada which was divested in January.
Earnings sensitivities for insurance market risks
2008 2007
Interest rate (1% up) –67 –161Interest rate (1% down) 82 125Equity (15% down) –795 –613Real Estate (8% down) –525 –570Foreign Exchange (10% worst case) –224 –338
The table presents figures before diversification between risks. For interest rate risk, we present the effect of a parallel shock of 1% across all regions and take the sum of the shocks. For the Japan business, a shock of 0.5% is applied since this business operates in a lower interest rate environment. Foreign exchange risk includes the sum of both local business currency risk plus translation risk for earnings of non-Euro business units.
The table shows that real estate fluctuations can have a relatively large impact on earnings since all price volatility is fully reflected in earnings for real estate investments. The impact on earnings of interest rates and equity price changes are normally lower than the economic and shareholders’ equity impact given current accounting rules. The sensitivity results do reflect the impacts of asymmetric accounting whereby the hedges must be marked-to-market through the earnings while the liability value is not.
Earnings at Risk is an indicator of future earnings at risk in case markets deteriorate. Earnings can deteriorate significantly when certain thresholds have been reached for impairment and DAC unlocking. At the moment the increase in equity Earnings at Risk – despite de-risking – is driven by DAC unlocking and negative revaluations being close to or at hitting impairment triggers. Offset from the hedging programs existing at year-end is taken into account. Further hedges have been put in place since 31 December 2008.
209ING Group Annual Report 2008
2.1 Consolidated annual accounts
ING INSURANCE – LIQUIDITY RISKAs with other ING Insurance market risk, liquidity risk falls under the supervision of the ALCO function. Liquidity risk is the risk that ING Insurance or one of its subsidiaries cannot meet its financial liabilities when they come due, at reasonable cost and in a timely manner. ING Insurance monitors structural, tactical and contingency liquidity risk and tests adverse scenarios to measure its resiliency against these risks. The severe economic downturn in late 2008 has caused liquidity risk to increase substantially. To manage these risks, ING Insurance has increased its allocation to liquid assets.
ING INSURANCE – INSURANCE RISKSGeneralActuarial and underwriting risks are risks such as mortality, longevity, morbidity, adverse motor or home claims development, etc., which result from the pricing and acceptance of insurance contracts. In general, these risks cannot be hedged directly in the financial markets and tend to be mitigated by diversification across large portfolios. They are therefore primarily managed at the contract level through standard underwriting policies, product design requirements as set by ING’s IRM function, independent product approval processes and risk limitations related to insurance policy terms and conditions agreed with the client.
MeasurementFor portfolio risks which are not mitigated by diversification, the risks are managed primarily through concentration and exposure limits and through reinsurance and/or securitisation. Aggregate portfolio level limits and risk tolerance levels are set in reference to potential losses stemming from adverse claims in ING’s insurance portfolios which are reviewed annually by the ING Group Executive Board. ING Group has established actuarial and underwriting risk tolerance levels in specific areas of its insurance operations as described below. For non-life insurance, risk tolerance levels are set by line of business for catastrophic events (e.g. natural perils such as storms, earthquakes and floods) and for individual risks.
For the main non-life units (in the Benelux and Canada) the risk tolerance for property and casualty (P&C) business is generally set at 2.5% of the Group’s expected after-tax earnings. For 2008, this translated into an aggregated (pre-tax) risk tolerance level of EUR 265 million for the Benelux (2007: EUR 235 million). For Canada the pre-tax risk tolerance level is set at EUR 244 million (derived from the above mentioned EUR 265 million, but allowing for outside interests) (2007: EUR 214 million). For the first half of 2008 the risk tolerance limit of EUR 265 million also applied to Mexico.
In order to determine how much reinsurance protection is required in each of the regions, these risk tolerance limits are compared to the estimated maximum probable loss resulting from catastrophic events with a 1 in 250 probability of occurrence which is in line with industry practice. The maximum probable loss estimates for Fire business are based on risk assessment models that are widely accepted in the industry.
For the smaller non-life units, the (pre-tax) risk tolerance level for catastrophe related events for 2008 was set at EUR 5 million (2007: EUR 5 million) per event per business unit.
With respect to life business, ING Group’s (pre-tax) risk tolerance level for 2008 was set at EUR 22 million (2007: EUR 22 million) per insured life for mortality risk. While life insurance risks are considered to be naturally diversifiable by virtue of each life being a separate risk, group contracts may result in significant exposures. For potential losses, resulting from significant mortality events (e.g. pandemics or events affecting life insurance contracts involving multiple lives), ING applies a separate risk tolerance level which equalled EUR 1,100 million in 2008 (2007: EUR 750 million). The potential impact of pandemics continues to be modelled by ING based on studies published by respected international organisations.
Overall exposures and concentrations are actively managed within limits and risk tolerance levels through the purchase of external reinsurance from approved reinsurers in accordance with ING’s reinsurance credit risk policy. Particularly for the property and casualty portfolio, ING purchases protection which substantially mitigates ING’s exposure due to natural catastrophes. ING believes that the credit risks to which it is exposed under reinsurance contracts are minor, with exposures being monitored regularly and limited by a reinsurance credit risk policy.
For catastrophic losses arising from events such as terrorism, ING believes that it is not possible to develop models that support inclusion of such events in underwriting in a reliable manner. The very high uncertainty in both the frequency and severity of these events makes them, in ING’s opinion, uninsurable. For the non-life business, losses that result from these events are generally not covered unless required by law. In various countries industry pools have been established to mitigate the terrorism risk to which the individual insurers are nevertheless still exposed. ING participates in such pools.
Risk management (continued)
ING Group Annual Report 2008
210

The following table provides an overview of the Economic Capital for insurance risks, split into mortality risk, morbidity risk and risk related to P&C products:
Economic Capital Insurance risks
2008 2007
Mortality 781 803Morbidity 483 2,141P&C 293 349Total 1,557 3,293
The mortality risk relates to the potential for increasing deaths (life risk) or decreasing deaths (longevity risk). This risk relates to a potential mortality catastrophe or to changes in long term mortality rates. As noted, ING manages these risks via limits and external reinsurance. Morbidity risk relates to disability products in the Netherlands and some health riders sold in Asia. The decrease in morbidity risk capital relates to the sale of ING Life Taiwan, which had a block of guaranteed health riders providing benefits for 30-60 years into the future. Finally, property and casualty risk exists primarily in Canada and the Benelux.
Through scenario analyses, ING Insurance measures the sensitivity of pre-tax earnings of the insurance operations to an increase/decrease of the insurance risk factors over a one year period. These changes to earnings can relate to realised claims or any other profit item that would be affected by these factors. ING assumes that not all the shifts presented below will happen at the same time.
Earnings sensitivities are defined on a shock scenario at the 90% confidence level on pre-tax IFRS earnings, projected one year forward from the calculation. Therefore the table below provides earnings sensitivities to an instantaneous shock at the 90% confidence level projected through to 31 December 2008. The EaR information does not include ING Canada which was divested in January.
Earnings sensitivities for Insurance risks
2008 2007
Mortality –61 –54Morbidity –105 –124P&C –49 –132
The table above presents figures after diversification between insurance risks and diversification across business units of ING Insurance. The largest earnings sensitivity to P&C claims relates to health and P&C claims in the Netherlands.
ING INSURANCE – CREDIT RISKSThe credit risks in the general accounts portfolio within ING Insurance are subject to the same principles, policies, definitions and measurement as those of the banking operations. The credit risks are measured and monitored by Corporate Credit Risk Management (CCRM) as well as local credit risk managers within the various locations where credit risk is taken within ING Insurance and ING Investment Management. Within ING Insurance, the goal is to maintain a low risk, well diversified credit risk portfolio that meets or exceeds market based benchmark returns.
ING Insurance’s credit exposure arises from the investment of insurance premiums in assets subject to credit risk, largely in the form of unsecured bond investments, and smaller amounts of residential mortgages and structured finance products. In addition, credit exposure also arises from derivatives, sell/repurchase transactions, securities lending/borrowing and reinsurance contracts used to hedge the portfolio. ING Insurance has a policy of maintaining a high quality investment grade portfolio.
Overall portfolio credit risk limits are established and integrated into investment mandates by ALCO Insurance based on asset or investment category and risk classes. Individual issuer limits are determined based on the obligor’s rating. These limits are managed by the region where the parent company is domiciled but may be sub-allocated to regional or local portfolios. In addition, each Insurance company has one or more investment mandates that may differ by insurance portfolio specify credit risk appetite by issuer type and quality.
The credit risk classification of issuers, debtors and counterparties within the Insurance companies’ credit risk portfolios continues its transition to the methodology used by the banking operations. Similar to ING Bank, ING Insurance uses risk classes which are calibrated to the probability of default of the underlying issuer, debtor or counterparty. These ratings are defined based upon the quality of the issuer in terms of creditworthiness, varying from investment grade to problem grade expressed in S&P equivalents.
211ING Group Annual Report 2008

2.1 Consolidated annual accounts
Risk classes: ING Insurance portfolio, as % of total outstandings (1)
Insurance Americas Insurance Europe Insurance Asia/Pacific Total ING Insurance2008 2007 2008 2007 2008 2007 2008 2007
1 (AAA) 27.5% 27.9% 34.8% 28.8% 5.3% 10.7% 27.2% 25.5%2-4 (AA) 19.6% 18.5% 20.2% 26.9% 29.6% 37.3% 21.1% 24.6%5-7 (A) 18.9% 22.3% 23.5% 21.7% 43.1% 32.8% 23.7% 23.8%8-10 (BBB) 20.0% 18.4% 9.3% 11.1% 9.6% 6.9% 14.8% 13.9%11-13 (BB) 5.2% 2.9% 10.7% 10.0% 0.9% 3.4% 6.6% 5.5%14-16 (B) 5.0% 5.0% 1.2% 1.0% 9.4% 6.1% 4.2% 3.7%17-22 (CCC & Problem Grade) 3.8% 5.0% 0.3% 0.5% 2.1% 2.8% 2.4% 3.0%
100.0% 100.0% 100.0% 100.0% 100.0% 100.0% 100.0% 100.0%(1) Based on credit risk measurement contained in lending, pre-settlement, money market and investment activities.
The ratings reflect probabilities of default and does not take collateral into consideration.
ING Insurance risk class distribution remained fairly stable during 2008. The shift from AA to AAA at Insurance Europe is the result of data quality improvements. The deterioration in Asia/Pacific is due to the divestment of ING Life Taiwan.
Risk concentration: ING Insurance portfolio, by economic sector (1)
Insurance Americas Insurance Europe Insurance Asia/Pacific Total ING Insurance2008 2007 2008 2007 2008 2007 2008 2007
Non-Bank Financial Institutions 53.3% 52.3% 26.4% 19.6% 18.7% 16.8% 39.1% 34.7%Central Governments 3.2% 1.7% 33.7% 35.8% 22.7% 38.7% 16.6% 20.1%Commercial Banks 6.2% 11.0% 12.8% 8.1% 23.7% 16.2% 10.8% 10.8%Private Individuals 3.5% 3.5% 10.5% 13.9% 11.8% 7.8% 7.1% 7.9%Real Estate 8.7% 7.9% 1.7% 1.6% 2.0% 1.6% 5.4% 4.6%Utilities 4.0% 4.0% 1.7% 1.4% 4.0% 2.9% 3.2% 2.9%Natural Resources 3.5% 3.5% 0.6% 1.1% 1.6% 1.4% 2.2% 2.3%Other 17.6% 16.1% 12.6% 18.5% 15.5% 14.6% 15.6% 16.7%
100.0% 100.0% 100.0% 100.0% 100.0% 100.0% 100.0% 100.0%(1) Based on credit risk measurement contained in lending, pre-settlement, money market and investment activities.
The ratings reflect probabilities of default and does not take collateral into consideration.
Overall risk concentrations remained stable in 2008 for ING Insurance with a small shift towards Commercial Banks as a result of increased equity derivatives trading business at Insurance Europe. Private Individuals in Europe decreased, due to the sale of EUR 4.5 billion in residential mortgages to Retail Banking (Nationale Nederlanden Hypotheek Bedrijf). Food, Beverages and Personal Care accounted for 2.5% in 2007, but fell below the 2.0% threshold in 2008. All other industries not shown in the table above have less than 2.0% concentrations. Largest economic exposures: ING Insurance portfolio, by country (1, 2)
amounts in billions of euros Insurance Americas Insurance Europe Insurance Asia/Pacific Total ING Insurance2008 2007 2008 2007 2008 2007 2008 2007
United States 58.6 56.2 2.0 1.7 1.1 2.3 61.7 60.2Netherlands 0.8 0.7 14.6 22.0 0.2 0.3 15.6 23.0France 0.3 0.4 6.8 5.9 0.1 0.5 7.2 6.8Italy 0.3 0.3 5.9 6.4 0.2 0.2 6.4 6.9South Korea 0.1 0.1 6.2 6.6 6.3 6.7United Kingdom 1.8 1.9 3.5 3.1 0.4 0.4 5.7 5.4Germany 0.3 0.3 5.3 6.1 0.1 0.3 5.7 6.7Canada 5.5 6.0 0.1 0.1 5.6 6.1(1) Only covers total exposures in excess of EUR 5 billion, including intercompany exposure with ING Bank.(2) Country is based on the country of residence of the obligor.
The portfolio in the Netherlands decreased principally due to the sale of residential mortgages to Retail Banking (Nationale Nederlanden Hypotheek Bedrijf). There were no other significant shifts in the portfolio concentration.
Risk management (continued)
ING Group Annual Report 2008
212
ING GROUP – NON-FINANCIAL RISKS In addition to the above financial risks (credit, market, insurance and liquidity risk) the next paragraphs describe the non-financial risks, being operational and compliance risks.
OPERATIONAL RISKSOperational risk is the risk of direct or indirect loss resulting from inadequate or failed internal processes, people and systems or from external events. It includes the related risk of reputation loss, as well as legal risk whereas strategic risks are not included. Effective operational risk management leads to more stable business processes (including IT systems) and lower operational risk costs.ING recognises the following operational risk areas:
Control risk• is the risk of loss due to non-adherence to business policies or guidelines. Control risks can lead to losses incurred due to non-compliance with controls established in connection with items such as governance procedures, new product approval procedures, and/or project management methods. Control risk can stem from improper or insufficient monitoring of entities or activities. The risk of a loss caused by unauthorised employee activities, including -but not limited to- unauthorised approvals or overstepping •of authority are considered unauthorised activity risk.Processing risk• deals with the risk of losses due to failed transaction processing or process management. These events are normally not intentional and usually involve documenting or completing current business transactions.Employment practice risk• is the risk of loss due to actions which are consistent with employment, health or safety laws, or agreements, from payment of personal injury claims or from diversity/discrimination events. Managing this risk means: meeting health and workplace regulations; preventing discrimination and harassment; and in case this does happen, taking adequate counter measures.Personal and physical security risk• is the risk of criminal and environmental threats that might endanger the security of ING personnel (within and outside ING locations, while travelling or being expatriated) and ING assets or might have an impact on the ING organisation.Information (Technology) risk• is the risk of loss due to inadequate information security, resulting in a loss of information confidentiality and/or integrity and/or availability. Aspects of information (technology) risks are user access controls, platform security controls, change management controls, sourcing controls, security monitoring controls and fundamental information security controls.Continuity risk• is the risk of events (e.g. natural disasters, power outages, terrorism) leading to a situation that threatens the continuation of business (including people and assets).Internal and external fraud risk• is the risk of loss due to deliberate abuse of procedures, systems, assets, products and/or services of ING by those who intend to deceitfully or unlawfully benefit themselves or others.
Clear and accessible policies and minimum standards are embedded in ING business processes in all business lines. An infrastructure is in place to enable management to track incidents and operational risk issues. A comprehensive system of internal controls creates an environment of continuous improvement in managing operational risk. ING uses this knowledge (including lessons learned from incidents) to improve the control of key processes.
Organisation of Operational Risk ManagementThe General Manager Corporate Operational Risk management (CORM) reports directly to the CRO and is responsible for managing operational risks and developing and establishing the Operational Risk Framework within ING Group, ING Bank and ING Insurance. The General Manager Corporate ORM also establishes and approves the Minimum Standards, and assists and supports the Executive Board in managing ING’s operational risks. The ORM function is organised along functional reporting lines. The Business Line operational risk managers report functionally to the General Manager CORM.
The CORM function consists of functional departments for operational risks & risk reporting, for Information (Technology) risks, for Security & Investigations and for SOX testing. The CORM function is responsible for developing and communicating ING’s operational risk framework, policies, minimum standards and guidelines. The corporate function advises the business line ORM staff, monitors the quality of operational risk management and co-ordinates the group-wide reporting of operational risks to the Executive Board.
ORM uses a layered functional approach within business lines to ensure systematic and consistent implementation of the group-wide ORM framework, policies and minimum standards. The local and regional/division ORM Officer has the responsibility to assist local and regional/division management in managing operational risk. The business line ORM officer has a monitoring role in the operational risk management process and manages and supervises all functional activities of the ORM officers in the business line and region/division.
To avoid potential conflicts of interests, it is imperative that the ORM officer is impartial and objective when advising business management on operational risk matters in their business unit or business line. To facilitate this, a strong functional reporting line to the next higher level ORM officer is in place. The functional reporting line has clear accountabilities with regard to objective setting, remuneration, performance management and appointment of new ORM staff.
213ING Group Annual Report 2008

2.1 Consolidated annual accounts
Operational risk frameworkING has developed a comprehensive framework supporting and governing the process of identifying, mitigating, measuring and monitoring operational risks thus reflecting the stages described in the COSO model (Committee of Sponsoring Organisations of the Treadway Commission). Generic mandatory controls are described in the ORM policy house. The policies have been refreshed in 2008 and are structured in line with the risk areas. Each policy has one or more minimum standards.
1. Governance1. Governance
6. Control activities
7. In
form
atio
n &
Co
mm
un
icat
ion
8. Risk m
on
itorin
g
2. Objective setting
3. Event identification
4. Risk assessment
5. Risk response
At all levels in the organisation Operational Risk Committees (ORCs) are established that identify, measure and monitor the operational risks of the region or business unit with appropriate quality of coverage (granularity) and to ensure that appropriate management action is taken by the responsible line managers at the appropriate level of granularity. ORCs, chaired by the business management, steer the risk management activities of the first and second line of defence in their entities. On a group level the Operational & Residual Risk Committee approves the operational risk capital model.
The operational risk appetite within ING is defined as the acceptable and authorised maximum level of risk, in each of the operational risk areas that must be adhered to in order for ING to achieve its business plan within approved budgets. This risk appetite is monitored quarterly through the Non-Financial Risk Dashboard which reports the key risk exposures.
Processes are in place to identify key threats, vulnerabilities and the associated risks which might cause adverse events. Event identification is performed proactively and precedes a risk assessment. Different techniques for event identification exist within ING, e.g. the Integrated Risk Assessment (IRA), scenario analysis, external events inventories, internal event analysis (e.g. based on information from incident reporting), key risk indicator events and threat scans.
At least once a year all business units perform an integrated risk assessment with involvement of other risk departments such as Compliance and Legal.
Based on the results of the risk assessment, response measures must be determined for the identified risks. Risk response actions balance the expected cost for implementing these measures with the expected benefits regarding the risk reduction. Risk response can be achieved through several combinations of mitigation strategies, for example reducing likelihood of occurrence, reducing impact, risk avoidance, risk acceptance or through the transfer of risk. Tracking takes place through the global Audit Outstanding scan system.
Certain operational risks can best be transferred to the insurance market if risks are high but difficult to mitigate internally. In order to protect ING against financial consequences of uncertain operational events ING has acquired insurance policies issued by third-party insurers with world-wide cover for (Computer) Crime, Professional Liability, Directors and Officers Liability, Employment Practices Liability and Fiduciary Liability. The portion of the risks that ING retains is of a similar magnitude to the risk retained for casualty business-related catastrophe exposures.
Control activities are defined as the control measures that have been implemented and are maintained. Generic mandatory controls are described in the ORM policy house.
Management at all levels in the organisation periodically need information on their key operational risks (including compliance and legal risks) and mitigating actions. In order to make it easier for management to access this kind of information, the Non-Financial Risk Dashboard (NFRD) was developed and rolled out in 2008 to all business units.
Risk management (continued)
ING Group Annual Report 2008
214

To ensure robust operational risk management ORM develops and communicates the ORM framework, policies and guidance throughout ING Group and monitors the key risks of ING Group to ensure that ING’s risk policies and Minimum Standards are fully implemented. Business units have to demonstrate that the appropriate steps have been taken to control their operational risk. ING applies scorecards to measure the quality of management of the operational risk processes within a business unit. Scoring is based on the ability to demonstrate that the required risk management processes are in place with the business units. The scorecards indicate the level of control within the business units. These scorecards are integral part of ING’s Dutch Central Bank approved regulatory capital model (AMA).
The Operational Risk Capital model of ING is based on a Loss Distribution Approach (LDA). The Loss Distribution is based on both external and internal loss data exceeding EUR 1 million. The model is adjusted for the scorecard results taking into account the specific quality of control in a business line and the occurrence of large incidents (‘bonus/malus’). This provides an incentive to local (operational risk) management to better manage operational risk. From 2008 onwards, the model is used for regulatory capital reporting purposes as well. ING received approval for its Advanced Measurement Approach (AMA) from the Dutch Central Bank.
Developments in 2008Enhancements of the Non-financial Risk DashboardThe introduction of a Non-financial Risk Dashboard (NFRD) was given priority by the Chief Risk Officer (CRO) with the aim to keep focus on the key risk exposures when looking at the risk faced by business. The objective of the NFRD is to deliver comprehensive and integrated risk information on Operational, Compliance and Legal Risk, using a consistent approach and risk language at all levels in the organisation. It gives management an overview of all key risks within their jurisdiction with forced ranking and a clear description of the risks and responses so that they can balance priorities. This supports the ING strategy for making things ‘easier’ whereby management is better able to manage risk and give priority where it is necessary.
Corporate Operational Risk Management, in close coordination with Group Compliance Risk Management and Corporate Legal, has been rolling out the NFRD in the ING organisation. The NFRD covers all BUs in the ING organisation. A number of existing risk reports, e.g. the IT Risk & Control report, Compliance report and the Incident report, have been integrated into the NFRD.
The NFR Dashboard was presented to the Executive Board and the Audit Committee in November 2008. As of the fourth quarter 2008 report, the quarterly NFRD will be a recurring agenda point in Executive Board and Audit Committee meetings.
Product Approval ProcessING has revised the Product Approval Process (PAP) Minimum Standard to ensure that adequate risk assessment procedures are executed prior to the development and/or launch of new or modified products. The PAP ensures that adequate controls are put in place to manage the inherent risks associated with new products, related processes and system implementation, and other initiatives.
IT Risk forecastingAn IT risk forecasting model is introduced to represent the expected IT risk profile after implementation of defined mitigating actions. Through the model, management can determine if additional mitigation projects are necessary to reduce or to maintain the IT risks at an acceptable level.
Continuity riskAs a risk response to mitigate the risk of power supply failure in one of the data centres ING accelerated an improvement programme for the business continuity and disaster recovery capability and platform security of its data centres.
Fraud risksBased on the Corporate Anti-Fraud policy each business unit had to conduct a fraud-risk assessment and translated this into an anti-fraud implementation plan (to prevent both internal and external fraud). In reaction to the SocGen incident ING initiated a project aiming to further mitigate all trading risk related fraud risks.
Refreshment of policies and standardsORM policies and Minimum Standards have been further enhanced to fully encompass the integrated approach of Operational, Compliance and Legal risks (between risk departments and along functional lines). All major IT risk policies and standards have been re-assessed against the current internal and external threats and adapted consequently.
COMPLIANCE RISKCompliance Risk is defined as the risk of damage to ING’s integrity as a result of failure (or perceived failure) to comply with relevant laws, regulations, internal policies and procedures or ethical standards. In addition to reputational damage, failure to effectively manage Compliance Risk can expose financial institutions to fines, civil and criminal penalties, payment of damages, court orders and suspension or revocation of licenses. A failure (or perceived failure) can adversely impact customers, staff and shareholders of ING.
215ING Group Annual Report 2008

2.1 Consolidated annual accounts
ING believes that fully embedded Compliance Risk Management preserves the trust its customers, shareholders and staff have in ING and is important for the way ING does business. Managing Compliance Risk is fundamental to driving value. The pursuit of long term business sustainability requires proper conduct of business activities in accordance with the high ethical standards of ING’s Business Principles. These principles not only reflect laws and regulations, but are also based on ING’s core values: integrity, entrepreneurship, professionalism, responsiveness and teamwork.
Clear and accessible policies and procedures are required to be implemented in ING business processes in all Business Lines. An infrastructure is in place to enable management to track current and emerging Compliance Risk issues, to communicate these to internal and external stakeholders, and to drive continuous improvement. ING understands that good Compliance Risk Management involves understanding and delivering on the expectations of customers and other stakeholders, thereby improving the quality of key relationships based on honesty, integrity and fairness.
The Scope of the Compliance Risk Management functionThe Compliance Risk Management function focuses on managing the risks arising from laws, regulations and standards which are specific to the financial services industry and which are issued by legislative and regulatory bodies relevant to ING’s businesses, or by ING Corporate Compliance Risk Management. The Compliance Risk Management function actively educates and supports the business in managing areas such as anti-money laundering, preventing terrorist financing, conflicts of interest management, sales and trading conduct and customer interest and protection.
ING separates Compliance Risk into four conduct-related integrity risk areas, shown below with examples of sub-risks in each risk area:
Client Related Integrity RiskPersonal Conduct Related Integrity Risk
Organisational Conduct Related Integrity Risk
Financial Services Conduct Related Integrity Risk
Money laundering•Terrorist financing•Political or reputational •exposed personClient engagements •or transactions with sanctioned countries
Market abuse & •personal tradingBreaches of the ING Business •Principles or local code of conductOutside positions •by ING officersGifts or entertainment given •or received; briberyExternal incident reporting•
Organisational conflicts of •interest, market abuse and insider tradingAnti-trust/competition law•New or modified products •and services (e.g. customer base, design) and governance changesAgreed sector/industry •standardsRegulatory registration and •reporting requirements
Marketing, sales & •trading conductConduct of advisory business•Complaint handling•Transparency of product •offerings (e.g. costs, disclosures)Data protection/privacy•Third party intermediaries •as representatives of ING
To ensure that staff is protected when raising issues and to help identify Compliance Risks, ING has a Whistleblower procedure which encourages staff to speak up if they know of or suspect a breach of external regulations or internal policies or business principles.
The organisation of Compliance Risk ManagementThe Chief Compliance Officer (CCO) reports directly to the CRO and is responsible for developing and establishing the company-wide Compliance Risk Management Charter & Framework. The CCO also establishes the Minimum Standards for managing Compliance Risks and assists and supports the Executive Board in managing ING’s Compliance Risks. The Compliance Risk Management function is organised hierarchically at the Corporate Level and along functional reporting lines in the Business Lines. It is part of the second line in ING’s three lines of defence model.
The Group Compliance Risk Management function is made up of Corporate Compliance Risk Management and Business Line Compliance with the CCO and a Reporting and Analytics team overseeing both areas. Corporate Compliance Risk Management is responsible for developing and communicating ING’s Group Compliance Risk Management Charter and Framework, policies and guidance for key areas of Compliance Risk and provides advice to Business Line Compliance staff on Group policy matters.
ING uses a functional approach within Business Lines to ensure systematic and consistent implementation of the company-wide Charter & Framework and Minimum Standards and related policies and procedures. The local Compliance Officer has the responsibility to assist local management in managing Compliance Risk within that business unit. The regional or division Compliance Officer has a management and supervisory role of all functional activities of the Compliance Officers in the respective region or division. The Business Line Compliance Officers perform this task for their Business Line and also provide leadership and overall direction to the regional or divisional Compliance Officers.
Risk management (continued)
ING Group Annual Report 2008
216

To avoid potential conflicts of interests, it is imperative that the Compliance Officer is impartial and objective when advising business management on Compliance Risk in their Business Unit, region, division or Business Line. To facilitate this, a strong functional reporting line to the next higher level Compliance Officer is in place. The functional reporting line has clear accountabilities relating to objective setting, remuneration, performance management and the appointment of new Compliance Risk Management staff as well as vetoing and escalation.
Compliance Risk Management Policies and ToolsThe responsibility of the Compliance Risk Management function is, in accordance with the Charter and Framework, to proactively:
Identify, assess, monitor and report on the Compliance Risks faced by ING;•Assist, support and advise management in fulfilling its responsibilities to manage Compliance Risks;•Advise any employee or officer with respect to their (personal) obligations to manage Compliance Risks.•
The Framework consists of three key components: the Compliance Chart, an Advisory component and the Scorecard as illustrated below
Compliance Risk Management Framework
The chart
Risk assessment
Compliance risk
mitigation
Compliance risk
monitoring
Compliance risk
reporting
Identification ofcompliance risk
obligations
1
25
34
ADVISORY & SCORECARD
A. The ChartThe Chart is an output from five key activities carried out in accordance with the requirements of the Framework:1. Identification of Compliance Risk Obligations;2. Risk Assessment;3. Compliance Risk Mitigation (includes Training and Education);4. Compliance Risk Monitoring (includes Action Tracking);5. Compliance Risk Reporting (includes Incident Management).
B. AdvisoryCompliance Officers proactively advise their CEO, Management, local boards and committees, the next higher level Compliance Officer, and employees on Compliance Risk, responsibilities, obligations and concerns.
C. ScorecardThe Compliance Risk Management function works with the Operational Risk Management Scorecard process to evaluate how well the Compliance Risk Management Framework is embedded in each business. Scoring is based on the ability of the business unit to demonstrate that the required policies and procedures are implemented. The scoring indicates the level of control within the business units and the result is integrated with the Operational Risk Management results into ING’s Dutch Central Bank approved regulatory capital model (AMA).
Developments in 2008– ING Compliance Risk Management’s revised Charter and FrameworkIn August the Executive Board of ING issued the ING Group Compliance Risk Management Charter and Framework (‘Charter and Framework’) to help businesses more effectively manage their Compliance Risks expectations. The fundamental requirements of the 2005 ‘Compliance Policy and Minimum Standards’ remain and are enhanced in terms of changing Board and stakeholder expectations. The Charter states the roles and responsibilities for managing Compliance Risk.
217ING Group Annual Report 2008

2.1 Consolidated annual accounts
The Charter and Framework and the supporting documentation were produced in close collaboration with the Business Lines, Legal and Compliance Risk Management and business leaders.
– Updated FEC Policy and GuidanceThe ING Group Financial Economic Crime (FEC) Policy provides a clear statement on Financial Economic Crime in order to guard against any involvement in criminal activity, and to participate in international efforts to combat money laundering and the funding of terrorist and criminal activities. The FEC Policy has been updated in 2008 explicitly recognising the differences between business lines and their inherent FEC related risk, without lowering existing standards. A risk-based approach allows each Business Line to identify the criteria to measure potential money laundering risks and implement proportionate measures and controls to mitigate these risks. Managing Compliance Risk in accordance with the ING Group FEC Policy and Minimum Standards is required.
The FEC Minimum Standards are the basis for (local) procedures covering:Customer Due Diligence and Know Your Customer;•Anti-Money Laundering and Anti-Terrorist Financing.•
– Compliance Risk Management Training and EducationIn 2008, Compliance Risk Management has developed and is executing several global training programmes, including: 1. ‘Managing Compliance Risk in your Business’. This programme targets the top four echelons of management (approximately 13,500)
worldwide during 2008/2009. Managers attending the training will not only gain a deeper understanding of the effective embedding of ING’s three lines of defence model and the strategic value of Compliance Risk Management, but also learn practically what actions they can take to strengthen the management of Compliance Risk as well as how to apply the Framework and tools.
2. ‘MLRO Master Class’. This new training programme targeted approximately 200 Money Laundering Reporting Officers. The course aims to strengthen our MLROs’ understanding of the enhanced FEC and regulatory policy requirements.
3. ‘Compliance Officer Training’. This programme is designed for all Compliance Officers worldwide (approximately 750), across, and in cooperation with, all Business Lines. The training programme has sections on technical knowledge, personal effectiveness and skills.
Additionally, the e-Learning course ‘Compliance, more than money’ created in 2006 and made mandatory by the Netherlands Board for all ING employees in the Netherlands was refreshed. The follow-up course named ‘Compliance, part of our business’ takes into account changes in financial services laws and regulation and internal ING policies and procedures.
– Enhanced Business Aligned CommunicationsTo ensure continued awareness of the importance of effectively managing Compliance Risk a campaign entitled ‘Play to Win, Know the Rules’ was launched. The key message of the campaign is that managing Compliance Risk is an integral part of managing business and must be embedded into daily practice and business strategy. The campaign helps further drive understanding and behaviours relating to the management of Compliance Risk. It includes a one-pager with key messages for business teams, as well as a PowerPoint presentation and short videos by each Executive Board member stating why they believe managing Compliance Risk is integral to building sustainable businesses.
The four key messages defining good Compliance Risk Management are:knowing, understanding and applying the rules;•a culture where people are trusted and accountable;•effectively managing Compliance Risk in our businesses; and•vital for sustainable profitable growth – our licence to operate.•
Discussions with regulators and implementation of enhanced compliance and risk management proceduresING Bank N.V. has continued discussions with its Dutch bank regulator De Nederlandsche Bank (DNB) related to transactions involving persons in countries subject to sanctions by the EU, the US and other authorities and its earlier review of transactions involving sanctioned parties. In connection with that review and related discussions ING Bank has undertaken to complete the global implementation of enhanced compliance and risk management procedures, and to monitor the implementation of such procedures on an ongoing basis, as instructed by DNB. ING Bank also remains in discussions with authorities in the US and in other jurisdictions concerning these matters, including with respect to ongoing information requests, and it is not possible to predict at this time the outcome thereof. Financial institutions continue to experience close scrutiny by regulatory authorities, governmental bodies, shareholders, rating agencies, customers and others to ensure they comply with the relevant laws, regulations, standards and expectations. Bank and insurance regulators and other supervisory authorities in Europe, the US and elsewhere continue to oversee the activities of financial institutions to ensure that they operate with integrity and conduct business in an efficient, orderly and transparent manner. ING seeks to meet the standards and expectations of regulatory authorities and other interested parties through a number of initiatives and activities, including scrutinizing account holder information, payment processing and other transactions to support compliance with regulations governing money-laundering, economic and trade sanctions, bribery and other corrupt practices. The failure or perceived failure by ING
Risk management (continued)
ING Group Annual Report 2008
218

to meet applicable standards in these areas could result in, among other things, suspension or revocation of ING’s licenses, cease and desist orders, fines, civil or criminal penalties and other disciplinary action which could materially damage ING’s reputation and financial condition, and accordingly ING’s primary focus is to support good business practice through its Business Principles and group policies.
Discontinuation of business with certain countriesAs a result of our frequent evaluation of all businesses from economic, strategic and risk perspectives ING continues to believe that for business reasons doing business involving certain specified countries should be discontinued, which includes that ING has a policy not to enter into new relationships with clients from these countries and processes remain in place to discontinue existing relationships involving these countries. At present these countries include Myanmar, North Korea, Sudan, Syria, Iran and Cuba. ING Bank N.V. is now in the final stages of liquidating the Netherlands Caribbean Bank, which is now a 100% owned subsidiary.
MODEL DISCLOSURESThe risk profile of ING Group, as described in the risk management section is captured by three key risk metrics:
Earning at Risk;•Capital at Risk;•Economic Capital.•
The analyses set out in the risk management section provide a valuable guide to investors as to the risk profile of ING Group. Users of the information should bear in mind that the analyses provided are forward looking measures that rely on assumptions and estimates of future events, some of which are considered extreme and therefore unlikely to occur. In the normal course of business ING Group continues to develop, recalibrate and refine the various models that support risk metrics, which may result in changes to the risk metrics as disclosed.
This model disclosure section explains the models applied in deriving these three metrics. The methodology to derive the Earnings at Risk and Capital at Risk metrics, as presented in the ING Group risk dashboard, is described first. Thereafter, the methodologies used to determine Economic Capital for ING Bank, ING Insurance and ING Group are described. The risk models used for the ING Bank and Insurance Economic Capital calculations and the ING Group risk dashboard are reviewed on a periodical basis and validated by the internal Model Validation department. The ING Bank Economic Capital calculation is also used as part of the Basel II Pillar 2 Internal Capital Adequacy Assessment Process (ICAAP) and the Supervisory Review and Evaluation Process (SREP) that is performed regularly by the Dutch Central Bank.
EARNINGS AND CAPITAL RISKEarnings at RiskEarnings at Risk (EaR) measures the potential reduction in IFRS earnings over the next year relative to expected IFRS earnings. EaR is measured using a 90% confidence level (i.e. ‘1 in 10’ stress scenario). Discretionary management interventions are not explicitly modelled unless their measurement can be based on historical performance tracking (e.g. regular or planned actions). It should be noted that the 90% confidence level used for EaR is not an absolute requirement, but regarded as a general guideline. For each major risk type the earnings sensitivities are calculated based on existing best-practice e.g. 1% instantaneous shock to interest rates. To reflect bottom-line IFRS earnings as close as possible in EaR measurement, the amount is compared to the forecasted earnings to determine risk appetite levels. The ING Bank credit risk component of EaR bank is adjusted for forecasted risk costs (addition to Loan Loss Provision).
The specific accounting treatments for AFS Debt Securities that requires a write down to market value regardless of the underlying estimated credit loss are not reflected under EaR. Also potential goodwill impairments are not included in the EaR determination.
Capital at RiskThe Capital at Risk (CaR) measures the potential reduction of the net asset value (based on fair values) over the next year relative to expected value. CaR is measured using a 90% confidence level (i.e. ‘1 in 10’ stress scenario). Discretionary management interventions are not explicitly modelled unless their measurement can be based on historical performance tracking (e.g. regular or planned actions).
Economic value is defined as the mark-to-market net asset value (assets less liabilities). For each major risk type the value sensitivities are calculated based on the existing Economic Capital methodology, applying the 90% confidence level. CaR risk appetite is measured against Available Financial Resources.
Aggregation model risk dashboardTo derive the Earnings at Risk and Capital at Risk figures at an ING Group level, the underlying risk inputs from the ING Bank and ING Insurance business units are aggregated bottom-up, using a combination of the ‘variance-covariance’ method and Monte Carlo simulation. For aggregation up to Group level, two sets of correlation assumptions are required, namely the Bank-Insurance correlations per risk type and inter-risk correlations.
The basic data input for the group risk dashboard is provided along 13 major risk types (e.g. equity risk Europe; see table below) and diversified within ING Bank or ING Insurance.
219ING Group Annual Report 2008
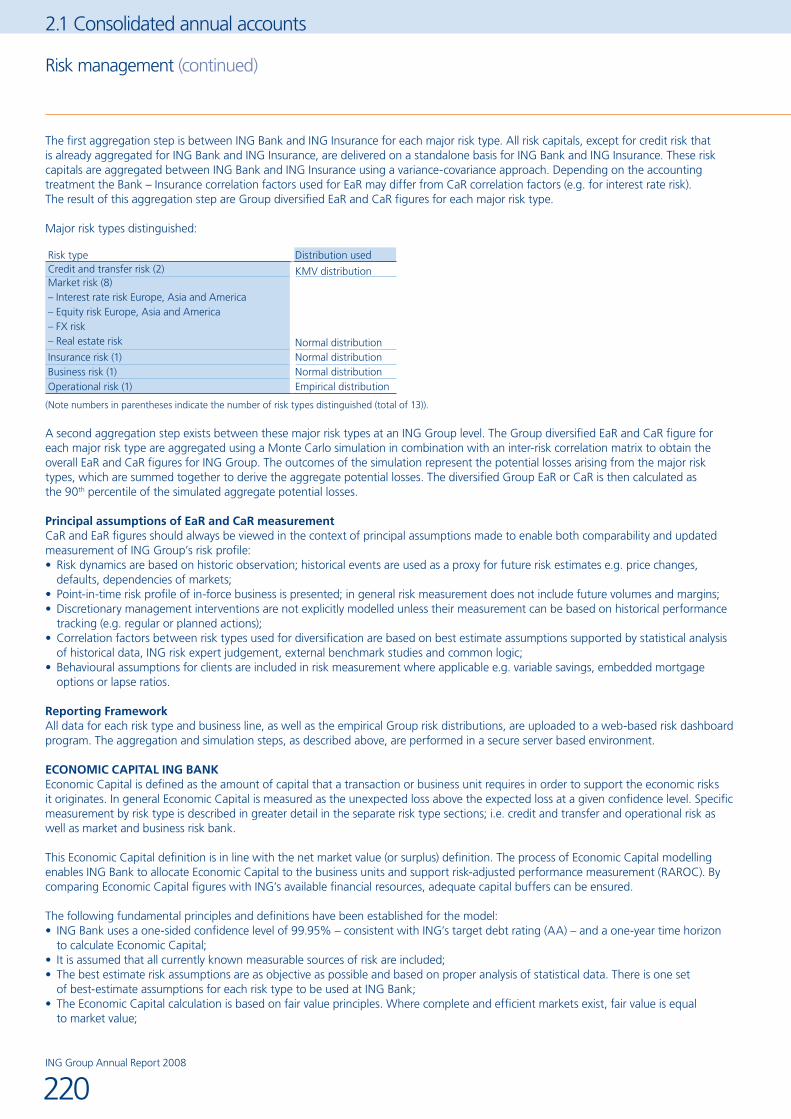
2.1 Consolidated annual accounts
The first aggregation step is between ING Bank and ING Insurance for each major risk type. All risk capitals, except for credit risk that is already aggregated for ING Bank and ING Insurance, are delivered on a standalone basis for ING Bank and ING Insurance. These risk capitals are aggregated between ING Bank and ING Insurance using a variance-covariance approach. Depending on the accounting treatment the Bank – Insurance correlation factors used for EaR may differ from CaR correlation factors (e.g. for interest rate risk). The result of this aggregation step are Group diversified EaR and CaR figures for each major risk type.
Major risk types distinguished:
Risk type Distribution usedCredit and transfer risk (2) KMV distributionMarket risk (8)– Interest rate risk Europe, Asia and America– Equity risk Europe, Asia and America– FX risk– Real estate risk Normal distributionInsurance risk (1) Normal distributionBusiness risk (1) Normal distributionOperational risk (1) Empirical distribution
(Note numbers in parentheses indicate the number of risk types distinguished (total of 13)).
A second aggregation step exists between these major risk types at an ING Group level. The Group diversified EaR and CaR figure for each major risk type are aggregated using a Monte Carlo simulation in combination with an inter-risk correlation matrix to obtain the overall EaR and CaR figures for ING Group. The outcomes of the simulation represent the potential losses arising from the major risk types, which are summed together to derive the aggregate potential losses. The diversified Group EaR or CaR is then calculated as the 90th percentile of the simulated aggregate potential losses.
Principal assumptions of EaR and CaR measurementCaR and EaR figures should always be viewed in the context of principal assumptions made to enable both comparability and updated measurement of ING Group’s risk profile:
Risk dynamics are based on historic observation; historical events are used as a proxy for future risk estimates e.g. price changes, •defaults, dependencies of markets;Point-in-time risk profile of in-force business is presented; in general risk measurement does not include future volumes and margins;•Discretionary management interventions are not explicitly modelled unless their measurement can be based on historical performance •tracking (e.g. regular or planned actions);Correlation factors between risk types used for diversification are based on best estimate assumptions supported by statistical analysis •of historical data, ING risk expert judgement, external benchmark studies and common logic;Behavioural assumptions for clients are included in risk measurement where applicable e.g. variable savings, embedded mortgage •options or lapse ratios.
Reporting FrameworkAll data for each risk type and business line, as well as the empirical Group risk distributions, are uploaded to a web-based risk dashboard program. The aggregation and simulation steps, as described above, are performed in a secure server based environment.
ECONOMIC CAPITAL ING BANKEconomic Capital is defined as the amount of capital that a transaction or business unit requires in order to support the economic risks it originates. In general Economic Capital is measured as the unexpected loss above the expected loss at a given confidence level. Specific measurement by risk type is described in greater detail in the separate risk type sections; i.e. credit and transfer and operational risk as well as market and business risk bank.
This Economic Capital definition is in line with the net market value (or surplus) definition. The process of Economic Capital modelling enables ING Bank to allocate Economic Capital to the business units and support risk-adjusted performance measurement (RAROC). By comparing Economic Capital figures with ING’s available financial resources, adequate capital buffers can be ensured.
The following fundamental principles and definitions have been established for the model:ING Bank uses a one-sided confidence level of 99.95% – consistent with ING’s target debt rating (AA) – and a one-year time horizon •to calculate Economic Capital;It is assumed that all currently known measurable sources of risk are included;•The best estimate risk assumptions are as objective as possible and based on proper analysis of statistical data. There is one set •of best-estimate assumptions for each risk type to be used at ING Bank;The Economic Capital calculation is based on fair value principles. Where complete and efficient markets exist, fair value is equal •to market value;
Risk management (continued)
ING Group Annual Report 2008
220

The Economic Capital calculations reflect known embedded options and the influence of client behaviour in banking products;•The Economic Capital calculations are on a pre-tax basis and do not consider the effect of regulatory accounting and solvency •requirements on capital levels;The framework does not include any franchise value of the business, discretionary management intervention or future business •volumes and margins.
Further details are provided in the relevant model descriptions for each risk area.
Aggregation modelThe main processes executed in the ING Bank Economic Capital aggregation model are depicted in the flowchart below. The white boxes show the processes performed by the model while the shaded box indicates inputs from other corporate risk departments.
Calculate diversified economic capitalsEconomic capitals per risk type
Calculate diversification ratio per risk type
Determine stressed correlations
Determine correlations
As a foundation the correlations in the risk dashboard are applied based on a 90% confidence level, i.e. they correspond to the correlations observed in the 10% largest downward movements (a ‘1 in 10’ event). As shown in the flow-chart, these correlation factors are stressed upwards where necessary to account for potential measurement inaccuracy in extreme events due to limited historic data observations. For aggregating other risk (business and operational), expert opinion is used.
The Economic Capital for ING Bank involves the aggregation of the underlying Economic Capitals of five risk types, namely credit, transfer, market, operational and business risks (latter two also referred to as other risks). These risk types are aggregated to provide a total diversified ING Bank Economic Capital by applying the variance-covariance approach with a 5 x 5 inter-risk correlation matrix.
For allocation of Economic Capital to units and products, diversification factors are calculated for each risk type. These factors are applied consistently throughout ING Bank. The level of diversification benefit is dependent on both the inter-risk correlations as well as the relative size of the undiversified Economic Capital exposure for each risk type.
Reporting FrameworkFor each business unit and product line, the gross Economic Capital for each risk type is delivered to MISRAROC – the financial data warehouse for RAROC and Economic Capital reporting of ING Bank. The net Economic Capital figures are calculated by taking the product of the gross Economic Capital and one minus the diversification factor. Total Economic Capital is calculated as the sum of the net Economic Capital for each risk type at all reporting levels.
CREDIT AND TRANSFER RISKEconomic Capital for credit risk and for transfer risk is the portion of Economic Capital held to withstand unexpected losses inherent in the credit portfolios related to (unexpected) changes in the underlying creditworthiness of debtors or the recovery value of underlying collateral (if any). Credit risk and transfer risk capital are calculated on all portfolios which contain credit or transfer risk, including investment portfolios. The same methodology is used for both the banking and the insurance operations.
Economic Capital for credit risk and for transfer risk are calculated using internally developed models with a 99.95% confidence level and a time horizon of one year, which represents ING’s desired credit rating.
ING uses a series of credit risk models that can be grouped into three principal categories: Probability of Default (PD) models, which measure the standalone creditworthiness of individual debtors; Exposure at Default models (EAD) which estimate the size of the financial obligation at the moment of default in the future; and Loss Given Default Models (LGD), which estimate the recovery value of the underlying collateral or guarantees received (if any) and the unsecured part. Collectively, ING uses over 100 models for credit risk. The various models can be grouped into three categories: statistical, expert and hybrid. Each model is individually reviewed and validated annually by the Model Validation department (MV), in order to determine the continued viability or need to adjust each individual model.
221ING Group Annual Report 2008

2.1 Consolidated annual accounts
The Economic Capital formula for credit and transfer risks relies on seven different risk drivers. In addition to the PD, EAD, and LGD models mentioned above, the formula also considers the industry and the country of the debtor as well as the remaining term of the respective underlying transactions. Lastly, the formula considers the correlation of the individual transactions to the portfolio as a whole. ING uses Monte Carlo simulation tools to determine certain parameters which are then applied to individual transactions in determining the level of Economic Capital related to credit and transfer risk in a bottom up approach. The correlations, which are updated quarterly, are determined at a business line level, and diversification effects are applied at the transactional level.
The underlying formulas and models that are used for determining Economic Capital for credit and transfer risk are the same as those used for determining the level of regulatory capital that is required under Basel II (Pillar 1). Despite the fact that the same underlying formulas are used, (internal) Economic Capital and regulatory capital are not the same, due to various specific rules imposed by Basel II, such as regulatory caps and floors, and the use of the standardised approach for certain portions of ING’s portfolio. These differences are permitted under the Basel II guidelines.
The table below summarises different capital measures used for different purposes and shows the difference in key elements and purposes.
Credit Risk CapitalMeasurements Methodology Location Confidence level Inputs PurposeRegulatory Capital Basel II Formula Vortex Basel Engine
(‘VBE’) in the Central Risk Database
99.90% Basel II model outputs RWA
Economic Capital Risk Adjusted Capital(RAC) Closed Algebraic Formula
Vortex Risk Engine (‘VRE’) in the Central Risk Database
99.95% Basel II model outputs excluding Basel II caps and floors, maturity, repayment schedules, correlation factors, migration matrix. Some inputs come from EC-MC portfolio calculator but with 99.95% confidence level country and industry.
Pricing, Economic Capital for credit at transactional level and above
Capital and earnings at risk
Monte Carlo simulation based on aggregate portfolio (‘EC-MC portfolio calculator’)
Stand alone tool using same data from Central Datawarehouse as VRE
90.00% Basel II model outputs excluding Basel II caps and correlation factors, migration matrix country and industry.
Risk Dashboard at Line of Business Level and above
With regard to methodology, the EC-MC Portfolio calculator provides a sophisticated and consistent framework to measure capital numbers for credit risk. Because of its complexity and required calculation time the EC-MC Portfolio calculator is more suited for portfolio calculation, rather than to be implemented in an environment requiring real time reporting at a transactional level for day-to-day management, pricing of new transactions and limit setting. As a result, Economic Capital figures are based on RAC figures that are derived from the EC-MC Portfolio calculator but are not fully equivalent. The main characteristics are:
RAC• is calculated at facility level with closed algebraic formulas rather than from a Monte Carlo Simulation. The RAC algebraic formula includes parameters which incorporate the impact of portfolio dynamics, such as correlations and diversification effects. These parameters are derived through a regression of the outputs of the EC-MC portfolio calculator;Due to its proprietary nature the inputs in the • EC-MC Portfolio calculator are subject to certain technical caps and floors (LGD/EAD is constant and PD migration matrix is capped) which are not applicable in RAC. Also, due to the implemented mathematical routines the EC-MC portfolio calculator is subject to a minimum Probability of default (PD) and maximum tenor, which are not applicable in RAC.
Additionally the banking operations use the RAC model for determining the optimal pricing on (new) lending transactions in order to ensure that ING meets its desired RAROC returns.
During 2008, the Economic Capital levels for credit and transfer risk were calculated on a weekly basis for most of the Wholesale Bank and ING Direct investment portfolios and for the SME portfolios within the Retail banking operations. For consumer loans, residential mortgages, credit cards, and the insurance portfolios, the calculations are made on a monthly basis. On a quarterly basis, the Economic Capital for credit risk and transfer risk figures are consolidated with the corresponding Economic Capital components from other disciplines.
Governance of Economic Capital for Credit and Transfer RiskAll PD, EAD and LGD models are approved by the Credit Risk Committee (CRC) after thorough review of documentation by the Model Development Steering Committee (MDSG) and MV. In addition, each model is validated on an annual basis by MV. Each model has both a credit risk and a front office co-sponsor. Both the MDSG and the CRC have participation from both credit risk officers as well as the front office to ensure maximum acceptance by the organisation.
Risk management (continued)
ING Group Annual Report 2008
222

MARKET RISK BANKGeneralEconomic Capital for market risk is the Economic Capital necessary to withstand unexpected value movements due to changes in model risks and market variables, such as interest rates, equity prices, foreign exchange rates and real estate prices. Economic Capital for market risk is calculated for exposures both in trading portfolios and non-trading portfolios.
MeasurementEconomic capital for market risk is calculated using internally developed methodologies with a 99.95% confidence interval and a horizon of one year, which represents extreme events and ING’s rating. The Economic Capital for market risk for non trading portfolios is calculated for each risk type, while for trading portfolios it is calculated on a portfolio level. The calculations for Economic Capital market risk include real estate risk, foreign exchange rate risk, equity price risk, interest rate risk and model risks.
Real estate price risk includes both the market risks in the investment portfolio and the development risk of ING Real Estate. The real estate price risk for ING Real Estate is calculated by stressing the underlying market variables. The stress scenarios at a portfolio level take into account all diversification effects across regions and real estate sectors. Also, the leverage of participations in the real estate investment funds is taken into account.
For the real estate development process, in addition to price risk, the risk drivers of vacancy rate and construction delays are taken into account. Furthermore the risk model differs for each development phase (i.e., research, development, and construction) to appropriately reflect the risk taken in each phase. Using correlations, all risk drivers, and stages are used to calculate a possible market value loss representing the Economic Capital for market risk for the development portfolio.
For the direct market risks, the actual VaR (measured at a 99% confidence interval, a one day holding period and under the assumption of an expected value of zero) of the trading and non-trading portfolios is taken as a starting point for the Economic Capital calculations for market risk. To arrive at the Economic Capital for market risk, a simulation based model is used which includes scaling to the required confidence interval and holding period. In determining this scaling factor, several other factors are also taken into account like the occurrence of large market movements (events) and management interventions.
Economic Capital for market risk for the large non-trading portfolios within ING Retail Banking and ING Wholesale Banking is calculated for embedded option risk (e.g. the prepayment option in mortgages) and model risk. The model risk is calculated by stressing the underlying assumptions in the models for behavioural assets and liabilities. For example, the hedge for savings portfolios is based on assumptions with respect to developments of volumes and client rates. Deviations in these assumptions can lead to (ex-post) incorrect estimation of the typical interest rate maturity of saving deposits. If there is more outflow than initially modelled, the duration of the savings money may be lower than the duration of the investments, which leads to losses if interest rates go up. The economic capital figures of ING Direct capture the model risk of the behavioural liabilities in line with the model described above.
For the model applied to mortgage portfolios a similar rationale is employed. The quality of the hedge depends on assumptions with respect to prepayment behaviour. If these assumptions are wrong, the funding may be either too long or too short term. Similar to the above, the Economic Capital model for market risk is based on the estimated 99% confidence prepayment model error and the 99% confidence adverse interest rate change.
While aggregating the different Economic Capital market risk figures for the different portfolios, diversification benefits are taken into account as it is not expected that all extreme market movements will appear at the same moment.
The nature of market risk Economic Capital, evaluating the impact of extreme stress with a 99.95% confidence level, can sometimes be difficult to evidence in a statistical sound manner with the available historical data. The Economic Capital figures disclosed by ING Group are a best effort estimate based on available data and expert opinions.
OPERATIONAL RISKOperational risk is the risk of direct or indirect loss resulting from inadequate or failed internal processes, people and systems or from external events. It includes the risk of reputation loss, as well as legal risk, whereas strategic risks are not included. While operational risk can be limited through management controls and insurance, many incidents still have a substantial impact on the profit and loss account of financial institutions.The capital model, an actuarial model, consists of a combination of three techniques:
Loss Distribution approach (LDA), which applies statistical analysis to historical loss data;•Scorecard approach, which focuses on the quality of risk control measures within a specific business unit;•‘Bonus/Malus’ approach, which focuses on the actual operational incidents of a specific business unit.•
223ING Group Annual Report 2008

2.1 Consolidated annual accounts
Loss Distribution approachThe main objective of the LDA approach is to derive an objective capital amount based on the size and the risk appetite of an institution and its business units. This approach estimates the likely (fat-tailed) distribution of operational risk losses over some future horizon for each combination of business line and loss event type. The main characteristic of the LDA is the explicit derivation of a loss distribution, which is based on separate distributions for event frequency (Poisson) and severity (Inverse Gaussian). The model uses both external and internal loss data above one million EUR.
The calculation of operational risk capitals for the units follows five basic principles:Principle 1: If the world gets riskier, the business units need more Economic Capital;•Principle 2: If a business unit’s size increases, so does its capital;•Principle 3: If the business of a business unit is more complex, it needs more capital;•Principle 4: If the level of control of a business unit is higher, it needs less capital;•Principle 5: If the business units’ losses from internal incidents exceed the level of expected loss accounted for in the first four •framework principles, it needs more capital.
The capital calculated according to the first three is ‘generic’: if two business units operate in the same markets and have the same size, the resulting capital will be the same. The specific capital adjustments mentioned below adjust the generic capital of a specific institution to its specific operational risk capital.
Scorecard approach (principle 4)The scorecard adjustment reflects the level of quality of control in a specific institution. Scorecards aim to measure the quality of key operational risk management processes. The scorecard procedure concerns questions that require quantitative data, qualitative judgements or simple yes/no questions (e.g. indicating compliance with certain group policies). The scorecards are completed by all business units using self-assessment and reviewed by an expert panel who determines the final score. The set of scorecards then leads to an increase or decrease of the capital of the specific institution.
‘Bonus/Malus’ approach (principle 5)Units are assigned additional capital in case losses from internal incidents exceed the level of expected losses that have been accounted for in the LDA. When actual losses are lower than expected, the capital will be decreased. Only internal incidents above one million EUR from the last five years are used. The Bonus/Malus adjustments are capped at + and – 20% to prevent large capital fluctuations in total ING capital.
BUSINESS RISK BANKThe current calculation method applied within ING Bank defines business risk as the ‘residual risk category‘ that includes all risks that are not covered by the explicitly defined (and managed/measured) credit/transfer, market and operational risk categories. In accordance with the residual risk definition, the measurement of business risk capital is based on a single risk factor; i.e. the volatility of the ‘residual’ profit and loss figures (for each BU) that are cleansed for the effects of other risk types. As a consequence there is no further gain in insight regarding sub business risks.
The level of the business risk capital is linked to the volatility of (cleansed historical) profit and loss data taking into account observed trends. In practice, this means that more stable earnings over time generally lead to less capital.
Using a T-distribution and the level of confidence, the volatility is then ‘capitalised’ to obtain a business risk capital. The T-distribution is a theoretical probability distribution, is symmetrical, bell-shaped and similar to the standard normal curve. However, the T-distribution has relatively more scores in its tails than the normal distribution.
As relatively short data series are available, a capital floor and cap are included in order to prevent the business risk capital from being under- or overestimated. The minimum (floor: 20%) and maximum (cap: 80%) are specified as a percentage of the operating costs and as such link business risk capital for units that operate at the floor to cost efficiency.
ECONOMIC CAPITAL ING INSURANCEEconomic Capital, ‘EC’, is defined by ING as the amount of assets that needs to be held in addition to the market value of liabilities to assure a non-negative surplus at a 99.95% level of confidence on a 1 year time horizon. ING measures Economic Capital by quantifying the impact on the market value surplus (MVS) as a result of adverse events that occur with a specified probability related to the AA rating. Therefore ING’s Economic Capital model is based on a ‘Surplus-at-Risk’ concept. The confidence level consistent with an AA rating has been defined as the 99.95% one-sided confidence level over a one-year horizon. The change in market value surplus (MVS) is the combined effect of changes in Market Value of Assets (MVA) minus market value of liabilities (MVL) and an adjustment for illiquidity spreads due to current dislocated asset markets. The MVS is adjusted to correct this asymmetry by applying an illiquidity spread to the insurance liability cash flows.
Risk management (continued)
ING Group Annual Report 2008
224
The adjustment of the MVS for the illiquidity of our insurance liabilities impacts the market risk in our Economic Capital model in the following ways:
Interest Rate Risk: The illiquidity spread applied on our liability cash flows effectively reduces the duration of our liabilities and •therefore reduces the duration mismatch between our assets and liabilities resulting in a reduced interest rate risk;Credit Spread Risk: The Economic Capital model stresses both the asset spreads and the illiquidity spread on our liabilities. •The netting of asset spread risk with illiquidity liability spread risk results in a lower credit spread risk;Foreign Exchange Risk: The adjustment of the MVS for illiquidity results in a reduced net exposure to foreign currency movements •and in particular US dollar. This results in a lower foreign exchange risk.
The MVL consist of the Financial Component of Liabilities (FCL) and a Market Value Margin (MVM) for non-hedgeable risks (e.g. insurance risk). The MVM is calculated using a Cost-of-Capital approach based on an estimate of required shareholder return on Economic Capital.
The following fundamental principles have been established for the model:Economic Capital requirements are calculated to achieve a target AA rating for policyholder liabilities;•All sources of risk should be considered;•The best estimate actuarial assumptions should be as objective as possible and based on a proper analysis of economic, industry, •and company-specific statistical data. There is one set of best-estimate assumptions per product to be used for all purposes at ING;Valuation of assets and liabilities is based on fair value principles. Where complete and efficient markets exist, fair value is equal to •market value;The Economic Capital and valuation calculations should reflect the embedded options in insurance contracts;•The Economic Capital and valuation calculations are on a pre-tax basis and do not consider the effect of local regulatory accounting •and solvency requirements on capital levels. Capital is assumed to be fully transferable between legal entities;The framework does not include any franchise value of the business. It does, however, include the expense risk associated with the •possibility of reduced sales volume in the coming year.
ING quantifies the impact of the following types of risk in its Economic Capital model:Market risk for ING Insurance is the change in value based on changes in interest rates, equity prices, real estate prices, credit spreads, •implied volatilities (interest rate and equity), and foreign exchange rates. It occurs when there is less than perfect matching between assets and liabilities. Market risk may exist in the insurance activities as a result of selling products with guarantees or options (guaranteed crediting rates, surrender options, profit sharing, etc.) that cannot be hedged given the assets available in a certain market. Market risk may also occur when there is an intentional mismatch between asset and liability cash flows even when it is possible to match or hedge the cash flows;Credit risk is the risk of changes in the credit quality of issuers due to defaults or credit migration of securities (in the investment •portfolio), counter parties (e.g. on reinsurance contracts, derivative contracts or deposits given) and intermediaries to whom ING has an exposure. In addition to credit risk, ING includes a calculation of transfer risk for the risk of being unable to repatriate funds when required due to government restrictions;Business risk is defined as the exposure to the possibility that experience differs from expectations with respect to expenses, the runoff •of existing business (persistency) and future premium re-rating;Operational risk is defined as the risk of direct or indirect loss resulting from inadequate or failed internal processes, people and systems •or from external events. Operational risk capital is difficult to quantify, since it is driven by infrequent events of high severity, and can be significantly mitigated or exacerbated by the quality of internal controls and guidelines. It may be partially managed through the purchase of insurance;Life risk relates to deviations in timing and amount of the cash flows (premium payments and benefits) due to the incidence or •non-incidence of death. The risk of non-incidence of death is also referred to as longevity risk to distinguish it from the risk associated with death protection products. ING notes risks due to uncertainty of best estimate assumptions concerning level and trend of mortality rates, volatility around best estimates, and potential calamities and recognises external reinsurance;Morbidity risk is the risk of variations in claims levels and timing due to fluctuations in policyholder morbidity (sickness or disability) •recognising external reinsurance. A wide variety of policy classes are subject to morbidity risk, including disability, accidental death and disability, accelerated death benefits, workers compensation, medical insurance, and long-term care insurance;P&C risk comprises the risk of variability of size, frequency and time to payment of future claims, development of outstanding claims •and allocated loss adjustment expenses for P&C product lines recognising external reinsurance.
Strategic business risk has been excluded from the EC calculations of ING Insurance.
225ING Group Annual Report 2008

2.1 Consolidated annual accounts
Economic Capital ModelThe ING Economic Capital calculation is calculated based on a ‘Surplus-at-Risk’ concept. ‘Surplus-at-Risk’ is calculated based on the steps:
Calculate the complete balance sheet (all assets and liabilities) on a Market Value basis;•Generate Monte-Carlo shock scenarios for all of the relevant risk factors (market and non-market);•Recalculate the complete balance sheet (all assets and liabilities) on a Market Value basis for each shock scenario. For practical •purposes, the MVM is not recalculated under shock scenarios;Calculate the 99.95% worst case decrease in the Market Value Surplus over all the shock scenarios. This value will be the EC. Note •that the shock scenario resulting in the Economic Capital will differ by business unit, business line, and at an ING Insurance level.
In 2007, ING Insurance has introduced ECAPS as an intranet-based Economic Capital reporting system utilising replicating portfolio techniques. The ECAPS system provides a well controlled and automated basis for Economic Capital and risk measurement. Each business unit enters the risk characteristics of its assets and liabilities into the ECAPS system on a regular basis. These risk characteristics are then translated to a uniform basis in the form of replicating portfolios of standardised financial instruments. Based on the constellation of replicating portfolios (including representations of non-market risks), the ECAPS system then is capable of calculating Economic Capitals at every level of aggregation. The following is a brief description of the model.
Automated retrieval of all current and historical market data•500 Risk scenarios sent to each business unit to locally develop •stochastic asset and liability cash flows20,000 Real World Monte-Carlo scenarios for Economic •Capital calculation
Actuarial software used to produce the stochastic cash flows •by scenarioBusiness units upload stochastic asset and liability cash flows •for optimised replicating portfolio Non-market risk capitals calculated in accordance with ING •Standards of Practice submitted to ECAPS for risk aggregation
Capture the risk profile of the financial component of insurance •liabilities by mapping onto a small set of standard financial instrumentsStandard instruments contain discount bond, swaption, •callable bonds, equity forward/option and FX optionFind a replicating portfolio that matches the cash flows •as closely as possible for the 500 paths
Replicating portfolio used to capture the risk profile •of Insurance assets and liabilities EC market shocks and diversification benefits from •Monte-Carlo scenarios Non-market risk aggregation•Total diversified EC•
1. Market Data and Scenario Generation
2. Stochastic Cash flows and Non-market Risk Capital
3. Replicating Portfolio
4. Economic Capital Calculation
Risk management (continued)
ING Group Annual Report 2008
226

Further details on Economic Capital modelMarket Data and Scenario GenerationING Insurance uses ING Bank’s Global Market Database (GMDB) as a provider of market price and risk data for financial risk drivers. All market data is obtained from reputable data providers such as Reuters and Bloomberg. The GMDB operational team then validates the market data and calculates relevant risk parameters. This validated data is then automatically delivered to the ECAPS system.
Since ING Insurance operates in many developing financial markets, extrapolation algorithms are in place for extending beyond observable market data when this is needed for the calculation of the Market Value Liabilities and the Economic Capital. These algorithms are based on comparable data in mature markets.
Based on the market data from GMDB, ING calibrates two economic scenario generators:Risk Neutral Economic Scenario Generator (RN ESG): capable of generating multiple equity indices and exchange rates, consistent •with a multi-currency dynamic term structure model. Scenarios are used in the cash flow projection to determine replicating portfolios. RN ESG scenarios are consistent with observed market prices of equity, FX and interest options;Real World Economic Scenario Generator (RW ESG): capable of jointly simulating all risk types, i.e. all market risks, credit risk, business •risk, operational risk, life risk, morbidity risk and P&C risk. Diversification between risks is taken into account through a Gaussian copula, allowing for different marginal probability distributions at the risk driver level. RW ESG scenarios are consistent with historical time series of the market risk drivers using 5 years of weekly data observations. The volatilities are scaled from weekly to quarterly and the weekly correlations are used directly as estimates of quarterly correlations.
Stochastic Cash Flows and Non-Market Risk CapitalThe market risks in assets and liabilities are captured in and represented by stochastic cash flows in 500 scenarios. Business Units are responsible for generating these cash flows, the modelling of embedded options and guarantees and a proper mapping of risk drivers in the scenario set to cash flow determinants such as policyholder behaviour and management actions restricted to dynamic hedge programs and setting of crediting rates/profit sharing. To better capture the behaviour in the tails of the distribution, the set of scenarios consist of 300 Risk Neutral scenarios and 200 ‘Risk Volatile’ scenarios with double volatilities. The average of the 300 Risk Neutral scenarios provides a check on the market value of the replicating portfolio. It should be noted that this serves only as a check, and that the actual market value of liabilities is derived directly from the replicating portfolio. The 200 Risk Volatile scenarios ensure that the replicating portfolio is calibrated against enough extreme scenarios such that it can be used safely in Economic Capital calculations.
Non-market risk Economic Capital is calculated by business units, Corporate Credit Risk Management and Corporate Operational, Information and Security Risk Management and inputted into ECAPS at the sub risk level. ECAPS than aggregates 21 sub-risk types (e.g. mortality and trend risk) to 9 non market risk types using a bottom-up Economic Capital diversification approach based on a matrix of tail correlations. The information inputs relate to 9 sub risk types:
Credit risk;•Business risk;•Operational risk;•Life risk catastrophe;•Life risk non-catastrophe;•Morbidity risk catastrophe;•Morbidity risk non-catastrophe;•P&C risk catastrophe;•P&C risk non-catastrophe.•
The inputs are used to calibrate marginal distributions for these risk types. These distributions, in combination with the Gaussian copula, are then used in the Economic Capital Calculation to measure diversification between market and non-market risks.
Replicating PortfoliosTo handle the full complexity of calculating diversification by Monte Carlo simulation, ING maps its assets and liabilities to a set of standard financial instruments. The set of standard instruments consists of zero coupon bonds, market indices, equity forwards, swaptions, callable bonds, F/X options and equity options. Assets and the financial components of the liabilities are represented by a portfolio of this standard set of instruments. A user interface allows the selection of different types of replicating instruments for different cash flow types. Then an optimal replicating portfolio is created that matches the risk profile of the stochastically generated cash flows as good as possible. The resulting replicating portfolio is used in the calculation of Economic Capital.
Through the inclusion of equity options, F/X options and swaptions in the set of replicating instruments, ING is able to incorporate implied volatility risk in the considered risk types. The same holds for the credit spread risk through the inclusion of credit risk bearing zero coupon bonds in the set of replicating instruments.
227ING Group Annual Report 2008

2.1 Consolidated annual accounts
Risk management (continued)
The quality of the replicating portfolio is monitored by several statistical criteria including R-squared and benchmarked against market value sensitivities such as duration, convexity, and changes in value for larger interest rate and equity shocks. High quality replicating portfolios are important in several ways. First, they ensure a good reflection of the actual risk profile and an accurate calculation of Economic Capital. Second, they assist Business Units in hedging strategies and management of Economic Capital. Third, the process of replicating portfolio calculations increases the understanding of the complex nature of insurance liabilities in a market consistent environment.
Replicating portfolios are currently determined from a single factor RN ESG interest rate model. This limits the ability of the replicating portfolios to pick up sensitivity to non-parallel shifts of the term structure of interest rates. Hence RW ESG interest rate scenarios for the Value at Risk calculations are generated using a single factor model as well. However both RN ESG and RW ESG models are consistent with respectively, the RN ESG and RW ESG volatility structure of interest rates.
Economic Capital CalculationECAPS uses Monte-Carlo simulation to determine diversification benefits for the complete ‘portfolio hierarchy’, from business unit level up to an ING Group level. All diversification calculations are done within ECAPS and are driven by the Gaussian copula of all risk drivers using the underlying distributions applicable for each risk type.
For the calculation of Economic Capital, ING uses a one-year time horizon. In practice, the model calculates instantaneous quarterly shocks and then annualises the resulting VaR statistic to determine an annualised EC. The quarterly shock is used to stabilise the results, to ensure the shocks are within a range that can be more credibly valued for assets and liabilities, to better capture the impact of dynamic hedge strategies, to more reasonably use weekly correlations of risk factors, and to get closer to actual risk practices and reporting cycles.
Using Monte-Carlo simulation, ING’s Economic Capital model generates 20,000 possible ‘states-of-the-world’, by randomly simulating all risk drivers – simultaneously. For each state-of-the-world, the market value of assets and liabilities are recalculated and the change in value of the Market Value Surplus (MVS) is stored. All these changes in MVS are then sorted, and the 99.95% worst-case change in MVS is identified, to provide the Economic Capital level for the given level of aggregation.
ECONOMIC CAPITAL GROUPING’s Group Economic Capital and Bank-Insurance diversification benefit is determined by applying one common aggregation approach to the banking and insurance businesses. The starting point is the actual reported Economic Capital figures for ING Bank and ING Insurance, excluding inter-risk diversification. In addition an aligned set of best-estimate correlation assumptions is constructed by applying the weighted average of the Bank and Insurance specific inter-risk correlation assumptions for each of the five major risk types i.e. credit, market, insurance, business, and operational (See also Economic Capital model sections of Bank and Insurance).
The group diversification benefit is calculated by applying a ‘Gaussian-copula’ simulation approach. Due to the inherent uncertainties around correlation assumptions and changes in risk exposures the results are put to extensive sensitivity tests.
ING Group Annual Report 2008
228

Capital managementamounts in millions of euros, unless stated otherwise
OBJECTIVESING Group Capital Management (Capital Management) is responsible for the sufficient capitalisation of ING Group entities at all times in order to manage the risk associated with ING’s business activities. This involves the management, planning and allocation of capital within ING Group. ING’s Corporate Treasury is part of Capital Management. It executes the necessary capital market transactions, term (capital) funding and risk management transactions. Capital Management monitors and plans capital adequacy on a consolidated basis at three levels: ING Group, ING Insurance and ING Bank. The rating objective for these three entities is AA. Capital Management takes into account the metrics and requirements of regulators (EU Solvency, Tier-1 and BIS ratios and limits for hybrid capital), rating agencies (leverage ratios, Adjusted Equity) and internal risk management models and market value balance sheets (Economic Capital (EC) and Available Financial Resources (AFR)).
ING applies three main capital definitions:AFR – This is a market value concept, defined as market value of assets (MVA) less the market value of liabilities (MVL) on the balance •sheet. The liabilities do not include the hybrid capital and core Tier-1 securities which are included in AFR as equity. The valuation of ING Insurance includes an adjustment for portfolio illiquidity. In the absence of a full market value balance sheet for ING Bank, AFR Bank is defined as IFRS Equity including several adjustments (see table in this section). AFR of ING Group is defined as AFR Bank plus AFR Insurance minus core debt ING Group. AFR is used as the measure of available capital in comparison with EC employed. EC, or Economic Capital, is the amount of capital that is required to absorb unexpected losses in times of severe stress given ING Group’s ‘AA’ target rating.Adjusted Equity – This rating agency concept is defined as shareholders’ equity plus core Tier-1 securities, hybrid capital, prudential •filters and an adjustment for Value in Force and Deferred Acquisition Cost. See ‘Capital Base’ disclosures in this section. This capital definition is applied in comparing available capital to core debt (leverage) for ING Group and ING Insurance.Core Tier-1 capital, Tier-1 capital and total BIS capital are regulatory concepts applicable to ING Bank. Tier-1 capital is defined as •shareholders’ equity plus hybrid capital less certain prudential filters and deductible items. Tier-1 and BIS capital divided by risk weighted assets equals the Tier-1 and BIS ratio respectively. Core Tier-1 capital is equal to Tier-1 capital excluding hybrid capital.
Increasingly Capital Management considers AFR and EC employed when managing capital. AFR should exceed EC and for ING Group as a whole there should be a prudent buffer. The target for the buffer at Group level is 20%.
POLICIESThe activities of Capital Management are executed on the basis of established policies, guidelines and procedures. The main documents that serve as guidelines for capital planning are the Capital Letter (comprising the approved targets and limits for capital), the Capital Planning Policy, the Dividend Policy and the Capital Request Policy. For the Corporate Treasury there are many policies and limits that guide the management of the balance sheets and the execution of capital market transactions.
The above capital definitions and policies have been approved by the ING Group Executive Board or delegated authorities.
PROCESSES FOR MANAGING CAPITALIn addition to measuring capital adequacy, Capital Management also ensures that sufficient capital is available through setting targets and limits relevant to the above mentioned metrics for ING Bank, ING Insurance and ING Group and ensuring adherence to the set limits and targets through planning and executing capital management transactions. The process is supplemented by stress testing and scenario analysis. The ongoing assessment and monitoring of capital adequacy is embedded in Capital Management’s capital planning process and results in a quarterly Capital Adequacy Assessment Report which is presented to both the ING Group Finance and Risk Committee and the ING Group Executive and Supervisory Boards. The main objective of the assessment is to ensure that ING Group as a whole has sufficient capital relative to its risk profile both in the short and the medium term.
CAPITAL ADEQUACY ASSESSMENTAs at 31 December 2008 and 2007, ING Group, ING Bank and ING Insurance met all key target capital ratios and metrics and regulatory requirements. As at 31 December 2008 and 2007, ING Group, ING Bank and ING Insurance were adequately capitalised in relation to their risk profile and strategic objectives.
BASEL IIAs of 1 January 2008, ING Bank calculates its capital ratios under Basel II. In 2008, ING Bank published risk weighted assets (RWA), Tier-1 and BIS capital and the accompanying capital ratios based on Basel II data only. In addition, ING publishes the minimum required capital level according to Basel II and according to the Basel I floor. The Basel I floor is a temporary minimum capital requirement based on 90% of Basel I RWA for 2008 and 80% of Basel I RWA for 2009. The minimum requirements according to Basel II and Basel I will both be compared to total BIS available capital according to Basel II.
229ING Group Annual Report 2008

2.1 Consolidated annual accounts
Capital management (continued)
AVAILABLE FINANCIAL RESOURCES (AFR)ING GroupAFR ING Group is computed as follows:
Available Financial Resources – ING Group
2008 2007
Total AFR Bank and Insurance 49,305 54,443Less Core debt Group (1) 7,170 4,728Total AFR ING Group 42,135 49,715(1) Investments in subsidiaries less equity (including core Tier-1 securities) of the Group holding company. This net debt position is provided as equity to ING
Insurance and ING Bank.
ING InsuranceAFR insurance is computed as follows:
Available Financial Resources – ING Insurance
2008 2007
IFRS Equity (1) 11,888 17,911Plus hybrid capital (2) 2,934 2,202Plus Mark-to-Market, tax adjustments and illiquidity adjustment –366 2,597Total AFR ING Insurance 14,456 22,710(1) IFRS Equity 2008 adjusted for EUR 5 million shares of ING Group held by ING Insurance.(2) Hybrid capital at market value.
ING continues to adjust AFR to reflect the illiquidity in its insurance portfolios as reporting AFR with MVLs discounted at the swap rates results in an asymmetry between the assets and liabilities in terms of reflection of illiquidity premiums. In addition to valuing assets at current market values, total portfolio illiquidity risk profile has been proxied by applying a AAA covered bond spread (128 bps over swaps) to the valuation of insurance liabilities cash flows. This adjustment has been applied to all business (excluding mainly unit-linked/variable business) except for the US and Japanese businesses where the AAA covered bond spread is further adjusted by the differential between local AAA corporate bond spreads and AAA European corporate bond spreads (further +72 bps and -21 bps over swaps for the US and Japan respectively). If a similar methodology had been applied at 31 December 2007, AFR at that time would have been EUR 26.7 billion. At year-end 2007 the swap rate was used.
ING Bank
Available Financial Resources – ING Bank
2008 2007
IFRS Equity 22,889 25,511Revaluation Reserve Debt Securities 5,185 1,097Revaluation Reserve cash flow hedge 128 –428Goodwill –1,636 –1,428Minorities 1,198 1,668Deduction (1) –1,084Hybrid capital 7,085 6,397Total AFR ING Bank 34,849 31,733(1) Difference between loan loss provisions and expected loss is no longer deducted from AFR in 2008.
ING Bank paid dividends to ING Group of EUR 4.25 billion during the year. It received EUR 7.2 billion in capital injections from ING Group. Hybrid capital increased mainly due to the issuance of additional hybrid capital.
AFR/EC RATIOSAFR should exceed EC, and for ING Group as a whole there should be a prudent buffer. The target for the buffer at Group level is 20%. For details regarding the computation of EC see the section entitled ‘Risk management’.
ING Group Annual Report 2008
230

AFR/EC Reconciliation
2008 2007
Available Financial Resources ING Group (1) 42,135 49,715
Group EC (2) 30,675 35,000EC Group (3) 1,000Total ING Group EC 30,675 36,000
AFR/EC Ratio 137% 138%Surplus/(deficit) 11,460 13,715(1) AFR ING Bank, amounting to EUR 34,849 million (2007: EUR 31,733 million) plus AFR ING Insurance, amounting to EUR 14,456 million (2007: EUR 22,710
million) less core debt ING Group, amounting to EUR 7,170 million (2007: EUR 4,728 million).(2) EC Insurance plus EC Bank less 15% diversification effect (15% in 2007).(3) EC of the ING Group parent company in 2007 mainly included market risk on share-based payment plans and market risk on the assets backing ING Bank
equity. In 2008 the market risk on the assets backing ING Bank equity is included in ING Bank EC, and additional EC for share-based payment plans is zero in 2008.
Capital base
Insurance Bank Group2008 2007 2008 2007 2008 2007
Shareholders’ equity (parent) 11,893 17,911 22,889 25,511 17,334 37,208Core Tier-1 securities 10,000Group hybrid capital (1) 4,560 2,202 7,085 6,397 11,655 8,620Group leverage/core debt (2) 7,170 4,728Total capitalisation 16,453 20,113 29,974 31,908 46,159 50,556
Adjustments to equity:Revaluation reserve debt securities 8,271 840 5,185 1,097 13,456 1,937Revaluation reserve crediting to life policyholders –2,235 –42 –2,235 –42Revaluation reserve cashflow hedge –1,360 –10 128 –428 –1,177 –438Goodwill –1,889 –1,076 –1,636 –1,428 –3,275 –2,420– Revaluation reserves fixed income & other 2,787 –289 3,677 –759 6,769 –963– Revaluation reserves excluded from Tier-1 (3) –1,790 –2,952– Insurance hybrid capital (4) 2,250 2,250– Minorities 520 891 1,198 1,668Deductions Tier-1 (as of 2007) –1,040 –93Available capital 22,010 22,965 32,019 29,772
Other qualifying capital (5) 11,870 11,792DAC/ViF adjustments (50%) (6) 1,893 4,070Group leverage (core debt) –7,170 –4,728Adjusted Equity (a) 23,903 27,035 43,889 41,564 45,758 44,865
RatiosCore debt (b) 2,301 4,267 7,170 4,728Debt/Equity ratio (b/(a+b)) 8.78% 13.63% 13.55% 9.53%(1) Tier-1 instruments issued by ING Group (e.g. perpetual debt securities and preference shares) at nominal value. Group hybrid Tier-1 instruments other than
preference shares are provided as hybrid capital to ING Insurance or ING Bank.(2) Investments in subsidiaries less equity of the Group holding company (including core Tier-1 securities). This net debt position is provided as equity to ING
Insurance and ING Bank.(3) Includes mainly EUR –1,019 million (2007: EUR –2,358 million) in participations (e.g. Kookmin, Bank of Beijing) and other equity investments, EUR –615 million
(2007: EUR –595 million) for Real Estate for own use. The Dutch banking regulator requires this deduction to be made from Tier-1 capital. This deduction is added back to Tier-2 capital.
(4) Dated subordinated debt issued by ING Insurance at nominal value.(5) Includes EUR 12,910 million (2007: EUR 14,199 million) Tier-2 capital and nil (2007: nil) Tier-3, offset by EUR 1,040 million (2007: EUR 2,407 million) of
regulatory deductions. These deductions were based on Basel I regulation in 2007 and Basel II regulation in 2008.(6) Mainly includes 50% of the excess of the present value of future profits generated by policies in force (Value in Force) over the after-tax deferred acquisition costs.
The capitalisation of ING Group was under pressure in the second half of 2008, but thanks to the government capital injection all leverage ratios were within their targets at the end of the year. The debt/equity ratio of ING Group as at year-end 2008 was at 13.55% (2007: 9.53%). The debt/equity ratio of ING Insurance as at year-end 2008 was at 8.78% (2007: 13.63%). The Basel II ING Bank Tier-1 ratio ended at 9.32%, this is a strong increase from the Basel I Tier-1 ratio of 7.39% at December 2007.
231ING Group Annual Report 2008

2.1 Consolidated annual accounts
Capital management (continued)
REGULATORY REQUIREMENTSING BankCapital adequacy and the use of regulatory required capital are based on the guidelines developed by the Basel Committee on Banking Supervision (The Basel Committee) and the European Union Directives, as implemented by the Dutch Central Bank (DNB) for supervisory purposes. The minimum Tier-1 ratio is 4% and the minimum total capital ratio (known as the BIS ratio) is 8% of all risk-weighted assets.
Capital position of ING Bank
2008 2007
Shareholders’ equity (parent) 22,889 25,511Minority interests 1,198 1,668Subordinated loans qualifying as Tier-1 capital (1) 7,085 6,397Goodwill and intangibles deductible from Tier-1 –1,636 –1,428Deductions Tier-1 (as of 2007) –1,040 –93Revaluation reserve (2) 3,523 –2,283Available capital – Tier-1 32,019 29,772
Supplementary capital – Tier-2 (3) 12,910 14,199Available Tier-3 fundsDeductions –1,040 –2,407BIS capital 43,889 41,564
Risk-weighted assets (4) 343,388 402,727
Tier-1 ratio (4) 9.32% 7.39%BIS ratio (4) 12.78% 10.32%
Required capital based on Basel I floor (5) 34,369Required capital based on Basel I floor as at 1/1/09 (5) 30,550BIS ratio based on Basel I floor 10.22%BIS ratio based on Basel I floor as at 1/1/09 11.49%(1) Subordinated loans qualifying as Tier-1 capital have been placed by ING Groep N.V. with ING Bank N.V.(2) Includes revaluation debt securities, revaluation reserve cash flow hedge and revaluation reserves equity and real estate (see Capital base table, note 3).(3) Includes eligible lower Tier-2 loans and revaluation reserves equity and real estate revaluations removed from Tier-1 capital.(4) Based on Basel II as of 2008.(5) 90% of Basel I Risk Weighted Assets in 2008 and 80% in 2009.
ING InsuranceEuropean Union directives require insurance companies established in member states of the European Union to maintain minimum capital positions. The ING Insurance companies outside the EU have to comply with their respective local requirements. ING Insurance’s companies comply with local regulatory requirements. The table below shows the global required capital position of ING Insurance measured on the basis of the European Union requirement. This requirement is compared with ING Insurance consolidated available capital.
Capital position of ING Insurance
2008 2007
Available capital (1) 22,010 22,965Required capital 8,582 9,405Surplus capital 13,428 13,560
Ratio of available versus required capital 256% 244%(1) For breakdown of available capital see Capital base table.
ING Group Annual Report 2008
232
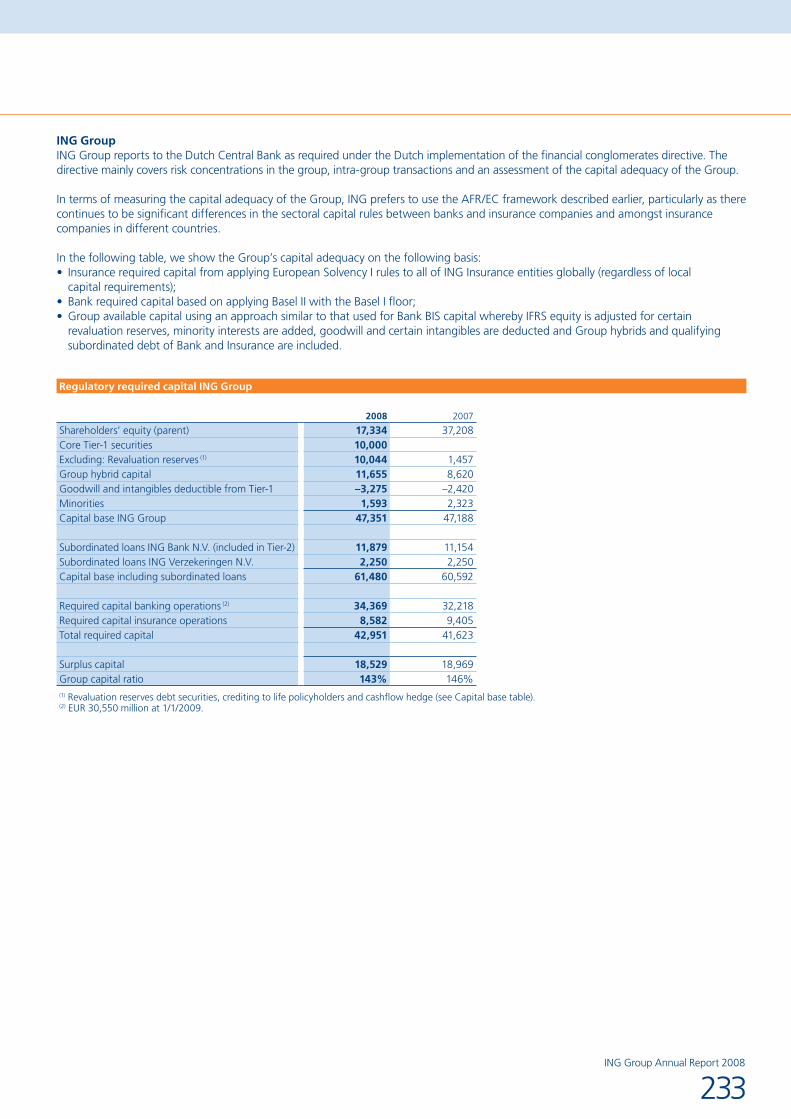
ING GroupING Group reports to the Dutch Central Bank as required under the Dutch implementation of the financial conglomerates directive. The directive mainly covers risk concentrations in the group, intra-group transactions and an assessment of the capital adequacy of the Group.
In terms of measuring the capital adequacy of the Group, ING prefers to use the AFR/EC framework described earlier, particularly as there continues to be significant differences in the sectoral capital rules between banks and insurance companies and amongst insurance companies in different countries.
In the following table, we show the Group’s capital adequacy on the following basis:Insurance required capital from applying European Solvency I rules to all of ING Insurance entities globally (regardless of local •capital requirements);Bank required capital based on applying Basel II with the Basel I floor;•Group available capital using an approach similar to that used for Bank BIS capital whereby IFRS equity is adjusted for certain •revaluation reserves, minority interests are added, goodwill and certain intangibles are deducted and Group hybrids and qualifying subordinated debt of Bank and Insurance are included.
Regulatory required capital ING Group
2008 2007
Shareholders’ equity (parent) 17,334 37,208Core Tier-1 securities 10,000Excluding: Revaluation reserves (1) 10,044 1,457Group hybrid capital 11,655 8,620Goodwill and intangibles deductible from Tier-1 –3,275 –2,420Minorities 1,593 2,323Capital base ING Group 47,351 47,188
Subordinated loans ING Bank N.V. (included in Tier-2) 11,879 11,154Subordinated loans ING Verzekeringen N.V. 2,250 2,250Capital base including subordinated loans 61,480 60,592
Required capital banking operations (2) 34,369 32,218Required capital insurance operations 8,582 9,405Total required capital 42,951 41,623
Surplus capital 18,529 18,969Group capital ratio 143% 146%(1) Revaluation reserves debt securities, crediting to life policyholders and cashflow hedge (see Capital base table).(2) EUR 30,550 million at 1/1/2009.
233ING Group Annual Report 2008

2.1 Consolidated annual accounts
Capital management (continued)
Capital adequacy and ratios
Quantitative disclosures on capital measures and ratios
Group Insurance Bank2008 2007 2008 2007 2008 2007
CapitalAvailable Financial Resources (AFR) 42,135 49,715 14,456 22,710 34,849 31,733Required Economic Capital (EC) 30,675 36,000 13,681 23,199 22,407 17,927Ratio EC vs AFR 137% 138% 106% 98% 156% 177%Target Ratio EC vs AFR 120% 120% 100% 100% 100% 100%
Basel II Tier-1 ratio (Bank)Year-end actual Tier-1 ratio 9.32% 7.39%Regulatory minimum Tier-1 ratio 4.00% 4.00%Target Tier-1 ratio 7.20% 7.20%
Basel II BIS ratio (Bank)Year-end actual BIS ratio 12.78% 10.32%Regulatory minimum BIS ratio 8.00% 8.00%Target BIS ratio 10.80% 10.80%
EU Solvency ratio (Insurance)Year-end actual EU Solvency ratio 256% 244%Regulatory minimum EU Solvency ratio 100% 100%Target EU Solvency ratio 150% 150%
Debt/Equity ratioDebt/Equity ratio 13.55% 9.53% 8.78% 13.63%Target Debt/Equity ratio 15.00% 10.00% 15.00% 15.00%
Main credit ratings of ING at 31/12/2008 (1)
Standard & Poor’s Moody’s FitchING Group AA– Aa3 AA–
ING Insurance– short term A-1+ P-1– long term AA– A1 AA–
ING Bank – short term A-1+ P-1 F1+– long term AA Aa2 AA– financial strength B(1) The Standard & Poor’s and Fitch ratings have a negative outlook and the Moody’s ratings have a stable outlook.
ING Group Annual Report 2008
234

Main credit ratings of ING at 16/02/2009 (1)
Standard & Poor’s Moody’s FitchING Group AA- A1 A+
ING Insurance– short term A-1+ P-1– long term AA- A2 A+
ING Bank – short term A-1+ P-1 F1+– long term AA Aa3 AA- – financial strength C+(1) The Standard & Poor’s and Fitch ratings have a negative outlook. The Moody’s Bank financial strength rating has a negative outlook. The other Moody’s ratings
have a stable outlook. The Fitch rating for ING Bank has a stabe outlook, those for ING Insurance and ING Group have a negative outlook.
ING’s long-term credit ratings are shown in the table above. Each of these ratings reflects only the view of the applicable rating agency at the time the rating was issued, and any explanation of the significance of a rating may be obtained only from the rating agency.
A security rating is not a recommendation to buy, sell or hold securities and each rating should be evaluated independently of any other rating. There is no assurance that any credit rating will remain in effect for any given period of time or that a rating will not be lowered, suspended or withdrawn entirely by the rating agency if, in the rating agency’s judgment, circumstances so warrant. ING accepts no responsibility for the accuracy or reliability of the ratings.
235ING Group Annual Report 2008

2.1 Consolidated annual accounts
Subsequent events
SUBSEQUENT EVENTSOn 26 January 2009 ING Group and the Dutch government (‘State’) announced that they have reached an agreement on an Illiquid Assets Back-Up Facility (‘Facility’) term sheet. The transaction is expected to close in the first quarter of 2009, but the closing is dependent on the completion of final documentation and the approval of various regulators.The Facility covers the Alt-A portfolios of both ING Direct US and ING Insurance Americas, with a par value of approximately EUR 30 billion. Under the Facility, ING is expected to transfer 80% of the economic ownership of its Alt-A portfolio to the Dutch State. As a result, an undivided 80% interest in the risk and rewards on the portfolio will be transferred to the Dutch State. ING will retain the legal ownership of its Alt-A portfolio.The transaction price for the 80% of the economic ownership is expected to be approximately EUR 22 billion, being 90% of the par value with respect to the 80% proportion of the portfolio of which the Dutch State will become the economic owner. The transaction price will remain payable by the State to ING and will be redeemed over the remaining life. Furthermore, under the Facility other fees will have to be paid by both ING and the State.As a result of the transaction, 80% of the Alt-A portfolio will be derecognised from the balance sheet in 2009 and a receivable on the Dutch State will be recognised. The transaction is expected not to have a significant impact on net result in the first quarter 2009. The transaction will result in a reduction of the negative revaluation -and therefore increase equity- by approximately EUR 5 billion (after tax).The valuation method of the Alt-A securities in the IFRS balance sheet as at 31 December 2008 is not impacted by this transaction. The same applies to the 20% that will remain after the transaction. The methodology used to determine fair value for these assets in the balance sheet under IFRS is disclosed in Note 33 ‘Fair value of financial assets and liabilities’.
As disclosed in this Annual Report, shareholders’ equity and net result of ING in 2008 were significantly impacted by the turmoil and extreme volatility in the worldwide financial markets. These financial markets and the worldwide economies have deteriorated further in the first months of 2009 in several areas, especially the equity markets. Current levels continuing or further negative developments in these financial markets and/or economies in 2009 may have a material adverse impact on shareholders’ equity and net result for 2009. Any such impact cannot be reliably estimated at the date of this Annual Report.
AUTHORISATION OF ANNUAL ACCOUNTS
Amsterdam, 16 March 2009
THE SUPERVISORY BOARD THE EXECUTIVE BOARD
Jan H.M. Hommen, chairman Eric F. Boyer de la Giroday, acting CEOEric Bourdais de Charbonnière, vice-chairman Dick H. HarryvanHenk W. Breukink John C.R. Hele, CFOPeter A.F.W. Elverding Eli P. LeenaarsClaus Dieter Hoffmann Tom J. McInerneyPiet Hoogendoorn Hans van der NoordaaPiet C. Klaver Koos (J.V.) Timmermans, CROWim Kok Jacques M. de VaucleroyGodfried J.A. van der LugtHarish ManwaniAman MehtaJoan SperoJackson P. TaiKarel Vuursteen
ING Group Annual Report 2008
236

2.2 Parent company annual accounts
Parent company balance sheet of ING Groupas at 31 December before appropriation of result
amounts in millions of euros 2008 2007
AssetsInvestments in wholly owned subsidiaries 1 34,698 41,864Other assets 2 13,610 10,703Total assets 48,308 52,567
Equity 3Share capital 495 534Share premium 9,182 8,739Non-voting equity securities 10,000Legal reserves (1) –9,670 5,103Other reserves 18,056 13,591Unappropriated result –729 9,241
27,334 37,208
LiabilitiesPreference shares 4 21Subordinated loans 5 11,352 8,339Financial liabilities at fair value through profit and loss 65 98Other liabilities 6 9,557 6,901Total equity and liabilities 48,308 52,567(1) Legal reserves includes Share of associates reserve of EUR –8,719 million (2007: EUR 6,053 million) and Currency translation reserve of EUR –951 million (2007:
EUR –950 million).
References relate to the notes starting on page 241. These form an integral part of the parent company annual accounts.
237ING Group Annual Report 2008
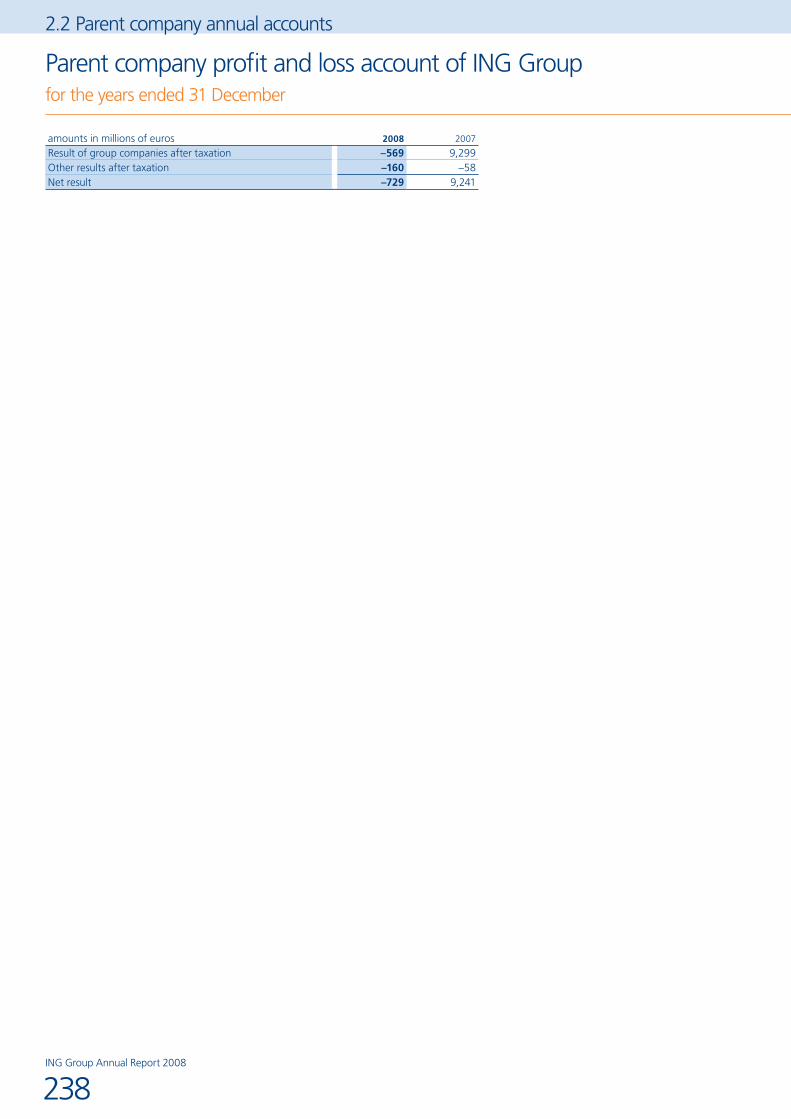
2.2 Parent company annual accounts
Parent company profit and loss account of ING Groupfor the years ended 31 December
amounts in millions of euros 2008 2007
Result of group companies after taxation –569 9,299Other results after taxation –160 –58Net result –729 9,241
ING Group Annual Report 2008
238

Parent company statement of changes in equity of ING Groupfor the years ended 31 December
amounts in millions of euros Share capitalShare
premium
Non-voting equity
securities
Share of associates
reserve
Currency translation
reserveOther
reserves (1) Total
Balance as at 1 January 2007 530 8,348 11,528 –950 18,810 38,266
Unrealised revaluations after taxation –1,636 1 –1,635Realised gains/losses transferred to profit and loss –3,414 –3,414Transfer to insurance liabilities/DAC 1,132 1,132Change in cash flow hedge reserve –925 –925Unrealised revaluations from net investment hedges 500 500Employee stock option and share plans 104 104Exchange rate differences –1,153 –1,153Other 21 –21Total amount recognised directly in equity –5,475 84 –5,391
Net result 9,241 9,241–5,475 9,325 3,850
Dividend –2,999 –2,999Purchases/sales of treasury shares –2,304 –2,304Exercise of warrants and options 4 391 395Balance as at 31 December 2007 534 8,739 6,053 –950 22,832 37,208
Unrealised revaluations after taxation –19,042 324 –18,718Realised gains/losses transferred to profit and loss 2,476 2,476Transfer to insurance liabilities/DAC 2,193 2,193Change in cash flow hedge reserve 746 746Unrealised revaluations from net investment hedges 388 388Issuance costs incurred –20 –20Employee stock option and share plans –76 –76Cancellation of sharesExchange rate differences –951 –1 –952Total amount recognised directly in equity –14,190 –1 228 –13,963
Net result –369 –360 –729 –14,559 –1 –132 –14,692
Issue of non-voting equity securities 10,000 10,000Dividend –213 –3,387 –3,600Purchases/sales of treasury shares –44 –1,986 –2,030Exercise of warrants and options 5 443 448Balance as at 31 December 2008 495 9,182 10,000 –8,719 –951 17,327 27,334(1) Other reserves includes Retained earnings, Treasury shares, Other reserves and Unappropriated result.
239ING Group Annual Report 2008

2.2 Parent company annual accounts
Accounting policies for the parent company balance sheet and profit and loss account of ING Group
BASIS OF PRESENTATIONThe parent company accounts of ING Group are prepared in accordance with the financial reporting requirements included in Part 9 of Book 2, of the Dutch Civil Code. The accounting policies applicable to presentation and disclosures are in accordance with the financial reporting requirements included in Part 9 of Book 2, of the Dutch Civil Code. The principles of valuation and determination of results stated in connection with the consolidated balance sheet and profit and loss account are also applicable to the parent company balance sheet and profit and loss account with the exception of Investments in group companies and investments in associates which are initially recognised at cost and subsequently accounted for using the equity method of accounting.
The profit and loss account has been drawn up in accordance with Section 402, Book 2, of the Dutch Civil Code.
A list containing the information referred to in Section 379 (1), Book 2, of the Dutch Civil Code has been filed with the Netherlands Authority for the Financial Markets and the office of the Commercial Register of Amsterdam, in accordance with Section 379 (5), Book 2, of the Dutch Civil Code.
Changes in balance sheet values due to changes in the Revaluation reserve of the associates are reflected in the Share of associates reserve, which forms part of Shareholders’ equity. Changes in balance sheet values due to the results of these associates, accounted for in accordance with ING Group accounting policies, are included in the profit and loss account. Other changes in the balance sheet value of these associates, other than those due to changes in share capital, are included in Share of associates reserve in Other reserves.
A statutory reserve is carried at an amount equal to the share in the results of associates since their first inclusion at net asset value less the amount of profit distributions to which rights have accrued in the interim. Profit distributions which can be repatriated to the Netherlands without restriction are likewise deducted from the Share of associates reserve.
ING Group Annual Report 2008
240

Notes to the parent company balance sheet of ING Groupamounts in millions of euros, unless stated otherwise
1 INVESTMENTS IN WHOLLY OWNED SUBSIDIARIES
Investments in wholly owned subsidiaries
Balance sheet value2008 2007
ING Bank N.V. 22,890 24,038ING Verzekeringen N.V. 11,884 17,900Other –76 –74
34,698 41,864
Other includes certain intercompany eliminations between ING Bank N.V. and ING Verzekeringen N.V.
Changes in investments in wholly owned subsidiaries
2008 2007
Opening balance 41,864 42,607Revaluations –13,709 –5,364Result of the group companies –569 9,299Capital contribution 12,720 2,227Dividend –7,050 –5,900
33,256 42,869
Changes in ING Groep N.V. shares held by group companies 1,442 –1,005Closing balance 34,698 41,864
2 OTHER ASSETS
Other assets
2008 2007
Receivables from group companies 13,322 10,591Other receivables, prepayments and accruals 288 112
13,610 10,703
3 EQUITY
Equity
2008 2007
Share capital 495 534Share premium 9,182 8,739Non-voting equity securities 10,000Share of associates reserve –8,719 6,053Currency translation reserve –951 –950Other reserves 17,327 22,832Equity 27,334 37,208
The Share of associates reserve includes the following components: Reserve for non-distributable profit of associates of EUR 726 million (2007: EUR 1,202 million) and Revaluation reserve of associates of EUR – 9,445 million (2007: EUR 4,851 million).
Share capital
Ordinary shares (par value EUR 0.24)
Number x1,000 Amount2008 2007 2008 2007
Authorised share capital 4,500,000 3,000,000 1,080 720Unissued share capital 2,436,852 773,555 585 186Issued share capital 2,063,148 2,226,445 495 534
241ING Group Annual Report 2008

2.2 Parent company annual accounts
Notes to the parent company balance sheet of ING Group (continued)
Changes in issued share capital
Ordinary shares (par value EUR 0.24)
Number x1,000 Amount
Issued share capital as at 31 December 2006 2,205,093 530Issue of shares 5,569 1Exercise of B warrants 15,783 3Issued share capital as at 31 December 2007 2,226,445 534
Issue of shares 1,848 Buy-back of shares –183,158 –44Exercise of B warrants 18,013 5Issued share capital as at 31 December 2008 2,063,148 495
Changes in other reserves and unappropriated result
Retained earnings
Treasury shares
Other reserves
Total Other
reserves
Unappro-priated
result Total2008Opening balance 17,367 –3,740 –36 13,591 9,241 22,832Result for the year –729 –729Unrealised revaluations after taxation 324 324 324Changes in treasury shares –2,030 –2,030 –2,030Dividend –3,600 –3,600Transfer to share of associates reserve 582 582 582Transfer to retained earnings 5,641 5,641 –5,641 Employee stock option and share plans –76 –76 –76Issuance costs incurred –20 –20 –20Cancellation of shares 4,904 –4,860 44 44 Closing balance 23,838 –866 –4,916 18,056 –729 17,327
Changes in other reserves and unappropriated result
Retained earnings
Treasury shares
Other reserves
Total Other reserves
Unappro-priated
result Total2007Opening balance 12,591 –1,436 –37 11,118 7,692 18,810Result for the year 9,241 9,241Unrealised revaluations after taxation 1 1 1Changes in treasury shares –2,304 –2,304 –2,304Dividend –2,999 –2,999Transfer to share of associates reserve –174 –174 –174Transfer to retained earnings 4,693 4,693 –4,693Employee stock option and share plans 104 104 104Other 153 153 153Closing balance 17,367 –3,740 –36 13,591 9,241 22,832
As at 31 December 2008, the Share of associates reserve included an amount of EUR 566 million (2007: EUR 566 million) related to Regio Bank N.V. (formerly Stichting Regio Bank) that cannot be freely distributed.
Positive components of the Share of associates reserve and Currency translation reserve cannot be freely distributed. The reserve for cash flow hedges is included in the Share of associates reserve on a net basis. Retained earnings can be freely distributed, except for an amount equal to the negative balance in each of the components of the Currency translation reserve and Share of associates reserve. Unrealised gains and losses on derivatives, other than those used in cash flow hedges, are presented in the profit and loss account and are therefore part of Retained earnings and are not included in Share of associates reserve.
ING Group Annual Report 2008
242

The total amount of Equity in the parent company annual accounts equals Shareholders’ equity (parent) in the consolidated annual accounts. Certain components within equity are different, as a result of the following presentation differences between the parent company accounts and consolidated accounts:
Unrealised revaluations within consolidated group companies, presented in the Revaluation reserve in the consolidated accounts, •are presented in the Share of associates reserve in the parent company accounts;Foreign currency translation on consolidated group companies, presented in the Currency translation reserve in the consolidated •accounts, is presented in the Share of associates reserve in the parent company accounts;Revaluations on investment property and certain participations recognised in income and consequently presented in Retained earnings •in the consolidated accounts, is presented in the Share of associates reserve in the parent company accounts.
The total amount of non-distributable reserves is EUR 11,121 million (2007: EUR 7,003 million).
See Note 12 ‘Shareholders’ equity (parent)/Non-voting equity securities’ in the consolidated annual accounts for additional information, including restrictions with respect to dividend and repayment of capital.
Change in treasury shares
Amount Number2008 2007 2008 2007
Opening balance 3,740 1,436 126,759,829 53,859,235Purchased/sold 2,159 2,505 94,105,700 79,652,109Cancelled –4,904 –183,158,017Share-based payments –22 –201 –1,250,394 –6,751,515Other –107Closing balance 866 3,740 36,457,118 126,759,829
4 PREFERENCE SHARESSee Note 13 ‘Preference shares’ to the consolidated financial statements.
5 SUBORDINATED LOANS
Subordinated loans
Interest rate Year of issue Due dateNotional amount in original currency
2008Balance sheet value
2007
9.000% 2008 Perpetual EUR 10 108.500% 2008 Perpetual USD 2,000 1,3938.000% 2008 Perpetual EUR 1,500 1,4747.375% 2007 Perpetual USD 1,500 1,048 9886.375% 2007 Perpetual USD 1,045 731 6905.140% 2006 Perpetual GBP 1,600 623 8105.775% 2005 Perpetual USD 1,000 711 6746.125% 2005 Perpetual USD 1,700 487 4624.176% 2005 Perpetual EUR 1,500 497 497Variable 2004 Perpetual EUR 1,000 939 9376.200% 2003 Perpetual USD 1,500 348 330Variable 2003 Perpetual EUR 1,750 684 6827.200% 2002 Perpetual USD 1,100 773 7267.050% 2002 Perpetual USD 1,800 563 5298.439% 2000 31 December 2030 USD 1,500 1,071 1,014
11,352 8,339
243ING Group Annual Report 2008
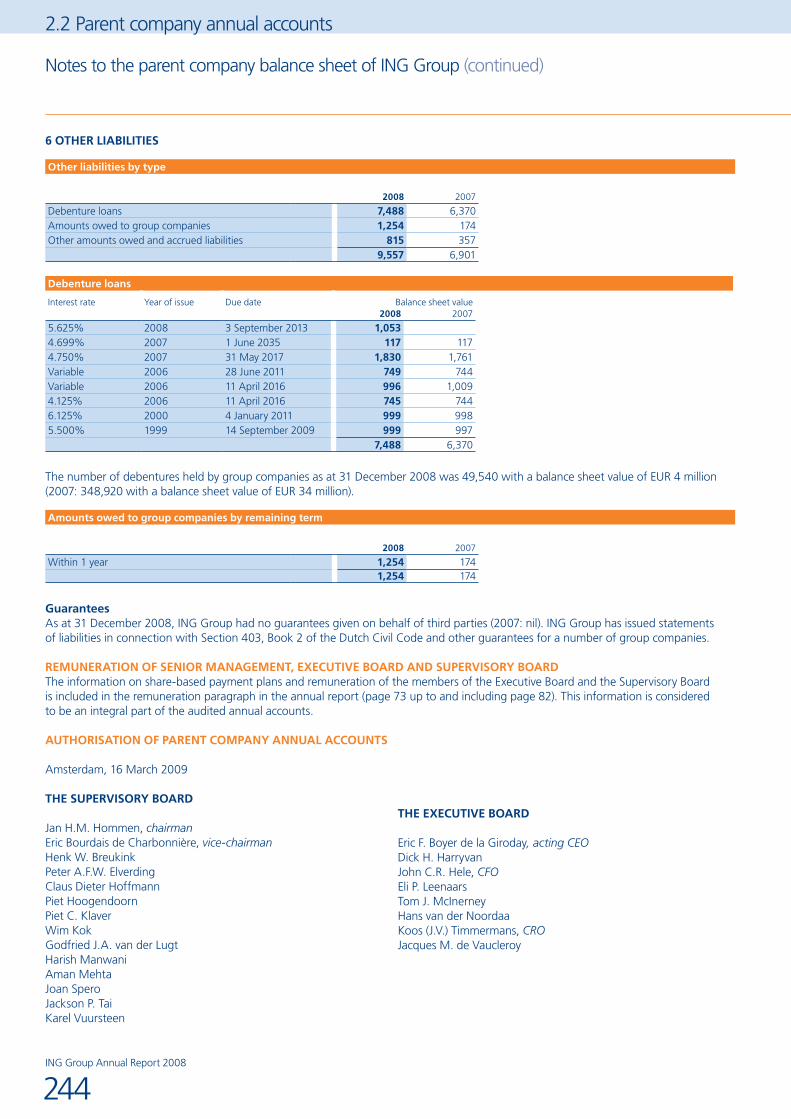
2.2 Parent company annual accounts
6 OTHER LIABILITIES
Other liabilities by type
2008 2007
Debenture loans 7,488 6,370Amounts owed to group companies 1,254 174Other amounts owed and accrued liabilities 815 357
9,557 6,901
Debenture loans
Interest rate Year of issue Due date Balance sheet value2008 2007
5.625% 2008 3 September 2013 1,0534.699% 2007 1 June 2035 117 1174.750% 2007 31 May 2017 1,830 1,761Variable 2006 28 June 2011 749 744Variable 2006 11 April 2016 996 1,0094.125% 2006 11 April 2016 745 7446.125% 2000 4 January 2011 999 9985.500% 1999 14 September 2009 999 997
7,488 6,370
The number of debentures held by group companies as at 31 December 2008 was 49,540 with a balance sheet value of EUR 4 million (2007: 348,920 with a balance sheet value of EUR 34 million).
Amounts owed to group companies by remaining term
2008 2007
Within 1 year 1,254 1741,254 174
GuaranteesAs at 31 December 2008, ING Group had no guarantees given on behalf of third parties (2007: nil). ING Group has issued statements of liabilities in connection with Section 403, Book 2 of the Dutch Civil Code and other guarantees for a number of group companies.
REMUNERATION OF SENIOR MANAGEMENT, EXECUTIVE BOARD AND SUPERVISORY BOARDThe information on share-based payment plans and remuneration of the members of the Executive Board and the Supervisory Board is included in the remuneration paragraph in the annual report (page 73 up to and including page 82). This information is considered to be an integral part of the audited annual accounts.
AUTHORISATION OF PARENT COMPANY ANNUAL ACCOUNTS
Amsterdam, 16 March 2009
THE SUPERVISORY BOARD
Jan H.M. Hommen, chairmanEric Bourdais de Charbonnière, vice-chairmanHenk W. BreukinkPeter A.F.W. ElverdingClaus Dieter HoffmannPiet HoogendoornPiet C. KlaverWim KokGodfried J.A. van der LugtHarish ManwaniAman MehtaJoan SperoJackson P. TaiKarel Vuursteen
THE EXECUTIVE BOARD
Eric F. Boyer de la Giroday, acting CEODick H. HarryvanJohn C.R. Hele, CFOEli P. LeenaarsTom J. McInerneyHans van der NoordaaKoos (J.V.) Timmermans, CROJacques M. de Vaucleroy
Notes to the parent company balance sheet of ING Group (continued)
ING Group Annual Report 2008
244
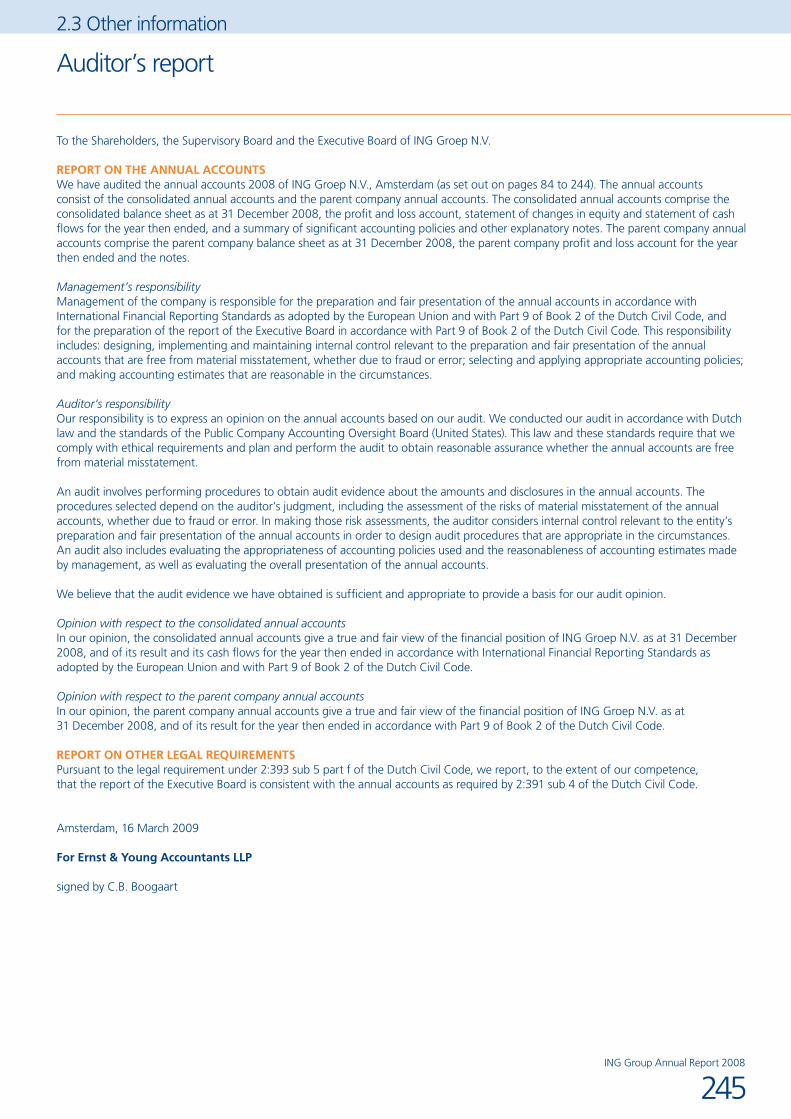
Auditor’s report
2.3 Other information
To the Shareholders, the Supervisory Board and the Executive Board of ING Groep N.V.
REPORT ON THE ANNUAL ACCOUNTSWe have audited the annual accounts 2008 of ING Groep N.V., Amsterdam (as set out on pages 84 to 244). The annual accounts consist of the consolidated annual accounts and the parent company annual accounts. The consolidated annual accounts comprise the consolidated balance sheet as at 31 December 2008, the profit and loss account, statement of changes in equity and statement of cash flows for the year then ended, and a summary of significant accounting policies and other explanatory notes. The parent company annual accounts comprise the parent company balance sheet as at 31 December 2008, the parent company profit and loss account for the year then ended and the notes.
Management’s responsibilityManagement of the company is responsible for the preparation and fair presentation of the annual accounts in accordance with International Financial Reporting Standards as adopted by the European Union and with Part 9 of Book 2 of the Dutch Civil Code, and for the preparation of the report of the Executive Board in accordance with Part 9 of Book 2 of the Dutch Civil Code. This responsibility includes: designing, implementing and maintaining internal control relevant to the preparation and fair presentation of the annual accounts that are free from material misstatement, whether due to fraud or error; selecting and applying appropriate accounting policies; and making accounting estimates that are reasonable in the circumstances.
Auditor’s responsibilityOur responsibility is to express an opinion on the annual accounts based on our audit. We conducted our audit in accordance with Dutch law and the standards of the Public Company Accounting Oversight Board (United States). This law and these standards require that we comply with ethical requirements and plan and perform the audit to obtain reasonable assurance whether the annual accounts are free from material misstatement.
An audit involves performing procedures to obtain audit evidence about the amounts and disclosures in the annual accounts. The procedures selected depend on the auditor’s judgment, including the assessment of the risks of material misstatement of the annual accounts, whether due to fraud or error. In making those risk assessments, the auditor considers internal control relevant to the entity’s preparation and fair presentation of the annual accounts in order to design audit procedures that are appropriate in the circumstances. An audit also includes evaluating the appropriateness of accounting policies used and the reasonableness of accounting estimates made by management, as well as evaluating the overall presentation of the annual accounts.
We believe that the audit evidence we have obtained is sufficient and appropriate to provide a basis for our audit opinion.
Opinion with respect to the consolidated annual accountsIn our opinion, the consolidated annual accounts give a true and fair view of the financial position of ING Groep N.V. as at 31 December 2008, and of its result and its cash flows for the year then ended in accordance with International Financial Reporting Standards as adopted by the European Union and with Part 9 of Book 2 of the Dutch Civil Code.
Opinion with respect to the parent company annual accountsIn our opinion, the parent company annual accounts give a true and fair view of the financial position of ING Groep N.V. as at 31 December 2008, and of its result for the year then ended in accordance with Part 9 of Book 2 of the Dutch Civil Code.
REPORT ON OTHER LEGAL REQUIREMENTSPursuant to the legal requirement under 2:393 sub 5 part f of the Dutch Civil Code, we report, to the extent of our competence, that the report of the Executive Board is consistent with the annual accounts as required by 2:391 sub 4 of the Dutch Civil Code.
Amsterdam, 16 March 2009
For Ernst & Young Accountants LLP
signed by C.B. Boogaart
245ING Group Annual Report 2008

2.3 Other information
Proposed appropriation of result and Subsequent eventsamounts in millions of euros, except for amounts per share
PROPOSED APPROPRIATION OF RESULTThe result is appropriated pursuant to Article 37 of the Articles of Association of ING Groep N.V., the relevant stipulations of which state that the part of the result remaining after the Executive Board, with the approval of the Supervisory Board, has determined the appropriation to reserves, shall be at the disposal of the General Meeting of Shareholders.
It is proposed to declare a dividend of EUR 0.74 per ordinary share of EUR 0.24.
In August 2008, an interim dividend of EUR 0.74 per ordinary share of EUR 0.24 was made payable. This interim dividend was paid in cash. Accordingly it is proposed that no final dividend will be paid.
Proposed appropriation of result
Net result –729Deduction from reserves pursuant to Article 37 (4) of the Articles of Association –2,654Payable on non-voting equity securities 425At the disposal of the General Meeting of Shareholders pursuant to Article 37 (5) of the Articles of Association 1,500
Dividend of EUR 0.74 per ordinary share
SUBSEQUENT EVENTSOn 26 January 2009 ING Group and the Dutch government announced that they have reached an agreement on an Illiquid Assets Back-Up Facility. Reference is made to section ‘Subsequent events’ in the consolidated annual accounts.
As disclosed in this Annual Report, shareholders’ equity and net result of ING in 2008 were significantly impacted by the turmoil and extreme volatility in the worldwide financial markets. These financial markets and the worldwide economies have deteriorated further in the first months of 2009 in several areas, especially the equity markets. Current levels continuing or further negative developments in these financial markets and/or economies in 2009 may have a material adverse impact on shareholders’ equity and net result for 2009. Any such impact cannot be reliably estimated at the date of this Annual Report.
ING Group Annual Report 2008
246
Risk factors
RISKS RELATED TO THE FINANCIAL SERVICES INDUSTRYBecause we are an integrated financial services company conducting business on a global basis, our revenues and earnings are affected by the volatility and strength of the economic, business and capital markets environments specific to the geographic regions in which we conduct business. The ongoing turbulence and volatility of such factors have adversely affected, and may continue to adversely affect the profitability of our insurance, banking and asset management business.
Factors such as interest rates, securities prices, credit (including liquidity) spreads, exchange rates, consumer spending, business investment, real estate and private equity valuations, government spending, inflation, the volatility and strength of the capital markets, and terrorism all impact the business and economic environment and, ultimately, the amount and profitability of business we conduct in a specific geographic region. For example, in an economic downturn, such as the one currently taking place, characterised by higher unemployment, lower family income, lower corporate earnings, higher corporate and private debt defaults, lower business investment and consumer spending, the demand for banking and insurance products is adversely affected and our reserves and provisions are likely to increase, resulting in lower earnings. Securities prices, real estate valuations and private equity valuations may be adversely impacted and any such losses would be realised through profit and loss and shareholders equity. Some insurance products contain minimum return or accumulation guarantees. If returns do no meet or exceed the guarantee levels we may need to set up additional reserves to fund these future guaranteed benefits. In addition, we may experience an elevated incidence of claims and lapses or surrenders of policies. Our policyholders may choose to defer paying insurance premiums or stop paying insurance premiums altogether. Similarly, a downturn in the equity markets, such as the one currently taking place, causes a reduction in commission income we earn from managing portfolios for third parties, income generated from our own proprietary portfolios, asset-based fee income on certain insurance products, and our capital base. We also offer a number of insurance and financial products that expose us to risks associated with fluctuations in interest rates, securities prices, corporate and private default rates, the value of real estate assets, exchange rates and credit spreads.
In case one or more of the factors mentioned above adversely affects the profitability of our business this might also result, among others, in the following:
the unlocking of deferred acquisition costs impacting earnings; and/or•reserve inadequacies which could ultimately be realised through profit and loss and shareholders equity; and/or•the write down of tax assets impacting net results; and or•impairment expenses related to goodwill and other intangible assets, impacting net results.•
Management believes that if ongoing market volatility adversely impacts the performance of the reporting units Retail Banking - Central Europe and Insurance Americas - United States, compared with what was assumed in the year-end 2008 goodwill impairment test, the book value (including goodwill) of these reporting units may exceed the related fair values, which would result in impairments. See Note 9 ‘Intangible assets’ in the consolidated financial statements.
Shareholders’ equity and net result of ING in 2008 were significantly impacted by the turmoil and the extreme volatility in the worldwide financial markets. The financial markets and worldwide economies have deteriorated further in the first months of 2009 in several areas, especially the equity markets. Current levels continuing or a further negative development in financial markets and/or economies in 2009 may have a material adverse impact on shareholders’ equity and net result in future periods, including as a result of the potential consequences listed above. See ‘Subsequent events’ in the consolidated financial statements.
Adverse capital and credit market conditions may impact our ability to access liquidity and capital, as well as the cost of credit and capital.
The capital and credit markets have been experiencing extreme volatility and disruption for more than eighteen months. In the second half of 2008, the volatility and disruption reached unprecedented levels. In some cases, market developments have resulted in restrictions on the availability of liquidity and credit capacity for certain issuers.We need liquidity in our day-to-day business activities to pay our operating expenses, interest on our debt and dividends on our capital stock; maintain our securities lending activities; and replace certain maturing liabilities. The principal sources of our liquidity are insurance premiums, annuity considerations, deposit funds, cash flow from our investment portfolio and assets, consisting mainly of cash or assets that are readily convertible into cash. Sources of liquidity in normal markets also include a variety of short- and long-term instruments, including repurchase agreements, commercial paper, medium- and long-term debt, junior subordinated debt securities, capital securities and stockholders’ equity.
In the event current resources do not satisfy our needs, we may have to seek additional financing. The availability of additional financing will depend on a variety of factors such as market conditions, the general availability of credit, the volume of trading activities, the overall availability of credit to the financial services industry, our credit ratings and credit capacity, as well as the possibility that customers or lenders could develop a negative perception of our long- or short-term financial prospects. Similarly, our access to funds may be limited if regulatory authorities or rating agencies take negative actions against us. If our internal sources of liquidity prove to be insufficient, there is a risk that external funding sources might not be available or available at unfavourable terms.
2.4 Additional information
247ING Group Annual Report 2008

Risk factors (continued)
Disruptions, uncertainty or volatility in the capital and credit markets may also limit our access to capital required to operate our business. Such market conditions may limit our ability to raise additional capital to support business growth, or to counter-balance the consequences of losses or increased regulatory capital requirements. This could force us to delay raising capital, issue capital of different types or under different terms than we would otherwise, or incur a higher cost of capital than in a more stable market environment. This would have the potential to decrease both our profitability and our financial flexibility. Our results of operations, financial condition, cash flows and regulatory capital position could be materially adversely affected by disruptions in the financial markets.In the course of 2008 governments around the world, including the Dutch government, have implemented measures providing assistance to financial institutions, in certain cases requiring (indirect) influence on or changes to governance and remuneration practices. In certain cases governments have even nationalised companies or parts thereof. The measures adopted in the Netherlands consist in both liquidity provision and capital reinforcement, and a Dutch Capital Guarantee Scheme. The liquidity and capital reinforcement measures apply for a period of one year as of 10 October 2008, while the Dutch Credit Guarantee Scheme is scheduled to run through 31 December 2009. So far we have been able to benefit from these measures. Going forward, the Dutch authorities will look at each application individually. Potential future transactions with the Dutch government or any other government or actions by such government regarding ING could adversely impact the position or rights of shareholders.
Because our life and non-life insurance and reinsurance businesses are subject to losses from unforeseeable and/or catastrophic events, which are inherently unpredictable, our actual claims amount may exceed our established reserves or we may experience an abrupt interruption of activities, each of which could result in lower net results and have an adverse effect on our results of operations.
In our life and non-life insurance and reinsurance businesses, we are subject to losses from natural and man-made catastrophic events. Such events include, without limitation, weather and other natural catastrophes such as hurricanes, floods, earthquakes and epidemics, as well as events such as terrorist attacks. The frequency and severity of such events, and the losses associated with them, are inherently unpredictable and can not always be adequately reserved for. Furthermore, we are subject to actuarial and underwriting risks such as, for instance, mortality, morbidity, and adverse home claims development which result from the pricing and acceptance of insurance contracts. In accordance with industry practices, modelling of natural catastrophes are performed and risk mitigation measures are made. In case claims occur, reserves are established based on estimates using actuarial projection techniques. The process of estimating is based on information available at the time the reserves are originally established and includes updates when more information becomes available. Although we continually review the adequacy of the established claim reserves, and based on current information, we believe our claim reserves are sufficient, there can be no assurances that our actual claims experience will not exceed our estimated claim reserves. If actual claim amounts exceed the estimated claim reserves, our earnings may be reduced and our net results may be adversely affected. In addition, because unforeseeable and/or catastrophic events can lead to an abrupt interruption of activities, our banking and insurance operations may be subject to losses resulting from such disruptions. Losses can relate to property, financial assets, trading positions, insurance and pension benefits to employees and also to key personnel. If our business continuity plans are not able to be put into action or do not take such events into account, losses may further increase.
Because we operate in highly regulated industries, laws, regulations and regulatory policies or the enforcement thereof that govern activities in our various business lines could have an effect on our reputation, operations and net results.
We are subject to detailed banking, insurance, asset management and other financial services laws and government regulation in each of the jurisdictions in which we conduct business. Regulatory agencies have broad administrative power over many aspects of the financial services business, which may include liquidity, capital adequacy and permitted investments, ethical issues, money laundering, privacy, record keeping, and marketing and selling practices. Banking, insurance and other financial services laws, regulations and policies currently governing us and our subsidiaries may also change at any time in ways which have an adverse effect on our business, and it is difficult to predict the timing or form of any future regulatory or enforcement initiatives in respect thereof. Also, bank regulators and other supervisory authorities in the EU, the US and elsewhere continue to scrutinise payment processing and other transactions under regulations governing such matters as money-laundering, prohibited transactions with countries subject to sanctions, and bribery or other anti-corruption measures. Regulation is becoming increasingly more extensive and complex and regulators are focusing increased scrutiny on the industries in which we operate, often requiring additional Company resources. These regulations can serve to limit our activities, including through our net capital, customer protection and market conduct requirements, and restrictions on businesses in which we can operate or invest. If we fail to address, or appear to fail to address, appropriately any of these matters, our reputation could be harmed and we could be subject to additional legal risk, which could, in turn, increase the size and number of claims and damages asserted against us or subject us to enforcement actions, fines and penalties.
In light of current conditions in the global financial markets and the global economy, regulators have increased their focus on the regulation of the financial services industry. Most of the principal markets where we conduct our business have adopted, or are currently considering, major legislative and/or regulatory initiatives in response to the financial crisis. In particular, governmental and regulatory authorities in the Netherlands, the United Kingdom, the United States and elsewhere are implementing measures to increase regulatory control in their respective financial markets and financial services sectors, including in the areas of prudential rules, capital requirements, executive compensation and financial reporting, among others. Most recently, governments in the Netherlands and abroad have intervened on an unprecedented scale, responding to stresses experienced in the global financial markets. Some of the measures adopted subject us and other institutions for which they were designed to additional restrictions, oversight or costs. For restrictions related to the
2.4 Additional information
ING Group Annual Report 2008
248

agreements of ING with the Dutch State, see ‘Risks related to the Company - Our agreements with the Dutch State impose certain restrictions regarding the issuance or repurchase of our shares and the compensation of certain senior management positions.’ We cannot predict whether or when future legislative or regulatory actions may be taken, or what impact, if any, actions taken to date or in the future could have on our business, results of operations and financial condition.
Despite our efforts to maintain effective compliance procedures and to comply with applicable laws and regulations, there are a number of risks in areas where applicable regulations may be unclear, subject to multiple interpretation or conflict with one another, where regulators revise their previous guidance or courts overturn previous rulings, or we fail to meet applicable standards. Regulators and other authorities have the power to bring administrative or judicial proceedings against us, which could result, amongst other things, in suspension or revocation of our licenses, cease and desist orders, fines, civil penalties, criminal penalties or other disciplinary action which could materially harm our results of operations and financial condition.
RISKS RELATED TO THE COMPANYOngoing turbulence and volatility in the financial markets have adversely affected us, and may continue to do so. We currently do not expect these conditions to improve in the short term.
Our results of operations are materially impacted by conditions in the global capital markets and the economy generally. The stress experienced in the global capital markets that started in the second half of 2007 continued and substantially increased throughout 2008 and continues in 2009. The crisis in the mortgage market in the United States, triggered by a serious deterioration of credit quality, led to a revaluation of credit risks. These conditions have resulted in greater volatility, widening of credit spreads and overall shortage of liquidity and tightening of financial markets throughout the world. In addition, prices for many types of asset-backed securities (ABS) and other structured products have significantly deteriorated. These concerns have since expanded to include a broad range of fixed income securities, including those rated investment grade, the international credit and interbank money markets generally, and a wide range of financial institutions and markets, asset classes, such as public and private equity, and real estate sectors. As a result, the market for fixed income instruments has experienced decreased liquidity, increased price volatility, credit downgrade events, and increased probability of default. Securities that are less liquid are more difficult to value and may be hard to dispose of. International equity markets have also been experiencing heightened volatility and turmoil, with issuers, including ourselves, that have exposure to the real estate, mortgage, private equity and credit markets particularly affected. These events and the continuing market upheavals, including extreme levels of volatility, have had and may continue to have an adverse effect on our revenues and results of operations, in part because we have a large investment portfolio and extensive real estate activities around the world. In addition, the confidence of customers in financial institutions is being tested. Reduced confidence could have an adverse effect on our revenues and results of operations, including through an increase of lapses or surrenders of policies and withdrawal of deposits.
As a result of the ongoing and unprecedented volatility in the global financial markets in 2007 and 2008, we have incurred negative revaluations on our investment portfolio, which have impacted our earnings and shareholders’ equity. Furthermore, we have incurred impairments and other losses, which have impacted our profit and loss accounts. Reserves for insurance liabilities are overall adequate at the Group and Business line level. Inadequacies in certain product areas have developed.
Such impacts have arisen primarily as a result of valuation issues arising in connection with our investments in real estate and private equity, exposures to US mortgage-related structured investment products, including sub-prime and Alt-A Residential and Commercial Mortgage-Backed Securities (CMBS and RMBS), Collateralised Debt Obligations (CDOs) and Collateralised Loan Obligations (CLOs), monoline insurer guarantees, Structured Investment Vehicles (SIVs) and other investments. In many cases, the markets for such investments and instruments have become highly illiquid, and issues relating to counterparty credit ratings and other factors have exacerbated pricing and valuation uncertainties. Valuation of such investments and instruments is a complex process involving the consideration of market transactions, pricing models, management judgment and other factors, and is also impacted by external factors such as underlying mortgage default rates, interest rates, rating agency actions and property valuations. While we continue to monitor our exposures in this area, in light of the ongoing market environment and the resulting uncertainties concerning valuations, there can be no assurances that we will not experience further negative impacts to our shareholders’ equity or profit and loss accounts from such assets in future periods.
Because we operate in highly competitive markets, including our home market, we may not be able to increase or maintain our market share, which may have an adverse effect on our results of operations.
There is substantial competition in the Netherlands and the other countries in which we do business for the types of insurance, commercial banking, investment banking, asset management and other products and services we provide. Customer loyalty and retention can be influenced by a number of factors, including relative service levels, the prices and attributes of products and services, and actions taken by competitors. If we are not able to match or compete with the products and services offered by our competitors, it could adversely impact our ability to maintain or further increase our market share, which would adversely affect our results of operations. Such competition is most pronounced in our more mature markets of the Netherlands, Belgium, the Rest of Europe, the United States, Canada and Australia. In recent years, however, competition in emerging markets, such as Latin America, Asia and Central and Eastern Europe, has also increased as large insurance and banking industry participants from more developed countries have sought to establish themselves in markets which are perceived to offer higher growth potential, and as local institutions have become more
249ING Group Annual Report 2008
Risk factors (continued)
sophisticated and competitive and have sought alliances, mergers or strategic relationships with our competitors. The Netherlands and the United States are our largest markets for both our banking and insurance operations. Our main competitors in the banking sector in the Netherlands are ABN AMRO Bank/Fortis and Rabobank. Our main competitors in the insurance sector in the Netherlands are Achmea, Fortis and Aegon. Our main competitors in the United States are insurance companies such as Lincoln National, Hartford, Aegon Americas, AXA, Met Life, Prudential, Nationwide and Principal Financial. Increasing competition in these or any of our other markets may significantly impact our results if we are unable to match the products and services offered by our competitors. Over time, certain sectors of the financial services industry have become more concentrated, as institutions involved in a broad range of financial services have been acquired by or merged into other firms or have declared bankruptcy. In 2008, this trend accelerated considerably, as several major financial institutions consolidated, were forced to merge or received substantial government assistance. These developments could result in our competitors gaining greater access to capital and liquidity, expanding their ranges of products and services, or gaining geographic diversity. We may experience pricing pressures as a result of these factors in the event that some of our competitors seek to increase market share by reducing prices.
Because we do business with many counterparties, the inability of these counterparties to meet their financial obligations could have an adverse effect on our results of operations.
GeneralThird-parties that owe us money, securities or other assets may not pay or perform under their obligations. These parties include the issuers whose securities we hold, borrowers under loans originated, customers, trading counterparties, counterparties under swaps, credit default and other derivative contracts, clearing agents, exchanges, clearing house and other financial intermediaries. Defaults by one or more of these parties on their obligations to us due to bankruptcy, lack of liquidity, downturns in the economy or real estate values, operational failure, etc., or even rumours about potential defaults by one or more of these parties or regarding the financial services industry generally, could lead to losses for us, and defaults by other institutions. In addition, with respect to secured transactions, our credit risk may be exacerbated when the collateral held by us cannot be realised, or is liquidated at prices not sufficient to recover the full amount of the loan or derivative exposure due us. We also have exposure to a number of financial institutions in the form of unsecured debt instruments, derivative transactions and equity investments. There is no assurance that losses on, or impairments to the carrying value of these assets would not materially and adversely affect our business or results of operations.
ReinsurersOur insurance operations have bought protection for risks that exceed certain risk tolerance levels set for both our life and non-life businesses. This protection is bought through reinsurance arrangements in order to reduce possible losses. Because in most cases we must pay the policyholders first, and then collect from the reinsurer, we are subject to credit risk with respect to each reinsurer for all such amounts. As a percentage of our (potential) reinsurance receivables as of 31 December 2008, the greatest exposure after collateral to an individual reinsurer was approximately 32%, approximately 68% related to four other reinsurers and the remainder of the reinsurance receivables balance related to various other reinsurers. The inability or unwillingness of any one of these reinsurers to meet its financial obligations to us, or the insolvency of our reinsurers, could have a material adverse effect on our net results and our financial results.
Because we use assumptions about factors to determine the insurance provisions, deferred acquisition costs (DAC) and value of business added (VOBA), the use of different assumptions about these factors may have an adverse impact on our results of operations.
The establishment of insurance provisions, including the impact of minimum guarantees which are contained within certain variable annuity products, the adequacy test performed on the provisions for life policies and the establishment of DAC and VOBA are inherently uncertain processes involving assumptions about factors such as court decisions, changes in laws, social, economic and demographic trends, inflation, investment returns, policyholder behaviour (e.g. lapses, persistency, etc.) and other factors, and, in the life insurance business, assumptions concerning mortality and morbidity trends.
The use of different assumptions about these factors could have a material effect on insurance provisions and underwriting expense. Changes in assumptions may lead to changes in the insurance provisions over time. Furthermore, some of these assumptions can be volatile.
Because we use assumptions to model client behaviour for the purpose of our market risk calculations, the difference between the realisation and the assumptions may have an adverse impact on the risk figures and future results.
We use assumptions in order to model client behaviour for the risk calculations in our banking and insurance books. Assumptions are used to determine insurance liabilities, the price sensitivity of savings and current accounts and to estimate the embedded optional risk in the mortgage and investment portfolios. The realisation or use of different assumptions to determine the client behaviour could have material adverse effect on the calculated risk figures and ultimately future results.
2.4 Additional information
ING Group Annual Report 2008
250

Because we also operate in markets with less developed judiciary and dispute resolution systems, in the event of disputes in these markets, the quality and the effectiveness of such systems could have an adverse effect on our operations and net results.In the less developed markets in which we operate, judiciary and dispute resolution systems may be less developed. As a result in case of a breach of contract we may have difficulties in making and enforcing claims against contractual counterparties and, if claims are made against us, we might encounter difficulties in mounting a defence against such allegations. If we become party to legal proceedings in a market with an insufficiently developed judiciary system, it could have an adverse effect on our operations and net result.
Because we are a financial services company and we are continually developing new financial products, we might be faced with claims that could have an adverse effect on our operations and net result if clients’ expectations are not met.
When new financial products are brought to the market, communication and marketing aims to present a balanced view of the product (however there is a focus on potential advantages for the customers). Whilst we engage in a due diligence process when we develop products, if the products do not generate the expected profit, or result in a loss, or otherwise do not meet expectations, customers may file claims against us. Such claims could have an adverse effect on our operations and net result.
Ratings are important to our business for a number of reasons. Among these are the issuance of debt, the sale of certain products and the risk weighting of Bank assets. Downgrades could have an adverse impact on our operations and net results.
We obtain credit ratings from Standard & Poor’s, Moody’s and Fitch. While we aim to maintain a senior unsecured rating of AA, each of the rating agencies reviews its ratings and rating methodologies on a recurring basis and may decide on a downgrade at any time. In the event of a downgrade the cost of issuing debt will increase, having an adverse effect on net results.
Claims paying ability, at the Group or subsidiary level, and financial strength ratings are factors in establishing the competitive position of insurers. A rating downgrade could elevate lapses or surrenders of policies requiring cash payments, which might force us to sell assets at a price that may result in realised investment losses. Among others, total invested assets decreases and deferred acquisition costs might need to be accelerated, adversely impacting earnings. A downgrade may adversely impact relationships with distributors of our products and services and customers, which may affect new sales and our competitive position.
Our Bank assets are risk weighted. Downgrades of these assets could result in a higher risk weighting which may result in higher capital requirements and thus a need to deleverage. This may impact net earnings and the return on capital, and may have an adverse impact on our competitive position.
Our business may be negatively affected by a sustained increase in inflation.
A sustained increase in the inflation rate in our principal markets would have multiple impacts on ING and may negatively affect our business, solvency position and results of operations. For example, a sustained increase in the inflation rate may result in an increase in market interest rates which may (i) decrease the value of certain fixed income securities we hold in our investment portfolios resulting in reduced levels of unrealised capital gains available to us which could negatively impact our solvency position and net income, (ii) result in increased surrenders of certain life & savings products, particularly, those with fixed rates below market rates, and (iii) require us, as an issuer of securities, to pay higher interest rates on debt securities we issue in the financial markets from time to time to finance our operations which would increase our interest expenses and reduce our results of operations. A significant and sustained increase in inflation has historically also been associated with decreased prices for equity securities and sluggish performance of equity markets generally. A sustained decline in equity markets may (i) result in impairment charges to equity securities that we hold in our investment portfolios and reduced levels of unrealised capital gains available to us which would reduce our net income and negatively impact our solvency position, (ii) negatively impact performance, future sales and surrenders of our unit-linked products where underlying investments are often allocated to equity funds, and (iii) negatively impact the ability of our asset management subsidiaries to retain and attract assets under management, as well as the value of assets they do manage, which may negatively impact their results of operations. In addition, in the context of certain property & casualty risks underwritten by our insurance subsidiaries (particularly ‘long-tail’ risks), a sustained increase in inflation with a resulting increase in market interest rates may result in (i) claims inflation (i.e., an increase in the amount ultimately paid to settle claims several years after the policy coverage period or event giving rise to the claim), coupled with (ii) an underestimation of corresponding claims reserves at the time of establishment due to a failure to fully anticipate increased inflation and its effect on the amounts ultimately payable to policyholders, and, consequently, (iii) actual claims payments significantly exceeding associated insurance reserves which would negatively impact our results of operations. In addition, a failure to accurately anticipate higher inflation and factor it into our product pricing assumptions may result in a systemic mis-pricing of our products resulting in underwriting losses which would negatively impact our results of operations.
251ING Group Annual Report 2008

Risk factors (continued)
Operational risks are inherent in our business.
Our businesses depend on the ability to process a large number of transactions efficiently and accurately. Losses can result from inadequate personnel, inadequate or failed internal control processes and systems or from external events that interrupt normal business operations. We also face the risk that the design of our controls and procedures prove to be inadequate or are circumvented. We have suffered losses from operational risk in the past and there can be no assurance that we will not suffer material losses from operational risk in the future.
Our business may be negatively affected by adverse publicity, regulatory actions or litigation with respect to the Company, other well-known companies or the financial services industry in general.
Adverse publicity and damage to ING’s reputation arising from its failure or perceived failure to comply with legal and regulatory requirements, financial reporting irregularities involving other large and well known companies, increasing regulatory and law enforcement scrutiny of ‘know your customer’ anti-money laundering, prohibited transactions with countries subject to sanctions, and bribery or other anti-corruption measures and anti-terrorist-financing procedures and their effectiveness, regulatory investigations of the mutual fund, banking and insurance industries, and litigation that arises from the failure or perceived failure by ING to comply with legal, regulatory and compliance requirements, could result in adverse publicity and reputation harm, lead to increased regulatory supervision, affect our ability to attract and retain customers, maintain access to the capital markets, result in cease and desist orders, suits, enforcement actions, fines and civil and criminal penalties, other disciplinary action or have other material adverse effects on us in ways that are not predictable.
Because we are a Dutch company and because the Stichting ING Aandelen holds more than 99% of our Ordinary shares, the rights of our shareholders may differ from the rights of shareholders in other jurisdictions, which could affect your rights as a shareholder.
While holders of our bearer receipts are entitled to attend and speak at the General Meeting, voting rights are not attached to the bearer depositary receipts. Stichting ING Aandelen (‘the Trust’) holds more than 99% of our Ordinary shares, and exercises the voting rights attached to the Ordinary shares (for which bearer receipts have been issued). Holders of bearer receipts who attend – in person or by proxy – the General Meeting must obtain voting rights by proxy from the Trust. Holders of bearer receipts and holders of the ADSs (American Depositary Shares) representing the bearer receipts, who do not attend the General Meeting, may give binding voting instructions to the Trust. The Trust is entitled to vote on any Ordinary shares underlying the bearer depositary receipts for which the Trust has not granted voting proxies, or voting instructions have not been given to the Trust. In exercising its voting discretion, the Trust is required to make use of the voting rights attached to the Ordinary shares in the interest of the holders of bearer receipts, while taking into account:
our interests;•the interests of our affiliates; and•the interests of our other stakeholders.•
In such a way that all interests are balanced and safeguarded as effectively as possible. The Trust may, but has no obligation to, consult with the holders of bearer receipts or ADSs in exercising its voting rights in respect of any Ordinary shares for which it is entitled to vote. These arrangements differ from practices in other jurisdictions, and accordingly may affect the rights of the holders of bearer receipts or ADSs and their power to affect the Company’s business and operations.
The share price of our bearer receipts and ADSs has been, and may continue to be, volatile which may impact the value of our bearer receipts or ADSs you hold.
The share price of our bearer receipts and our ADSs has been volatile in the past, in particular over the past year. The share price and trading volume of our bearer receipts and our ADSs may continue to be subject to significant fluctuations due, in part, to the high volatility in the securities markets generally and more particular in shares of financial institutions. Other factors, besides our financial results, that may impact our share price include, but are not limited to:
market expectations of the performance and capital adequacy of financial institutions in general;•investor perception of the success and impact of our strategies;•a downgrade or review of our credit ratings;•potential litigation or regulatory action involving ING Group or sectors we have exposure to through our insurance and banking •activities;announcements concerning financial problems or any investigations into the accounting practices of other financial institutions; and•general market circumstances. •
2.4 Additional information
ING Group Annual Report 2008
252

Our agreements with the Dutch State impose certain restrictions regarding the issuance or repurchase of our shares and the compensation of certain senior management positions.
For so long as the Dutch State holds at least 25% of the Core Tier-I Securities issued by us on 12 November 2008, or for so long as any of the government guaranteed senior unsecured bonds issued by ING Bank N.V. successively on 30 January 2009 and 20 February 2009 under the Credit Guarantee Scheme of the Dutch State (the ‘Government Guaranteed Bonds’) are outstanding, whichever expires last, we are prohibited from issuing or repurchasing any of our own shares (other than as part of regular hedging operations and the issuance of shares according to employment schemes) without the consent of the Dutch State’s nominees on the Supervisory Board (see below). In addition, under the terms of these agreements with the Dutch State and the Illiquid Assets Back-up Facility between ourselves and the Dutch State described in the termsheet of 26 January 2009, we have agreed to institute certain restrictions on the compensation of the members of the Executive Board and Senior Management, including incentives or performance-based compensation. These restrictions could hinder or prevent us from attracting or retaining the most qualified management with the talent and experience to manage our business effectively. In connection with these transactions, the Dutch State was granted the right to nominate two candidates for appointment to the Supervisory Board. The Dutch State’s nominees have veto rights over certain material transactions.
The issuance of the Core Tier-I Securities to the Dutch State has increased the cumulative change of ownership for United States tax purposes to approximately 42% as per 12 November 2008. Future increases of capital or other ownership changes may bring ING over the 50% threshold; in which case limitations to the future use of tax loss carry forwards as well as certain so-called built-in-losses may adversely affect net result and equity.
Section 382 of the United States Internal Revenue Code contains a so-called loss limitation rule, the general purpose of which is to prevent trafficking in tax losses (i.e. it is an anti-abuse rule). The rule is triggered when the ownership of a company changes by more than 50% (measured by value) on a cumulative basis in any three year period. If triggered, restrictions may be imposed on the future use of realised tax losses as well as certain losses that are built into the assets of the company at the time of the ownership change and that are realised within the next five years. The issuance of EUR 10 billion of securities by ING to the Dutch State on 12 November 2008 brought ING’s (cumulative) change of ownership as per that date to approximately 42%. As a result, future increases in capital or other changes of ownership may adversely affect the net result or equity of ING, unless relief from the loss limitation rules is obtained, which may or may not be possible.
253ING Group Annual Report 2008
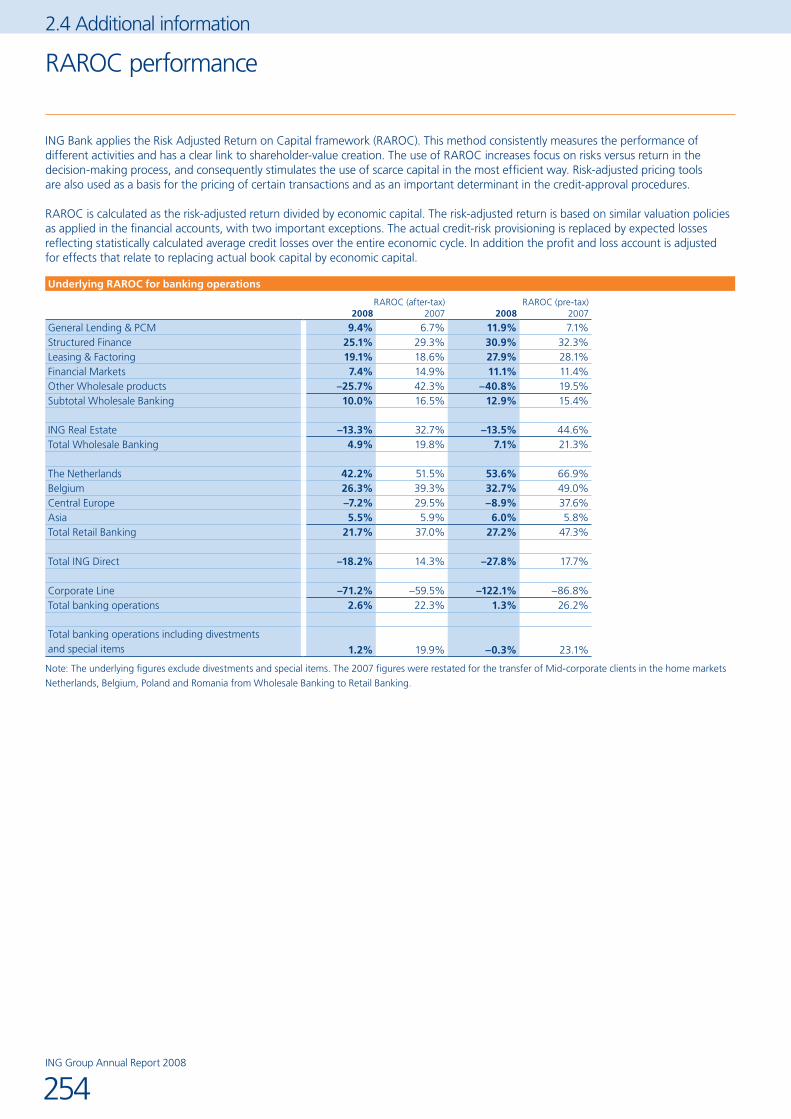
RAROC performance
ING Bank applies the Risk Adjusted Return on Capital framework (RAROC). This method consistently measures the performance of different activities and has a clear link to shareholder-value creation. The use of RAROC increases focus on risks versus return in the decision-making process, and consequently stimulates the use of scarce capital in the most efficient way. Risk-adjusted pricing tools are also used as a basis for the pricing of certain transactions and as an important determinant in the credit-approval procedures.
RAROC is calculated as the risk-adjusted return divided by economic capital. The risk-adjusted return is based on similar valuation policies as applied in the financial accounts, with two important exceptions. The actual credit-risk provisioning is replaced by expected losses reflecting statistically calculated average credit losses over the entire economic cycle. In addition the profit and loss account is adjusted for effects that relate to replacing actual book capital by economic capital.
Underlying RAROC for banking operations
RAROC (after-tax) RAROC (pre-tax)2008 2007 2008 2007
General Lending & PCM 9.4% 6.7% 11.9% 7.1%Structured Finance 25.1% 29.3% 30.9% 32.3%Leasing & Factoring 19.1% 18.6% 27.9% 28.1%Financial Markets 7.4% 14.9% 11.1% 11.4%Other Wholesale products –25.7% 42.3% –40.8% 19.5%Subtotal Wholesale Banking 10.0% 16.5% 12.9% 15.4%
ING Real Estate –13.3% 32.7% –13.5% 44.6%Total Wholesale Banking 4.9% 19.8% 7.1% 21.3%
The Netherlands 42.2% 51.5% 53.6% 66.9%Belgium 26.3% 39.3% 32.7% 49.0%Central Europe –7.2% 29.5% –8.9% 37.6%Asia 5.5% 5.9% 6.0% 5.8%Total Retail Banking 21.7% 37.0% 27.2% 47.3%
Total ING Direct –18.2% 14.3% –27.8% 17.7%
Corporate Line –71.2% –59.5% –122.1% –86.8%Total banking operations 2.6% 22.3% 1.3% 26.2%
Total banking operations including divestments and special items 1.2% 19.9% –0.3% 23.1%
Note: The underlying figures exclude divestments and special items. The 2007 figures were restated for the transfer of Mid-corporate clients in the home markets
Netherlands, Belgium, Poland and Romania from Wholesale Banking to Retail Banking.
2.4 Additional information
ING Group Annual Report 2008
254

Additional Pillar 3 information for ING Bank onlyamounts in millions of euros, unless stated otherwise
INTRODUCTION This Pillar 3 section includes information that Basel II requires to be made publicly available (unless it has already been provided in the risk management section). The information relates to ING Bank N.V. and all of its subsidiaries. The information contained in this section has not been audited by the Group’s external auditors.
NEW CAPITAL ADEQUACY RULES – BASEL II ACCORDThe rules on capital adequacy, also referred to as Regulatory Capital (RECAP), express the regulators’ and legislators’ opinions of how much capital a bank and other regulated credit institutions must retain in relation to the size and the type of risk taking expressed in the form of risk-weighted assets. The most important part of the capital base is the shareholders’ equity. In addition to equity, the institution may issue certain liabilities such as subordinated loans to be included in the capital base. The legal minimum requirement stipulates that the capital base must correspond to at least 8% of the Risk-Weighted Assets (RWA).
The Dutch government adopted the Capital Requirements Directive (CRD), the European reflection of the Basel II capital accord in December 2006. Since the new regulations adopt a ‘risk-based approach’ to determine the required capital base, there is a significant difference in the measurement of capital compared to the former rules. Therefore, the Dutch government adopted legislation to implement the new rules in stages. For 2008, the capital base may not fall below 90% of the amount that would have been applicable under the former rules, called Basel I. For 2009, the floor reduces to 80%. No floor is applied after year end 2009.
This section relates to Pillar 3, market discipline, and as such provides information on several topics. Some of the required information have already been given elsewhere in the annual report, e.g. in the risk management section and in the capital management section. This section provides additional information, as well as references to the relevant sections.
The Pillar 3 information mostly relates to credit risk, but also to market risk, operational risk and Securitisations. The requirements are mainly for underlying exposure, risk weighted assets and regulatory capital. As such it relates primarily to the first Basel II pillar, the minimum capital requirement. The second pillar concerns the banks internally used economic capital, and the supervisors review of that capital and the underlying models. Economic Capital, and consequently Pillar 2, is disclosed extensively in the risk management section. As such, the text of this Pillar 3 section should be read in conjunction with statements made in the risk management section and capital management section of the annual accounts, where there is a comprehensive discussion of risk management and capital management.
RISK MANAGEMENT AT ING BANKING has a group risk management function that is embedded at all levels of the organisation and operates through a comprehensive risk governance framework.
The primary responsibility of the Bank risk management function lies with the Chief Risk Officer (CRO), who is a member of the Executive Board. The CRO is responsible for the management and control of risk on a consolidated level to ensure that ING’s bank risk profile is consistent with its financial resources and the risk appetite defined by the Executive Board.
The CRO has several direct reports who are all responsible for a specific risk management function within ING Bank.
A more detailed description of risk management at ING can be found in the risk management section.
Chief Risk Officer
Corporate Market Risk Management
Corporate Credit Risk Management
Group ComplianceRisk Management
Corporate OperationalRisk Management
255ING Group Annual Report 2008

REGULATORY CAPITAL REQUIREMENTS
Regulatory capital requirements2008
Credit riskPortfolios subject to standardised approach 3,083
Portfolios subject to advanced IRB approach– Central governments and central banks 309– Institutions 1,680– Corporate 9,366– Residential mortgages 3,062– Other retail 885Total portfolios subject to advanced IRB approach 15,302
Securitisation exposures 2,321
Equity portfolios in the banking book under the simple risk weight approach 194Other Non-Credit Obligation Assets (ONCOA) 2,166Total credit risk 23,066
Market riskStandardised approach 449Internal models approach – trading book 587Total market risk 1,036
Operational riskAdvanced measurement approach 3,368
Total Basel II required Regulatory Capital 27,470
Basel II floor* 34,369Additional capital requirement 6,899
* 90% of Basel I required Regulatory Capital.
In order to prevent large short term effects on capital requirements, the regulators introduced transition rules (the ‘capital floor’) for institutions implementing the new capital adequacy reporting. For 2008 and 2009 the capital requirements should be no less than 90% and 80% respectively of the capital requirements calculated under Basel I regulations. The additional capital requirements according to the transition rules are EUR 6,899 million.
The required regulatory capital shown in this section should be compared to the available regulatory capital for which details can be found in the Capital Management section under the heading ‘Regulatory Capital’.
CREDIT RISKBASIS OF PRESENTATION FOR CREDIT RISKThe following paragraphs address the risk information for Pillar 3 reporting.
For credit risk, data included in these tables is related to ING Bank’s core credit risk activities in the areas of: Securities Financing, Derivatives (collectively Pre-Settlement Risk); Money Market activities (including reserve deposits at Central Banks); Lending (both on and off balance sheet); and Investment risks.
The amounts presented in this section relate to amounts used for credit risk management purposes, which follow ING’s interpretation of the definitions as prescribed under the Basel II accords. Therefore, the numbers are different than the accounting numbers as reported in the annual accounts under IFRS-EU. Figures for Derivatives and Securities Financing are based on ‘risk weighted amounts’, which generally is equal to the mark-to-market value of the underlying trades plus a (regulatory defined) ‘add-on’ which represents estimated potential future exposure. The amounts are then further modified by an adjustment that is related to the underlying collateral (market) values (after a haircut is applied) and any legal netting or compensation that may be permitted under various master agreement arrangements, such as ISDAs, CSAs, GMLAs, etc.
2.4 Additional information
Additional Pillar 3 information for ING Bank only (continued)
ING Group Annual Report 2008
256

Figures associated with Money Market and Lending activities are generally the nominal amounts, while amounts associated with Investment activities are based on the original amount invested less repayments. Off-Balance Sheet exposures include the letters of credits and guarantees, which are associated with the Lending Risk Category. Additionally, Off-Balance Sheet exposures include a portion of the unused limits, associated with the statistically expected use of the unused portion of the limit between the moment of measurement and the theoretical moment of statistical default. Collectively, these amounts are called ‘credit risk outstandings’.
Exposures associated with Securitisations (Asset Backed Financing, Commercial/Residential Mortgage Backed Securities and Covered Bonds) are shown separately. These amounts also relate to the amount invested prior to any impairment activity or mark-to-market adjustments.This amount is also considered to be ‘outstandings’.
Unless otherwise stated, the tables included in this Section focus on the measurement of Exposure at Default (EAD) and Risk Weighted Assets (RWA) under the Basel II definitions. EAD is generally the sum of the on-balance and off-balance sheet lending, investment and money market activities plus an estimated portion of the unused credit facilities extended to the obligor. Additionally, the risk weighting amounts (plus add-ons) are included. Multiplying RWA by 8% will result in the level of Regulatory Capital (RECAP) that is required to be held against these portfolios (for the credit risk portion of the activities). In this section a threshold of 2% of the total value reported is used for determining materiality where applicable. All categories below that threshold have been reported in the category ‘Other’.
CREDIT RISK AT INGING Bank’s credit policy is to maintain an internationally diversified loan and bond portfolio, while avoiding large risk concentrations. The emphasis is on managing business developments within the business lines by means of top-down concentration limits for countries, individual obligors and obligor groups. The aim is to expand relationship-banking activities, while maintaining stringent internal risk/return guidelines and controls.
Credit Risk is the risk of loss from the default by debtors or counterparties. Credit risks arise in ING Bank’s lending, money market, pre-settlement and investment activities, as well as in its trading activities. Credit risk management is supported by dedicated credit risk information systems and internal rating methodologies for debtors and counterparties.
ING Bank’s credit exposure is mainly related to traditional lending to individuals and businesses, bonds held in the investment portfolios and financial markets trading activities. Loans to individuals are mainly mortgage loans secured by residential property. Loans to businesses are often collateralised, but can be unsecured based on internal analysis of the obligors’ creditworthiness. Financial Markets activities include derivatives trading, securities financing, and Foreign Exchange (FX) transactions, which we collectively refer to as Pre-Settlement risks. ING uses various market pricing and measurement techniques to determine the amount of credit risk on pre-settlement activities. These techniques estimate ING’s potential future exposure on individual and portfolios of trades. Master agreements and collateral agreements are frequently entered into to reduce these credit risks.
PILLAR 3 CREDIT RISK IN PRACTICEThe Basel II Accord not only changes the way ING reports its credit risk for regulatory purposes; it also affects the daily operations and practices of all types of risk management at all levels within ING Bank. It has no effect on ING Insurance or Asset Management operations.
One of the key elements of the Basel II Accord is the ‘Use Test’, which requires ING to use Basel concepts in its day-to-day activities. The diagram below illustrates where ING has incorporated the Basel II concepts into its daily activities, both globally and locally:
Loan Pricing
Economic Capital
Performance measurement
Loan Loss Provisioning
Regulatory Capital/RWA
Credit Scoring/Acceptance
Basel II Risk Components
PD EAD LGDMaturity
257ING Group Annual Report 2008

RISK MEASUREMENT AND REPORTINGING distinguishes three separate information requirements from senior management related to the Advanced IRB (AIRB) approach for credit risk:
Reporting on (minimum) regulatory capital requirements;•Model monitoring reports; and•Stress testing reports.•
The acceptance, maintenance, measurement, management and reporting of credit risks at all levels of ING Bank is accomplished through promotion of single, common credit risk data standards and the integration into common credit risk tools that support standardised and transparent credit risk practices.
THE IRB METHOD IN SHORTThere are four elements which drive the Basel II ‘risk-based approach’ to the determination of the capital base. For each of these elements, ING has developed a series of statistical, expert and hybrid models based on ING’s historical experience and other market observations.
Probability of Default (PD):• The first is the borrower’s, counterparty’s, or issuer’s (collectively referred to as the ‘obligor’) probability of default, which measures an obligor’s creditworthiness in terms of likelihood to go into default. The result of this calculation attempts to measure the senior, unsecured standalone creditworthiness of an organisation without consideration of structural elements of the underlying transactions, such as collateral, pricing, or maturity.
Exposure at Default (EAD): • The second element is the obligor’s exposure at default. These models are intended to estimate the outstanding amount or obligation at the moment of default in the future. Since the fact that an obligor will go into default is not known, and the level of outstandings that may occur on that date is also not known, ING uses a combination of statistical, expert and hybrid models to estimate the Exposure at Default. With the exception of guarantees and letters of credit, the EAD is always equal to or higher than the associated credit risk outstandings, under the assumption that obligors tend to absorb liquidity from available credit resources before financial problems become apparent to the obligor’s creditors.
Loss Given Default (LGD): • The third element is the loss given default. These models are intended to estimate the amount ING will lose when liquidating collateral pledged in association with a given loan or financial obligation, or alternatively, liquidating the company as a whole, as part of a workout process. LGD models are based on cover types, estimated recovery rates given orderly liquidation, and (in)direct cost of liquidation.
Maturity (M): • The fourth element is the time to the maturity of the underlying financial obligation. Basel II caps the maturity element at five years, despite the fact that many obligations extend longer than five years.
Expected Loss (EL): • The expected loss provides a measure of the value of the credit losses that ING may reasonably expect to incur on its portfolio. ING must hold a reserve (as part of its capital base) to cover the expected losses in its credit portfolio. In its basic form, the expected loss can be represented as: EL = PD * EAD * LGD
Unexpected Loss (UL): • Additionally, ING must also maintain a capital buffer against unexpected losses in order to protect itself against credit losses associated with unusual market events outside of the statistical norms.
Basel II uses these same components (expected loss and unexpected loss) conceptually in the determination of the Risk Weighted Assets (RWA). Like EL, RWA takes PD, EAD, and LGD into account, but also includes variables associated with the type of obligor and its size.
The PD, EAD and LGD models that are used in the calculation of Basel II regulatory capital are the same models that ING uses in the determination of its internally based economic capital models. Additionally, these models are used for loan pricing and customer profitability calculations, as well as forming the foundation for loan loss provisioning calculations.
CREDIT RISK MODELSING considers a well-balanced and controlled set of rules around model development, maintenance and validation to be an essential component for professional risk measurement and risk management. In 2006, ING developed and implemented a Credit Risk Model Governance framework, which consists of a set of extensive guidelines and requirements to which all stakeholders must adhere when developing, implementing and maintaining PD, LGD and EAD models.
Types of Credit Risk ModellingWithin ING Bank, there are three types of modelling which form the foundation of the PD, EAD and LGD models used throughout the bank.
2.4 Additional information
Additional Pillar 3 information for ING Bank only (continued)
ING Group Annual Report 2008
258

Expert models• are based on the knowledge of experts from both Risk Management and Front Office staff and literature from rating agencies, supervisors and academics. These kinds of models are especially appropriate for portfolios for which limited historical defaults exists thereby reducing the reliability of a statistical model. These portfolios are also often referred to as ‘Low Default Portfolios’;
Statistical models• are created where a large set of default or detailed loss data is available. They are characterised by a sufficient number of data points which facilitate meaningful statistical estimation of the model parameters. The model parameters are estimated with statistical techniques based on the data set available.
Hybrid models • contain characteristics of both expert and statistical models.
Next to the model choice, the definition of default is an important starting point for model building. ING uses a framework that integrates elements of the regulatory definition of ‘Default’ and the loan loss provisioning indicators under IAS 39. The rationale is that several indicators are very close to the indications of an obligor’s ‘unlikeliness to pay’ under Basel II and similar regulations.
Integration of both frameworks makes it possible to use the regulatory risk components PD, LGD and EAD in the collective provisioning process under IAS 39, further enhancing ING’s compliance with the Basel II ‘use test’.
Independent Model Validation is one of the cornerstones of this framework. It consists of the process of determining that a model is appropriate for its intended use. It is an ongoing process whereby the reliability of the model is verified at different stages during its lifecycle: at conception, before approval, periodically after implementation, and when significant changes are made to the model. The validation process contains a mix of developmental evidence, process verification and outcome analysis.
APPROACHES APPLIED BY ING BANKOn 1 January 2008, ING adopted the AIRB to the majority of its significant portfolios that contain credit risk in accordance with the approvals granted by DNB (Dutch Central Bank), and various local regulators, as required. However, there remains a small portion of the portfolio that is subject to the Standardised Approach (SA). Individually, these portfolios are relatively small, very specialised, or are related to new acquisitions in companies that themselves did not yet follow the AIRB Approach. In some cases, the Standardised Approach is mandated in conjunction with transition restrictions imposed by local regulators.
ING anticipates that collectively approximately 50% of the remaining standardised portfolios will migrate to the AIRB approach during 2009; in some cases migrations may require additional regulatory approvals.
ING uses the AIRB and the Internal Assessment Approach (IAA) for liquidity lines provided to Asset Backed Commercial Paper programs. For a number of portfolios that are either on an exit strategy or immaterial in terms of size and risk profile, the Standardised Approach is used.
EXPOSURE CLASSESThe Basel II Accord has developed the concept of ‘Exposure Classes’. These are essentially groupings of credit risks associated with a common obligor type or product type. For the AIRB Approach, most of the exposure classes have subcategories. ING has applied the following definitions to determine Exposure Classes:
Governments include Sovereign Government entities, Central Banks and Basel II recognised Local/Regional Authorities as well as Supranational Organisations;
Institutions include all Commercial Banks, non-Bank Financial Institutions, such as Leasing Companies, Funds and Fund Managers, and Insurance Companies, as well as local and regional government entities not classified as governments;
Corporates includes all legal entities, that are not considered to be Governments, Institutions or Retail Other;
Residential Mortgages include all mortgage loans for residential properties that are not part of a securitisation;
Retail Other includes all other credit obligations related to Retail SMEs, such as partnerships, one-man businesses and private individuals, such as consumer loans, car loans and credit cards.
Under these exposure class definitions, it is possible for a private individual to be included under both Residential Mortgages and Retail Other. For other types of counterparties or issuers, there is no potential overlap.
259ING Group Annual Report 2008

CREDIT RISK EXPOSURES
Gross credit risk exposures (EAD) by exposure class
2008
Central governments
and central banks Institutions Corporate
Residential mortgages Other retail Total
Standardised Approach 7,801 3,165 17,706 21,060 14,116 63,848AIRB Approach 75,869 127,797 272,645 255,567 29,979 761,857Total 83,670 130,962 290,351 276,627 44,095 825,705
Includes both AIRB and SA portfolios; Excludes securitisations, equities and ONCOA.
Gross credit risk exposures (EAD) by geographic area
2008
Central governments
and central banks Institutions Corporate
Residential mortgages Other retail Total
Netherlands 9,258 2,711 78,636 134,051 20,187 244,843Germany 11,566 27,371 6,808 43,627 3,504 92,876Belgium 15,111 5,181 33,115 18,319 9,047 80,773United States of America 120 11,201 32,159 25,636 62 69,178Spain 10,134 16,856 11,027 7,292 582 45,891France 7,697 14,462 14,198 922 170 37,449Australia 497 4,722 4,364 19,701 24 29,308United Kingdom 425 10,120 16,436 2,089 383 29,453Italy 6,328 3,914 9,116 5,794 1,082 26,234Canada 1,415 3,833 1,003 13,388 455 20,094Other 21,119 30,591 83,489 5,808 8,599 149,606Total 83,670 130,962 290,351 276,627 44,095 825,705
Includes both AIRB and SA portfolios; Excludes securitisations, equities and ONCOA.
The figures presented in this table are EAD based on the country of the residence of the obligor. As such, these figures do not represent the risk associated with a country transfer risk event, such as a restriction on the convertibility of local currency into internationally tradable currencies. Nor do these figures represent the economic exposure that is present in a given country. The figures above are the most significant exposures. Smaller exposures are all group under Other, where none of the individual underlying exposures are more than 16.5 billion. Figures associated with ING’s transfer risk positions and economic country risk exposure can be found in risk management section, including their corresponding definitions.
Gross credit risk exposures (EAD) by economic sector
2008
Central governments
and central banks Institutions Corporate
Residential mortgages Other retail Total
Builders & Contractors 16,876 2,475 19,351Central Banks 23,786 23,786Central Governments 53,794 53,794Commercial Banks 806 110,377 882 28 112,093Food, Beverages & Personal Care 18,203 2,246 20,449General Industries 17,865 2,344 20,209Lower Public Administration 5,019 15,526 106 20,651Natural Resources 28,794 406 29,200Non-Bank Financial Institutions 3,690 48,344 845 52,879Private Individuals 124 276,627 22,314 299,065Real Estate 191 40 53,305 2,009 55,545Services 93 18,982 3,898 22,973Transportation & Logistics 24,166 1,066 25,232Other 74 1,236 62,810 6,358 70,478Total 83,670 130,962 290,351 276,627 44,095 825,705
Includes both AIRB and SA portfolios; Excludes securitisations, equities and ONCOA.
The figures presented above are based on the Basel II defined EAD, and differ from the industry distribution figures that are presented in the annual accounts. Note that all other sectors have exposures that are less than 16.5 billion.
2.4 Additional information
Additional Pillar 3 information for ING Bank only (continued)
ING Group Annual Report 2008
260

1 The threshold amount varies per business unit, but generally is EUR 0 in the international units, and EUR 1 million in the ‘home markets’.
ING uses a common industry classification methodology based on the NAICS system (North American Industry Classification System). This methodology has over 1,500 detailed industry descriptions, which are aggregated into 22 industry classes at the highest level. Certain countries require ING to report locally based on other industry classification methodologies, which are generally derived from the NAICS classifications presented here. Residential mortgages are generally only extended to private individuals.
Outstandings by Tenor Bucket (based on credit risk outstandings) per 31/12
2008
Central governments
and central banks Institutions Corporate
Residential mortgages Other retail Total
Current Outstandings 80,020 117,066 250,413 266,918 34,795 749,2121 month 73,841 107,314 233,559 266,346 33,676 714,7363 month 47,681 88,317 218,945 265,805 33,069 653,8176 month 47,469 82,899 209,209 264,981 31,982 636,5401 year 52,289 70,942 167,254 262,052 20,412 572,9492 years 47,241 64,600 137,498 258,619 17,828 525,7863 years 40,753 56,474 110,622 254,560 15,546 477,9555 years 33,314 44,387 70,160 241,541 11,457 400,8597 years 22,270 32,210 44,087 232,649 9,577 340,79310 years 7,331 7,725 23,915 213,740 7,147 259,858
Includes both AIRB and SA portfolios; Excludes securitisations, equities and ONCOA. Problem Loans (rating 20-22) are excluded in the figures above.
Basel II does not include a cash flow methodology that would look at future portfolio runoff. This table, therefore, presents figures that are based on credit risk outstandings, and not EAD. Credit Risk outstandings include amounts associated with both on and off balance sheet products, but exclude amounts related to unused limits. For derivatives and securities financing, the mark-to-market plus add-on methodology is applied, but the add-ons are generally less conservative than the add-ons applied under the Basel II definitions.
The figures above assume that loans, money market and investments in fixed income securities are fully repaid at their maturity dates and that limits are reduced in conjunction with repayment schedules contained in the associated loan documentation, without regard for potential renewal or extension, or portfolio sales or acquisitions. Pre-Settlement risks are assumed to reduce over the legal maturity of the underlying transactions. However, under mark-to-market plus add-on methodology, it is possible for exposures to increase in time, rather than decrease. This is a function of ING’s estimates of future interest rates and foreign exchange rates, as well as potential changes in future obligations that may be triggered by such events. Generally, credit risk outstandings are lower than EAD.
Further, all figures assume that no new credit risks are introduced into the portfolio and that there are no delays in repayments associated with problem loans, nor are there write offs associated with provisions or impairments. The portfolio runoff is implied by the difference in the figures between two periods.
LOAN LOSS PROVISIONS
There are three types of provisions that have to be made and accounted for:
Individually Significant Financial Asset (ISFA) Provisions• for those loans where specific, individualized provisions are still required. These are generally loans that exceed the threshold amount.1 These provisions are made using an estimated future recovery methodology and then applying a net present value concept. The future cash flows are based on the restructuring officers’ best estimate of when/if recoveries will occur. Recoveries can be from any source, such as the sale of collateral, ongoing cash flows, sale of a business/subsidiary, etc. ISFA provisions are all calculated using a common tool across ING Bank.
Incurred But Not Recognised (IBNR) Provisions:• are made for the ‘performing’ loan portfolio as an estimate or proxy for the losses/defaults that may have already occurred in the portfolio, but which ING has not yet determined or recognised. These provisions are based on a modified expected loss methodology. The primary modification is that the PD time horizon (12 months) is shortened to periods of 3, 6, or 9 months, depending on the type of obligor. Generally, the larger the obligor, the shorter the PD time horizon. IBNR provisions are calculated centrally using a common tool across ING Bank.
Individually Not Significant Financial Asset (INSFA) Provisions:• are made for acknowledged problem loans (ratings 20-22) that are below the threshold amount. Due to their small size, the IFRS rules permit a statistical approach to measuring these provisions. Therefore, the calculation is based on the same statistical formula that is used to determine IBNR Provisions and is also calculated centrally using a common tool across ING Bank.
261ING Group Annual Report 2008

Cumulative Provisions by geographic area
2008
Central governments
and central banks Institutions Corporate
Residential mortgages Other retail Total
Netherlands 239 92 298 629Germany 57 211 86 354Belgium 187 31 114 332United States of America 90 170 6 266Spain 112 2 2 116Poland 93 1 28 122France 2 19 3 74 98Iceland 68 68Turkey 1 71 2 11 85Italy 18 2 40 60Other 3 46 349 40 43 481Total 4 116 1,235 554 702 2,611
Includes both AIRB and SA portfolios; Excludes securitisations, equities and ONCOA.Excludes revaluations made directly through the equity account.
Above presentation of the cumulative provisions is based on country of the residence of the obligor. Countries not shown in above table have cumulative provisions of less than EUR 50 million, and are grouped under Other.
2.4 Additional information
Additional Pillar 3 information for ING Bank only (continued)
ING Group Annual Report 2008
262
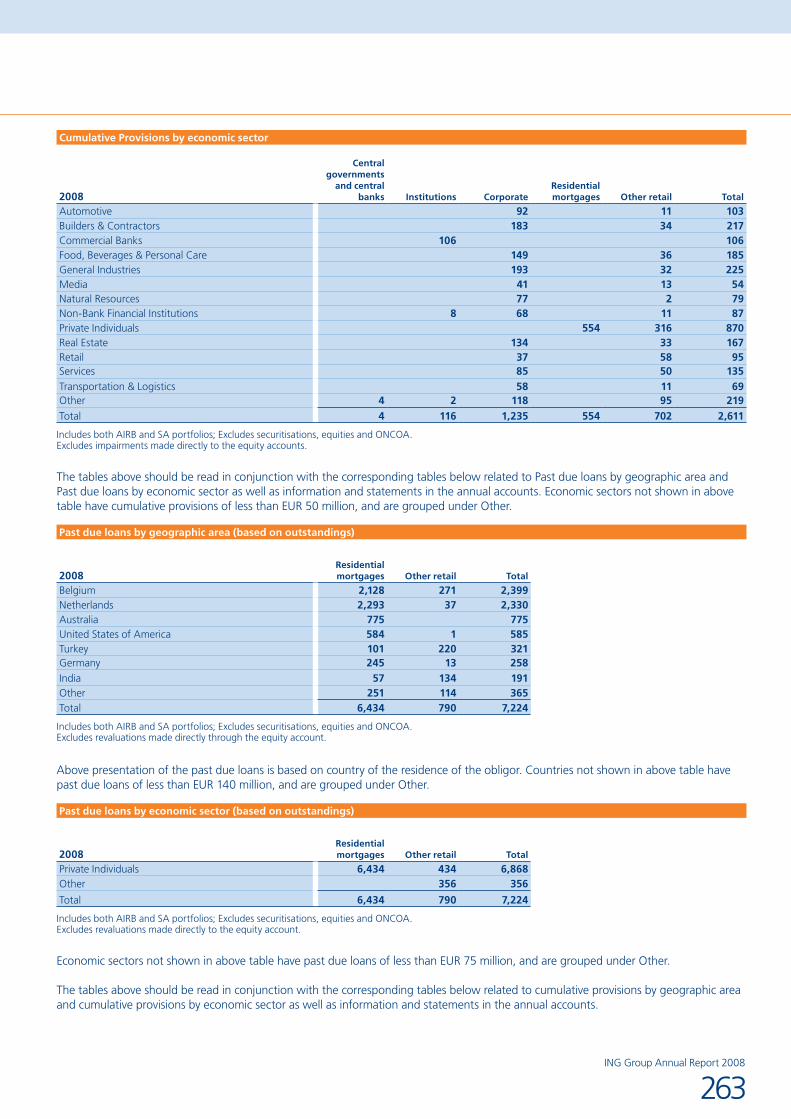
Cumulative Provisions by economic sector
2008
Central governments
and central banks Institutions Corporate
Residential mortgages Other retail Total
Automotive 92 11 103Builders & Contractors 183 34 217Commercial Banks 106 106Food, Beverages & Personal Care 149 36 185General Industries 193 32 225Media 41 13 54Natural Resources 77 2 79Non-Bank Financial Institutions 8 68 11 87Private Individuals 554 316 870Real Estate 134 33 167Retail 37 58 95Services 85 50 135Transportation & Logistics 58 11 69Other 4 2 118 95 219Total 4 116 1,235 554 702 2,611
Includes both AIRB and SA portfolios; Excludes securitisations, equities and ONCOA. Excludes impairments made directly to the equity accounts.
The tables above should be read in conjunction with the corresponding tables below related to Past due loans by geographic area and Past due loans by economic sector as well as information and statements in the annual accounts. Economic sectors not shown in above table have cumulative provisions of less than EUR 50 million, and are grouped under Other.
Past due loans by geographic area (based on outstandings)
2008Residential mortgages Other retail Total
Belgium 2,128 271 2,399Netherlands 2,293 37 2,330Australia 775 775United States of America 584 1 585Turkey 101 220 321Germany 245 13 258India 57 134 191Other 251 114 365Total 6,434 790 7,224
Includes both AIRB and SA portfolios; Excludes securitisations, equities and ONCOA. Excludes revaluations made directly through the equity account.
Above presentation of the past due loans is based on country of the residence of the obligor. Countries not shown in above table have past due loans of less than EUR 140 million, and are grouped under Other.
Past due loans by economic sector (based on outstandings)
2008Residential mortgages Other retail Total
Private Individuals 6,434 434 6,868Other 356 356
Total 6,434 790 7,224
Includes both AIRB and SA portfolios; Excludes securitisations, equities and ONCOA. Excludes revaluations made directly to the equity account.
Economic sectors not shown in above table have past due loans of less than EUR 75 million, and are grouped under Other.
The tables above should be read in conjunction with the corresponding tables below related to cumulative provisions by geographic area and cumulative provisions by economic sector as well as information and statements in the annual accounts.
263ING Group Annual Report 2008
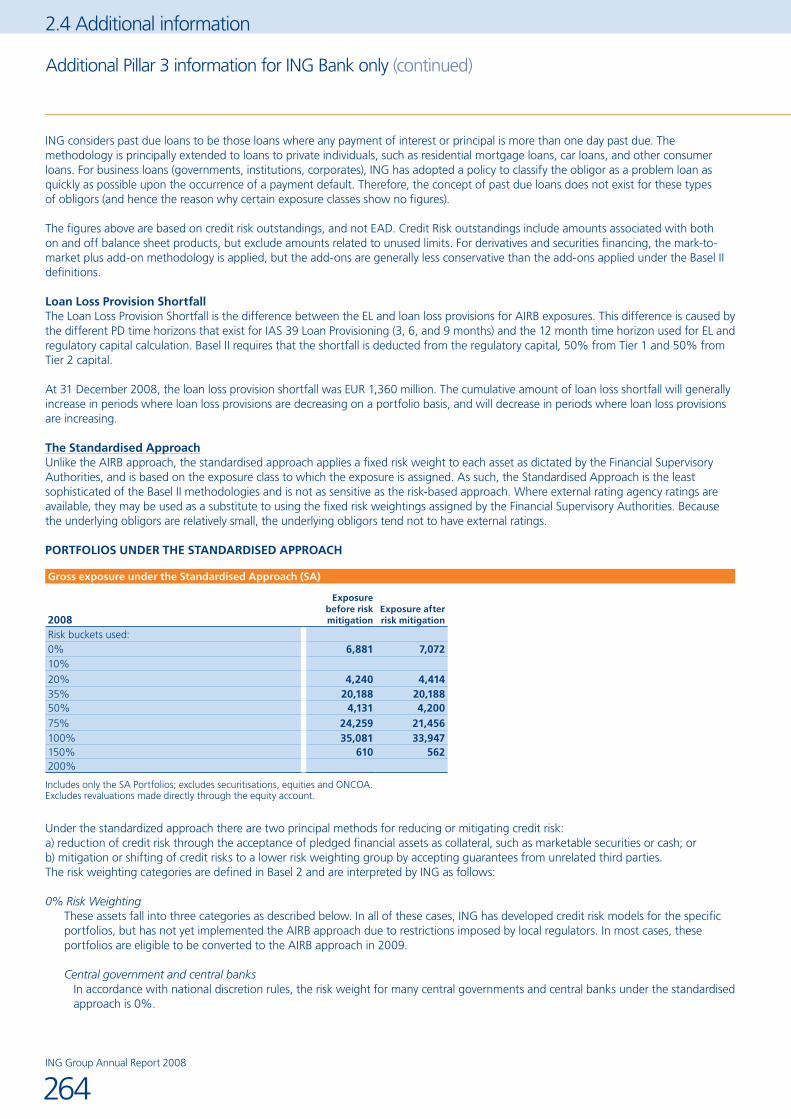
ING considers past due loans to be those loans where any payment of interest or principal is more than one day past due. The methodology is principally extended to loans to private individuals, such as residential mortgage loans, car loans, and other consumer loans. For business loans (governments, institutions, corporates), ING has adopted a policy to classify the obligor as a problem loan as quickly as possible upon the occurrence of a payment default. Therefore, the concept of past due loans does not exist for these types of obligors (and hence the reason why certain exposure classes show no figures).
The figures above are based on credit risk outstandings, and not EAD. Credit Risk outstandings include amounts associated with both on and off balance sheet products, but exclude amounts related to unused limits. For derivatives and securities financing, the mark-to-market plus add-on methodology is applied, but the add-ons are generally less conservative than the add-ons applied under the Basel II definitions.
Loan Loss Provision ShortfallThe Loan Loss Provision Shortfall is the difference between the EL and loan loss provisions for AIRB exposures. This difference is caused by the different PD time horizons that exist for IAS 39 Loan Provisioning (3, 6, and 9 months) and the 12 month time horizon used for EL and regulatory capital calculation. Basel II requires that the shortfall is deducted from the regulatory capital, 50% from Tier 1 and 50% from Tier 2 capital.
At 31 December 2008, the loan loss provision shortfall was EUR 1,360 million. The cumulative amount of loan loss shortfall will generally increase in periods where loan loss provisions are decreasing on a portfolio basis, and will decrease in periods where loan loss provisions are increasing.
The Standardised ApproachUnlike the AIRB approach, the standardised approach applies a fixed risk weight to each asset as dictated by the Financial Supervisory Authorities, and is based on the exposure class to which the exposure is assigned. As such, the Standardised Approach is the least sophisticated of the Basel II methodologies and is not as sensitive as the risk-based approach. Where external rating agency ratings are available, they may be used as a substitute to using the fixed risk weightings assigned by the Financial Supervisory Authorities. Because the underlying obligors are relatively small, the underlying obligors tend not to have external ratings.
PORTFOLIOS UNDER THE STANDARDISED APPROACH
Gross exposure under the Standardised Approach (SA)
2008
Exposure before risk mitigation
Exposure after risk mitigation
Risk buckets used:0% 6,881 7,07210%
20% 4,240 4,41435% 20,188 20,18850% 4,131 4,20075% 24,259 21,456100% 35,081 33,947150% 610 562200%
Includes only the SA Portfolios; excludes securitisations, equities and ONCOA.Excludes revaluations made directly through the equity account.
Under the standardized approach there are two principal methods for reducing or mitigating credit risk:a) reduction of credit risk through the acceptance of pledged financial assets as collateral, such as marketable securities or cash; orb) mitigation or shifting of credit risks to a lower risk weighting group by accepting guarantees from unrelated third parties.The risk weighting categories are defined in Basel 2 and are interpreted by ING as follows:
0% Risk Weighting These assets fall into three categories as described below. In all of these cases, ING has developed credit risk models for the specific
portfolios, but has not yet implemented the AIRB approach due to restrictions imposed by local regulators. In most cases, these portfolios are eligible to be converted to the AIRB approach in 2009.
Central government and central banks In accordance with national discretion rules, the risk weight for many central governments and central banks under the standardised
approach is 0%.
2.4 Additional information
Additional Pillar 3 information for ING Bank only (continued)
ING Group Annual Report 2008
264

Regional governments and local authorities In many countries, exposures to provincial, regional and municipal governments are treated as exposures to the central government
in whose jurisdiction they are established.
Multilateral Development Banks Exposures to certain specific multilateral development banks and other international organisations such as the International Bank
for Reconstruction and Development are risk weighted at 0%.
10% Risk Weighting The 10% risk weighting is applied to covered bonds exposures under the standardised approach. All of ING’s covered bond positions
are measured under the AIRB.
20% Risk Weighting 20% Risk Weighting is applied to exposures based on their exposure class and external rating. These are generally high quality exposures.
35% Risk Weighting Exposures secured by mortgages on residential real estate are assigned a risk weight of 35%. The risk weight is only reduced
for the part of the exposure that is fully secured.
50% Risk Weighting 50% Risk Weighting is applied to exposures based on their exposure class and external rating. These are generally not prime
grade exposures.
75% Risk Weighting Retail exposures under the standardised approach are assigned a risk weight of 75%.
100% Risk Weighting Under the standardised approach, exposures without external ratings that do not fall into one of the other categories are assigned
a risk weight of 100%.
150% Risk Weighting Under the standardised approach, certain specified exposures, such as exposures to venture capital and private equity, as well
as the unsecured portion of any past due obligation is assigned a risk weighting of 150%.
200% Risk Weighting The 200% risk weighting must be applied to collective investment undertakings which contain high risk equity investments.
PORTFOLIOS UNDER THE AIRB APPROACHRISK RATING METHODOLOGYIn principle all Risk Ratings are based on a Risk Rating (PD) Model that complies with the minimum requirements detailed the CRD, the DNB Supervisory Rules and CEBS guidelines. This concerns all Obligor Types and Segments, including Countries.
ING’s Probability of Default (PD) rating models are based on a 1-22 scale, which roughly corresponds to the same rating grades that are assigned by external rating agencies, such as Standard & Poor’s and Fitch. For example, an ING rating of 1 would correspond to an S&P/Fitch rating of AAA; an ING rating of 2 would correspond to an S&P/Fitch rating of AA+, and so on.
Risk Ratings from Rating Models:Risk Rating processes take on several forms as described below:
Rating Models requiring manual interference:• these are Models that require manual interference from the User who has to answer Rating Model based questions for each individual legal organisation in order to arrive at a Risk Rating. If not reviewed, the Risk Rating will expire 18 months after the previous review. These models are typically used for Governments, Institutions and larger Corporates; andAutomated Rating Models:• these are Models that do not require manual interference. Instead, data is automatically gathered and used to determine the Risk Rating (this process is detailed further in the sections that describe ING’s Data Management and IT processes). These models are typically used for small businesses, consumer loans, and residential mortgage exposures.Risk Ratings from Appeals:• Rating Model outcomes that are perceived to be inaccurate can be appealed through the relevant Rating Appeal Process, where this exists. The Rating Appeal Process applies to all Rating Models that require manual interference. It does not apply to automated Rating Models developed for consumer lending and residential mortgage business.
265ING Group Annual Report 2008
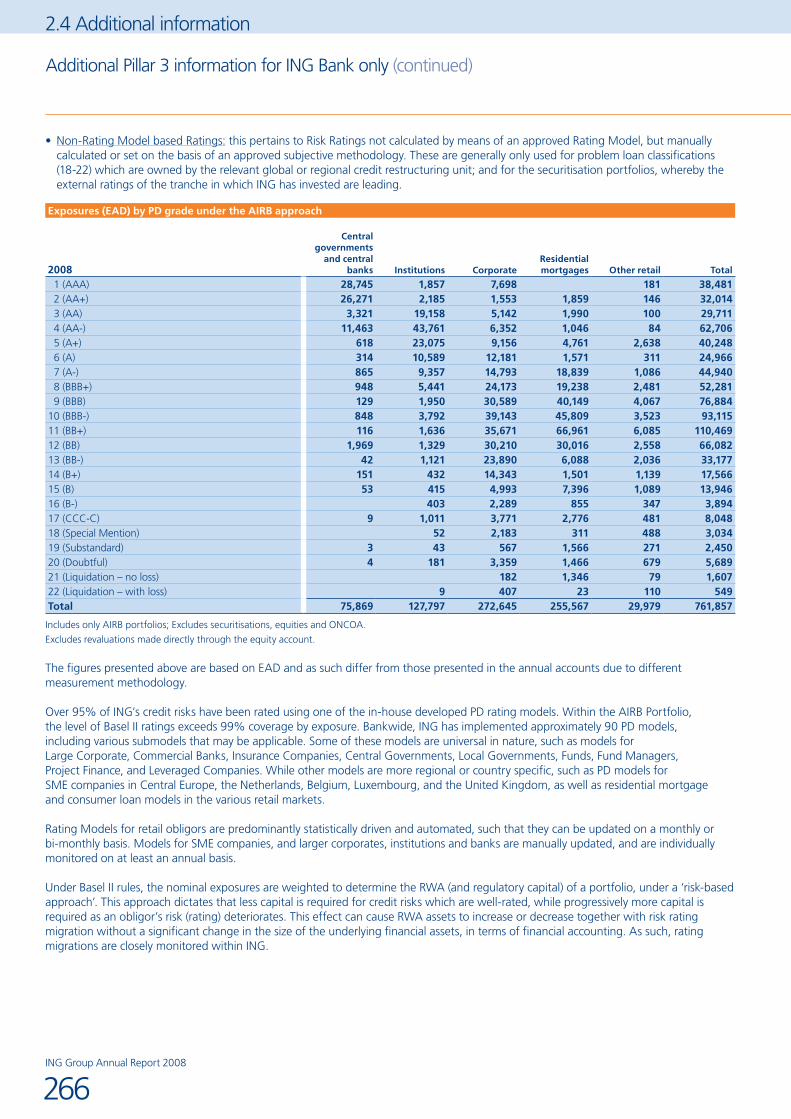
Non-Rating Model based Ratings:• this pertains to Risk Ratings not calculated by means of an approved Rating Model, but manually calculated or set on the basis of an approved subjective methodology. These are generally only used for problem loan classifications (18-22) which are owned by the relevant global or regional credit restructuring unit; and for the securitisation portfolios, whereby the external ratings of the tranche in which ING has invested are leading.
Exposures (EAD) by PD grade under the AIRB approach
2008
Central governments
and central banks Institutions Corporate
Residential mortgages Other retail Total
11 (AAA) 28,745 1,857 7,698 181 38,48112 (AA+)1 26,271 2,185 1,553 1,859 146 32,01413 (AA) 3,321 19,158 5,142 1,990 100 29,71114 (AA-) 11,463 43,761 6,352 1,046 84 62,70615 (A+) 618 23,075 9,156 4,761 2,638 40,24816 (A) 314 10,589 12,181 1,571 311 24,96617 (A-) 865 9,357 14,793 18,839 1,086 44,94018 (BBB+) 948 5,441 24,173 19,238 2,481 52,28119 (BBB) 129 1,950 30,589 40,149 4,067 76,88410 (BBB-) 848 3,792 39,143 45,809 3,523 93,11511 (BB+) 116 1,636 35,671 66,961 6,085 110,46912 (BB) 1,969 1,329 30,210 30,016 2,558 66,08213 (BB-) 42 1,121 23,890 6,088 2,036 33,17714 (B+) 151 432 14,343 1,501 1,139 17,56615 (B) 53 415 4,993 7,396 1,089 13,94616 (B-) 403 2,289 855 347 3,89417 (CCC-C) 9 1,011 3,771 2,776 481 8,04818 (Special Mention) 52 2,183 311 488 3,03419 (Substandard) 3 43 567 1,566 271 2,45020 (Doubtful) 4 181 3,359 1,466 679 5,68921 (Liquidation – no loss) 182 1,346 79 1,60722 (Liquidation – with loss) 9 407 23 110 549Total 75,869 127,797 272,645 255,567 29,979 761,857
Includes only AIRB portfolios; Excludes securitisations, equities and ONCOA.
Excludes revaluations made directly through the equity account.
The figures presented above are based on EAD and as such differ from those presented in the annual accounts due to different measurement methodology.
Over 95% of ING’s credit risks have been rated using one of the in-house developed PD rating models. Within the AIRB Portfolio, the level of Basel II ratings exceeds 99% coverage by exposure. Bankwide, ING has implemented approximately 90 PD models, including various submodels that may be applicable. Some of these models are universal in nature, such as models for Large Corporate, Commercial Banks, Insurance Companies, Central Governments, Local Governments, Funds, Fund Managers, Project Finance, and Leveraged Companies. While other models are more regional or country specific, such as PD models for SME companies in Central Europe, the Netherlands, Belgium, Luxembourg, and the United Kingdom, as well as residential mortgage and consumer loan models in the various retail markets.
Rating Models for retail obligors are predominantly statistically driven and automated, such that they can be updated on a monthly or bi-monthly basis. Models for SME companies, and larger corporates, institutions and banks are manually updated, and are individually monitored on at least an annual basis.
Under Basel II rules, the nominal exposures are weighted to determine the RWA (and regulatory capital) of a portfolio, under a ‘risk-based approach’. This approach dictates that less capital is required for credit risks which are well-rated, while progressively more capital is required as an obligor’s risk (rating) deteriorates. This effect can cause RWA assets to increase or decrease together with risk rating migration without a significant change in the size of the underlying financial assets, in terms of financial accounting. As such, rating migrations are closely monitored within ING.
2.4 Additional information
Additional Pillar 3 information for ING Bank only (continued)
ING Group Annual Report 2008
266

Average LGD by PD Grade under the AIRB approach
2008
Central governments
and central banks Institutions Corporate
Residential mortgages Other retail Total
11 (AAA) 20% 16% 34% 10% 53% 23%12 (AA+) 20% 22% 34% 10% 46% 20%13 (AA) 20% 21% 37% 10% 42% 23%14 (AA-) 20% 22% 41% 10% 37% 23%15 (A+) 20% 24% 35% 12% 55% 27%16 (A) 21% 24% 28% 10% 52% 25%17 (A-) 24% 27% 31% 21% 40% 26%18 (BBB+) 55% 27% 34% 18% 22% 27%19 (BBB) 18% 37% 29% 16% 33% 23%10 (BBB-) 41% 29% 25% 14% 26% 19%11 (BB+) 22% 38% 20% 13% 37% 17%12 (BB) 37% 42% 22% 16% 38% 20%13 (BB-) 49% 43% 18% 16% 40% 20%14 (B+) 8% 36% 23% 15% 39% 23%15 (B) 8% 43% 26% 13% 45% 21%16 (B-) 52% 74% 20% 14% 33% 25%17 (CCC-C) 17% 33% 30% 12% 37% 24%18 (Special Mention) 20% 24% 16% 19% 19% 17%19 (Substandard) 33% 48% 18% 14% 35% 18%20 (Doubtful) 28% 30% 25% 24% 44% 27%21 (Liquidation – no loss) 1% 15% 14% 57% 16%22 (Liquidation – with loss) 15% 27% 14% 73% 36%Total 21% 24% 26% 15% 36% 22%
Includes both AIRB portfolios; Excludes securitisations, equities and ONCOA.
Excludes revaluations made directly through the equity account.
The table above represents the weighted average LGD for each of the represented combination of PD Grade and Exposure Class. For example, the weighted average LGD for an AAA rated corporate is 34%, while the weighted average LGD for a BBB rated corporate is 29%. LGD percentages are influenced by the transactional structure of the financial obligation, the related collateral or covers provided, and the country in which the collateral (if any) would have to be recovered.
In certain cases, the portfolio size is relatively small, which can also have an effect on the weighted average LGD in a given PD Grade and Exposure Class. Therefore, this table should be read in conjunction with the previous table (Exposures (EAD) by PD grade).
Undrawn Commitments
2008
Central governments
and central banks Institutions Corporate
Residential mortgages Other retail Total
Standardised Approach 4 228 2,625 454 7,208 10,519AIRB Approach 208 2,403 55,310 10,439 7,818 76,178Total 212 2,631 57,935 10,893 15,026 86,697
Includes both AIRB and SA portfolios; Excludes securitisations, equities and ONCOA.
Excludes revaluations made directly through the equity account.
These figures represent the potential exposure that may be drawn by ING’s obligors under committed facilities. In most cases, the obligors have the right to make use of these facilities unless an event of default has occurred, or another defined event within the associated credit risk agreement has occurred. In most cases, the obligor pays a commitment fee to ING on the unused portion of these facilities. Pre-Settlement, Money Market and Investment limits are generally not committed.
If all of the unused commitments were called upon at the same time, ING’s credit risks (in terms of outstandings) would increase by 12%. As part of its Exposure at Default (EAD) models, ING makes an estimate of how much of these unused commitments would be drawn under normal circumstances. The effect is included in the calculation of RWA, together with a similar effect applied to uncommitted facilities, albeit at a lower rate.
267ING Group Annual Report 2008
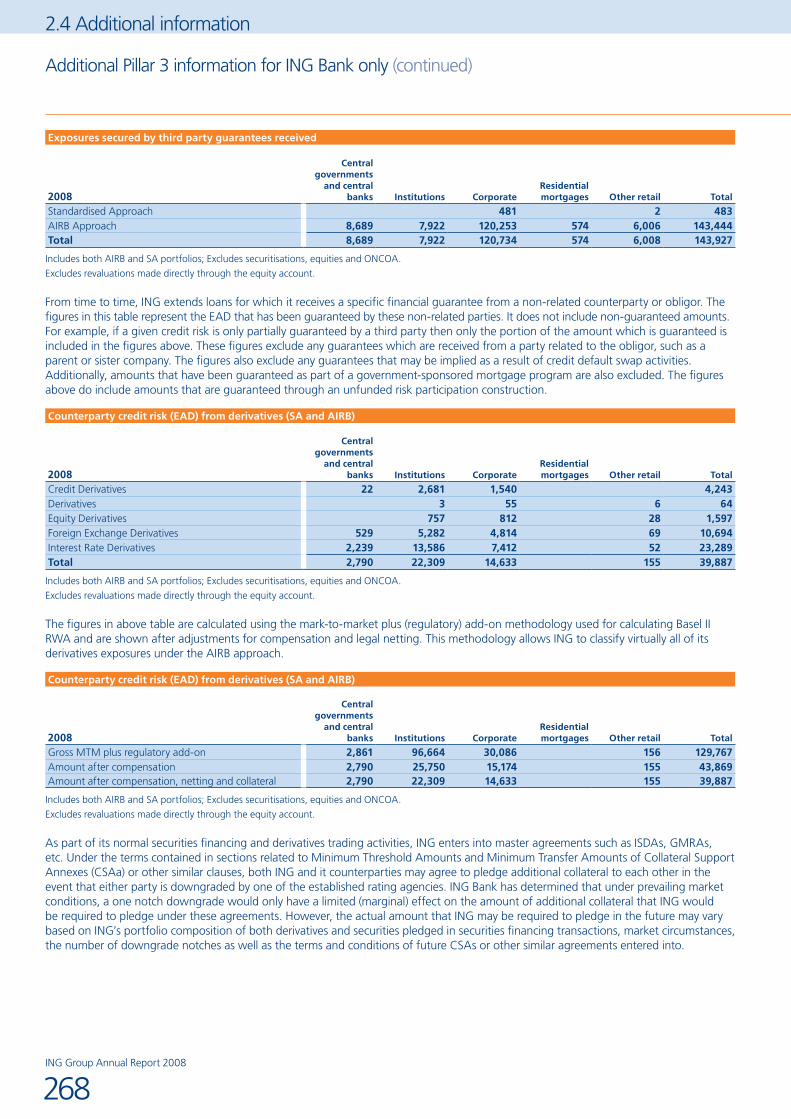
Exposures secured by third party guarantees received
2008
Central governments
and central banks Institutions Corporate
Residential mortgages Other retail Total
Standardised Approach 481 2 483AIRB Approach 8,689 7,922 120,253 574 6,006 143,444Total 8,689 7,922 120,734 574 6,008 143,927
Includes both AIRB and SA portfolios; Excludes securitisations, equities and ONCOA.
Excludes revaluations made directly through the equity account.
From time to time, ING extends loans for which it receives a specific financial guarantee from a non-related counterparty or obligor. The figures in this table represent the EAD that has been guaranteed by these non-related parties. It does not include non-guaranteed amounts. For example, if a given credit risk is only partially guaranteed by a third party then only the portion of the amount which is guaranteed is included in the figures above. These figures exclude any guarantees which are received from a party related to the obligor, such as a parent or sister company. The figures also exclude any guarantees that may be implied as a result of credit default swap activities. Additionally, amounts that have been guaranteed as part of a government-sponsored mortgage program are also excluded. The figures above do include amounts that are guaranteed through an unfunded risk participation construction.
Counterparty credit risk (EAD) from derivatives (SA and AIRB)
2008
Central governments
and central banks Institutions Corporate
Residential mortgages Other retail Total
Credit Derivatives 22 2,681 1,540 4,243Derivatives 3 55 6 64Equity Derivatives 757 812 28 1,597Foreign Exchange Derivatives 529 5,282 4,814 69 10,694Interest Rate Derivatives 2,239 13,586 7,412 52 23,289Total 2,790 22,309 14,633 155 39,887
Includes both AIRB and SA portfolios; Excludes securitisations, equities and ONCOA.
Excludes revaluations made directly through the equity account.
The figures in above table are calculated using the mark-to-market plus (regulatory) add-on methodology used for calculating Basel II RWA and are shown after adjustments for compensation and legal netting. This methodology allows ING to classify virtually all of its derivatives exposures under the AIRB approach.
Counterparty credit risk (EAD) from derivatives (SA and AIRB)
2008
Central governments
and central banks Institutions Corporate
Residential mortgages Other retail Total
Gross MTM plus regulatory add-on 2,861 96,664 30,086 156 129,767Amount after compensation 2,790 25,750 15,174 155 43,869Amount after compensation, netting and collateral 2,790 22,309 14,633 155 39,887
Includes both AIRB and SA portfolios; Excludes securitisations, equities and ONCOA.
Excludes revaluations made directly through the equity account.
As part of its normal securities financing and derivatives trading activities, ING enters into master agreements such as ISDAs, GMRAs, etc. Under the terms contained in sections related to Minimum Threshold Amounts and Minimum Transfer Amounts of Collateral Support Annexes (CSAa) or other similar clauses, both ING and it counterparties may agree to pledge additional collateral to each other in the event that either party is downgraded by one of the established rating agencies. ING Bank has determined that under prevailing market conditions, a one notch downgrade would only have a limited (marginal) effect on the amount of additional collateral that ING would be required to pledge under these agreements. However, the actual amount that ING may be required to pledge in the future may vary based on ING’s portfolio composition of both derivatives and securities pledged in securities financing transactions, market circumstances, the number of downgrade notches as well as the terms and conditions of future CSAs or other similar agreements entered into.
2.4 Additional information
Additional Pillar 3 information for ING Bank only (continued)
ING Group Annual Report 2008
268

Counterparty credit risk (EAD) from securities financing (SA and AIRB)
2008
Central governments
and central banks Institutions Corporate
Residential mortgages Other retail Total
Bond Financing Given 213 1,625 242 2,080Equity Financing Given 6,619 1,815 3,330 11,764Bond Financing Taken 237 993 1,230Stock Financing Taken 658 1,634 2,292Total 6,832 4,335 6,199 17,366
Includes both AIRB and SA portfolios; Excludes securitisations, equities and ONCOA.
Excludes revaluations made directly through the equity account.
Counterparty credit risk (EAD) from securities financing (SA and AIRB)
2008
Central governments
and central banks Institutions Corporate
Residential mortgages Other retail Total
Gross MTM plus regulatory add-on 11,944 7,552 9,976 29,472Amount after compensation 6,832 6,746 8,965 22,543Amount after compensation, netting and collateral 6,832 4,336 6,198 17,366
Includes both AIRB and SA portfolios; Excludes securitisations, equities and ONCOA.
Excludes revaluations made directly through the equity account.
The previous four tables are calculated using the mark-to-market plus (Regulatory) add-on methodology used for calculating Basel II RWA for determining the gross exposures. In order to determine the amount of credit risk applicable, ING first matches the trades with similar characteristics to determine their eligibility for offsetting. This offsetting effect is called ‘compensation’. Subsequently, ING reduces the amount by any legal netting that may be permitted under various types of Master Agreements, such as ISDAs, GMRAs, GMSLAs, etc. Lastly, the amount is further reduced by any collateral that is held by ING under CSAs or other similar agreements.
CREDIT RISK MITIGATION
Credit derivatives (notional amounts)
2008 Total
Credit derivatives used for hedging purposes– credit protection bought 2,019– credit protection soldCredit derivatives used for trading activities– credit protection bought 50,092– credit protection sold 45,395
Includes both AIRB and SA portfolios; Excludes securitisations, equities and ONCOA.
Excludes revaluations made directly through the equity account.
ING actively participates in the credit risk derivative (CDS) trading market, as a net purchaser of credit risk protection from other counterparties. ING has purchased a small amount of credit risk protection for hedging purposes, usually in order to reduce concentration on certain ‘legal one obligor groups’ without having to reduce ING’s relationship banking activities. ING does not actively sell credit default swaps for hedging or investment purposes. Although Basel II rules permit a reduction of credit risk capital under certain circumstances where ING has purchased CDS protection, ING does not currently make use of this provision in determining its Basel II capital base.
The figures above represent the notional amount of credit risk default swaps that ING has entered into for the represented purpose. The credit risk on the counterparties associated with credit default swap protection bought is included in the pre-settlement risk calculations for the given counterparty, and not in the figures above. For credit default protection sold, ING incurs synthetic issuer risk, on which capital is calculated, depending on its purpose, either hedging or trading.
SECURITISATIONS
ScopeThe following information is prepared taking into account the ‘Industry Good Practice Guidelines on Pillar 3 disclosure requirements for securitisations’ (the Guidelines) issued by the European Banking Federation and other industry associations on 18 December 2008.
269ING Group Annual Report 2008
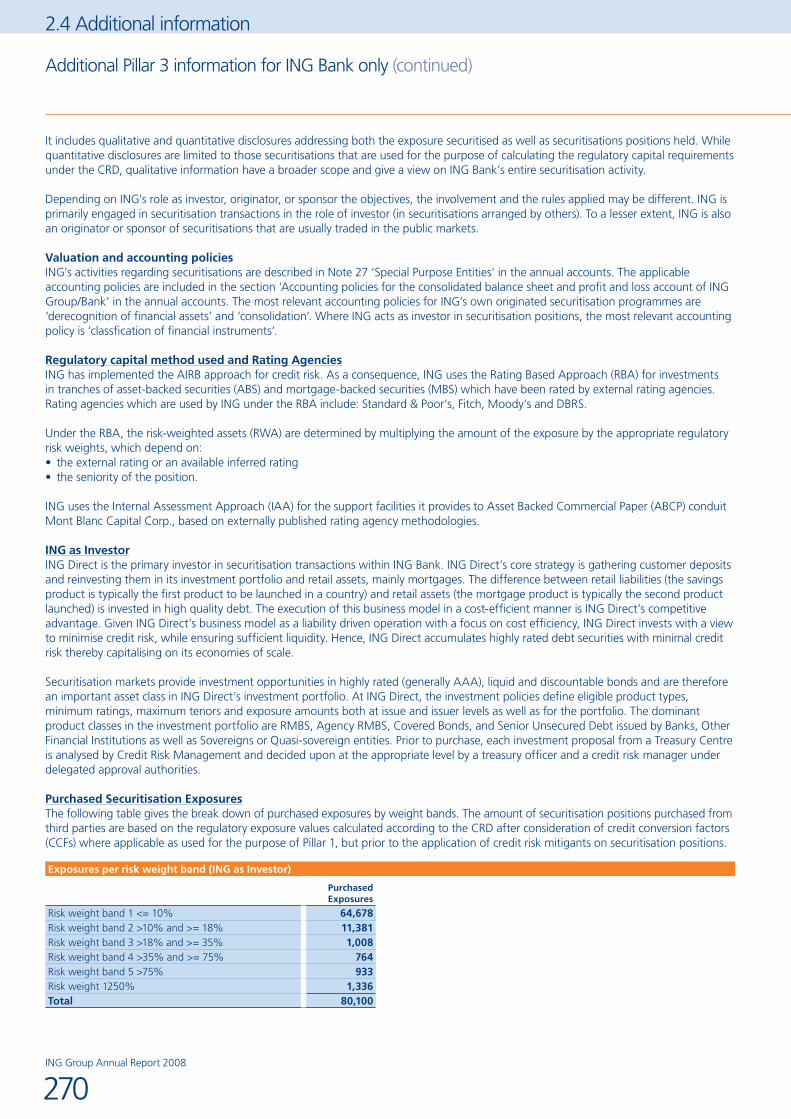
It includes qualitative and quantitative disclosures addressing both the exposure securitised as well as securitisations positions held. While quantitative disclosures are limited to those securitisations that are used for the purpose of calculating the regulatory capital requirements under the CRD, qualitative information have a broader scope and give a view on ING Bank’s entire securitisation activity.
Depending on ING’s role as investor, originator, or sponsor the objectives, the involvement and the rules applied may be different. ING is primarily engaged in securitisation transactions in the role of investor (in securitisations arranged by others). To a lesser extent, ING is also an originator or sponsor of securitisations that are usually traded in the public markets.
Valuation and accounting policiesING’s activities regarding securitisations are described in Note 27 ‘Special Purpose Entities’ in the annual accounts. The applicable accounting policies are included in the section ‘Accounting policies for the consolidated balance sheet and profit and loss account of ING Group/Bank’ in the annual accounts. The most relevant accounting policies for ING’s own originated securitisation programmes are ‘derecognition of financial assets’ and ‘consolidation’. Where ING acts as investor in securitisation positions, the most relevant accounting policy is ‘classfication of financial instruments’.
Regulatory capital method used and Rating AgenciesING has implemented the AIRB approach for credit risk. As a consequence, ING uses the Rating Based Approach (RBA) for investments in tranches of asset-backed securities (ABS) and mortgage-backed securities (MBS) which have been rated by external rating agencies. Rating agencies which are used by ING under the RBA include: Standard & Poor’s, Fitch, Moody’s and DBRS.
Under the RBA, the risk-weighted assets (RWA) are determined by multiplying the amount of the exposure by the appropriate regulatory risk weights, which depend on:
the external rating or an available inferred rating•the seniority of the position.•
ING uses the Internal Assessment Approach (IAA) for the support facilities it provides to Asset Backed Commercial Paper (ABCP) conduit Mont Blanc Capital Corp., based on externally published rating agency methodologies.
ING as InvestorING Direct is the primary investor in securitisation transactions within ING Bank. ING Direct’s core strategy is gathering customer deposits and reinvesting them in its investment portfolio and retail assets, mainly mortgages. The difference between retail liabilities (the savings product is typically the first product to be launched in a country) and retail assets (the mortgage product is typically the second product launched) is invested in high quality debt. The execution of this business model in a cost-efficient manner is ING Direct’s competitive advantage. Given ING Direct’s business model as a liability driven operation with a focus on cost efficiency, ING Direct invests with a view to minimise credit risk, while ensuring sufficient liquidity. Hence, ING Direct accumulates highly rated debt securities with minimal credit risk thereby capitalising on its economies of scale.
Securitisation markets provide investment opportunities in highly rated (generally AAA), liquid and discountable bonds and are therefore an important asset class in ING Direct’s investment portfolio. At ING Direct, the investment policies define eligible product types, minimum ratings, maximum tenors and exposure amounts both at issue and issuer levels as well as for the portfolio. The dominant product classes in the investment portfolio are RMBS, Agency RMBS, Covered Bonds, and Senior Unsecured Debt issued by Banks, Other Financial Institutions as well as Sovereigns or Quasi-sovereign entities. Prior to purchase, each investment proposal from a Treasury Centre is analysed by Credit Risk Management and decided upon at the appropriate level by a treasury officer and a credit risk manager under delegated approval authorities.
Purchased Securitisation ExposuresThe following table gives the break down of purchased exposures by weight bands. The amount of securitisation positions purchased from third parties are based on the regulatory exposure values calculated according to the CRD after consideration of credit conversion factors (CCFs) where applicable as used for the purpose of Pillar 1, but prior to the application of credit risk mitigants on securitisation positions.
Exposures per risk weight band (ING as Investor)
Purchased Exposures
Risk weight band 1 <= 10% 64,678Risk weight band 2 >10% and >= 18% 11,381Risk weight band 3 >18% and >= 35% 1,008Risk weight band 4 >35% and >= 75% 764Risk weight band 5 >75% 933Risk weight 1250% 1,336Total 80,100
2.4 Additional information
Additional Pillar 3 information for ING Bank only (continued)
ING Group Annual Report 2008
270

ING as OriginatorING originates own securitisation transactions for economic and regulatory capital purposes, as well as liquidity and funding purposes.
Economic and Regulatory Capital• Seven synthetic securitisations of mortgages, small and medium enterprise (SME) and corporate exposures have been issued since ING began actively undertaking the securitisation of its own assets in 2003. Upon the closer alignment of transfer and regulatory capital solvency rules at year end 2007, the most senior tranches of ING’s own securitisations have been called and are now retained by ING. ING also retains the first loss tranches. The mezzanine tranches are still transferred to third parties. The first transactions (Moon and Memphis 2003) were repaid in 2008 with no loss for the investors. As of 31 December 2008, five transactions totalling approximately EUR 15 billion (Mars 2004, Mars 2006 and BEL SME 2006 on SME exposures, Memphis 2005 and Memphis 2006 on residential mortgages) remain outstanding, as further detailed below. Memphis 2006 transfers risk on high Loan to Value (LTV) Dutch mortgages. Securitisations of residential mortgages release less capital under Basel II than under Basel I because the capital required for this type of exposure has been reduced under Basel II rules.
Liquidity/Funding• Although the most senior tranches in securitisations are no longer efficient to release regulatory capital under Basel II, they may still be used to obtain funding and improve liquidity. To be eligible as collateral for central banks securitised exposures must be sold to a Special Purpose Vehicle (SPV) which, in turn, issues securitisation notes (‘traditional securitisations’) in two tranches, one subordinated tranche and one senior tranche, rated AAA by a rating agency. The AAA tranche can then be used by ING as collateral in the money market for secured borrowings. ING Bank has created a number of these securitisations with a 31 December 2008 position of approximately EUR 70 billion of AAA rated notes. The underlying exposures are residential mortgages in the Netherlands, Canada, Germany and Australia. As long as the securitisation exposures created are not transferred to third parties, the regulatory capital remains unchanged. These are not detailed hereunder. Apart from the structuring and administration costs of these securitisations these securitisations are profit/loss neutral.
Exposures securitised as originator: All securitisations reported in this section are synthetic securitisations used to transfer risk to third parties. Transactions for liquidity/funding purpose are not included.
The determination of impairments and losses occurs at least every quarter at the cut-off date applicable to each specific transaction. Figures as of 31 December 2008 are used whenever available.
Exposures securitised
Cut off Date Initial Pool Outstandings Credit EventsPast due
Assets Losses
Residential MortgagesMemphis 2005 31 Oct 2008 3,000 2,351 3 62 < 1Memphis 2006 31 Oct 2008 4,000 3,750 11 207 2
7,000 6,101SMEMars 2004 31 Oct 2008 2,000 1,995 3 25 < 1Mars 2006 31 Dec 2008 4,500 4,202 12 32 2BEL SME 2006 30 Nov 2008 2,500 2,406 11 5 1Total 9,000 8,603
Notes: Cut-Off Date Most recent date in respect of which determination and allocation of losses have been made pursuant to the legal documentation of the transaction. Information on the performance of ING’s securitised exposures is published regularly.
Outstandings EAD on 31 December 2008 of assets that were performing on the Cut-off date. Credit Events Aggregate outstandings of assets subject to a credit event reported in the twelve months period ending on the Cut-off date. Past Due Assets Outstandings on the Cut-off date of assets that are past due, but not in credit event on that date, as more
fully detailed in the quarterly reports. Past due for residential mortgage transactions means ‘more than 1 monthly payment in arrears’. Past due for SME deals means ‘reference entities that are rated 20-22’.
Losses Aggregate losses recognised on securitised assets and reported in the twelve months period ending on the Cut-off date.
271ING Group Annual Report 2008
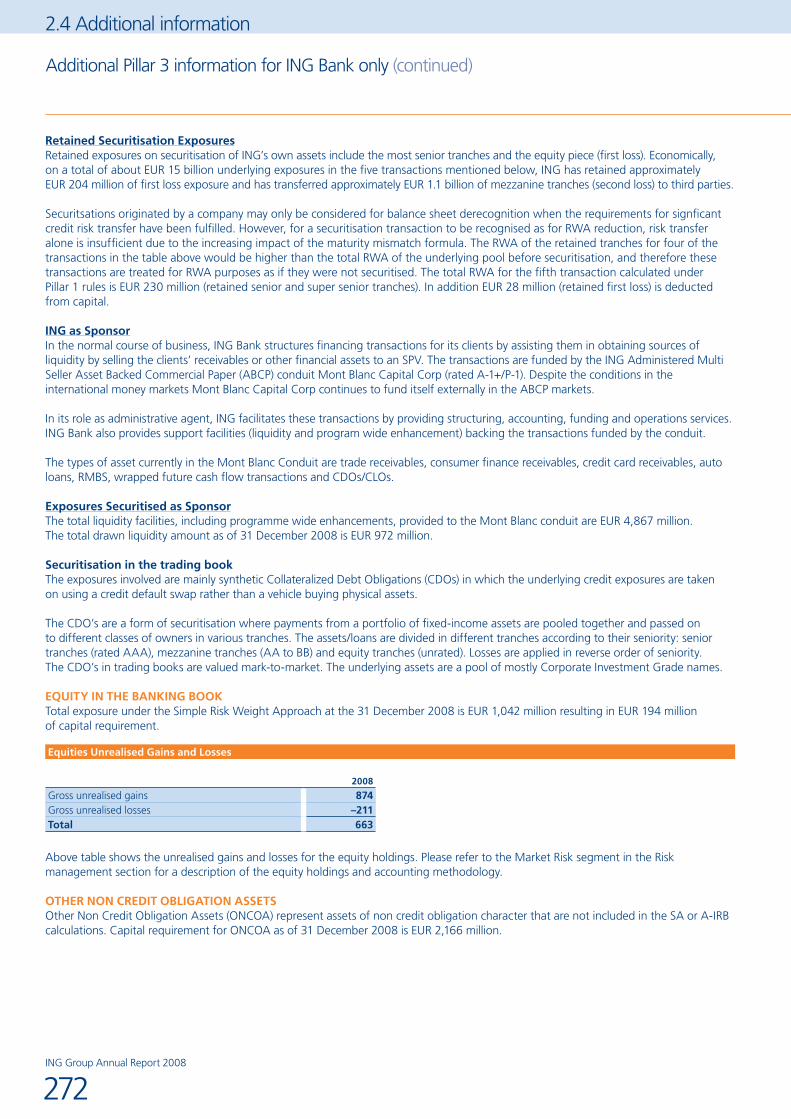
Retained Securitisation ExposuresRetained exposures on securitisation of ING’s own assets include the most senior tranches and the equity piece (first loss). Economically, on a total of about EUR 15 billion underlying exposures in the five transactions mentioned below, ING has retained approximately EUR 204 million of first loss exposure and has transferred approximately EUR 1.1 billion of mezzanine tranches (second loss) to third parties.
Securitsations originated by a company may only be considered for balance sheet derecognition when the requirements for signficant credit risk transfer have been fulfilled. However, for a securitisation transaction to be recognised as for RWA reduction, risk transfer alone is insufficient due to the increasing impact of the maturity mismatch formula. The RWA of the retained tranches for four of the transactions in the table above would be higher than the total RWA of the underlying pool before securitisation, and therefore these transactions are treated for RWA purposes as if they were not securitised. The total RWA for the fifth transaction calculated under Pillar 1 rules is EUR 230 million (retained senior and super senior tranches). In addition EUR 28 million (retained first loss) is deducted from capital.
ING as SponsorIn the normal course of business, ING Bank structures financing transactions for its clients by assisting them in obtaining sources of liquidity by selling the clients’ receivables or other financial assets to an SPV. The transactions are funded by the ING Administered Multi Seller Asset Backed Commercial Paper (ABCP) conduit Mont Blanc Capital Corp (rated A-1+/P-1). Despite the conditions in the international money markets Mont Blanc Capital Corp continues to fund itself externally in the ABCP markets.
In its role as administrative agent, ING facilitates these transactions by providing structuring, accounting, funding and operations services. ING Bank also provides support facilities (liquidity and program wide enhancement) backing the transactions funded by the conduit.
The types of asset currently in the Mont Blanc Conduit are trade receivables, consumer finance receivables, credit card receivables, auto loans, RMBS, wrapped future cash flow transactions and CDOs/CLOs.
Exposures Securitised as SponsorThe total liquidity facilities, including programme wide enhancements, provided to the Mont Blanc conduit are EUR 4,867 million. The total drawn liquidity amount as of 31 December 2008 is EUR 972 million.
Securitisation in the trading bookThe exposures involved are mainly synthetic Collateralized Debt Obligations (CDOs) in which the underlying credit exposures are taken on using a credit default swap rather than a vehicle buying physical assets.
The CDO’s are a form of securitisation where payments from a portfolio of fixed-income assets are pooled together and passed on to different classes of owners in various tranches. The assets/loans are divided in different tranches according to their seniority: senior tranches (rated AAA), mezzanine tranches (AA to BB) and equity tranches (unrated). Losses are applied in reverse order of seniority. The CDO’s in trading books are valued mark-to-market. The underlying assets are a pool of mostly Corporate Investment Grade names.
EQUITY IN THE BANKING BOOKTotal exposure under the Simple Risk Weight Approach at the 31 December 2008 is EUR 1,042 million resulting in EUR 194 million of capital requirement.
Equities Unrealised Gains and Losses
2008
Gross unrealised gains 874Gross unrealised losses –211Total 663
Above table shows the unrealised gains and losses for the equity holdings. Please refer to the Market Risk segment in the Risk management section for a description of the equity holdings and accounting methodology.
OTHER NON CREDIT OBLIGATION ASSETSOther Non Credit Obligation Assets (ONCOA) represent assets of non credit obligation character that are not included in the SA or A-IRB calculations. Capital requirement for ONCOA as of 31 December 2008 is EUR 2,166 million.
2.4 Additional information
Additional Pillar 3 information for ING Bank only (continued)
ING Group Annual Report 2008
272
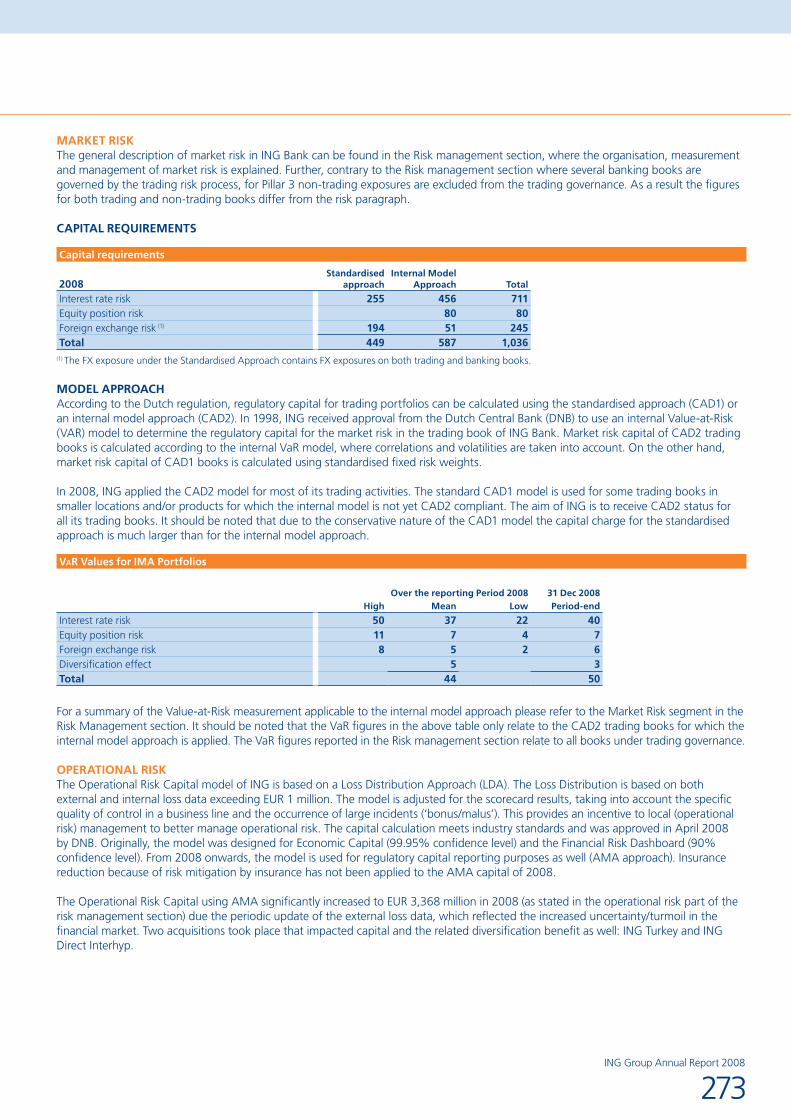
MARKET RISKThe general description of market risk in ING Bank can be found in the Risk management section, where the organisation, measurement and management of market risk is explained. Further, contrary to the Risk management section where several banking books are governed by the trading risk process, for Pillar 3 non-trading exposures are excluded from the trading governance. As a result the figures for both trading and non-trading books differ from the risk paragraph.
CAPITAL REQUIREMENTS
Capital requirements
2008Standardised
approachInternal Model
Approach Total
Interest rate risk 255 456 711Equity position risk 80 80Foreign exchange risk (1) 194 51 245Total 449 587 1,036
(1) The FX exposure under the Standardised Approach contains FX exposures on both trading and banking books.
MODEL APPROACHAccording to the Dutch regulation, regulatory capital for trading portfolios can be calculated using the standardised approach (CAD1) or an internal model approach (CAD2). In 1998, ING received approval from the Dutch Central Bank (DNB) to use an internal Value-at-Risk (VAR) model to determine the regulatory capital for the market risk in the trading book of ING Bank. Market risk capital of CAD2 trading books is calculated according to the internal VaR model, where correlations and volatilities are taken into account. On the other hand, market risk capital of CAD1 books is calculated using standardised fixed risk weights.
In 2008, ING applied the CAD2 model for most of its trading activities. The standard CAD1 model is used for some trading books in smaller locations and/or products for which the internal model is not yet CAD2 compliant. The aim of ING is to receive CAD2 status for all its trading books. It should be noted that due to the conservative nature of the CAD1 model the capital charge for the standardised approach is much larger than for the internal model approach.
VaR Values for IMA Portfolios
Over the reporting Period 2008 31 Dec 2008High Mean Low Period-end
Interest rate risk 50 37 22 40Equity position risk 11 7 4 7Foreign exchange risk 8 5 2 6Diversification effect 5 3Total 44 50
For a summary of the Value-at-Risk measurement applicable to the internal model approach please refer to the Market Risk segment in the Risk Management section. It should be noted that the VaR figures in the above table only relate to the CAD2 trading books for which the internal model approach is applied. The VaR figures reported in the Risk management section relate to all books under trading governance.
OPERATIONAL RISKThe Operational Risk Capital model of ING is based on a Loss Distribution Approach (LDA). The Loss Distribution is based on both external and internal loss data exceeding EUR 1 million. The model is adjusted for the scorecard results, taking into account the specific quality of control in a business line and the occurrence of large incidents (‘bonus/malus’). This provides an incentive to local (operational risk) management to better manage operational risk. The capital calculation meets industry standards and was approved in April 2008 by DNB. Originally, the model was designed for Economic Capital (99.95% confidence level) and the Financial Risk Dashboard (90% confidence level). From 2008 onwards, the model is used for regulatory capital reporting purposes as well (AMA approach). Insurance reduction because of risk mitigation by insurance has not been applied to the AMA capital of 2008.
The Operational Risk Capital using AMA significantly increased to EUR 3,368 million in 2008 (as stated in the operational risk part of the risk management section) due the periodic update of the external loss data, which reflected the increased uncertainty/turmoil in the financial market. Two acquisitions took place that impacted capital and the related diversification benefit as well: ING Turkey and ING Direct Interhyp.
273ING Group Annual Report 2008

INTEREST RATE RISK IN THE BANKING BOOKS
Earnings at Risk
2008
By line of businessING Wholesale Banking –132ING Retail Banking –101ING Direct 5ING Bank Corporate Line 46Total –182
By CurrencyEuro –221US Dollar 36Pound Sterling 3OtherTotal –182
Net Present Value at Risk
2008
By line of businessING Wholesale Banking –710ING Retail Banking –100ING Direct –232ING Bank Corporate Line –1,388Total –2,430
By CurrencyEuro –2,140US Dollar –238Pound Sterling –41Other –11Total –2,430
The Earnings at Risk and the Net Present Value at Risk are based on a 1% instantaneous upward shock.
In the Risk Management section a detailed description is given on the interest rate risk in the Banking book. Contrary to Pillar 3, in the Risk Management section several non-trading books are governed by the trading risk process. As a result the figures above differ from the figures in the Risk Management section.
2.4 Additional information
Additional Pillar 3 information for ING Bank only (continued)
ING Group Annual Report 2008
274

Financial glossary
ACTUARIAL AND UNDERWRITING RISKThese risks (mortality, longevity, morbidity, adverse motor or home claims, etc.), result from the pricing and acceptance of insurance contracts. Actuarial risk is the risk that premium levels and provisions in respect of insurance risk may turn out to be (no longer) correct. Underwriting risk is the risk that an issuer will receive a claim under an insurance policy it issues/underwrites. Maximum underwriting exposures are limited through exclusions, cover limits and reinsurance.
ALT-A RESIDENTIAL MORTGAGE BACKED SECURITY (ALT-A RMBS)A type of US residential mortgage which is considered riskier than ‘prime’ and less risky than ‘sub-prime’ mortgages. Parameters generally taken into account are borrower credit scores, residential property values and loan-to-value ratios. Alt-A mortgages are further characterised by a limited degree of income and/or asset verification.
AMORTISED COSTThe amount at which the financial asset or liability is measured at initial recognition less principal repayments, plus or minus the cumulative amortisation using the effective interest method of any difference between that initial amount and the maturity amount, and minus any reduction for impairment or uncollectibility.
ASSET AND LIABILITY COMMITTEE (ALCO)Manages the balance sheet of ING, especially with regard to strategic non-trading risk. These risks comprise interest rate exposures, equity risk, real estate risk, liquidity, solvency and foreign exchange risk and fluctuations.
ASSET LIABILITY MANAGEMENT (ALM)The practice of managing a business such that decisions on assets and liabilities are coordinated. It involves the ongoing process of formulating, implementing, monitoring and revising strategies related to assets and liabilities.
ASSET BACKED COMMERCIAL PAPER (ABCP)A type of commercial paper that is collateralised by other financial assets.
ASSET BACKED SECURITIES (ABS)A type of bond or note that is based on pools of assets, or collateralised by the cash flows from a specified pool of underlying assets.
ASSOCIATEAn entity over which the Group has significant influence, generally accompanying a shareholding of between 20% and 50% of the voting rights, and that is not a subsidiary not a joint venture.
AVAILABLE FINANCIAL RESOURCES (AFR)The available financial resources equal the market value of assets minus market value of liabilities, excluding hybrids issued by ING Group which is counted as capital. ING’s policy is that the available financial resources should exceed economic capital for Bank, Insurance and Group.
AVAILABLE-FOR-SALE FINANCIAL ASSETSThose non-derivative financial assets that are designated as available for sale or are not classified as
loans and receivables;•held-to-maturity investments; or•financial assets at fair value through profit and loss.•
BASEL IRegulatory requirements issued by the Basel Committee on Banking Supervision for the solvency calculation, which are superseded by Basel II, for ING, from 2008 onwards.
BASEL IIRegulatory requirements issued by the Basel Committee on Banking Supervision for the solvency calculation, which, for ING, apply from 2008 onwards. Basel II is an international standard for calculating the required capital based on internal models that take into account the financial and operational risks.
BASIS POINT VALUE (BPV)The change in the Net Present Value of a cash flow or a pool of cash flows due to a one basis point change of the yield curve.
BASIS RISKThis risk arises from an imperfect correlation in the adjustment of the rates earned and paid on different financial instruments. Examples of products in which these risks are inherent are demand deposits, saving accounts and mortgages with prepayment options.
BISAn international organisation which fosters international monetary and financial co-operation and serves as a bank for central banks. BIS has set a minimum for the solvency ratio reflecting the relationship between capital and risk weighted assets. The ratio should be at least 8%.
BUSINESS RISKThe exposure to value loss due to fluctuations in volumes, margins and costs. These fluctuations can occur because of internal, industry, or wider market factors. It is the risk inherent to strategy decisions and internal efficiency.
CAPITAL AT RISK (CAR)The maximum negative impact on ING Group’s economic surplus over a one year forward looking horizon under normal market conditions. CaR is calculated at a 90% confidence interval.
CERTIFICATES OF DEPOSITShort-term negotiable bearer debt instruments issued by banks.
CLAIMA demand for payment of a policy benefit because of the occurrence of an insured event, such as the death or disability of the insured or the maturity of an endowment, the incurrence of hospital or medical bills, the destruction or damage of property and related deaths or injuries, defects in, liens on, or challenges to the title to real estate, or the occurrence of a surety loss.
CLAIMS RATIOClaims, including claims handling expenses, expressed as a percentage of net earned premiums.
COLLATERALISED DEBT OBLIGATION (CDO)A type of asset-backed security which provides investors exposure to the credit risk of a pool of fixed income assets.
COLLATERALISED LOAN OBLIGATION (CLO)A type of CDO which is backed primarily by leveraged bank loans.
COMBINED RATIOThe sum of the claims ratio and the cost ratio for a non-life insurance company or a reinsurance company. A combined ratio of more than 100% does not necessarily mean that there is a loss on non-life insurance policies, because the result also includes the allocated investment income.
COMMERCIAL PAPERPromissory note (issued by financial institutions or large firms) with very-short to short maturity period (usually 2 to 30 days, and not more than 270 days), and unsecured.
275ING Group Annual Report 2008

DEFERRED TAX LIABILITIESThe amounts of income tax payable in future periods in respect of taxable temporary differences between carrying amounts of assets or liabilities in the balance sheet and tax base, based on tax rates that are expected to apply in the period when the assets are realised or the liabilities are settled.
DEFINED BENEFIT PLANPost-employment benefit plans other than defined contribution plans.
DEFINED CONTRIBUTION PLANPost-employment benefit plans under which an enterprise pays fixed contributions into a separate entity (a fund) and will have no legal or constructive obligation to pay further contributions if the fund does not hold sufficient assets to pay all employee benefits relating to employee service in the current and prior periods.
DELTA HEDGEMinimises the exposure of the employee option scheme by holding an appropriate number of (depositary receipts for) ordinary shares. The exposure is reassessed every quarter and, if necessary, ordinary shares are bought from the market (or employees).
DEPOSITARY RECEIPTFor ordinary and preference shares, issued by the Trust, in exchange for ordinary and preference shares issued by ING Group.
DERIVATIVESFinancial instruments, which include forwards, futures, options and swaps, whose value is based on an underlying asset, index or reference rate.
DISCOUNTED BILLSBills that are sold under deduction of interest giving the owner the right to receive an amount of money on a given date.
DISCRETIONARY PARTICIPATION FEATUREA contractual right to receive, as a supplement to guaranteed benefits, additional benefits that: are likely to be a significant portion of the total contractual benefits, whose amount or timing is contractually at the discretion of the insurer, that are contractually based on the performance of a specified pool or type of contract, (un)realised investment returns on a specified pool of assets held by the insurer, or the profit of the company, fund, or other entity that issues the contract.
EARNINGS AT RISK (EAR)Measures the impact on earnings resulting from changes in market rates over a one-year horizon.
ECONOMIC CAPITALThe minimum amount of capital that is required to absorb unexpected losses in times of severe stress. Given ING Group’s AA target rating, ING calculates economic capital requirements at a 99.95% level of confidence. This confidence level is derived from the historical default frequency of AA-rated companies (probability of default of 1 in 2000 years or 0.05%).
EFFECTIVE INTEREST METHODA method of calculating the amortised cost of a financial asset or liability and of allocating the interest income or interest expense over the relevant period.
ELIMINATIONA process by which intercompany transactions are matched with each other and deducted, so that the assets, liabilities, income and expenses are not inflated.
COMPLIANCE RISKCompliance risk is defined as the risk of damage to ING’s reputation as a result of failure (or perceived failure) to comply with relevant laws, regulations, internal policies and procedures or ethical standards.
CONCENTRATIONSOf credit risk exist when changes in economic, industry or geographical factors similarly affect groups of counterparties whose aggregate exposure is material in relation to ING Group’s total exposure.
CONTINGENT LIABILITIESPossible obligations that arises from past events and whose existence will be confirmed only by the occurrence or non-occurrence of one or more uncertain future events not wholly within the control of the entity; or a present obligation that arises from past events but is not recognised because:
it is not probable that an outflow of resources embodying economic •benefits will be required to settle the obligation; orthe amount of the obligation cannot be measured with •sufficient reliability.
CONTROLThe power to govern the financial and operating policies of an entity so as to obtain benefits from its activities.
CONVERTIBLE DEBENTURESDebentures with embedded options issued by corporations. The holder has the right to exchange a convertible debenture for equity in the issuing company at certain times in the future according to a certain exchange ratio. Very often, the conversion is callable. This means that it can be repurchased by the issuer at a certain price at certain times in the future. Once the debentures have been called, the holder can always choose to convert prior to repurchase.
CONVEXITYThe non-linear relationship between changes in the interest rates and changes in bond prices and their Net Present Value. It is a very important measure for portfolios containing (embedded) options.
CORE DEBTInvestments in ING Group subsidiaries minus the equity of the holding company including hybrids.
COST OF CAPITALThe costs related to owning capital. These can be split into the cost of equity, hybrids and debt, taking a target leverage into account.
COST RATIOUnderwriting costs expressed as a percentage of premiums written.
COUNTRY RISKThe risk that a foreign government will not fulfil its obligations or obstructs the remittance of funds by debtors, either for financial reasons (transfer risk) or for other reasons (e.g. political risk).
CREDIT INSTITUTIONSAll institutions are subject to banking supervision by public authorities, including mortgage banks, capital market institutions, multilateral development banks and the International Monetary Fund (IMF).
CREDIT RISKThe risk of loss from default by borrowers (including bond issuers) or counterparties. Credit risks arise in ING’s lending, presettlement and investment activities, as well as in its trading activities. Credit risk management is supported by dedicated credit risk information systems and internal rating methodologies for debtors and counterparties.
2.4 Additional information
Financial glossary (continued)
ING Group Annual Report 2008
276

HELD-TO-MATURITY INVESTMENTSNon-derivative financial assets with fixed or determinable payments and fixed maturity that ING Group has the positive intention and ability to hold to maturity other than:a. those that ING Group upon initial recognition designates
as at fair value through profit and loss;b. those that ING Group designates as available for sale; andc. those that meet the definition of loans and receivables.HISTORICAL SIMULATIONA model to calculate Value at Risk, assuming that future changes in risk factors will have the same distribution as they had in the past taking into account the non-linear behaviour of financial products.
IMPAIRMENT LOSSThe amount by which the carrying amount of an asset exceeds its recoverable amount.
INTEREST BEARING INSTRUMENTA financial asset or a liability for which a time-proportionate compensation is paid or received in relation to a notional amount.
INTERNAL RATE OF RETURN (IRR)Internal rate of return is the discount rate at which the present value of distributable earnings from new business equals the investment in new business (i.e. the projected return on the investment in new business) is calculated.
INTEREST-RATE REBATESProfit sharing for group life insurance business. A rebate granted to policyholders based on the discounted value of the difference between the interest rate used to calculate the premiums and the expected yield on investment. The profit sharing is granted by means of a premium discount related to the yield on government bonds.
INTEREST RATE RISKProbability that the market interest rates will rise significantly higher than the interest rate earned on investments such as bonds, resulting in their lower market value.
IN THE MONEYA call option is said to be in the money if the exercise price is lower than the price of the underlying value; a put option is said to be in the money if the exercise price is higher than the price of the underlying value.
INVESTMENT RISKInvestment risk is the credit default and migration risk that is associated with ING’s investments in bonds, commercial paper, securitisations, and other similar publicly traded securities.
INVESTMENT PORTFOLIOComprises those assets which are intended for use on a continuing basis, and have been identified as such. These investments are held in order to cover the insurance provisions and to manage interest rate, capital and liquidity risks.
IRREVOCABLE FACILITIESMainly constitute unused portions of irrevocable credit facilities granted to corporate clients and commitments made to purchase securities to be issued by governments and private issuers.
IRREVOCABLE LETTERS OF CREDITConcerns an obligation on behalf of a client to pay an amount of money under submission of a specific document or to accept a bill of exchange, subject to certain conditions. An irrevocable letter of credit cannot be cancelled or adjusted by the bank that has granted it during the duration of the agreement unless all those concerned agree.
EMBEDDED VALUE (EV)Embedded value is the present value of all future cash flows from the contracts being owned today (embedded value does not take into account future sales). The discount rate used is equal to WACC.
EMBEDDED VALUE PROFIT (EVP)Embedded value profit is the change in embedded value over a given period over and above the amount related to the unwinding of the discount rate.
EMPLOYEE BENEFITSAll forms of consideration given by a company in exchange for service rendered by (current and former) employees.
FAIR VALUEThe amount for which an asset could be exchanged, or a liability settled, between knowledgeable, willing parties in an arm’s length transaction.
FINANCE LEASEA lease that transfers substantially all the risks and rewards associated with ownership of an asset to the lessee. Title may or may not eventually be transferred.
FINANCIAL ASSETAny asset that is:
cash;•an equity instrument of another company;•a contractual right to;•
receive cash or another financial asset from another company; or•exchange financial instruments with another company under •conditions that are potentially favourable; orcertain contract that will or may be settled in ING’s own equity •instruments.
FINANCIAL INSTRUMENTSContracts that give rise to both a financial asset for one company and a financial liability or equity instrument for another company.
FINANCIAL LIABILITYAny liability that is a contractual obligation:
to deliver cash or another financial asset to another company; or•to exchange financial instruments with another company under •conditions that are potentially unfavourable; orcertain contracts that will or may be settled in ING’s own •equity instruments.
FOREIGN EXCHANGE RATE RISKProbability of loss occurring from an adverse movement in foreign exchange rates.
FORWARD CONTRACTSCommitments to exchange currencies or to buy or sell other financial instruments at specified future dates.
FUTURE CONTRACTSCommitments to exchange currencies or to buy or sell other financial instruments at specified future dates. Exchanges act as intermediaries and require daily cash settlement and collateral deposits.
GROSS PREMIUMS WRITTENTotal premiums (whether or not earned) for insurance contracts written or assumed (including deposits for investment contracts with limited or no life contingencies written) during a specific period, without deduction for premiums ceded.
277ING Group Annual Report 2008
NET ASSET VALUEUsed in the equity method of accounting. The initial net asset value of the investment is determined by the fair value of the assets and liabilities of the investee. After the initial valuation of assets and liabilities of the investee at fair value, the assets and liabilities of the investee are valued in accordance with the accounting policies of the investor. The profit and loss account reflects the investor’s share in the results of operations of the investee.
NET PREMIUMS WRITTENGross premiums written for a given period less premiums ceded to retrocessionaires during the given period.
NET PRESENT VALUE AT RISK (NPV-AT-RISK)Establishes what the value of future cash flows is in terms of today’s monetary value. NPV-at-Risk establishes the change in value of future cash flows as a result of interest rate changes in terms of today’s monetary value.
NON-VOTING EQUITY SECURITIESCore Tier-1 securities issued to the Dutch State in October 2008 for a total consideration of EUR 10 billion. This capital injection qualifies as core Tier-1 capital for regulatory purposes.
NOTIONAL AMOUNTSRepresent units of account which, in respect of derivatives, reflect the relationship with the underlying assets. They do not reflect, however, the credit risks assumed by entering into derivative transactions.
OPERATING LEASEA lease other than a finance lease.
OPERATIONAL RISKThe risk of a direct or indirect loss resulting from inadequate or failed internal processes, people and systems or from external events.
OPTION CONTRACTSGive the purchaser, for a premium, the right, but not the obligation, to buy or sell within a limited period of time a financial instrument or currency at a contracted price that may also be settled in cash. Written options are subject to market risk, but not to credit risk since the counterparties have already performed in accordance with the terms of the contract by paying a cash premium up front.
ORDINARY SHAREAn equity instrument that is subordinate to all other classes of equity instruments. Ordinary shares participate in the net profit for the financial year after other types of shares such as preference shares.
OUT OF THE MONEYA call option is said to be out of the money if the exercise price is higher than the price of the underlying value; a put option is said to be out of the money if the exercise price is lower than the price of the underlying value.
OVER-THE-COUNTER INSTRUMENTA non-standardised financial instrument not traded on a stock exchange but directly between market participants.
JOINT VENTUREA contractual arrangement whereby two or more parties undertake an economic activity which is subject to joint control.
LENDING RISKLending risk arises when ING grants a loan to a customer, or issues guarantees on behalf of a customer. This is the most common risk category, and includes term loans, mortgages, revolving credits, overdrafts, guarantees, letters of credit, etc. The risk is measured at the notional amount of the financial obligation that the customer has to repay to ING, excluding any accrued and unpaid interest, or discount/premium amortisations.
LIQUIDITY RISKThe risk that ING Group or one of its subsidiaries cannot meet its financial liabilities when they fall due, at reasonable costs and in a timely manner.
MARKET RISKMarket risk is the risk that movements in market variables, such as interest rates, equity prices, implied volatilities, foreign exchange rates, real estate prices negatively impact the earnings or market value.
MARKET VALUE AT RISK (MVAR)A calculation method which measures the decrease in the market value surplus caused by movements in financial markets, at a 99.95% confidence level over a one year horizon.
MINORITY INTERESTSThe part of the profit or loss and net assets of a subsidiary attributable to an interest which is not owned, directly or indirectly, by the parent company.
MONETARY ASSETS AND LIABILITIESAssets and liabilities which are fixed in terms of units of currency by contract or otherwise. Examples are cash, short or long-term accounts, notes receivable in cash and notes payable in cash.
MONEY MARKET RISKMoney market risk arises when ING places short term deposits with a counterparty in order to manage excess liquidity, as such, money market deposits tend to be short term in nature (1-7 days is common). In the event of a counterparty default, ING may lose the deposit placed. Money market risk is therefore measured simply as the notional value of the deposit.
MONOLINERA financial company that deals specifically with one particular branch of the financial industry.
MONTE CARLO SIMULATIONA model to calculate Value at Risk, assuming that changes in risk factors are (jointly) normally distributed taking into account nonlinear behaviour of financial products.
MORTGAGE BACKED SECURITIES (MBS)A security whose cash flows are backed by typically the principal and/or interest payments of a pool of mortgages.
NEW SALESNew sales of life insurance, measured as Annual Premium Equivalent (APE), have been defined as the total of annual premiums and 10% of single premiums received on production in a given period.
2.4 Additional information
Financial glossary (continued)
ING Group Annual Report 2008
278

PROJECTED UNIT CREDIT METHODAn actuarial valuation method that considers each period of service as giving rise to an additional unit of benefit entitlement and measures each unit separately to build up the final obligation.
QUALIFYING ASSET (WITHIN THE MEANING OF BORROWING COSTS)An asset that necessarily takes a substantial period of time to get ready for its intended use or sale.
RECOGNITIONThe process of incorporating in the balance sheet or profit and loss account an item that meets the definition of an element and satisfies the following criteria for recognition:
it is probable that any future economic benefit associated with the item •will flow to or from the enterprise; and the item has a cost or value that can be measured reliably.•
RECOVERABLE AMOUNTThe higher of an asset’s net selling price and its value in use.
REDEMPTION VALUEWith respect to investments in fixed-interest securities, the amount payable on the maturity date.
REINSURANCEThe practice whereby one party, called the reinsurer, in consideration for a premium paid to him, agrees to indemnify another party, called the reinsured or ceding company, for part or all of the liability assumed by the reinsured under a contract or contracts of insurance which the reinsured has issued. The reinsured may also be referred to as the original or primary insurer, the direct writing company, or the ceding company.
RETURN ON EQUITY (ROE)The return on equity is the net result as percentage of the average equity.
RISK ADJUSTED RETURN ON CAPITAL (RAROC)A performance indicator that measures revenues in the perspective of the risks that had to be taken to obtain that revenue. RAROC is calculated by dividing the risk-adjusted-return by economic capital. In the RAROC calculation, the actual credit-risk provisioning is replaced by statistically expected losses reflecting the average credit losses over the entire economic cycle.
RISK-WEIGHTED ASSETS (‘RWA‘ UNDER BASEL I)Assets which are weighted for credit risk according to a formula used by the Dutch central bank (De Nederlandsche Bank), which conforms to the capital adequacy guidelines of the BIS (Bank of International Settlements). On and off-balance-sheet items are weighted for risk, with off-balance-sheet items converted to balance-sheet equivalents (using credit-conversion factors) before being allocated a risk weight.
RISK-WEIGHTED ASSETS (‘RWA’ UNDER BASEL II)Assets which are weighted for credit and market risk in accordance with the Basel II methodology. The risk-weighted assets are calculated using internal models approved by The Dutch central bank (De Nederlandsche Bank). Regulatory capital requirements for operational risk are calculated without use of risk-weighted assets.
SETTLEMENT RISKArises when there is an exchange of value (funds, instruments or commodities) for the same or different value dates or times and receipt is not verified or expected until ING has paid or delivered its side of the trade. The risk is that ING delivers, but does not receive delivery from the counterparty.
PLAN ASSETSComprise assets held by a long-term employee benefit fund and qualifying insurance policies. Assets held by a long-term employee benefit fund are assets (other than non-transferable financial instruments issued by the reporting enterprise) that:
are held by an entity (a fund) that is legally separate from the reporting •enterprise and exists solely to pay or fund employee benefits; andare available to be used only to pay or fund employee benefits, are not •available to the reporting enterprise’s own creditors (even in bankruptcy), and cannot be returned to the reporting enterprise, unless either the remaining assets of the fund are sufficient to meet all the related employee benefit obligations of the plan or the reporting enterprise or the assets are returned to the reporting enterprise to reimburse it for employee benefits already paid.
A qualifying insurance policy is an insurance policy issued by an insurer that is not a related party of the reporting enterprise, if the proceeds of the policy:
can be used only to pay or fund employee benefits under •a defined benefit plan; andare not available to the reporting enterprise’s own creditors (even in •bankruptcy) and cannot be paid to the reporting enterprise, unless either the proceeds represent surplus assets that are not needed for the policy to meet all the related employee benefit obligations or the proceeds are returned to the reporting enterprise to reimburse it for employee benefits already paid.
POST-EMPLOYMENT BENEFIT PLANSFormal or informal arrangements under which a company provides post-employment benefits for one or more employees. Post-employment benefits are employee benefits other than termination benefits and equity compensation benefits, which are payable after the completion of employment.
PREFERENCE SHARESimilar to an ordinary share but carries certain preferential rights. These rights usually concern the guarantee of a fixed (cumulative) return to the shareholder or a guaranteed return on the investment.
PREMIUMS EARNEDThe portion of net premiums written in current and past periods which applies to the expired portion of the policy period, calculated by subtracting movements in unearned premium reserves from net premiums.
PRE-SETTLEMENT RISKPre-settlement risk arises when a counterparty defaults on a transaction before settlement and ING has to replace the contract by a trade with another counterparty at the then prevailing (possibly unfavourable) market price. The pre-settlement risk (potential or expected risk) is the cost of ING replacing a trade in the market. This credit risk category is associated with dealing room products such as options, swaps, and securities financing transactions. Where there is a mutual exchange of value, the amount of outstanding is generally based on the replacement value (mark-to-market) plus potential future volatility concept, using an historical 7 year time horizon and a 99% confidence level.
PRESSURISED ASSETSPressurised assets have been defined as subprime ABS exposures, Alt-A ABS exposures, CDO/CLOs, SIVs, ABCP investment, leveraged finance and exposures on monoliners.
PRIVATE LOANLoans to governments, other public bodies, public utilities, corporations, other institutions or individuals with a loan agreement as the only instrument of title.
PRIVATE PLACEMENTA placement in which newly issued shares or debentures come into possession of a limited group of subscribers who are prepared to buy the new securities.
279ING Group Annual Report 2008

VALUE IN USEThe present value of estimated future cash flows expected to arise from the continuing use of an asset and from its disposal at the end of its useful life.
VARIANCE-COVARIANCEA model to calculate Value at Risk, assuming that changes in risk factors are (jointly) normally distributed and that the change in portfolio value is linearly dependent on all risk factor changes.
WARRANTA financial instrument that gives the holder the right to purchase ordinary shares.
WEIGHTED AVERAGE COST OF CAPITAL (WACC)The weighted average cost of capital is used as the discount rate for calculating the present value of future cash flows.
SIGNIFICANT INFLUENCEThe power to participate in the financial and operating policy decisions of an entity, but not to have control over these policies. Significant influence may be gained by share ownership, statute or agreement.
SUB-PRIME MORTGAGESMortgage loans made to borrowers who cannot get a regular mortgage because they have a bad credit history or limited income.
SUBSIDIARYAn entity that is controlled by another entity.
SURRENDERThe termination of a life or retirement contract at the request of the policyholder after which the policyholder receives the cash surrender value, if any, on the contract.
SWAP CONTRACTSCommitments to settle in cash at a specified future date, based on differentials between specified financial indices as applied to a notional principal amount. Generally, no cash is exchanged at the outset of the contract and no principal payments are made by either party.
TIER-1 CAPITALAlso referred to as the core capital of ING Bank. It comprises paid up share capital, reserves excluding revaluation reserves, retained earnings, minority interests and hybrid Tier-1.
TIER-1 RATIOReflecting the Tier-1 capital of ING Bank as a percentage of its total risk weighted assets. The minimum set by the Dutch central bank is 4%.
TOTAL AND UNDERLYING NET RESULTThe variance between Total and Underlying net result is caused by divestments and special items.
TRADING PORTFOLIOComprises those financial instruments which are held to obtain short-term transaction results, to facilitate transactions on behalf of clients or to hedge other positions in the trading portfolio.
TRANSFER RISKProbability of loss due to currency conversion (exchange) restrictions imposed by a foreign government that make it impossible to move money out of the country.
TREASURY BILLSGenerally short-term debt certificates issued by a central government. Dutch Treasury Certificates are regarded as Dutch Treasury bills.
TREASURY SHARESAn entity’s own equity instruments, held by the entity or other members of the consolidated group.
VALUE CREATIONValue creation is measured by Economic Profit (regarding non life and asset management business and banking operations) and Embedded Value Profit (regarding life and long term health business).
VALUE AT RISK (VAR)Quantifies, with a one-sided confidence level of at least 99%, the maximum overnight loss in Net Present Value that could occur due to changes in risk factors (e.g. interest rates, foreign exchange rates, equity prices, credit spreads, implied volatilities) if positions remain unchanged for a time interval of one day.
2.4 Additional information
Financial glossary (continued)
ING Group Annual Report 2008
280
ING Publications– Annual Report, in Dutch and English – Annual Report on Form 20-F, in English
(in accordance with SEC guidelines)
These publications are available on www.ing.com. The publications can be ordered on the internet: www.ing.com, button ‘Publications’,by fax: +31 411 652 125, orby mail: P.O. Box 258, 5280 AG Boxtel, the Netherlands.
This Annual Report contains the Reports of the Executive Board and Supervisory Board as well as the Annual Accounts and Other information for the financial year 2008 in their original language (English).
ING Groep N.V.Amstelveenseweg 500, 1081 KL AmsterdamP.O. Box 810, 1000 AV AmsterdamThe NetherlandsTelephone +31 20 5415411Fax +31 20 5415444
Commercial Register of Amsterdam, no. 33231073
WRITTEN AND PRoDucED byING Groep N.V.Corporate Communications, Amsterdam
DESIGNED byAddison Corporate Marketing, London
PRINTED byPlantijnCasparie Capelle a/d IJssel
DisclaimerCertain of the statements contained in this Annual Report are statements of future expectations and other forward-looking statements. These expectations are based on management’s current views and assumptions and involve known and unknown risks and uncertainties. Actual results, performance or events may differ materially from those in such statements due to, among other things, (i) general economic conditions, in particular economic conditions in ING’s core markets, (ii) changes in the availability of, and costs associated with, sources of liquidity such as interbank funding, as well as conditions in the credit markets generally, including changes in borrower and counterparty creditworthiness, (iii) the frequency and severity of insured loss events, (iv) mortality and morbidity levels and trends, (v) persistency levels, (vi) interest rate levels, (vii) currency exchange rates, (viii) general competitive factors, (ix) changes in laws and regulations, and (x) changes in the policies of governments and/or regulatory authorities. ING assumes no obligation to update any forward-looking information contained in this document.
General Information
281ING Group Annual Report 2008

WWW.ING.COM
228493
ING Groep N.V.Amstelveenseweg 500 1081 KL AmsterdamP.O. Box 810, 1000 AV AmsterdamThe NetherlandsTelephone: +31 20 5415411Fax: +31 20 5415444Internet: www.ing.com
Commercial Register of Amsterdam, no. 33231073
The trademark of the Forest Stewardship Council (FSC) indicates that the wood used to make this review comes from a forest that is well-managed according to strict environmental, social and economic standards.