Embed Size (px)
DESCRIPTION
Analysis, testing, and implementation of seismic isolationof buildings in Chile
Citation preview

EARTHQUAKE ENGINEERING AND STRUCTURAL DYNAMICSEarthquake Engng Struct. Dyn. 2004; 33:543–574 (DOI: 10.1002/eqe.360)
Analysis, testing, and implementation of seismic isolationof buildings in Chile
Juan C. De la Llera∗;† Carl L�uders, Patricio Leigh and Henry Sady
Department of Structural and Geotechnical Engineering; Ponti�cia Universidad Cat�olica de Chile;Casilla 306; Correo 22; Santiago; Chile
SUMMARY
This article summarizes the work done by the authors in seismic isolation over the past six years inChile. First, a general evaluation of the optimal values of the yield level of the isolation system isperformed, focusing on the idea of, but not restricted to, the use of lead–rubber bearings. These optimalvalues are obtained for two performance objectives: to minimize the base shear in the superstructureand to control the isolator deformation. They were used in the design and construction of two importantisolated buildings that are described herein; a short description of the more relevant aspects of the designand implementation of the isolation system in these two buildings is also presented. Furthermore, resultsfrom a long testing program conducted on more than 260 full-size elastomeric isolators are summarizedand discussed. It is shown that these experimental results enable the elastomeric compounds to becharacterized quite accurately by testing reduced-scale specimens with elastomer thickness identical tothat used in the full-size isolators. Also, results from isolator constitutive modeling, scragging, and creepin the short term are brie�y discussed. Inelastic analyses were performed in the structures in order toevaluate realistic interstory drift and �oor acceleration response reduction factors due to the isolationdesign used. It is shown that in spite of the isolation system, minor inelastic excursions of the primarystructure are expected, leading to smaller drift and acceleration reduction factors than those obtainedfrom assuming an elastic response of the superstructure. In any case, seismic isolation is shown to bea very competitive alternative, technically and economically, for building design in Chile. Althoughit may be di�cult to extrapolate this experience to other environments, the results presented hereindemonstrate that seismic isolation is a technique that can be e�ectively used to mitigate seismic hazardsin developing countries. Copyright ? 2004 John Wiley & Sons, Ltd.
KEY WORDS: seismic isolation; elastomeric bearings; lead–rubber bearings; optimal yield capacity;Chilean code, isolator testing; building implementation
∗Correspondence to: Juan C. De la Llera, Department of Structural and Geotechnical Engineering, Ponti�ciaUniversidad Cat�olica de Chile, Casilla 306, Correo 22, Santiago, Chile.
†E-mail: [email protected]
Contract=grant sponsor: Chilean National Fund for Research and Technology, FONDECYT; contract=grant number:1020774Contract=grant sponsor: Fund for Foment and Technology, FONDEF; contract=grant number: D96I1008
Received 5 January 2003Copyright ? 2004 John Wiley & Sons, Ltd. Accepted 19 August 2003

544 J. C. DE LA LLERA ET AL.
INTRODUCTION
Seismic isolation has become a popular earthquake-resistant design technique for buildings andbridges throughout the world. The technical advantages of this technique have been shownby experimental work [1–3] and also by their successful response during earthquakes [4, 5].In spite of this success, seismic isolation has not been incorporated into practice in someearthquake-prone countries at a rate consistent with these advantages. Some arguments thatjustify this are: (i) the natural conservatism of the profession, architects, structural engineers,and codes, to incorporate new technologies in building and bridge design; (ii) the infrequentoccurrence of seismic events in some countries; (iii) cost-related issues regarding the devicesand their implementation; (iv) additional architectural and structural detailing; and (v) the lackof knowledge of the users relative to the current earthquake design philosophy that admitsnon-structural and structural damage during severe ground motions.Because it is common to see seismic isolation stigmatized as an expensive technique, the
application of which should be primarily for critical facilities, one objective of this article is toshow the experience with base isolation in a country like Chile, within a framework of seriousbudget limitations and other technological constraints. Although other applications of seismicisolation are also increasing in this country, only its use in new building construction willbe emphasized herein, for which the implementation process is complex and where isolatedsolutions must compete in direct costs with traditional earthquake-resistant schemes.The �rst base-isolated building in Chile was designed and built in 1992 [6] as a joint e�ort
between the professors and researchers at the Universidad de Chile, the Ministry of Hous-ing, and Professor James Kelly of the University of California at Berkeley. The structure is afour-story masonry building supported on eight medium damping rubber isolators (MDB). Thenext step was a 3-year project funded by the government aimed at fostering the research andimplementation of seismic isolation and energy dissipation techniques in Chilean construction.This project was developed at the Universidad Cat�olica de Chile and led to a new laboratoryfor dynamic testing and vibration control. Several investigations with rubber and frictional iso-lation [7], and metallic and frictional dampers [8], have been developed since then. As a resultof this latter project, the �rst seismic-isolated hospital was designed and constructed in Chilein the year 2000 (H-UC). The 6-story R=C building is about 8000 m2 in plan and the isolationsystem consists of 30 high damping isolators (HD) and 22 lead–rubber bearings (LRB). Re-cently, a new seismically isolated institutional building for the Faculty of Engineering of theUniversidad Cat�olica (EF-UC) has been constructed (2002). The 5-story R=C structure is about6000m2 and has 25 HD isolators, 17 LRB, and 11 steel–te�on frictional sliders. Most recently,a new seismically isolated Military Hospital (MH) has been designed, with construction start-ing in January 2004. This 5-story R=C building has a total constructed area of about 50000m2
with 164 isolators, 114 MDB and 50 LRB. Several aspects of the devices, earthquake response,and design of the H-UC and EF-UC buildings are described in detail in this investigation.During the design and construction processes of these buildings, analysis, design, and exper-
imental aspects came up that the authors believe may be useful to the engineering professionand scienti�c community. Because of space limitations only those aspects considered more rel-evant for structural engineering are reported in this article. Hence, construction aspects are notreported; however, they are essential in a proper implementation of seismic isolation. In this ar-ticle, the elastic and inelastic response of simpli�ed models is �rst used to estimate the optimalyield capacity of LRB for impulsive-type and subduction-type ground motions. Then, selected
Copyright ? 2004 John Wiley & Sons, Ltd. Earthquake Engng Struct. Dyn. 2004; 33:543–574

SEISMIC ISOLATION OF BUILDINGS IN CHILE 545
experimental results aimed at characterizing the horizontal cyclic behavior of MDB and LRBfrom a sample of about 260 full-size seismic isolators are presented. Next, a more detailed de-scription of the two buildings considered as examples is presented together with their expectedinelastic earthquake response. Finally, some practical observations relative to the analysis, de-sign, and implementation of seismic isolation in these structures are presented; some of theseaspects are considered in the proposed building code for seismic isolation in Chile.
OPTIMAL YIELD CAPACITY
The �rst aspect analyzed is the Optimal Yield Capacity (OYC) required for the isolationsystem of a structure. In the case of LRB, the OYC is primarily related to the amount oflead used in the design of these bearings; for MDB the OYC is de�ned by the mechanicalproperties of the elastomer compound used. This yield capacity has an important e�ect onthe maximum base shear, torque, and acceleration of the superstructure, as well as the defor-mation demand in the isolation system. Along this line, Park et al. [9] looked for the OYCof a bridge model subjected to di�erent intensities of the N–S component of the El Centrorecord (1940). On the other hand, Ramallo et al. [10] have made a similar analysis for build-ing models but without varying the ground motion intensity. This motivated the study of asimpli�ed 5-story building model, used in previous isolation investigations [10], subjected toa suite of Chilean records and other well-known recorded ground motions for a wide rangeof ground motion intensities. The objective of this parametric study was to de�ne the OYCfor the particular design of the H-UC and EF-UC buildings but results are extended to otherstructures and ground motion characteristics.Let us consider �rst the earthquake response of the simpli�ed 5-story building presented in
Figure 1. The parameters of this building are presented in Table I and were used previouslyby Kelly et al. [11]. The building sti�ness kb is de�ned to generate an objective ‘secant’design isolation period To = 2:5s. Because the isolation modes dominate the response of globalresponse quantities such as the base shear in the superstructure, a shear building model wasconsidered in the analysis with a single lateral degree-of-freedom at each �oor level.The equations of motion of the structure with an inelastic isolation system may be stated as
M �u+Cu+Ku+ LTf =Mr�ug (1)
where M, C and K are the mass, damping and sti�ness matrices of the superstructure, respec-tively; r is the excitation in�uence vector; L is the kinematic transformation matrix betweenthe isolator deformation v and the degrees of freedom u of the structure, i.e., v=Lu; and
Table I. Structural model parameters.
Mass Sti�ness Damping(kg) (kN=m) (kN s=m)
mb=6800 kb=232 –M1 = 5897 k1 = 33732 c1 = 67M2 = 5897 k2 = 29093 c2 = 58M3 = 5897 k3 = 28621 c3 = 57M4 = 5897 k4 = 24954 c4 = 50M5 = 5897 k5 = 19059 c5 = 30
Copyright ? 2004 John Wiley & Sons, Ltd. Earthquake Engng Struct. Dyn. 2004; 33:543–574

546 J. C. DE LA LLERA ET AL.
m5
k5 5c
k4 c4
m4
k3 c3
m3
k2 c2
m2
k1 c1
m1
mb
LRB
44
1k 1c
2k
3k
2m
m1
2c
m3
3c
k
k
5 c
4m
c
5
m5
bx
x 1
x5
üg
timeug
(a) (b)
Figure 1. Simpli�ed 5-story model used to compute the optimal yield capacity (OYC):(a) base-isolated; and (b) �xed-base.
f = f(v; v; t) is the restoring force vector of the isolators. Thus the term LTf is the contributionto the equilibrium, stated at the degrees of freedom of the structure, of the isolation restoringforces. Equation (1) is frequently written in state-space format so as to integrate the linearpart of the structural response in exact form and the non-linear part by using, say, a predictor–corrector algorithm, or a Runge–Kutta method [12].For this simpli�ed parametric study, a simpli�ed bilinear force–deformation constitutive
relationship is assumed for the isolators. The in�uence of two parameters is considered,namely the yield force Qy, and the ratio between the post-yield and initial isolator sti�-nesses, k ≡Kf =Ki. To obtain a ‘secant’ fundamental period To = 2:5 s, the post-yield sti�nessis de�ned as Kf = kb = 232kN=m; besides, the yield force Qy is related to the post yield forceQf by Qf = (1 + k)Qy.Let the optimal performance criterion for the OYC of the isolation system be de�ned
by either the minimum base shear of the superstructure, or by limiting the isolator defor-mations. For a given earthquake record, the range of normalized yield force considered isQy ≡Qy=W =0:005→ 0:4, where W is the seismic weight of the structure. Three values of kare considered in the analysis, 6; 10 and 15, which are typical for LRB. The OYC of theisolation system is obtained by minimizing the base shear of the structure as a function of Qyfor a range of peak ground acceleration (PGA) values. Because shear forces are of interest,the records are scaled in order to obtain a functional relationship between the OYC and thePGA values. A second criterion used was to de�ne the OYC required to limit the deformationdemand in the isolation system, which may be critical in some cases.
Copyright ? 2004 John Wiley & Sons, Ltd. Earthquake Engng Struct. Dyn. 2004; 33:543–574

SEISMIC ISOLATION OF BUILDINGS IN CHILE 547
0
0.05
0.1
0.15
0.2
0.25
0.3
0.35
0
0.1
0.2
0.3
0.4
0.5
0.6
0.7
0.8
0.9
1PGA = 0.17 gPGA = 0.35 gPGA = 0.53 gPGA = 0.70 gPGA = 0.88 gPGA = 1.05 gPGA = 1.23 g
0 0.05 0.1 0.15 0.20
5
10
15
20
25
30
35
40
0 0.1 0.2 0.3 0.40
10
20
30
40
50
60
70
80
Normalized yield force, QY
Normalized yield force, QY
(a)
Isol
atio
n de
form
atio
n (c
m)
Nor
mal
ized
bas
e sh
ear,
V /
W
(b)
Figure 2. Mean values of normalized base shear and isolation deformation as a function of the normal-ized yield force Qy of the isolation system: (a) Llo Lleo N10E; and (b) Sylmar N00E.
Figure 2 shows a typical relationship between the normalized base shear V ≡V=W and thenormalized yield force Qy of the isolation system obtained for Sylmar (N10E component)and Llo-Lleo (N00E component); the curves presented represent average values for the threenormalized sti�ness ratios k = 6; 10 and 15. As expected, the OYC in shear increases as thePGA increases. For both records, such increase is almost linear in the space de�ned by Vand Qy [9]. The optimal yield values are, however, very di�erent between the Sylmar andLlo-Lleo records. For instance, OYC values for the Sylmar record vary between 4% and 25%of the weight of the structure; the corresponding range for the Llo-Lleo record is between0.5% and 3.5%, i.e., 7 to 12 times smaller. Besides, an increase of only 2% in the normalizedyield force Qy for the Llo-Lleo record leads to a large increase of 0.1 in the normalized based
Copyright ? 2004 John Wiley & Sons, Ltd. Earthquake Engng Struct. Dyn. 2004; 33:543–574

548 J. C. DE LA LLERA ET AL.
shear V ; however, the same increase in Qy for the Sylmar record leads to an increase of only0.04 in V . This implies, that the base shear in the structure is more sensitive to the yieldforce in the former case. Furthermore, since the curves beyond the point of minimum shearV show smaller slopes than the curves before that point, it is always convenient to select avalue of Qy slightly above the optimal value. Moreover, as should be expected, the isolationdeformations tend to decrease as the yield force increases for a given value of the PGA. Thetrends indicated in Figure 2 by these two records turn out to be general for other records ofthe same families, respectively [13].Both performance criteria of the isolation system may be combined in a single plot as
shown in Figure 3. This �gure presents the relationship between the normalized OYC, Q∗y ,
and PGA. Superimposed also is the normalized yield force required, as a function of thePGA, to maintain simultaneously the isolator deformation demand at a speci�ed value; theserestrictions are obtained from the points identi�ed by the circular markers in the bottomplots of Figure 2. Notice again that there is about a factor of 10 between the Q∗
y valuesfor the Sylmar and Llo-Lleo records. For both records, the yield force required to controlthe isolation deformation for values above the OYC increases rapidly with the PGA. Thesedeformation iso-performance curves may be used e�ectively in design in order to balancebase shear requirements and deformation requirements in the isolated structure. For instance,it is apparent that forcing a small isolator deformation value for the true Sylmar record, sayD=20 cm, would necessarily imply isolation yield forces larger than 30% of the weight ofthe structure. On the other hand, for the Llo-Lleo record the required isolator yield forces areless than 2% to keep a deformation demand of about 15 cm.A summary of the normalized OYC values, Q∗
y , and corresponding isolation deformationsfor the nine di�erent ground motions and three soil conditions considered are presented inFigure 4. It is clear that di�erent ground motions may lead to quite di�erent required optimalvalues and trends are hard to generalize. Results con�rm, however, that the OYC in thecase of Chilean records and di�erent soil conditions will rarely exceed 3%, associated withisolation deformations of less than 40 cm. For soil conditions I and III (Table II), the OYCis rather insensitive to variations of the PGA and, hence, the lead core is justi�ed only forcontrolling isolator deformations under serviceability conditions and for an eventual torsionalbalance of the building plan. Instead, for soil type II there is a larger dependency of the OYCwith the PGA values. For instance, a value of 2.5% for the OYC would be adequate to keepthe normalized base shear in the superstructure less than 0.12 and isolator deformations lessthan 20 cm for a rather large PGA of 0:8g.For the other suite of ground motion records considered, Kobe and Newhall show the
smallest OYC requirements, say less than 10%. At the other end, the SCT, Taiwan, andSylmar ground motion records would require OYC values larger than 15% of the weightof the structure. For instance, Q∗
y = 0:25 would correspond to a PGA of about 0:25g inthe case of the SCT record; however, the same Q∗
y value would correspond to a PGAof 1:2g for the Sylmar record, i.e., about �ve times larger. As should be expected, thereis a strong dependency of the required OYC values on the frequency distribution of en-ergy of the ground motion. For all ground motions considered, linearity between the OYCand PGA or isolator deformation is apparent and, hence, two design points would suf-�ce to extrapolate or interpolate the behavior of the structure for other values of theseparameters.
Copyright ? 2004 John Wiley & Sons, Ltd. Earthquake Engng Struct. Dyn. 2004; 33:543–574

SEISMIC ISOLATION OF BUILDINGS IN CHILE 549
0
0.01
0.02
0.03
0.04
0.05
0.06
0.07
0.08
D =
20
cm
D =
25
cm
D =
30
cm
Llo Lleo N10E
Minimum base shearIsolation deformation limit
0 0.2 0.4 0.6 0.8 1 1.2 1.40
0.05
0.1
0.15
0.2
0.25
0.3
0.35
0.4
0.45
0.5
D =
20
cm
D =
25
cm
D =
30
cm
D =
35
cmD
= 4
0 cm
Sylmar N00E
Normalized PGA (g)
Nor
mal
ized
OY
C
Nor
mal
ized
OY
C
(a)
(b)
Figure 3. Optimal yield capacity for two performance criteria: (a) minimum base shear; and(b) isolation deformation limit.
EXPERIMENTAL PROGRAM
This section summarizes the results of dynamic testing of rubber isolators and reduced-scalespecimens conducted between 1997 and 2002 intended to select, design, and validate the cyclic
Copyright ? 2004 John Wiley & Sons, Ltd. Earthquake Engng Struct. Dyn. 2004; 33:543–574

550 J. C. DE LA LLERA ET AL.
0
0.005
0.01
0.015
0.02
0.025
0.03
0.035ZapallarLlo LleoViña del Mar
0 0.2 0.4 0.6 0.8 1 1.2 1.40
0.05
0.1
0.15
0.2
0.25
0.3
0.35
0 10 20 30 40 50 60
El CentroSylmarNewhallKobe JMATaiwanMexico SCT
Normalized PGA (g) Deformation (cm)
Nor
mal
ized
OY
C
Nor
mal
ized
OY
C
Figure 4. Optimal yield capacity and isolation deformation corresponding to minimum base shear in theisolation system for di�erent ground motion records.
behavior of the isolation system for the H-UC, EF-UC, and MH buildings. Such a programconsidered the testing of 100 by 100 mm square elastomer specimens up to rupture (over200), quality control testing of more than 260 isolators under design conditions, and over 20prototypes of isolators under maximum capable earthquake conditions, including simultaneousshear=tension and shear=compression.The set-up used initially for testing couples of isolators is presented in Figure 5(b) and
(c) and consists of a dynamic 1000 kN MTS actuator and a vertical loading system to apply5000kN in compression and 400kN in tension. A new testing rig has been recently developedto test individual isolators with a maximum axial load of 8000kN (Figure 5(d)). The stroke of
Copyright ? 2004 John Wiley & Sons, Ltd. Earthquake Engng Struct. Dyn. 2004; 33:543–574

SEISMIC ISOLATION OF BUILDINGS IN CHILE 551
Table II. Seismic records considered in this investigation.
PGA PGV PGDGroup Record Direction (g) (cm=s) (cm)
Soil I Zapallara;b EW 0.305 13.470 −1:898Rock and sti� soil Valpara��so, UTFSMb N70E 0.176 14.600 3.143(Vs¿900 m=s) Quintayb T 0.260 −19:351 −3:503Soil II San Felipeb N80E 0.434 −17:774 −3:705Sti� soil Llo-Lleoa;b N10E −0:713 −40:295 −10:786(400 m=s¡V¡900 m=s) Melipillab NS −0:687 34.289 13.300
Soil III Valparaiso, Almendralb N50E 0.297 −28:577 −6:277Soft soil Vina del Mara;b S20W 0.363 30.742 −5:534(Vs¡400 m=s) Llay Llayb N80W −0:475 36.710 −5:736Soil II Sylmara;b N00E 0.843 −128:880 −30:670Soil III Newhalla;b N00E 0.591 −94:73 28.81Soil II Corralitosb N00E 0.63 −55:2 12.03Soil I El Centroa N00E −0:348 −33:45 −12:36Other tai068-buttera N00E 0.568 −116:27 56.20Soil II Kobe, JMAa N00E 0.822 81.30 −17:69Other M�exico, SCTa N90E −0:171 −60:610 21.160
aUsed to determine optimal yield capacity.bConsidered for seismic analysis.
the actuator is 1000mm and is connected to a 280gal=min pump through a manifold with three25l: accumulators. The axial load during the test is maintained constant by the use of a passivepressure control system connected to four axial load actuators of 2500kN each. The two beamsof the test rig (Figure 5(c)) are joined by a hinge (Figure 5(c)) that enables 3D rotation of theactuator (primarily about a vertical axis); the beam on the left of the test rig is anchored to theground and the other is free to pivot laterally on top of a te�on interface. The whole system iscontrolled analogically for simple signals with an MTS 407 controller, or digitally for earth-quake and real-time simulation using the software and hardware dSpace [14]. The test rig forindividual isolators (Figure 5(d)) works on a vertical plane; the isolator is �xed in the upperend to the vertical loading frame and on the other end to a displacement controlled sliding tablemounted on rollers. Thus, the 1000 kN shear may be essentially applied to a single isolator.Elastomeric isolators of diameter � ranging from 600mm to 900mm were installed in the
H-UC, EF-UC, and MH buildings and considered in this research program. All these isolatorswere tested up to a design shear deformation �=150%; 20 additional isolators were testedup to �=200%, which takes the actuator to its maximum shear capacity. Rubber compoundsfor these three buildings were provided by a local manufacturer and based on an exhaustivedestructive testing of reduced-scale 100 by 100 mm specimens and isolator prototypes. Aswill be shown next, the correlation between the mechanical properties of these reduced-scalespecimens and the full-scale isolator properties enables one to predict the behavior of thefull-scale isolators from small to large shear deformations of the elastomer compound.Figure 6 shows typical results for the secant shear modulus G(s)e and e�ective damping
ratio �(s)e of three reduced-scale specimens with a medium sti�ness compound subjected to
Copyright ? 2004 John Wiley & Sons, Ltd. Earthquake Engng Struct. Dyn. 2004; 33:543–574

552 J. C. DE LA LLERA ET AL.
Lead-core
(a) (b)
(c) (d)
Figure 5. Experimental set-up for shear-compression–tension testing: (a) typical � = 600mm isolator;(b) shear-compression test; (c) test rig for isolator couples; and (d) test rig for individual isolators.
sinusoidal cyclic testing at frequency f=0:1 Hz. The specimens have two elastomer layersof the same thickness as that used in the full-scale isolators. The testing sequence includedshear deformation amplitudes �=0:25, 0.5, 0.75, 1, 1.25, 1.5, 2, 2.5, 3, 3.5, 4, 4.5, 5, 5.5and 6; this latter value was attained only in a few specimens. A typical shear failure of theelastomer is shown in Figure 6(b); the propagation of rupture in the compound is caused bythe increase in shear deformation and starts for nominal shear strain �¿5, which was theminimum performance established for these projects. It is interesting to mention that thesecompounds all have elongations at rupture �u¿6. The smaller value of the shear deformation
Copyright ? 2004 John Wiley & Sons, Ltd. Earthquake Engng Struct. Dyn. 2004; 33:543–574

SEISMIC ISOLATION OF BUILDINGS IN CHILE 553
(a) (b)
0 1 2 3 4 5 66
8
10
12
14
16
0 1 2 3 4 5 60.02
0.04
0.06
0.08
0.1
0.12
Shear strain, γ Shear strain, γ (d)
ξ e(s)
Ge(s
) (kg
f/cm
2 )
(c)
Figure 6. Typical response of reduced-scale specimen, with a medium-sti�ness rubber com-pound: (a) scaled specimen; (b) rubber compound failure; (c) secant shear modulus, Ge(�);
and (d) e�ective damping ratio, �e(�).
capacity �u, as opposed to �u, is attributed to: (i) the progressive damage that occurs in thespecimen as a result of the seven dynamic cycles applied at each deformation level and (ii)the local shear strain concentrations in the corners of the square specimens. Figure 6(c) and(d) present a typical variation of G(s)e and �(s)e with shear strain for the medium sti�nesselastomeric compound. It is apparent that sti�ening of the specimen begins at �≈ 1:5 andthat the e�ective damping ratio always decreases with increasing �. Two di�erent elastomercompounds were used in the isolation system of the H-UC and EF-UC buildings with nominalsecant shear values Ge = 5 kgf =cm2 (low sti�ness) and Ge = 7:5 kgf =cm2 (medium sti�ness).Both compounds contain, in weight, over 90% natural rubber; damping is obtained by the useof special mineral oils and proportions of reinforcing �llers. Although not included here forbrevity, all experimental results lead to trends similar to those presented in this �gure.Similar testing results are presented for full-scale isolators of the H-UC building in
Figure 7. Both low- and medium-sti�ness elastomer compounds were used in the building.
Copyright ? 2004 John Wiley & Sons, Ltd. Earthquake Engng Struct. Dyn. 2004; 33:543–574

554 J. C. DE LA LLERA ET AL.
3
4
5
6
7
8
9
G = 1.7844· ² 5.0684· + 8.4441
R² = 0.8275
0 0.5 1 1.5
0.06
0.08
0.1
0.12
0.14
0.16
0.18
0.2
0.22
5
6
7
8
9
10
11
12
13
14
G = 2.5501· ² 7.4806· + 13.108
R² = 0.8558
0 0.5 1 1.5
0.06
0.08
0.1
0.12
0.14
Shear strain, γ Shear strain, γ
ξ e(i
)
Ge(i
) (kg
f/cm
2 )
ξ = -0.8159e−γ + 0.2491γ − 1.1243γ 1/2 + 1.2603
ξ = -0.9158e−γ + 0.2337 γ − 1.2032γ 1/2 + 1.4014
G = 1.7844γ 2 −5 .0684γ + 8.4441G = 2.5501γ 2 −7.4806γ + 13.108
(b)(a)
Figure 7. Shear modulus G (i)e (�) and damping ratio �(i)e (�) obtained from testing of ac-
tual-size isolators with low- and medium-sti�ness rubber compounds: (a) low sti�nesscompound; and (b) medium sti�ness compound.
Because isolators used in the EF-UC building were all manufactured with the same mediumsti�ness compound, testing results are omitted herein for brevity. The trends for the secantshear modulus G(i)e and damping ratio �(i)e of the isolators follow similar trends as those ofthe reduced-scale specimens. It is apparent that the low-sti�ness compound used was targetedfor high damping ratios, while the medium-sti�ness compound was for medium damping. Atleast in the authors’ testing experience, there is almost inevitably a trade-o� between largerdamping values, smaller shear deformation capacity �u, and smaller sti�ness of the elastomercompound. Hence, the designer should be aware that large damping is harder to obtain withhigh-sti�ness compounds and that damping values larger than those presented in Figure 7 maylead to elastomer compounds with reduced shear deformation capacity �u as compared to thatof low-sti�ness compounds.In light of the results of Figures 6 and 7, a relationship may be found between the properties
of reduced-scale and full-scale specimens. Such results are presented in Figure 8 where thesecant shear modulus values G(i)e –G
(s)e and damping ratios �(i)e –�
(s)e are plotted against each
other. The results are interesting and show an almost perfectly linear relationship between thetwo. For instance, the suggested equations for the medium sti�ness compound are
G(i)e = 0:7684G(s)e + 1:5504 (kgf =cm2) (2)
Copyright ? 2004 John Wiley & Sons, Ltd. Earthquake Engng Struct. Dyn. 2004; 33:543–574

SEISMIC ISOLATION OF BUILDINGS IN CHILE 555
0.2 0.4 0.6 0.8 1 1.2 1.4 1.6
5
6
7
8
9
10
11
12
13
14
6 7 8 9 10 11 12 13
7
7.5
8
8.5
9
9.5
10
10.5
11
0.2 0.4 0.6 0.8 1 1.2 1.4 1.60.02
0.04
0.06
0.08
0.1
0.12
0.14
0.02 0.04 0.06 0.08 0.10.06
0.07
0.08
0.09
0.1
0.11
0.12exp. fitlinear fit
Shear strain, γ Shear strain, γ
Specimen shear modulus, Ge(s) (kgf/cm^2) Specimen damping ratio, ξ e(s)
Isol
ator
she
ar m
odul
us, G
e(i)
(kgf
/cm
2 )
Dam
ping
rat
io, ξ
e
Shea
r m
odul
us, G
e (kg
f/cm
2 )
Isol
ator
dam
ping
rat
io,
ξ e(i
)
Ge(i) = 0.7684Ge
(s) + 1.5504
ξ e(i) = 1.3788ξ e(s) – 0.0051
Ge(s) = 2.5409γ 2 - 7.7910γ + 13.4491
Ge(i) = 2.06683γ 2 - 6.1863γ + 11.9514
ξ e(s) = -0.051e−γ + 0.0485γ − 0.1373γ1/2 + 0.1581
ξ e(i) = -0.5038e−γ + 0.1766γ 0.753γ 1/2 + 0.8418
Figure 8. Relationship between secant shear modulus and e�ective damping ratio determined from themeasured shear response of full-scale isolators and reduced-scale 100× 100 mm specimens.
and for the damping ratio
�(i)e = 1:3788�(s)e − 0:0051 (3)
Although these expressions may change among isolator manufacturers, a relationship of thiskind may still exist. This implies that it is possible to predict the values of the secant shearmodulus and e�ective damping ratios of the full-scale isolators by means of the 100 by100 mm specimens for the range �¡1:5, which covers the usual design region. Furthermore,these results may probably be extrapolated at least for 1:5¡�¡2:5 as well, and enable us toforesee the performance of the isolator for a maximum capable earthquake condition. This iswhy it seems advisable to request a 100 by 100mm specimen for each manufactured isolator;this would eventually make testing of full-scale isolators less necessary in the future.The e�ect of axial loads on the cyclic behavior of �=600mm LRB isolators is evaluated
next. A lead core of diameter �=100 mm was introduced in the central ori�ce of a coupleof isolators with nominal shear modulus G=7:5 kgf =cm2. Results of testing these isolators atdi�erent axial loads and deformation amplitudes are presented in Figure 9. Figure 9(a) showsthe behavior of the isolators for very small deformations ranging from 0:3 mm to 10 mm,three axial loads N =1000, 2000 and 3500 kN, and three sinusoidal excitation frequencies
Copyright ? 2004 John Wiley & Sons, Ltd. Earthquake Engng Struct. Dyn. 2004; 33:543–574

556 J. C. DE LA LLERA ET AL.
Deformation, cm
−0.08 −0.06 −0.04 −0.02 0 0.02 0.04 0.06 0.08−150
−100
−50
0
50
100
150 −1.28 −0.96 −0.64 −0.32 0 0.32 0.64 0.96 1.28
δ
N = var.
Axial Force N = 1000 kNAxial Force N = 2000 kNAxial Force N = 3500 kN
Shear strain γ
Deformation, cm
−2 −1.5 −1 −0.5 0 0.5 1 1.5 2
−800
−600
−400
−200
0
200
400
600
800
−32 −24 −16 −8 0 8 16 24 32
1
23
4
56
7
8
δ
N = 3500 kN
1) γ = 0.125, E = 554 kN·cm2) γ = 0.25, E = 1503 kN·cm3) γ = 0.5, E = 3844 kN·cm4) γ = 0.75, E = 6118 kN·cm5) γ = 1, E = 9989 kN·cm6) γ = 1.25, E = 11273 kN·cm7) γ = 1.5, E = 14222 kN·cm8) γ = 1.75, E = 17222 kN·cm
Shear strain γ
Shea
r fo
rce
(kN
)Sh
ear
forc
e (k
N)
(a)
(b)
Figure 9. Constitutive behavior of a couple of LRB (�=600mm) for small and large deformations anddi�erent axial loads: (a) small deformations; and (b) large deformations.
f=0:0887, 0.2 and 0:5 Hz. Figure 9(b) shows the cyclic behavior for larger deformationsranging between 20 and 280 mm for the same axial loads, and a single excitation frequencyf=0:1 Hz.Properties of these force–deformation cycles are summarized and compared for di�erent
axial loads and excitation frequencies in Figure 10. By comparing the results of the small andlarge deformation cycles, it is apparent that the value of axial load has an e�ect mainly on the
Copyright ? 2004 John Wiley & Sons, Ltd. Earthquake Engng Struct. Dyn. 2004; 33:543–574

SEISMIC ISOLATION OF BUILDINGS IN CHILE 557
05101520 f
= 0
.088
7 H
z., N
= 1
000
kN f
= 0
.2 H
z., N
= 1
000
kN f
= 0
.5 H
z., N
= 1
000
kN f
= 0
.088
7 H
z., N
= 2
000
kN f
= 0
.2 H
z., N
= 2
000
kN f
= 0
.5 H
z., N
= 2
000
kN f
= 0
.088
7 H
z., N
= 3
500
kN f
= 0
.2 H
z., N
= 3
500
kN f
= 0
.5 H
z., N
= 3
500
kN
00.
010.
020.
030.
040.
050.
060.
07051015202530
0.51
1.52
2.53
00.
20.
40.
60.
81
1.2
1.4
1.6
1.8
1015202530
Shea
r st
rain
, γ
Effective damping ratio, ξ Normalized Stiffness kγ / kγ = 1
Shea
r st
rain
, γ
(a)
(b)
Figure10.Measuredvariationofthenormalizedsti�nessande�ectivedamping
ratio
ofLRBwith
axialloadand
excitationfrequency:(a)smalldeformations;and(b)largedeformations.
Copyright ? 2004 John Wiley & Sons, Ltd. Earthquake Engng Struct. Dyn. 2004; 33:543–574

558 J. C. DE LA LLERA ET AL.
small deformation cycles (Figures 9 and 10). In the latter case, an increase in compressionforce leads to better con�nement of the lead core, thus increasing the normalized isolator sti�-ness K = k(�= 1)=k�= ksec=((2GeA(i)+2A(l)Q
(l)y )=Hr) and e�ective damping ratio �e. Moreover, as
should be expected, an increase in the excitation frequency leads to an increase in the isolatorsti�ness, but less than 10%; it also leads to a slight decrease in the damping ratio. The sensi-tivity of the response to di�erent axial loads reduces with increasing shear deformation for thelevel of deformations considered (Figure 10(b)). Indeed, for �¿0:4, the three curves are for alldesign purposes essentially identical. Results may also be presented in terms of the normalizedhysteretic energy, e=Wd=W
(�= 1)d , and normalized shear force, V =Vo=V(�= 1) =Vo=(2GeA(i) +
2A(l)Q(l)y ), but show identical trends [13]. Although these results may be slightly perturbed bythe scragging recovery present in the isolators, they clearly show that for compression stressesin the isolators less than 130 kgf =cm2, the e�ect of axial loads is negligible as seen from theshear force–deformation cycle of these isolators. In spite of this, axial forces are extraordi-narily important in isolation design and evaluation of the maximum shear deformation of theelastomer, stability properties, and long-term properties of the isolators.
Time variation of isolator properties is a permanent concern of users and designers. Someresults of scragging, creep, and time change of mechanical properties in the short term arepresented in Figure 11. Figure 11(a) shows a sequence of cycles performed to evaluate theconstitutive behavior in shear and scragging of the isolators. The elastomeric isolator se-lected (�=900mm) was subjected to the following tests: (a) one �rst cycle at �=0:25, 0.5,0.75, 1, 1.25 and 1.5; (b) after each cycle in (a), seven cycles were performed dynamically(f=0:1Hz) with the same �, the last of these seven cycles is presented by dashed lines in the�gure; (c) repeat (b) at increasing values of shear deformation �=0:25, 0.5, 0.75, 1, 1.25 and1.5—only as an example, the maximum force attained in the last of these cycles for �=1:25is indicated by c in the �gure; (d) repeat (c) 15 hours later. Notice that if the isolator defor-mation exceeds for the �rst time the deformation corresponding to that of a previous cycle,the curves catch the envelope of the unscragged shear–deformation constitutive relationship.This implies that scragging is a deformation-dependent phenomenon and will restart everytime the isolator is taken to a new larger deformation. In our example, point a represents theforce for the unscragged envelope (upper bound) and point b is the maximum force where thecyclic behavior becomes stable for a maximum �=1:25. However, if a larger deformation,say �=1:5, is imposed on the isolator, the cyclic behavior for �=1:25 now becomes stableat point c, which is considerably lower than point b. Moreover, if the test is repeated severalhours later, the cycles become stable at point d, which is slightly below c. Thus, although theisolator may have been scragged to a deformation, say �o, scragging at larger deformations�¿�o will decrease the isolator forces developed at �o despite the previous scragging. Thise�ect should be considered in deciding the objective scragging deformation.
A second e�ect in design is the time recovery of the unscragged properties of the elastomer.Compared in Figure 11(b) are the values of the secant shear modulus G obtained from severaltests of isolators performed about 96 hours apart; G1 and G2 represent the initial and last shearmodulus, respectively, for the same isolator under the same testing conditions. The apparenttrend is that for smaller deformations the isolator sti�ness increases (recovers) with time.Because all the projects presented in this study are very recent there is no further informationthat enables us to con�rm this short-term behavior in the long term. Furthermore, typicalresults from creep tests of isolators are presented in Figure 11(c). For these isolators, the �nal
Copyright ? 2004 John Wiley & Sons, Ltd. Earthquake Engng Struct. Dyn. 2004; 33:543–574

SEISMIC ISOLATION OF BUILDINGS IN CHILE 559
0 5 10 15 20 250
100
200
300
400
500
600
700
800
Deformation (cm)(a)
6 7 8 9 10 11 12 136
7
8
9
10
11
12
13γ = 0.25γ = 0.50 γ = 1.00γ = 1.50
0 10 20 30 40 50 60 700
0.1
0.2
0.3
0.4
0.5
0.6
0.7
G5−60, N = 3900 kNG7.5−60, N = 4500 kNG5 −60, N = 4500 kN
G1 (kgf/cm2) Time (hours)
Shea
r fo
rce
(kN
)
Def
orm
atio
n (c
m)
G
2 (k
gf/c
m2 )
ba
cd
(c)(b)
Figure 11. Scragging, recovery and creep in the short term for a typical isolator: (a) typical constitutivebehavior of � = 900mm rubber isolator; (b) recovery of second shear modulus; and (c) isolator creep.
deformation set values are achieved in less than 30hours. A large number of short-term creeptests performed on these isolators demonstrate that for long-term compression stresses less than130 kgf =cm2, short-term creep deformations will rarely exceed 1mm for these compounds andisolator design. The �uctuations observed in the �nal deformation values may be attributedto changes in ambient temperature.
Copyright ? 2004 John Wiley & Sons, Ltd. Earthquake Engng Struct. Dyn. 2004; 33:543–574

560 J. C. DE LA LLERA ET AL.
The force–deformation constitutive relationship of a LRB may be cast in terms of a recentlyproposed model [15]. The model has fewer parameters than the original model proposed byPan and Yang [16] and is capable of representing peculiar phenomena of elastomeric bear-ings such as Mullins and scragging e�ects. In this model, the force–deformation relationshipproposed is de�ned by a pseudo-linear relationship [15]:
f(v(t); v(t))= k(v(t); v(t))v(t) + c(v(t); v(t))v(t) (4)
where k(v(t); v(t)) and c(v(t); v(t)) are the deformation and deformation-rate dependent sti�-ness and damping of the isolator, respectively; and v(t) and v(t) are the isolator deformationand deformation velocity. The sti�ness may be computed through
k(v(t); v(t))= a1 + a2v(t)2 + a3v(t)4 +a4e(a9
∫ t0 f(v(t);v(t))v(t) dt)
cosh2(a5v(t))(5)
and the damping coe�cient by
c(v(t); v(t))=a6 + a7v(t)2√a28 + v(t)2
(1 + e(a10∫ t0 f(v(t);v(t))v(t) dt)) (6)
where a1 to a10 are parameters that control the force–deformation loop. For instance, the terma9 times the integral of the work done by the isolator is intended to represent the loss ofsti�ness due to scragging of the isolator; the term a10 is related to the energy lost throughcycling of the isolator. Figure 12(a) shows the results obtained from this model for di�erentshear deformations and a constant compression load N =3500 kN; the selected parameters a1to a10 are de�ned in the enclosure in units of ton and cm. The matching observed between thepredicted and measured traces of the force–deformation relationship is good, except for sheardeformations below �=0:25. For other values of the axial load N in ton, just a8 needs to bemodi�ed by considering the relationship a8 = 4:188(6:2+0:003N ). Also shown in Figure 12(b)is the identi�ed behavior of the lead core of the isolator, obtained by subtracting the measuredconstitutive behavior of the isolator without the lead core from the total shear-deformationbehavior of the isolator including the lead core. It is observed that the identi�ed yield capacityin shear of the lead is about 10MPa, which is the usual nominal value considered in design.
DESCRIPTION OF BUILDINGS
The �rst building considered is a new hospital of the Universidad Cat�olica (H-UC) located onthe skirts of the Andes mountains in the east part of the city of Santiago (Figure 13(a)). Thebuilding was designed in 1999 and its one-year construction was �nished in early 2001. Thebuilding has a total area of about 8000m2 distributed in 6 stories (5 above ground level and 1basement) and weighs about 10341ton above the isolation level. As indicated in Figure 14(a),the building was built as a single unit with no construction joints due to the use of the isolationsystem; its approximate plan dimensions are 78 m by 31 m. Story heights are equal to 3:4 min the upper 5 stories and 4 m at the basement. The structure is formed by ductile moment-resisting frames with 80 cm deep beams with a typical 12 m span and columns with 75 cmsquare sections in the superstructure and 90 cm at the basement. These latter columns are
Copyright ? 2004 John Wiley & Sons, Ltd. Earthquake Engng Struct. Dyn. 2004; 33:543–574

SEISMIC ISOLATION OF BUILDINGS IN CHILE 561
Deformation (cm)
−2 −1.5 −1 −0.5 0 0.5 1 1.5 2
−800
−600
−400
−200
0
200
400
600
800
−32 −24 −16 −8 0 8 16 24 32
δ
N = 3500 kNPredictedMeasured
Shear deformation γ
−0.8 −0.6 −0.4 −0.2 0 0.2 0.4 0.6 0.8−15
−10
−5
0
5
10
15
Shear deformation γ
Shea
r fo
rce
(kN
)
a1 = 1964.8124 a2 = -1.0064
a3 = 0.0009043 a4 = 771.9865
a5 = 0.17741 a6 = 7625.2165
a7 = 0.5489 a8 = 1.1726
a9 = 1.1726 a10 = 1.1726
Shea
r st
ress
, MPa
(b)
(a)
Figure 12. Comparison between the measured and predicted cyclic behavior of a LRB and identi�edbehavior of the lead-core: (a) LRB constitutive behavior; and (b) identi�ed lead-core behavior.
laterally braced by ribs coming out of the perimeter retaining wall, and interior columns areconnected below the isolation level by 40× 40cm axial R=C struts. Concrete with a cylindricalstrength f′
c = 300 kg=cm2 and steel with a nominal yield stress fy = 4200 kg=cm2 was used in
the construction of the structure. As shown in Figure 14, seismic isolation is placed at thetop of the basement, thus avoiding the construction of an extra �oor slab for the building.
Copyright ? 2004 John Wiley & Sons, Ltd. Earthquake Engng Struct. Dyn. 2004; 33:543–574

562 J. C. DE LA LLERA ET AL.
(a)
(b)
Figure 13. Isolated buildings described in this investigation: (a) Hospital building (H-UC); and(b) Engineering faculty building (EF-UC).
Copyright ? 2004 John Wiley & Sons, Ltd. Earthquake Engng Struct. Dyn. 2004; 33:543–574

SEISMIC ISOLATION OF BUILDINGS IN CHILE 563
RB, H5-φ60 cm
RB, H8-φ60 cm
RB, H8-φ65 cm
RB, H8-φ70 cm
LRB, H5-φ60 cm
LRB, H8-φ60 cm
(a)
(b)
Figure 14. Hospital building considered in this study (H-UC): (a) building plan; and(b) moment resisting plane 17.
Copyright ? 2004 John Wiley & Sons, Ltd. Earthquake Engng Struct. Dyn. 2004; 33:543–574

564 J. C. DE LA LLERA ET AL.
The isolation system consists of 52 elastomeric isolators of diameters 600, 650 and 700 mm,22 of them with �=100 mm lead cores, according to the planwise distribution presentedin Figure 14(a). The two elastomeric compounds presented earlier (Figure 7) were selectedfor the structure, with design shear modulus G=5 kg=cm2 and G=7:5 kg=cm2. The nominalisolation periods of the structure are Tx=2:80 s, Ty = 2:64 s and T�=2:27 s; the correspondingperiods of the �xed-base structure are 0:41 s, 0:38 s and 0:23 s, respectively.Since all isolators were tested prior to their installation in the building, their �nal location
was selected in order to balance the structure in torsion. Indeed, the �nal estimated nominaleccentricities of the structure with measured sti�ness values are ex=b=0:027 and ey=b=0:011,which are small for such an irregular structure. In order to increase the lateral-to-torsionalfrequency ratio of the structure , the isolators with lead cores were placed closed to theperimeter of the building (Figure 14(a)); the �nal for the structure is estimated to beabout 1.2. The spectrum selected for the design of the isolation system is based on themeasured ground motion during the 1985 Chile earthquake, and de�nes for this structurea maximum displacement for the isolator of 35 cm associated with a 10% probability ofexceedance in 100 years. Furthermore, based on the results presented earlier for the OYC, avalue Q∗
y = 2:5% was selected for the design of the structure. Although not presented herefor the sake of brevity, architectonic details of this structure are rather complex and a largenumber of interesting solutions were proposed for hanging a cable-stayed bridge used in themain access of the structure, ramps, hanging staircases, hanging elevator shafts, pool, drains,auditorium, piping, and so forth; the interested reader may check them elsewhere [17].Figure 13(b) shows the new Engineering Faculty building of the Universidad Cat�olica
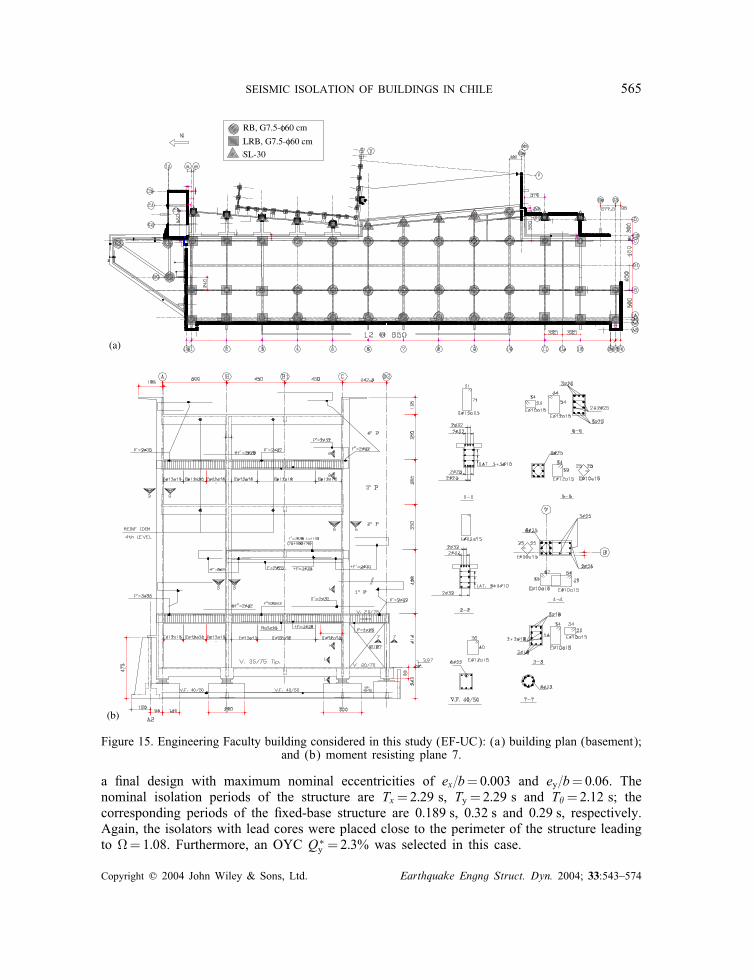
(EF-UC), which is located in the San Joaqu��n campus of this university in a SW districtof Santiago. The building was designed in the year 2000 and constructed during 2001. Ithas a total surface area of approximately 6000 m2 distributed in 5 stories (4 above groundlevel and 1 basement) and the superstructure weighs about 7456 tons. It has a rectangularplan with plan dimensions 92 m by 14 m and, as in the previous case, it was built as asingle unit with no construction joints due to the lateral �exibility of the isolation system(Figure 15). The structure of the building is based on a combination of R=C shear walls(e=20cm) and moment-resisting frames with reinforcement ductility details corresponding toa zone of moderate seismicity. Such is the case because the shear walls constitute the lateralload-resisting system and the columns are primarily a vertical load-carrying system. A typicaltwo span (9m and 5m) moment-resisting frame in the transverse direction is shown in Figure15(b). Beams are either 20cm by 70cm, or 35cm by 75cm deep, rectangular exterior columnsare 40cm by 60cm, and interior columns are 45cm square sections. Nominal concrete strengthand steel reinforcement yield stress are the same as for the previous structure.The structure is isolated at the foundation level with 42 identical elastomeric isolators
(Figure 15(a)) of diameter �=600mm, of which 17 have �=100mm lead cores, and 11 aresteel–te�on–elastomer sliders. The structure has a retaining wall along its perimeter separatedfrom the main building structure by a 32cm gap, which is the maximum displacement expectedfor an earthquake with a 10% probability of exceedance in 100 years. A single G=7:5kg=cm2
elastomer compound was used for all isolators and sliders. The 300 mm slider moves on astainless steel sliding surface with �=1200mm diameter. The measured frictional coe�cientvaries approximately from 0.10 to 0.15 for the range of velocities and maximum axial loadof 68 ton assumed in the design. As in the previous case, the natural eccentricity of thesuperstructure was corrected by the proper placement of the isolators in plan, leading to
Copyright ? 2004 John Wiley & Sons, Ltd. Earthquake Engng Struct. Dyn. 2004; 33:543–574
SEISMIC ISOLATION OF BUILDINGS IN CHILE 565
RB, H8- 60 cm
SL-30LRB, H8- 60 cm
(a)
(b)
RB, G7.5-φ60 cm
LRB, G7.5-φ 60 cm
SL-30
Figure 15. Engineering Faculty building considered in this study (EF-UC): (a) building plan (basement);and (b) moment resisting plane 7.
a �nal design with maximum nominal eccentricities of ex=b=0:003 and ey=b=0:06. Thenominal isolation periods of the structure are Tx=2:29 s, Ty = 2:29 s and T�=2:12 s; thecorresponding periods of the �xed-base structure are 0:189 s, 0:32 s and 0:29 s, respectively.Again, the isolators with lead cores were placed close to the perimeter of the structure leadingto =1:08. Furthermore, an OYC Q∗
y = 2:3% was selected in this case.
Copyright ? 2004 John Wiley & Sons, Ltd. Earthquake Engng Struct. Dyn. 2004; 33:543–574

566 J. C. DE LA LLERA ET AL.
The �nal costs of the structure, including all aspects of the isolation system, were US$115=m2 and US$ 125=m2 for the H-UC and EF-UC buildings, respectively. In Chile these costsare similar to those of conventional structures, positioning seismic isolation as a competitivetechnique in the market. This leaving aside powerful arguments such as protection of contentsand earthquake-damage reduction in the isolated structure relative to a conventional structure.Currently, three new modules are being constructed to the south of the EF-UC structure,making this the longest building in the country (L≈ 120 m) without construction joints.
ELASTIC AND INELASTIC BUILDING RESPONSE
In this section, the inelastic response of typical resisting planes of the H-UC and EF-UC(Figures 14 and 15) is evaluated. A parametric study is performed for 12 recorded impulsiveand non-impulsive ground motions and variable yield capacity Qy of the isolation systemranging between 2.5% and 15% of the weight of the structure. The inelastic analyses are per-formed assuming elasto-plastic 2D hinges at the column and beam ends of the superstructure.Plastic behavior in the hinges is de�ned by an interaction surface between axial load andbending moment computed from nominal section and reinforcement properties of the struc-tural members. Each isolator is modeled by a bilinear constitutive relationship calibrated withtheir experimentally measured constitutive behavior.Four analyses are performed with di�erent analytical models of the superstructure and
ground motion records, i.e.: (i) �xed-base structure with linear behavior (L); (ii) �xed-basestructure with inelastic behavior (NL); (iii) linear structure with inelastic behavior of the iso-lation system (LI); and (iv) inelastic structure with inelastic behavior of the isolation system(NLI). Response reduction factors are de�ned as the ratio of the response of the �xed-basestructure over the corresponding response of the isolated structure; i.e., R= r(o)=r(i). Conse-quently, two reduction factors are de�ned: a linear reduction factor R(L) = r(L)=r(LI), relatingthe responses of the linear �xed-base and isolated structure and the inelastic reduction fac-tor R(NL) = r(NL)=r(NLI), relating the responses of the inelastic �xed-base and inelastic isolatedstructure.Figure 16 shows the force–deformation responses of the isolation system of the H-UC build-
ing for three di�erent yield force values, Qy = 2:5%, 5% and 15%, and three ground motions.For the EW sti� soil site ground motion Zapallar (Chile, 1985), the isolated structure has amaximum deformation less than 1:5 cm; notice also that the minimum shear value occurs forQy = 2:5% and that for Qy = 15% the isolation system remains elastic. The NS componentof the Melipilla record (Chile, 1985) is more demanding and for Qy = 2:5%, which leadsto the smallest base shear, the maximum isolator deformation is about 10 cm. It is apparenthow the shear force in the isolation system increases as Qy increases, justifying the use of asmall OYC for the Chilean records. Furthermore, the N00E component of the Sylmar record(Northridge, 1994) is quite demanding for the isolation system of this building, leading toa deformation demand close to 50 cm for Qy = 2:5%. However, it is interesting to note thatfor all Qy values, the maximum base shear demand in the structure is very similar, while themaximum isolator deformations decrease signi�cantly for larger Qy values. Consequently, ifthe H-UC building were subjected to the Sylmar record, the OYC should have been of theorder of 15% of the weight of the structure instead of the 2.5% used for its actual design.
Copyright ? 2004 John Wiley & Sons, Ltd. Earthquake Engng Struct. Dyn. 2004; 33:543–574

SEISMIC ISOLATION OF BUILDINGS IN CHILE 567
−5 −4 −3 −2 −1 0 1 2 3 4 5
−200
0
200 Zapallar EW Qy/W = 2.5 %
Qy/W = 5 %
Qy/W = 15 %
−15 −10 −5 0 5 10 15−400
−200
0
200
400
Melipilla NS
−60 −40 −20 0 20 40 60
−500
0
500Sylmar N00E
Deformation (cm)
Isol
ator
she
ar f
orce
(kN
)
Figure 16. Typical bilinear force–deformation response of an isolator of the H-UC building with inelasticmodel of the isolation system and superstructure.
A comparison between the elastic and inelastic roof accelerations and 2nd-story drift ofthe H-UC building for Melipilla and Sylmar is presented in Figure 17. The use of seismicisolation in the structure always leads to a signi�cant reduction in interstory drift and accel-eration, i.e., R(L)� =5:7, R
(L)A =6:1, R
(NL)� = 6:1 and R(NL)A =4:9 for the Melipilla record; on the
other hand, R(L)� =2:9, R(L)A =3:1, R
(NL)� =3:8 and R(NL)A =1:48 for the Sylmar record. Therefore,
inelastic acceleration reduction factors are, as should be, smaller than the elastic ones. Forthe inelastic case and Sylmar (Figure 17(b)), the 2nd-story drift is reduced from 2.3% toabout 0.6% and the maximum roof acceleration from 1g to 0:7g. By comparing parts (a) and(b), the traces of interstory drift are strongly a�ected by the inelastic behavior of the su-perstructure. Indeed, for the Melipilla and Sylmar records the �xed-base structure would endup with permanent drifts of the order of 0.15% and 0.3%, respectively. Notice also that forMelipilla the interstory drift demand for the isolated structure is below 0.2% and, hence, onlyminor damage, if any, could be expected in non-structural components for this frame structuresubjected to this ground motion. These observations carry over to other ground motions andto the EF-UC building as well [13].Furthermore, Figure 18 shows the heightwise pro�les of displacement, drift, and acceleration
for the H-UC building subjected to the Melipilla and Sylmar ground motions. The inelasticdrift demand occurs in the second story and is about 1% and 2.3% for these two records,respectively. Seismic isolation in the structure is able to reduce these drifts to about 0.16%and 0.60% (Figure 17). Analogously, �oor accelerations in the superstructure are also reducedby seismic isolation from maximum values of about 1g for the inelastic case to 0:2g and 0:7gfor Melipilla and Sylmar, respectively. These accelerations increase with increasing values
Copyright ? 2004 John Wiley & Sons, Ltd. Earthquake Engng Struct. Dyn. 2004; 33:543–574

568 J. C. DE LA LLERA ET AL.
−1
0
1
−1.3367
0.22064
Melipilla NS −1
0
1
2 2.1003
0.67657
Sylmar N00E
fixed-baseisolated
0 10 20 30 40 50 60
−1
−0.5
0
0.5
1 1.0176
−0.17972
0 5 10 15 20
−2
−1
0
1
2
−2.0052
−0.68269
Time (sec) Time (sec)(a)
−1
0
1
−1.0147
0.2062
Melipilla NS
−1
0
1
2
1.02830.69426
Sylmar N00E fixed-baseisolated
0 10 20 30 40 50 60
−1
−0.5
0
0.5
1 0.9936
−0.16374
0 5 10 15 20
−2
−1
0
1
2 2.2706
−0.60373
Time (sec) Time (sec) (b)
Inte
rsto
ry d
rift
(%
) A
ccel
erat
ion
(g)
Inte
rsto
ry d
rift
(%
) A
ccel
erat
ion
(g)
2nd story
2nd story
Roof
Roof
Figure 17. Response history results for the �xed-base and isolated H-UC building considering a linearand inelastic model of the superstructure: (a) linear model of the superstructure; and (b) inelastic
model of the superstructure.
of Qy; accelerations in the level immediately below the isolation interface also increase asa result of this part of the structure being connected to the ground. This implies that thestory below the isolation level might result in larger member forces if the selection of theOYC is inadequate. Since the yield force value Qy=W =2:5% and the Melipilla record leadsin the superstructure to peak �oor accelerations less than 0:20g, story drifts less than 0.2%,and isolation displacements below 10 cm, this value was selected in the actual design of bothbuildings considered in this investigation. This OYC could also work in principle for thestructure subjected to the Sylmar record; however, the isolation displacements would be over50 cm, leading to a large gap and a costly isolation system. Because of this, a larger value ofshear capacity of the order of Qy=W =15% would work better in such a case, reducing thedisplacement demand of the isolation system to values below 30cm, peak �oor accelerations inthe superstructure less than 0:7g, and story drifts below 0.6%. Consequently, these results showthe sensitivity of an isolation design to the di�erent characteristics among ground motions.Finally, notice that the earthquake responses estimated from linear and non-linear models of
Copyright ? 2004 John Wiley & Sons, Ltd. Earthquake Engng Struct. Dyn. 2004; 33:543–574

SEISMIC ISOLATION OF BUILDINGS IN CHILE 569
0 10 20 30
0
1
2
3
4
5
S0 0.5 1 1.5 0 0.5 1 1.5
Linear
Inelastic
LILI
y 2.5NLI
Fy 2.5LI
y 5NLI
y 5LI
y 15NLI
y 15
Displacement (cm) Story drift (%) Acceleration (g)
0 50 100
0
1
2
3
4
5
S0 1 2 3 0 1 2 3
Displacement (cm) Story drift (%) Acceleration (g)
Floo
r le
vel
Floo
r le
vel
(a)
(b)
Figure 18. Response of the H-UC building subjected to the Melipilla and Sylmar records for di�erentyield force and modeling of the superstructure: (a) Melipilla record; and (b) Sylmar record.
the superstructure are quite similar. Hence, these results warrant the use in design of an elasticmodel for the superstructure together with an inelastic model of the isolation system.In order to generalize these results for other ground motions, Figure 19 shows bands for
the ratio of the maxima of the interstory drift, R�, and �oor acceleration, RA, for the two
Copyright ? 2004 John Wiley & Sons, Ltd. Earthquake Engng Struct. Dyn. 2004; 33:543–574

570 J. C. DE LA LLERA ET AL.
Figure 19. Band of reduction factors for acceleration and interstory drift in the superstructure of buildingsH-UC and EF-UC (�rm soil): (a) Chilean ground motions; and (b) impulsive ground motions.
buildings as a function of Qy (2.5%–15%). The results presented are for the actual �rmsoil conditions of the two structures and the reduction bands obtained correspond to elasticand inelastic models of the superstructure; results for other soil conditions lead to similar
Copyright ? 2004 John Wiley & Sons, Ltd. Earthquake Engng Struct. Dyn. 2004; 33:543–574

SEISMIC ISOLATION OF BUILDINGS IN CHILE 571
conclusions and are summarized elsewhere [13]. It is apparent that seismic isolation alwaysleads to considerable reductions in interstory drifts that range between 2 and 7 times. Thesereduction factors tend to decrease with increasing values of Qy. They are also more sensitiveto this parameter for Chilean records because the dissipation capacity of the lead cores is moree�ective, as with most energy dissipators, only if the structure goes through multiple vibrationcycles. Furthermore, reduction factors for �oor accelerations vary between 1.5 and 4 for bothfamilies of ground motions and always decrease as Qy increases. Based on these results, anOYC value less than 4% seems a good recommendation for Chilean records; however, largervalues will be needed for the design with impulsive ground motions in order to control thedeformation demand of the isolators. Finally, reduction factors based on the actual inelasticresponse of the structure R(NL) are usually, but not always, smaller than reduction factors basedon the elastic response of the building R(L). This should be expected since, for instance, �ooraccelerations for the �xed-base inelastic superstructure are smaller than those of the elasticsuperstructure and, hence, the numerator of RA decreases for the inelastic case.
IMPLICATIONS FOR DESIGN AND PRACTICE
The results presented above have been used in calibrating a proposal for a new seismic isola-tion building code presented by a group of researchers and practitioners to the Chilean Instituteof Normalization [18]. This proposal is strongly based on the ICBO 2000 [19] and other pre-vious design documents [18]—indeed the initial document is a translation of the isolationprovisions of the UBC 97, but includes interesting modi�cations (some in the commentary)in aspects related to the local seismicity, design spectra de�nition, damping reduction factors,isolation modeling, optimal values of shear capacity, experimental isolation results, and otherissues to make the text coherent with the local engineering practice.An important step was to develop a Newmark–Hall-type design spectra (Figure 20) consis-
tent with the response spectra obtained for the 1985 Chile earthquake in all frequency regions.Since the tendency has been to calibrate design spectra based on pseudo-acceleration responsespectra, reported spectral ordinates for long-period structures (T¿2 s) are usually inadequatesince the exponents of the decaying branches of the spectrum do not satisfy the physicallyexpected trends. The spectra presented in Figure 20 is based on the work of the committee[18] on the response spectra obtained for the 1985 earthquake [18]. Since for dynamic analysisthe whole spectrum is required, a simpli�ed, say, constant pseudo-velocity spectra may leadusually to an over-estimation of �oor accelerations and forces in the superstructure.Because of the organic nature of rubber and the inherent variability in the manufactur-
ing process of isolators, testing some bearings and reduced-scale specimens of the elastomercompound seems strictly necessary. In the authors’ opinion, based on testing so far over 400di�erent size and shape building and bridge isolators, quality control testing is at least asimportant as prototype testing since it enables one to identify �aws that are common to thefabrication process, such as di�erences in the properties of rubber compounds coming fromdi�erent batches of rubber, improper alignment of steel shims in plan and height (rarely seenfrom the outside in the undeformed isolator due to the cover), local failures and cracks re-lated to the mould and curing process, and more importantly, benchmarking for monitoringthe evolution of the isolation system in time. Although prototype testing does guarantee thestability of the design based on testing a couple of isolators, it is fair to say that failing
Copyright ? 2004 John Wiley & Sons, Ltd. Earthquake Engng Struct. Dyn. 2004; 33:543–574

572 J. C. DE LA LLERA ET AL.
0 0.5 1 1.5 2 2.5 3 3.5 40
0.2
0.4
0.6
0.8
1
1.2
1.4
Soil III
Soil II
Soil I
α AA
Ta Tb Tc Td Period (s)
Sa
T
2 π
Soil I
Soil III
Soil II A
Period, T (s)
Nor
mal
ized
pse
udo
acce
lera
tion
, Sa/
g T
4π2
2
.αDD
.αVV
Figure 20. Design spectrum proposed for the Chilean code of isolated structures (seismiczone 2 and damping ratio �=0:05).
in shear a reasonably fabricated natural rubber isolator under maximum capable earthquakeconditions is di�cult, even after a large number of cycles. Therefore, since the results ofreduced-scale 100 by 100 mm specimens have shown an excellent agreement with the truebehavior of full-scale specimens, and they are cheaper, they should be required for describinga compound throughout the whole shear deformation range. In any case, the designer mustbear in mind that variabilities in sti�ness and damping ratio within ±15% should be expectedfor the same isolator manufacturer and design.An existent or induced crack in the elastomer will usually increase progressively as defor-
mation increases. Therefore, the initiation of any crack in the elastomer should be delayed bya good geometric design of the isolator mould, including primarily a well-designed foot andrubber vents. Sharp corners and other singularities should be avoided since they generate largelocal shear strains that initiate unbonding or cracking of the rubber laminates. From the testsperformed in scaled specimens, �nal unbonding failures should be precluded since they tendto occur suddenly as opposed to rupture in the elastomer that leads to a failure that requiresseveral cycles to propagate throughout the laminate (Figure 6(b)).Speci�c damping reduction factors for non-impulsive ground motions were derived for this
code proposal. The reduction factors due to damping B for non-impulsive ground motionsmay be computed for the three di�erent soil conditions by (Table III):
B(�; T )=1
Bo − (Bo − 1) exp(−a(�− 0:05)T ) (7)
where Bo = 2(1 + �)=(1 + 14:68�0:865); a is a coe�cient speci�ed in Table III; and � is thedamping ratio. These reduction factors were computed by using ground motions compatiblewith the design spectrum associated with the three di�erent soil conditions. Because of thelarger number of strong motion cycles present in non-impulsive ground motions relative to
Copyright ? 2004 John Wiley & Sons, Ltd. Earthquake Engng Struct. Dyn. 2004; 33:543–574

SEISMIC ISOLATION OF BUILDINGS IN CHILE 573
Table III. Coe�cient a (Equation (7)).
� Soil I Soil II Soil III
0.10 396.9 293.1 224.50.15 180.7 124.6 98.00.20 117.9 76.1 57.10.25 94.0 54.3 39.60.30 68.5 42.0 30.40.50 36.9 22.2 16.1
impulsive motions, these factors are, as should be, larger than those speci�ed in the ICBO2000 code [19].Although not described herein for reasons of brevity, architectonic aspects in seismically
isolated structures are of great importance and should not be overlooked during the structuraldesign phase. It is precisely this point that makes isolation projects special in the sense thatthey require a stronger interaction between the architect and structural engineer; a poor designof these architectonic details may counter balance the merits of seismic isolation in terms ofstructural response. Although every structure has speci�c architectonic details, there are certaintypologies of solutions that tend to repeat in order to accommodate the lateral displacementbetween the �xed-to-ground structures and components and the superstructure. The interestedreader may �nd a collection of low-cost joint solutions and details for the surrounding gap,facades, staircases, ceilings, handrails, elevators, piping, and other situations elsewhere [17].As stated before, the cost of the bare structure including isolation was US$ 115 and US$
125 per square meter for the H-UC and EF-UC buildings, respectively. This value is withinthe usual range for conventional structures and thus makes isolated structures very competitive.The reader may wonder about the direct cost of these structures without isolation. Althoughestimates for both buildings were generated in terms of preliminary designs to compare be-tween the isolated and conventional solutions, the numbers are always questionable since a�nal project would be required for estimating real construction costs in each case. However,it is the authors’ opinion that direct costs between the two solutions ended up being quitesimilar mainly because no extra slab was required in the H-UC building, all shear walls wereeliminated, and the building has no construction joint, which is required for structures ofsuch dimensions in plan. For the EF-UC building, extra costs due to isolation were counter-balanced by: (i) the elimination of the construction joint in the structure (ii) a more economicdesign of the foundation system; and (iii) a lower density of shear walls and reinforcementin columns than for conventional structures of this kind in the country.
CONCLUSIONS
This article summarizes the work done by the authors over the past six years in Chilewith seismically isolated structures. The work has included an extensive testing program,design, and implementation of elastomeric isolation in two reinforced concrete structures ofquite di�erent characteristics in structure and foundation soil. Currently, results of this ap-plied investigation will be used in the new Military Hospital, a structure with 164 elas-tomeric isolators, the largest isolated structure in South America. It has been shown by this
Copyright ? 2004 John Wiley & Sons, Ltd. Earthquake Engng Struct. Dyn. 2004; 33:543–574

574 J. C. DE LA LLERA ET AL.
structural implementation that seismic isolation is a competitive earthquake-resistant construc-tion technique in this country and it is expected to expand rapidly in the years to come.Furthermore, a new building code for seismically isolated structures is currently approved andwill probably be available for the profession in November 2003. This technology is beingtransferred to the profession through seismic isolation courses taught in the Civil Engineer-ing curricula of the best universities in the country as well as through the interaction inprojects between the di�erent universities and the engineering profession, such as with theMilitary Hospital. It is expected that the experience developed in this country may be of use toother countries in the region which share similar seismic characteristics and social=economicenvironments.
ACKNOWLEDGEMENTS
This investigation has been supported by the Chilean National Fund for Research and Technology,FONDECYT under Grant # 1020774. Part of the research was also supported by the Fund for Fomentand Technology, FONDEF under Grant #D96I1008. The authors are grateful for this support.
REFERENCES
1. ATC 17-1. Seminar on Seismic Isolation, Passive Energy Dissipation, and Active Control. Applied TechnologyCouncil. Vol. 1, San Francisco, 1993;1–435.
2. Anderson TL. Earthquake Engineering Research Institute. Seismic isolation: from idea to reality. EarthquakeSpectra 1990; 6(2):
3. Raufaste N. Survey Report on Framing of the Guidelines for Technological Development of Base-isolationSystems for Buildings. Building and Fire Research Laboratory, National Institute of Standards and Technology,April 1992.
4. Holmes T, Somers P. Northridge earthquake of 17 January 1994. Reconnaissance report. Earthquake Spectra1996; 11(Supplement C):243–251.
5. Fujita T. Demonstration of e�ectiveness of seismic isolation in the Hanshin–Awaji earthquake and progress ofapplications of base-isolated buildings. Report on the 17 January 1995 Kobe Earthquake, Japan. Institute ofIndustrial Science, University of Tokyo, Japan; 197–216.
6. Moroni MO, Sarraz��n M, Borocheck R. Experiments on a base-isolated building in Santiago, Chile. EngineeringStructures 1998; 20:720–725.
7. Almaz�an JL. Accidental and natural torsion in isolated structures with the FPS systems. Ph.D. Thesis, Facultyof Engineering. Universidad Cat�olica de Chile, 2001. In Spanish.
8. De la Llera JC, Esguerra C, Almaz�an JL. Earthquake behavior of structures with copper energy dissipators.Earthquake Engineering and Structural Dynamics 2004; 33:329–358.
9. Park JG, Otsuka H. Optimal yield level of bilinear seismic isolation devices. Earthquake Engineering andStructural Dynamics 1999; 28:941–955.
10. Ramallo JC, Johnson EA, Spencer BF. ‘Smart’ base isolation systems. Journal of Engineering Mechanics(ASCE) 2002; 128(10):1088–1099.
11. Kelly JM, Leitmann G, Soldatos AG. Robust control of base-isolated structures under earthquake excitation.Journal of Optimization Theory and Applications 1987; 53:159–180.
12. Inaudi JA, De la Llera JC. SAT-Lab: Structural Analysis Toolbox. www.sat-lab.com, 2002.13. Leigh P. Aislaci�on s��smica de estructuras con sistemas h��bridos de goma y aleaciones: an�alisis, experimentaci�on,
y diseno. Master Thesis, Faculty of Engineering. Universidad Cat�olica de Chile, 2002.14. dSPACE. Solutions for Control: Catalog and Training Program 1999. [email protected], Germany, 1999.15. Hwang JS, Wu JD, Pan TC, Yang G. A mathematical hysteretic model for elastomeric isolation bearings.
Earthquake Engineering and Structural Dynamics 2002; 31:771–789.16. Pan TC, Yang G. Nonlinear analysis of base-isolated MDOF structures. Proceedings of the 11th World
Conference on Earthquake Engineering, Paper No 1534, Mexico, 1996.17. SIRVE. Innovative Systems for Vibration Reduction. www.sirve.cl, 2002.18. Asociaci�on Chilena de Sismolog��a e Ingenier��a S��smica. Proposal for a Chilean code of seismically isolated
structures. Grupo de Protecci�on S��smica, ACHISINA, March 2001. In Spanish.19. ICBO International Building Code. Seismically isolated structures: Section 1623. International Code Council,
Inc. 2000.
Copyright ? 2004 John Wiley & Sons, Ltd. Earthquake Engng Struct. Dyn. 2004; 33:543–574


