Embed Size (px)
Citation preview

350 YEARS OF AIR POLLUTION:
WHAT WE THINK WE KNOW AND WHAT
WE DON’T.
Anthony Seaton

JOHN EVELYN AND
FUMIFUGIUM (1661)
A PLEA TO KING CHARLES II

SIR JOHN FLOYER
1649-1734
A TREATISE OF THE ASTHMA
1698

GLASGOW 1776 – THE YEAR THE WORLD
CHANGED
James Watt and his
improved steam engine
Adam Smith and The
Wealth of Nations

CLAUDE MONET
THE HOUSES OF PARLIAMENT
1904
LONDON SMOG
TRAFALGAR SQUARE
NOON, DECEMBER 1952

DEATHS IN 1952 LONDON SMOG:
LED TO UK’S CLEAN AIR ACTS
CARDIAC VS RESPIRATORY DEATHS
LONDON DECEMBER 1952

DOES REDUCTION IN POLLUTION MAKE
A DIFFERENCE? DUBLIN 1984-96 CLANCY ET AL, LANCET 2002;360:1210
Air pollution declined by an
average 35.5g/m3 black
smoke
Respiratory death rates
(adjusted) fell by 15%
Cardiac deaths (adjusted) fell
by 10%
c359 fewer cardio-respiratory
deaths per year

LATE 20TH CENTURY: THE ERA OF
OIL.
GROWTH OF TRANSPORT,
INDUSTRIAL COMBUSTION,
HEATING ETC.
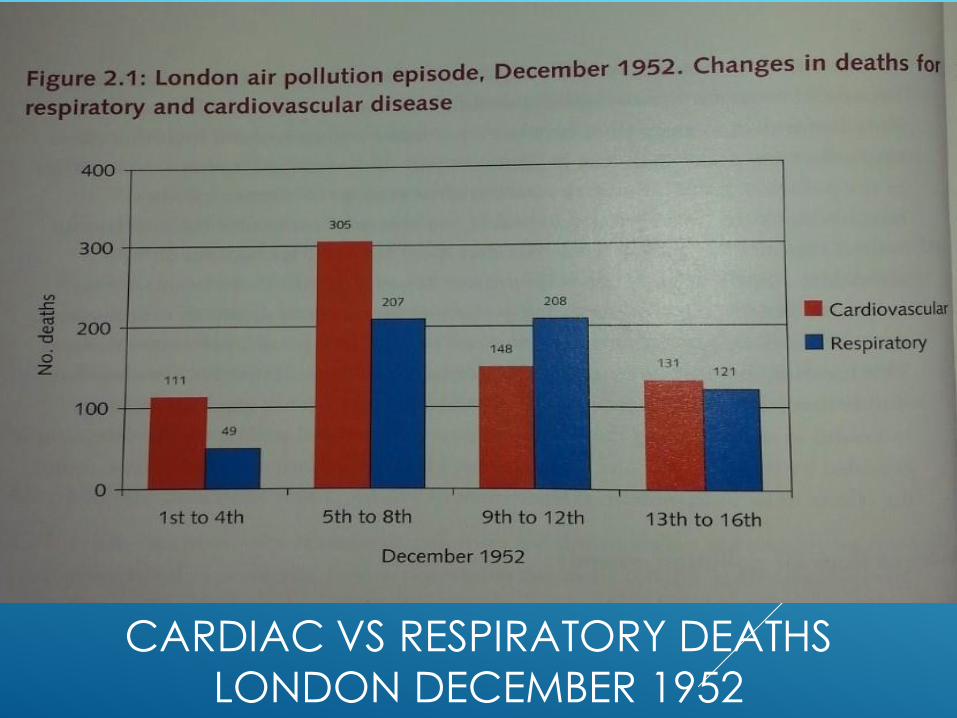
POLLUTION EPISODE DECEMBER 1991

ROSS ANDERSON ET AL. THORAX 1995;50:1188
Rise in deaths overall and
from heart attack
Rise in hospital admissions from lung disease in elderly
Non-significant rise in
asthma admissions in children
Non-significant rise in lung
disease admissions overall

THE 1990S - WHAT NEEDED
EXPLANATION: THE ASSOCIATION OF
AIR POLLUTION WITH CARDIAC DISEASE
Many studies had shown PM to be associated with both:
short-term increases in cardiac mortality and admissions, and
increases in cardio-pulmonary mortality in relation to historic exposure.

PLAUSIBILITY PROBLEM
It takes c100mg arsenic to kill!
Why were these very low particle masses,
<1mg inhaled over 24 hours, associated
with such consistently adverse effects?

PARTICULATE AIR POLLUTION AND ACUTE HEALTH EFFECTS SEATON A ET AL. LANCET 1995;345:176
Hypothesised that:
it is not the mass but the number;
the ultrafine particles are important, as they
penetrate readily indoors
cause local lung inflammation
which in turn results in release of mediators
which alter blood coagulability
which increases risk of heart attacks

DOES THE LUNG COUNT PARTICLES? SEATON AND DENNEKAMP THORAX 2003;58:1012-5
Each tiny particle is a potential invading micro-organism, requiring
local macrophage defence and
a systemic reaction
The more particles above background, the greater the systemic reaction,
and the greater the chance of adverse effects from inflammation.

0
25000
50000
75000
100000
Time
part
icle
s/c
m3
shop shop
eating in a shopping mall
walking on the main street

PARTICLE NUMBERS IN OXFORD
CIRCUS STATION
0
50000
100000
150000
200000
250000
300000
07:3
4:1
1
08:3
4:1
1
09:3
4:1
1
10:3
4:1
1
11:3
4:1
1
12:3
4:1
1
13:3
4:1
1
14:3
4:1
1
15:3
4:1
1
16:3
4:1
1
17:3
4:1
1
18:3
4:3
9
part
icle
s/c
m3

PARTICULATE AIR POLLUTION AND THE
BLOOD
SEATON ET AL THORAX 1999;54:1027
112 healthy subjects aged 60+
Belfast and Edinburgh
Monthly blood samples
3-day diaries pre-sampling
One 24hr personal PM10 sample on
each

CHANGE IN RELATION TO RISE OF 100G/M3
PM10 IN ESTIMATED 3 DAY EXPOSURE
mean 95%CI p
Haemoglobin
g/dl
-0.44 -0.62, -0.26 <0.001
PCV
ratio
-0.016 -0.022, -0.01 <0.001
RCC
x1012/l -0.14 -0.2, -0.08 <0.001
Platelets
x1012/l
-10.8 -21.2, -0.4 0.039

INTERPRETATION
Changes in red cells and platelets most likely to be related to sequestration
Thus, activation of endothelial factors likely explanation
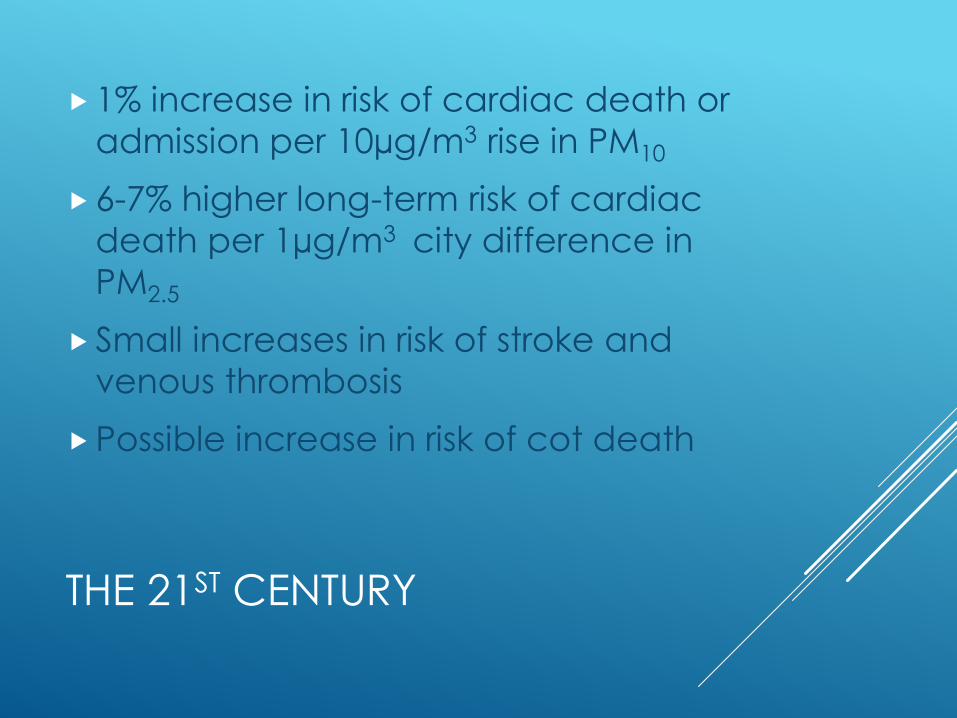
THE 21ST CENTURY
1% increase in risk of cardiac death or
admission per 10µg/m3 rise in PM10
6-7% higher long-term risk of cardiac
death per 1µg/m3 city difference in
PM2.5
Small increases in risk of stroke and
venous thrombosis
Possible increase in risk of cot death

WHAT WE THINK WE
KNOW, 2016
Particles are a likely cause of cardiovascular
disease and exacerbations of lung disease
NO2 is also associated with similar risks, but this seems less plausibly causative.
NO2 is a good marker of vehicle combustion and nanoparticle numbers

“CARBONUMQUE GRAVIS VIS,
AUQUE ODOR INSINUATOR QUAM
FACILE IN CEREBRUM”
HOW EASILY THE STRONG, HEAVY
FUME OF CARBON MAY INFILTRATE
THE BRAIN!
LUCRETIUS. DE NATURA, LIBER VI C60 BC

DOES AIR POLLUTION AFFECT THE BRAIN? CLIFFORD A ET AL. ENV RES 2016;147:383-98
So far, weak evidence of:
Delayed development with in utero
exposure.
Impaired neurocognitive performance in
children
Accelerated cognitive decline in adults

HOW CAN THIS BE?
Direct action of nanoparticles?
Several viruses can access and be transmitted along
olfactory nerve
Air pollution particles have been found in brains of
dogs and people in Mexico City
Mediated effect on endothelial blood-brain barrier?

WHAT WE DON’T KNOW 2016
How the message is transmitted
If/how pollution affects the brain
Does NO2 do anything or is it just a
marker of nanoparticles?

SOME THOUGHTS FOR THE
FUTURE
Cardiac and thrombotic effects are explicable on basis of general change in blood and/or endothelial function.
So is cot death - ask me how!
And cognitive change?
Is a unitary hypothesis conceivable? Clue: red cells, endothelial cells contain ChAT, ACh receptors and AChE.

THANK YOU.
ANTHONY SEATON

LUNG, BLOOD VESSELS AND BRAIN:
ANALOGOUS EFFECTS OF PARTICLES
Lung Blood vessels Brain
Pathological
mechanisms
Inflammation -
Fibrosis and tissue
breakdown
Thrombosis,
endothelial
dysfunction,
inflammation
Neurovascular
bundle disruption,
inflammation, leaky
blood-brain barrier
Diseases Silicosis, IPF,
emphysema
Atheroma, plaque
breakdown, heart
attack
Impaired cognition,
dementia

Tissue factor
Factor VII
IX and X
IXa and Xa
Blood
Cytokines (IL-8, IL-6)
etc.
LIVER
Possible endothelial activation
PRO-COAGULANT
STATE
Unphagocytosed particles
Oxidatively-stressed macrophages and epithelial cells
Oxidants Particles cause
oxidative stress
LOCAL
INFLAMMATION
Possible mechanisms for the production of local inflammation and a systemic pro-coagulant state after PM10/2.5 exposure

NANOPARTICLES, THE NOSE
AND THE BRAIN
Estimates of deposition of 20nm particles in
human respiratory tract (from Oberdörster et al 2004)

The clotting and fibrinolysis systems
Cross-linked fibrin clot
Tissue factor
Fibrinogenesis system
t-PA
Fibrin degradation products
Fibrin
products
Plasminogen Plasmin
t-PA
Fibrin degradation products
Fibrin
products
Plasminogen Plasmin
Fibrin degradation products
Fibrin
products
Plasminogen Plasmin
Anti-fibrinogenesis system

ENDOGENOUS FIBRINOLYSIS – TISSUE PLASMINOGEN ACTIVATOR (T-PA) RELEASE
t-PA antigen following diesel (●) and air (●) during brachial artery infusion of bradykinin.
Area under the curve for t-PA release was reduced by 33.6% following
diesel exhaust exposure
100 300 1000
0
30
60
90
120
150
180
Bradykinin, pmol/min
Ne
t re
lea
se
of
t-P
A a
ntig
en
(ng
/10
0 m
Lo
f tissu
e/m
in)
P < 0.05

DO ULTRAFINE PARTICLES TRAVEL
INDOORS? OSUNSANYA ET AL OEM 2001;58:154
79 concurrent counts in and outside lab,
door and windows closed, no internal
source, 2 months
Correlation 0.94
Indoor = 0.527 x outdoor +1468

Vascular endothelium
Classical risk factors
Smoking
Diabetes mellitus
Dyslipidaemia
Hypertension
Novel risk factors
Infection/inflammation
Physical inactivity
Homocysteine
Air pollution?
ENDOTHELIAL DYSFUNCTION
Impaired
vasodilatation Impaired
fibrinolysis Platelet
activation
Monocyte
adhesion
Atherosclerotic lesion formation and progression
Plaque rupture
Thrombosis and vasospasm

RELATIONSHIP BETWEEN BLOOD
MEASUREMENTS AND PREVIOUS 3 DAYS
ESTIMATED EXPOSURE - CORRECTED FOR ALBUMIN
-0.5
-0.45
-0.4
-0.35
-0.3
-0.25
-0.2
-0.15
-0.1
-0.05
0
PCV RCC
LCI
Mean
UCI
Hb - g/dl, PCV %, RCC - x1012/dl
Hb
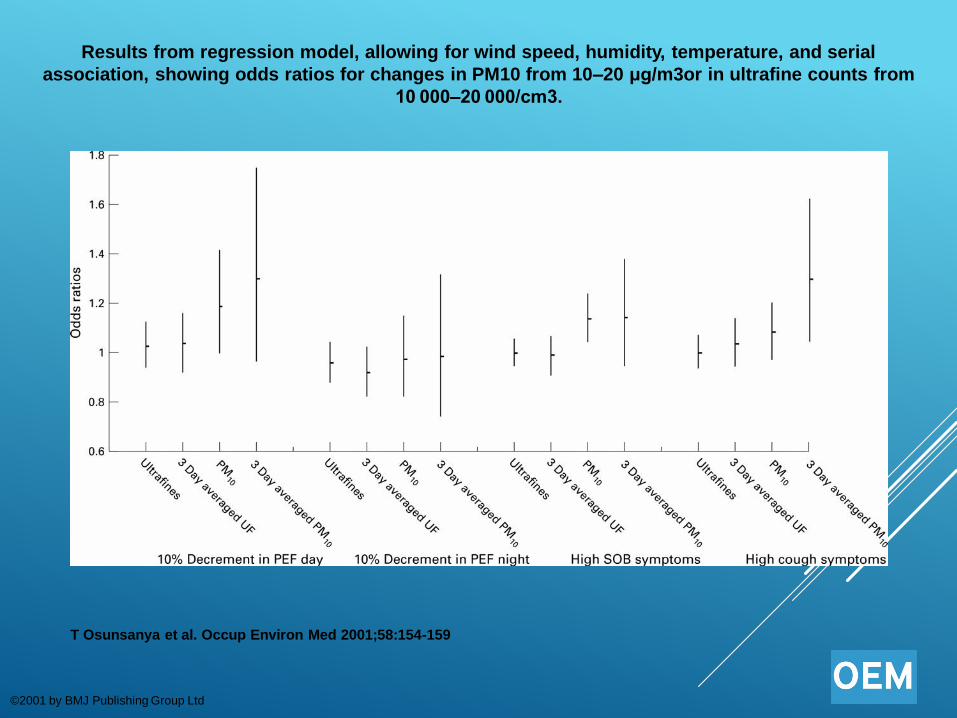
Results from regression model, allowing for wind speed, humidity, temperature, and serial
association, showing odds ratios for changes in PM10 from 10–20 μg/m3or in ultrafine counts from
10 000–20 000/cm3.
T Osunsanya et al. Occup Environ Med 2001;58:154-159
©2001 by BMJ Publishing Group Ltd

Results from regression model, allowing for wind speed, humidity, temperature, and serial
association, showing odds ratios for changes in PM10 from 10–20 μg/m3or in ultrafine counts from
10 000–20 000/cm3.
T Osunsanya et al. Occup Environ Med 2001;58:154-159
©2001 by BMJ Publishing Group Ltd

ORIGINS OF THE HYPOTHESIS
COMEAP discussions early 1990s
Associations with cardiac episodes
Low exposures - g/m3
People spend most of their time indoors
Must be some confounder – social factors, temperature?

1950S TO 1980S
PROF PAT LAWTHER AND THE MRC
How does pollution harm health? Which
components are harmful?
Emphasis on black smoke and acid aerosol,
leading to control of coal burning in cities.
Recognition of concomitant effects of
weather – cold, still periods,
Resulted in dramatic reductions in urban
pollution – problem solved?

WHAT WE KNOW, 2016
Air pollution increases risk of cardiac and chronic respiratory disease, and of ischaemic stroke, embolism and cot death
It is associated with exacerbations of asthma
The main cause of pollution is combustion of fossil fuels
Reduction of pollution is associated with
reduction of cardiorespiratory deaths

PM2.5 IN CENTRAL LINE - DRIVER’S CABIN
0
100
200
300
400
500
600
700
08
:04
:00
08
:34
:00
09
:04
:00
09
:34
:00
10
:04
:00
10
:34
:00
11
:04
:00
11
:34
:00
12
:04
:00
12
:34
:00
13
:04
:00
13
:34
:00
14
:04
:00
14
:34
:00
µg
/m3

WHAT WE KNEW BY 1990
In spite of great reduction in levels,
pollution was still associated with cardio-
respiratory deaths and admissions
Composition of pollution had changed –
less SO2, less black and acidic
Associations were detectable at very low
concentrations

COMBINED EFFECT ESTIMATES OF DAILY MEAN
PARTICULATE POLLUTION (COMEAP 2004)
% increase in risk per 10g/m3
rise in:
PM10 PM2.5 Black
smoke
Cardiovascular
deaths
0.9
(0.7-1.2)
1.4
(0.7-2.2)
0.6
(0.4-0.7)
Cardiac
admissions
0.9
(0.7-1.0)
- 1.0
(0.4-1.5)
Cerebrovascular
deaths
0.4
(0.0-0.8)
- -

LONG-TERM CARDIO-PULMONARY
EFFECTS
6% increase in cardio-pulmonary mortality in relation to historic exposure differences of 10g/m3 PM2.5, in US adults
(JAMA 2002;287:1132)
7% increase in risk of cardio-pulmonary mortality in relation to 10g/m3 estimated average personal exposure to black smoke in The Netherlands
(Lancet 2002;360:1203)

PARTICLE NUMBERS IN DIFFERENT
ENVIRONMENTS
home
other home
office
shop
restaurant
traffic (walking)
light traffic
bus
landrover
car
Particle number concentration (n/cm3)
2000001000000