Embed Size (px)
Citation preview

Page 1
ENERGY IMPACT STATEMENT
For all projects with a construction budget over $2 million, complete an Energy Impact Statement as required by the Design Guidelines 2.1, 2.2 and 3.2. Refine and update the Energy Impact Statement throughout the three design phases as more detailed information regarding the project becomes available. For comparison, prior estimates are to be shown on subsequent updates of the Energy Impact Statement. The following describes the general methodology to be used for each utility section. Provide supporting information with the Energy Impact Statement for each phase where required.
Legend: ALL: Requirement for each phase SD: Schematic Design Phase DD: Design Development Phase CD: Construction Document Phase
Electrical: ALL: Describe methods and assumptions used to calculate electrical estimates. SD: Can use watts per square foot.
Identify any unusual loads. Estimates can be a developed using a computer simulation or a spread sheet listing peak demand, estimated diversity and annual consumption.
DD & CD: Estimates based on actual design and not watts per square foot. Estimates can be a developed using a computer simulation program or a spread sheet listing peak demand, estimated diversity and annual consumption. Indicate diversity assumptions or include schedules from computer simulation.
Low Pressure Steam: ALL: Describe methods and assumptions used to calculate low pressure steam estimates.
Provide list of significant loads showing peak demand and annual consumption. SD: Heating consumption estimate can be developed using ASHRAE Degree Day Formula or
Bin Estimate Method. CD & DD: Develop heating consumption estimates using a computer simulation program utilizing
8,760 hours per year analysis such as Trane Trace, Carrier HAP or Elite EZDOE.
60 PSI Steam: ALL: Describe methods and assumptions used to calculate 60 PSI steam estimates.
Provide list of significant loads showing peak demand and annual consumption.
Chilled Water: ALL: Describe methods and assumptions used to calculate chilled water estimates.
Provide list of significant loads showing peak demand and annual consumption. CD & DD: Develop chilled water cooling estimates using a computer simulation program utilizing
8,760 hours per year analysis such as Trane Trace, Carrier HAP or Elite EZDOE.
Domestic Cold Water: ALL: Describe methods and assumptions used to calculate domestic cold water estimates.
Provide fixture count summary and site source for estimating peak diversified demand.
Domestic Hot Water: ALL: Describe methods and assumptions used to calculate domestic hot water estimates.
Provide fixture count summary and site source for estimating peak diversified demand.
Natural Gas: ALL: Describe methods and assumptions used to calculate natural gas estimates.
Storm Drainage system: ALL: Describe methods and assumptions used to calculate storm drainage estimates.

Page 2
Building Description and Assumptions: Provide a brief narrative describing various building related items and assumptions used to complete the Energy Impact Statement. Among these are the following:
a. Building Gross Floor Area b. Building Hours of Operation (breakdown for various key areas as required) c. Utilities Required d. Mechanical Systems Description e. Chilled Water Design Entering and Leaving Temperatures f. Assumed Design Residual Pressure for the Domestic Cold Water System g. Electrical System Description

Page 3
ENERGY IMPACT STATEMENT BLANK FORM
Project Name:
<insert project name> U of M Project No.: <insert project number>
MMBTU = 1,000,000 BTU MLB = 1000 LB CCF = 100 Cubic Feet
Building Energy Summary:
Schematic Phase
Design Development
Phase
Construction Document Phase
Project Affected Gross Area, (GSF)
Annual Building Energy Consumption All Energy Input Converted to BTU, (MMBTU/year)
Annual Building Energy Consumption per GSF, (kBTU/year/GSF)
Electrical:
Maximum Demand, (kW)
Annual Consumption, (kWH/year):
Lighting Not Required
Miscellaneous Power Not Required
HVAC Equipment Not Required
Low Pressure Steam:
Peak Load, (lbs/hr):
Summer
Winter
Annual Consumption, (MLB/yr):
Heating Not Required
Humidification Not Required
Air Conditioning Not Required
Domestic Water Heating Not Required
Process Not Required
60 PSI Steam:
Peak Load, (lbs/hr):
Summer
Winter
Annual Consumption, (MLB/yr)

Page 4
Project Name:
<insert project name> U of M Project No.: <insert project number>
Chilled Water:
Schematic Phase
Design Development
Phase
Construction Document Phase
Peak Load, (tons):
Summer
Winter
Annual Consumption, (ton-hours/year)
Domestic Cold Water:
Peak Cold Water Demand, (GPM)
Peak Sanitary Demand, (GPM)
Annual Consumption, (million gallons/year):
Sanitary Sewer Not Required
Cooling Tower Evaporation Not Required
Cooling Tower Blowdown Not Required
Domestic Hot Water:
Peak Demand, (GPM)
Annual Consumption, (million gallons/year)
Natural Gas:
Peak Demand, (CCF/hour)
Annual Consumption, (CCF/year)
Storm Drainage system:
Design Storm Peak Volume, (GPM)

Page 5
ENERGY IMPACT STATEMENT SAMPLE
Building Description and Assumptions: General:
Central Campus building with mix of offices and classrooms. Some small labs. Building Gross Floor Area:
40,000 GSF (4 Stories @ 10,000 GSF each) Building Hours of Operation (breakdown for various key areas as required):
7 a.m. – 6 p.m. and as further defined in the attached calculations and computer simulation input schedules.
Utilities Required: Low pressure steam from Central Power Plant. High pressure steam from Central Power Plant. Domestic hot water from Central Power Plant. Domestic cold water from City of Ann Arbor. Natural gas from MichCon. Electricity from Central Campus sub-station.
Mechanical Systems Description: Single low pressure steam absorption water chiller. Roof mounted cooling tower. Two air handling units located in the basement mechanical room. VAV boxes with hot water reheat coils. Hot water perimeter heating via steam/hot water heat exchanger. Gas fired unit heaters at Loading Dock. High pressure steam for autoclaves. 44 F Entering Chilled Water Temperature, 56 F Leaving Chilled Water Temperature. Assumed design residual pressure for the Domestic Cold Water System is 30 psi.
Electrical System Description Electrical feed will come from Central Campus feeder 21-2. No emergency generator is required.

Page 6
Project Name:
XXXXXX Addition & Renovation U of M Project No.: Project No. P0000XXXX
Building Energy Summary:
Schematic Phase
Design Development
Phase
Construction Document Phase
Project Affected Gross Area, (GSF) 40,000
(See Exhibit A, 1.1)
40,000 (See Exhibit B, 1.1)
40,000 (See Exhibit C)
Annual Building Energy Consumption All Energy Input Converted to BTU, (MMBTU/year)
14,518 (See Exhibit A,
1.2)
12,781 (See Exhibit B, 1.2)
12,781 (See Exhibit C)
Annual Building Energy Consumption per GSF, (kBTU/year/GSF)
363,000 (See Exhibit A,
1.3)
319,500 (See Exhibit B, 1.3)
319,500 (See Exhibit C)
Electrical:
Maximum Demand, (kW) 480
(See Exhibit A, 2.1)
474 (See Exhibit B, 2.1)
474 (See Exhibit C)
Annual Consumption, (kWH/year): 800,000
(See Exhibit A, 2.2)
786,545 (See Exhibit B, 2.2)
786,545 (See Exhibit C)
Lighting Not Required 346,080 (See Exhibit B, 2.3)
346,080 (See Exhibit C)
Miscellaneous Power Not Required 212,367 (See Exhibit B, 2.4)
212,367 (See Exhibit C)
HVAC Equipment Not Required 228,098 (See Exhibit B, 2.5)
228,098 (See Exhibit C)
Low Pressure Steam:
Peak Load, (lbs/hr):
Summer 6,400 (See Exhibit A,3.1)
6,080 (See Exhibit B, 3.1)
6,080 (See Exhibit C)
Winter 1,552
(See Exhibit A, 3.2)
1,403 (See Exhibit B, 3.2)
1,403 (See Exhibit C)
Annual Consumption, (MLB/yr): 9,743
(See Exhibit A, 3.3)
8,404 (See Exhibit B, 3.3)
8,404 (See Exhibit C)
Heating Not Required 2,436 (See Exhibit B, 3.4)
2,436 (See Exhibit C)
Humidification Not Required 9 (See Exhibit B, 3.5)
9 (See Exhibit C)
Air Conditioning Not Required 5,957 (See Exhibit B, 3.6)
5,957 (See Exhibit C)
Domestic Water Heating Not Required 2 (See Exhibit B, 3.7)
2 (See Exhibit C)
Process Not Required 0 (See Exhibit B, 3.8)
0 (See Exhibit C)
60 PSI Steam:
Peak Load, (lbs/hr):
Summer 400
(See Exhibit A, 4.1)
250 (See Exhibit B, 4.1)
250 (See Exhibit C)

Page 7
Winter 400
(See Exhibit A, 4.2)
250 (See Exhibit B, 4.2)
250 (See Exhibit C)
Annual Consumption, (MLB/yr) 200
(See Exhibit A, 4.3)
125 (See Exhibit B, 4.3)
125 (See Exhibit C)

Page 8
Project Name:
XXXXXX Addition & Renovation U of M Project No.: Project No. P0000XXXX
Chilled Water:
Schematic Phase
Design Development
Phase
Construction Document Phase
Peak Load, (tons):
Summer 320
(See Exhibit A, 5.1)
304 (See Exhibit B, 5.1)
304 (See Exhibit C)
Winter 100
(See Exhibit A, 5.2)
82 (See Exhibit B, 5.2)
82 (See Exhibit C)
Annual Consumption, (ton-hours/year) 320,000
(See Exhibit A, 5.3)
297,856 (See Exhibit B, 5.3)
297,856 (See Exhibit C)
Domestic Cold Water:
Peak Cold Water Demand, (GPM) 200
(See Exhibit A, 6.1)
200 (See Exhibit B, 6.1)
200 (See Exhibit C)
Peak Sanitary Demand, (GPM) 231
(See Exhibit A, 6.2)
231 (See Exhibit B, 6.2)
231 (See Exhibit C)
Annual Consumption, (million gallons/year):
9.53 (See Exhibit A,
6.4)
9.53 (See Exhibit B, 6.3)
9.53 (See Exhibit C)
Sanitary Sewer Not Required 11.53 (See Exhibit B, 6.4)
11.53 (See Exhibit C)
Cooling Tower Evaporation Not Required 2.04 (See Exhibit B, 6.5)
2.04 (See Exhibit C)
Cooling Tower Blowdown Not Required 0.37 (See Exhibit B, 6.6)
0.37 (See Exhibit C)
Domestic Hot Water:
Peak Demand, (GPM) 75
(See Exhibit A, 7.1)
75 (See Exhibit B, 7.1)
75 (See Exhibit C)
Annual Consumption, (million gallons/year)
3.01 (See Exhibit A,
7.2)
3.01 (See Exhibit B, 7.2)
3.01 (See Exhibit C)
Natural Gas:
Peak Demand, (CCF/hour) 5
(See Exhibit A, 8.1)
4 (See Exhibit B, 8.1)
4 (See Exhibit C)
Annual Consumption, (CCF/year) 2,500
(See Exhibit A, 8.2)
2,000 (See Exhibit B, 8.2)
2,000 (See Exhibit C)
Storm Drainage system:
Design Storm Peak Volume, (GPM) 286
(See Exhibit A, 9.1)
302 (See Exhibit B, 9.1)
302 (See Exhibit C)

Page 9
ENERGY IMPACT STATEMENT SAMPLE EXHIBIT A - SCHEMATIC DESIGN PHASE CALCULATIONS
In accordance with the Design Phase Deliverables; at the Schematic Design Phase, complete the following items which contribute to the development of the Energy Impact Statement:
Reviewed energy code requirements. Typical building elevations with window placement . Roof layout. Typical floor plans with identified area uses and resulting area square footage. Identified all needed HVAC systems with one-line flow diagrams. Conceptual plumbing and piping layout. Electric one-line diagrams based on conceptual electric requirements.
Item No.
Building Energy Summary Descriptions & Calculations
1.1 Project Affected Gross Area, (GSF)
40,000 Sq. Ft. per Schematic Design Phase Space Programming.
1.2 Annual Building Energy Consumption, (MMBTU/year)
All Energy Input Converted to MMBTU/year Electric = 2,730.4 MMBTU/year [See Item 2.2] Low Pressure Steam = 11,301.0 MMBTU/year [See Item 3.3] 60 PSI Steam = 236.4 MMBTU/year [See Item 4.3] Natural Gas = 250.0 MMBTU/year [See Item 8.2] Total All Sources = 14,519 MMBTU/year
1.3 Annual Building Energy Consumption per Sq. Ft., (kBTU/year/GSF)
14,519 MMBTU/year / 40,000 SF = 363 kBtu/year/SF
Item No.
Electrical Descriptions & Calculations
2.1 Maximum Demand, (kW)
Assume: Lighting @ 2 Watts/SF Misc. Electric @ 5 Watts/SF HVAC @ 5 Watts/SF Results in 480 kW Peak Summer Load
2.2 Annual Consumption, (MWH/year)
Assume Annual consumption @ 20 kWH/year per SF. 20 kWH/year per SF X 40,000 SF = 800,000 kWH/year.
2.3 Lighting Breakout value not required for this item in Schematic Phase.
2.4 Miscellaneous Power Breakout value not required for this item in Schematic Phase.
2.5 HVAC Equipment Breakout value not required for this item in Schematic Phase.

Page 10
Item No.
Low Pressure Steam Descriptions & Calculations
3.1 Summer Peak Load, (lbs/hr) Cooling load assumed to be 125 SF/ton @ 40,000 SF = 320 tons/hr. Steam consumption for absorption chillers is approximately 20 lb/hr at 9 psi. Therefore, 320 tons X 20 lbs/hr = 6,400 lbs/hr.
3.2 Winter Peak Load, (lbs/hr) Heating load assumed to be 45 Btu/SF X 40,000 SF Gross Floor Area /1160 BTU per lb @ 9 psi = 1,552 lbs/hr.
3.3 Annual Consumption, (MLB/yr)
Cooling Consumption = 320,000 ton-hours/year [see Chilled Water, Item 4.3] X 20 lb-hour / 1000 lbs per MLB = 6,400 MLB/year. Heating Consumption = Using Heating Degree Day Method: (((1,552 lbs/hr peak load / (-10 oF - 72 oF)) X 6,258 Heating Degree Days [from ASHRAE 1984 Fundamentals, pg 24.25] X 24) / 1000 lbs per MLB = 2,843 MLB/year. Humidification + Domestic Water Re-Heating + Miscellaneous Steam Loads is assumed to be 500 MLB/year. Total Annual Consumption = Cooling + Heating + Miscellaneous = 6,400 + 2843 + 500 = 9,743 MLB/year.
3.4 Heating Breakout value not required for this item in Schematic Phase.
3.5 Humidification Breakout value not required for this item in Schematic Phase.
3.6 Air Conditioning Breakout value not required for this item in Schematic Phase.
3.7 Domestic Water Heating Breakout value not required for this item in Schematic Phase.
3.8 Process Breakout value not required for this item in Schematic Phase.
Item No.
60 PSI Steam Descriptions & Calculations
4.1 Summer Peak Load, (lbs/hr) Four Autoclaves: Assume 4 X 100 lbs/hour of 60 PSI steam required = 400 lbs/hour.
4.2 Winter Peak Load, (lbs/hr) Same as Summer Peak Load = 400 lb/hr.
4.3 Annual Consumption, (MLB/yr)
Four Autoclaves: Assume 4 X 100 lbs/hour of 60 PSI steam required / 1000 lbs/hour per MLB/hr X 2 cycles/day X 250 days/yr = 200 MLB/year

Page 11
Item No.
Chilled Water Descriptions & Calculations
5.1 Summer Peak Load, (tons) Cooling load assumed to be 125 SF/ton @ 40,000 SF = 320 tons.
5.2 Winter Peak Load, (tons)
Assume winter peak load for computer server rooms and miscellaneous year-round cooling needs at 100 tons.
5.3 Annual Consumption, (ton-hours/year)
Using Equivalent Full Load Hours Method: 320 tons peak load X 1000 hours equivalent full load operation [from ASHRAE 1984 Fundamentals, pg 28.5] = 320,000 ton-hours/year. Using Cooling Degree Day Method: (320 tons peak load/92 oF - 72 oF) X 687Cooling Degree Days [from ASHRAE 1984 Fundamentals, pg 28.6] X 24 = 219,840 ton-hours/year. Conclusion: Use 320,000 ton-hours/year. Note: winter cooling load is handled by winterized cooling towers via free cooling system.

Page 12
Item No.
Domestic Cold Water Descriptions & Calculations
6.1 Peak Demand, (GPM)
Based on a review of the International Building Code, 2000 and International Plumbing Code, 2000 to determine maximum building occupancy levels and resulting minimum number of plumbing facilities, as well as a review of similar building types on campus, it was determined that the domestic cold water peak demand be based on 750 fixture units. From Table E102 of the International Plumbing Code, 2000, the resulting domestic cold water peak demand is 177 GPM. Additionally the cooling tower has an estimated peak domestic cold water demand of 23 GPM [Calculated using “Marley Cooling Tower Fundamentals”]. Total DCW Peak Demand = 177 + 23 = 200 GPM.
6.2 Peak Sanitary Demand, (GPM)
Peak Sanitary Demand = Domestic Cold Water Demand [Item 5.1] + Domestic Hot Water Demand [Item 6.1] – Cooling Tower Make-up [Item 5.1] = 177 + 77 – 23 = 231 GPM.
6.3 Annual Consumption, (gallons/year):
Occupied DCW: 177 GPM X 25% Diversity X 2,000 hours/year = 5.31 million gallons/year. Unoccupied DCW: 177 GPM X 2.5% Diversity X 6,760 hours/year = 1.80 million gallons/year. Cooling Tower Make-up: 23 GPM X 20% Diversity X 8,760 hours/year = 2.42 million gallons/year. Total = 5.31 + 1.80 + 2.42 = 9.53 million gallons/year.
6.4 Sanitary Sewer Breakout value not required for this item in Schematic Phase.
6.5 Cooling Tower Evaporation + Drift
Breakout value not required for this item in Schematic Phase.
6.6 Cooling Tower Blowdown
Breakout value not required for this item in Schematic Phase.

Page 13
Item No.
Domestic Hot Water Descriptions & Calculations
7.1 Peak Demand, (GPM)
Based on a review of the International Building Code, 2000 and International Plumbing Code, 2000 to determine maximum building occupancy levels and resulting minimum number of plumbing facilities, as well as a review of similar building types on campus, it was determined that the domestic hot water peak demand be based on 250 fixture units. From Table E102 of the International Plumbing Code, 2000, the resulting domestic hot water peak demand is 75 GPM.
7.2 Annual Consumption, (million gallons/year):
Occupied: 75 GPM X 25% Diversity X 2,000 hours/year = 2.25 million gallons/year. Unoccupied: 75 GPM X 2.5% Diversity X 6,760 hours/year = 0.76 million gallons/year. Total = 2.25 + 0.76 = 3.01 million gallons/year.
Item No.
Natural Gas Descriptions & Calculations
8.1 Peak Demand, (CCF/hour)
Two Gas Fired Unit Heaters in Loading Dock: Assume 2 X 250,000 BTU/hr = 500,000 BTU/hr / 100,000 BTU/CCF = 5 CCF/hour.
8.2 Annual Consumption, (CCF/year):
Two Gas Fired Unit Heaters in Loading Dock: Assume 2 X 250,000 BTU/hr X 2000 hours/year operation x 25% diversity / 100,000 BTU/CCF = 2,500 CCF/year.
Item No.
Storm Drainage System Descriptions & Calculations
9.1 Design Peak Storm Volume, (GPM)
From 2000 International Plumbing Code, Section 1106: Assume roof area of 10,000 sf @ 2.75 inches/hr (100 year rainfall) = 286 GPM.

Page 14
ENERGY IMPACT STATEMENT SAMPLE EXHIBIT B - DESIGN DEVELOPMENT PHASE CALCULATIONS
In accordance with the Design Phase Deliverables; at the Design Development Phase, complete the following items (in addition to those completed during the Schematic Design Phase) which contribute to the further refinement of the Energy Impact Statement:
All building elevations with window placement and wall sections . Roof and drainage plan. All floor plans with identified area uses and resulting area square footage. Design criteria for each mechanical system. Equipment schedules for major mechanical items. Overall building airflow diagram. Conceptual control diagrams for all mechanical and plumbing systems. Preliminary calculations for HVAC systems. Design criteria for each plumbing system, including set points, etc. One-line diagrams for all plumbing systems. Plumbing and piping plans. Typical lighting plans. Lighting fixture schedule. Review of lighting energy code requirements. Normal power riser diagram. Power panel schedules. Electric load estimates.
Item No.
Building Energy Summary Descriptions & Calculations
1.1 Project Affected Gross Area, (GSF)
40,000 GSF per Design Development Phase Space Programming.
1.2 Annual Building Energy Consumption, (MMBTU/year)
All Energy Input Converted to MMBTU/year Electric = 2,684 MMBTU/year [See Item 2.2] Low Pressure Steam = 9,749 MMBTU/year [See Item 3.3] 60 PSI Steam = 148 MMBTU/year [See Item 4.3] Natural Gas = 200 MMBTU/year [See Item 8.2] Total All Sources = 12,781 MMBTU/year
1.3 Annual Building Energy Consumption per GSF, (kBTU/year/GSF)
12,781 MBTU/year / 40,000 GSF = 319.5 kBtu/year/GSF

Page 15
Item No.
Electrical Descriptions & Calculations
2.1 Maximum Demand, (kW)
Data from Design Development Phase lighting and power panel schedules was input into a computer simulation program. See Table B.1, “Billing Details – Electric” for maximum electric demand. The maximum electric demand of 474 kW occurs in June.
2.2 Annual Consumption, (MWH/year)
Data from Design Development Phase lighting and power panel schedules was input into a computer simulation program. See Table B.1, “Billing Details – Electric” for annual electric consumption. The annual electric consumption for all components is 786,545 kWH.
2.3 Lighting
For electrical consumption by component, see Table B.2, “Energy Budget by System Component”. This table shows electrical energy as kBTUs. The estimated annual electrical consumption for lighting is listed under “Site Energy” as 1,181,170 kBTU per year. This converts to 346,080 kWH per year.
2.4 Miscellaneous Power
For electrical consumption by component, see Table B.2, “Energy Budget by System Component”. This table shows electrical energy as kBTUs. The estimated annual electrical consumption for miscellaneous power is listed under “Site Energy” as 724,809. This converts to 212,367 kWH per year.
2.5 HVAC Equipment
For electrical consumption by component, see Table B.2, “Energy Budget by System Component”. This table shows electrical energy as kBTUs. The estimated annual electrical consumption for HVAC is listed under “Site Energy” as the sum of the air system fans, pumps and cooling towers, or 536,896 + 53,690 + 187,913 = 778,499. This sum converts to 228,098 kWH per year.

Page 16
Item No.
Low Pressure Steam Descriptions & Calculations
3.1 Summer Peak Load, (lbs/hr)
Data from Design Development Phase was input into a computer simulation program to determine the estimated summer peak steam demand. See Table B.3, “Hourly Simulation – Summer Chiller Plant” for details. The peak summer steam demand includes steam for the absorption chiller. The peak summer steam demand of 6,080 lbs/hr occurs at 4:00 pm on July 22.
3.2 Winter Peak Load, (lbs/hr)
Data from Design Development Phase was input into a computer simulation program to determine the estimated winter peak steam demand. See Table B.5, “Hourly Simulation – Heating Plant” for details. The peak winter steam demand includes all heating loads plus humidification loads. The peak winter steam demand of 1,628 MBH or 1,403 lbs/hr occurs at 7:00 am on January 15.
3.3 Annual Consumption, (MLB/yr)
Total Annual Consumption = Heating [Item 3.4] + Humidification [Item 3.5] + Air Conditioning [Item 3.6] + Domestic Water Reheating [Item 3.7] = 2,436 + 8.94 + 5,957 +2 = 8,404 MLB/year.
3.4 Heating
For steam consumption by component, see Table B.2, “Energy Budget by System Component”. This table shows steam energy as kBTUs. The estimated annual steam consumption for heating is listed under “Site Energy” as 2,825,760. This converts to 2,436 MLB per year.
3.5 Humidification
For steam consumption by component, see Table B.2, “Energy Budget by System Component”. This table shows steam energy as kBTUs. The estimated annual steam consumption for humidification is listed under “Site Energy” as 107,228. This converts to 8.94 MLB per year.
3.6 Air Conditioning
For steam consumption by component, see Table B.2, “Energy Budget by System Component”. This table shows steam energy as kBTUs. The estimated annual steam consumption for air conditioning (steam absorption) is listed under “Site Energy” as 6,910,259. This converts to 5,957 MLB per year.
3.7 Domestic Water Heating
Domestic hot water is supplied from the Central Power Plant. Supplemental reheating of the domestic hot water is done with Plant steam to maintain the discharge water temperature set point. The annual consumption is estimated at 2 MLB per year.
3.8 Process None required for this building
Item No.
60 PSI Steam Descriptions & Calculations
4.1 Summer Peak Load, (lbs/hr)
During the Design Development Phase two autoclaves were eliminated. From the equipment schedules, the two remaining autoclaves require 125 lbs/hour. 2 X 125 lbs/hour of 60 PSI steam required = 250 lbs/hour.
4.2 Winter Peak Load, (lbs/hr) Same as Summer Peak Load = 250 lbs/hr.
4.3 Annual Consumption, (MLB/yr)
Assume 2 X 125 lbs/hour of 60 PSI steam required / 1000 lbs/hour per MLB/hr X 2 cycles/day X 250 days/yr = 125 MLB/year

Page 17
Item No.
Chilled Water Descriptions & Calculations
5.1 Summer Peak Load, (tons)
Data from Design Development Phase was input into a computer simulation program to determine the estimated peak chilled water demand. See Table B.3, “Hourly Simulation – Summer Chiller Plant ” for details. The peak summer chilled water demand of 3,648 MBH or 304 tons occurs at 4:00 pm on July 22.
5.2 Winter Peak Load, (tons)
Data from Design Development Phase was input into a computer simulation program to determine the estimated peak chilled water demand. See Table B.4, “Hourly Simulation – Winter Chiller Plant” for details. Winter free cooling operation (absorption chillers off) is assumed to occur between October and April. The peak winter chilled water demand of 984 MBH or 82 tons occurs at 2:00 pm on April 28.
5.3 Annual Consumption, (ton-hours/year)
Data from Design Development Phase was input into a computer simulation program to determine the annual chilled water consumption. See Table B.2, “Energy Budget by System Component” for details. The estimated annual chilled water consumption is listed under “Site Energy” as 3,574,272 kBTU. This converts to 297,856 ton-hours per year. Note: winter cooling load is handled by winterized cooling towers via free cooling system.

Page 18
Item No.
Domestic Cold Water Descriptions & Calculations
6.1 Peak Demand, (GPM)
Based on a review of the International Building Code, 2000 and International Plumbing Code, 2000 to determine maximum building occupancy levels and resulting minimum number of plumbing facilities, as well as a review of similar building types on campus, it was determined that the domestic cold water peak demand be based on 750 fixture units. From Table E102 of the International Plumbing Code, 2000, the resulting domestic cold water peak demand is 177 GPM. Additionally the cooling tower has an estimated peak domestic cold water demand of 23 GPM [Calculated using “Marley Cooling Tower Fundamentals”]. Total DCW Peak Demand = 177 + 23 = 200 GPM.
6.2 Peak Sanitary Demand, (GPM)
Peak Sanitary Demand = Domestic Cold Water Demand [Item 5.1] + Domestic Hot Water Demand [Item 6.1] – Cooling Tower Make-up [Item 5.1] = 177 + 77 – 23 = 231 GPM.
6.3 Annual Consumption, (million gallons/year):
Occupied DCW: 177 GPM X 25% Diversity X 2,000 hours/year = 5.31 million gallons/year. Unoccupied DCW: 177 GPM X 2.5% Diversity X 6,760 hours/year = 1.80 million gallons/year. Cooling Tower Make-up: 23 GPM X 20% Diversity X 8,760 hours/year = 2.42 million gallons/year. Total = 5.31 + 1.80 + 2.42 = 9.53 million gallons/year.
6.4 Annual Sanitary Sewer, (million gallons/year)
Annual sanitary sewer volume is estimated as: The sum of the annual domestic cold water (DCW) consumption + annual domestic hot water (DHW) consumption + annual cooling tower blowdown. Occupied DCW = 5.31 million gallons/year. [Item 6.3] Unoccupied DCW = 1.80 million gallons/year. [Item 6.3] Occupied DHW = 2.25 million gallons/year. [Item 7.2] Unoccupied DHW = 0.76 million gallons/year. [Item 7.2] Cooling Tower Blowdown = 0.37 million gallons/year. [Item 6.6] Total = 5.31 + 1.80 + 2.25 + 1.80 + 0.37 = 11.53 million gallons/year.
6.5 Cooling Tower Evaporation + Drift, (million gallons/year):
Peak cooling tower evaporation is calculated using “Marley Cooling Tower Fundamentals” as: E=R/10/100 X Circulation Water Volume Where: E=Evaporation, GPM R=Tower temperature range. In this case 100 F – 85 F = 15 F. Circulation water volume is 4 GPM per ton of absorption chilling or 4 GPM X 320 Tons = 1,280 gallons of circulating water. E=15/10/100 X 1,280 = 18.1 GPM Peak cooling tower drift is calculated as: D=0.1% X Circulation Water Volume D=0.1% X 1,280 = 1.3 GPM

Page 19
Annual cooling tower evaporation + drift is estimated as: (18.1 GPM + 1.3 GPM) X 20% Diversity X 8,760 hours/year = 2.04 million gallons/year. Note: This water volume is not included in the sanitary sewer calculation as it does not go to the sanitary sewer.
6.7 Cooling Tower Blowdown, (million gallons/year):
Peak cooling tower blowdown is calculated using “Marley Cooling Tower Fundamentals” as: B=(((R/10) / (CC-1)) – 0.1) /100) X Circulating Water Volume Where: B=Blowdown, GPM R=Tower temperature range. In this case 100 F – 85 F = 15 F. CC=Concentration cycles. In this case 5 cycles is assumed. Circulation water volume is 4 GPM per ton of absorption chilling or 4 GPM X 320 Tons = 1,280 gallons of circulating water. B=((15/10) / (5-1)/100) X 1,280 = 3.5 GPM Annual cooling tower blowdown is estimated as: 3.5 GPM X 20% Diversity X 8,760 hours/year = 0.37 million gallons/year. Note: This water volume is included in the sanitary sewer calculation as it does go to the sanitary sewer.
Item No.
Domestic Hot Water Descriptions & Calculations
7.1 Peak Demand, (GPM)
Based on a review of the International Building Code, 2000 and International Plumbing Code, 2000 to determine maximum building occupancy levels and resulting minimum number of plumbing facilities, as well as a review of similar building types on campus, it was determined that the domestic hot water peak demand be based on 250 fixture units. From Table E102 of the International Plumbing Code, 2000, the resulting domestic hot water peak demand is 75 GPM.
7.2 Annual Consumption, (million gallons/year):
Occupied: 75 GPM X 25% Diversity X 2,000 hours/year = 2.25 million gallons/year. Unoccupied: 75 GPM X 2.5% Diversity X 6,760 hours/year = 0.76 million gallons/year. Total = 2.25 + 0.76 = 3.01 million gallons/year.
Page 20
Item No.
Natural Gas Descriptions & Calculations
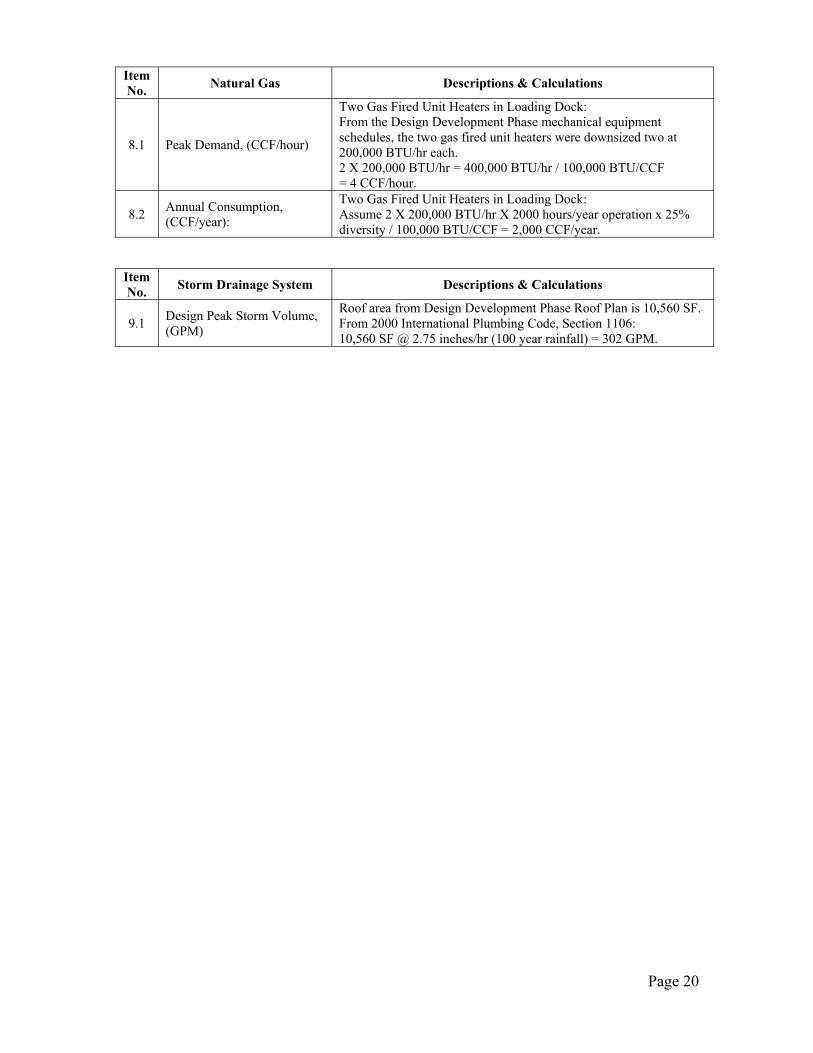
8.1 Peak Demand, (CCF/hour)
Two Gas Fired Unit Heaters in Loading Dock: From the Design Development Phase mechanical equipment schedules, the two gas fired unit heaters were downsized two at 200,000 BTU/hr each. 2 X 200,000 BTU/hr = 400,000 BTU/hr / 100,000 BTU/CCF = 4 CCF/hour.
8.2 Annual Consumption, (CCF/year):
Two Gas Fired Unit Heaters in Loading Dock: Assume 2 X 200,000 BTU/hr X 2000 hours/year operation x 25% diversity / 100,000 BTU/CCF = 2,000 CCF/year.
Item No.
Storm Drainage System Descriptions & Calculations
9.1 Design Peak Storm Volume, (GPM)
Roof area from Design Development Phase Roof Plan is 10,560 SF. From 2000 International Plumbing Code, Section 1106: 10,560 SF @ 2.75 inches/hr (100 year rainfall) = 302 GPM.

Page 21
ENERGY IMPACT STATEMENT SAMPLE EXHIBIT C - CONSTRUCTION DOCUMENT PHASE CALCULATIONS
In accordance with the Design Phase Deliverables; at the Construction Document Phase, complete the following items (in addition to those completed during the Design Development Phase) which contribute to the further refinement of the Energy Impact Statement:
Complete specification. One-line diagrams for all mechanical systems. Duct layout and air flow volumes for each space. Detailed control drawings with sequences of operation. All design calculations. Lighting plans for all areas. Electrical power load summary. Electrical panel schedules.
Because the majority of the information needed for accurate estimates in the Energy Impact Statement is available in the Design Development Phase, most projects will require very little modification of the Energy Impact Statement in moving to the Construction Document Phase. Also, there is no change in the methodology used to determine estimates in moving from the Design Development Phase to the Construction Document Phase. For these reasons, it is assumed that (for this example) there is no change in the Energy Impact Statement. Estimates shown in the Design Development Phase column of the Energy Impact Statement are repeated in the Construction Document Phase column. It is not unusual for projects to change significantly in moving from Design Development Phase to Construction Document Phase (usually due to budget constraints). In these cases there may be significant changes to the Energy Impact Statement which the Design Professional will be expected to document.