Embed Size (px)
Citation preview

AUTHORTITLEINSTITUTION
DOCUMENT RESUME /
32 TM 004 850
Clark, Sara H.Mobile Learning Centers of Minneapolis 1972-73.Minneapolis Public Schools, Minn. Dept. of Researchand Evaluation.
SPON5 AGENCY Bureau of School Systems (DREW /OE), Washington, D:C., Div. of Education for the Disadvantaged.; Minnesota
State Dept. of Education, St. Paul.REPORT NO C-72-58PU.B DATE Feb 74 ,
NOTE 25p.; For a related document, see ED 083 261
EDRS PRICE MF-$0.76 HC-$1.58 Plus Postage'DESCRIPTORS Achievement Gains; Compensatory Education Programs;
*Disadvantaged Youth; High School Students; *MobileEducational Services; Programed Instruction; ProgramEvaluation; Reading Improvement; *Remedial ReadingPrograms; *Secondary Education; Student Attitudes;*Teaching Machines .
IDENTIFIERS *Elementary' Secondary Edfication Act Title I; ESEA. Title I; Minnesota (Minneapolis)
ABSTRACT s
Self- teaching laachines housed in trailer-classroomswere.used for the third year to help 331 students in two MinneapolisTitle I secondary schools improve their reading skills. A gain of onemonth or more in grade equivalents (using Gates-MacGinitie tests) foreach month of attendance at the centers by at least 50 percent of thestudents was the specific objective of the project. In 1972-73 theprogram again more than achieved its goal. Test results showed that85 percent of the 218,students with gain scores made grade equivalentgains in comprehension-Vrl&ter than gains expected for length of4nrollement in the program. The median grade equivalent gain was +1.6although the students had been on roll for less than half the schoolyear. The project featured the use of TV-like teaching machines andeducational materials developed by Dorsett Educational Systems.Machines were housed in tvo large trailers which were located atBryant and North secondary schools. Although students operated themachines and tested their own progress at the end of each lesson,assistance was available from the certified reading teacher andparaprofessional who staffed each trailer. Financial support for thisproject came from Title I, ESEA. SeVeral recommendations, includingcontinuation of the project, were made. (Author)
************************************************************************ Documents acquired by ERIC include many informal unpublished *
* materials not available from other sources. ERIC makes every effort *.* to obtain the best copy available. nevertheless, items of marginal *
* reproducibility are often encountered and this affects the quality ** of the microfiche and hardcopy reproductions ERIC makes available *
* via the ERIC Document Reproduction Service (EDRS). EDRS is not *
* responsible for the quality of the original document. Reproductions ** supplied by EDRS are the best that can be made from the original. ************************************************************************

N
U S DEPARTMENT OP HEALTH.EDUCATION &WELFARENATIONAL INSTITUTE OF
EDUCATIONTHIS DOCUMENT HAS BEEN REPRODUCE D EXACTLY AS RECEIVED FROMTHE PERSON OR ORGANIZATION ORIGINATING IT POINTS OF VIEW OR OPINIONSSTATED 00 NOT NECESSARILY REPRESENT OFFICIAL NATIONAL INSTITUTE OFEDUCATION POSITION OR POLICY
10.00
MinneapOiis Public Schools
Mobile Learning Centersof Minneapolis
1972-73,
A Title I, ESEA Project
Sara H. Clark, Title I Evaluator
Ideas expressed in this report do not necessarilyreflect the official position of the MinneapolisPublic School Administration nor the MinneapolisSchool Board.
February 1974mkt C -72 -58
2
4
Research and Evaluation-DepartmentPlanning and Support Services Division807 N.E. BroadwayMinneapolis, Minnesota 55413
0-*
Minneapolis Public Schools
Mobile Learning Centers of Minneapolis1972-73
Summary
See Page
Se4-teaching machines housed in trailer-classrooms wereused for the third year to help 331 students in two MinneapolisTitle I secondary schools improve their reading skills.
A gaih.of one month or more in grade equivalents (usingGates-MacGinitie tests) for each month of attendance at theCenters by at least 50% of the students was the specific objec-tive of the project.
In 1972-73 the program again more than achieved its goal.Test results.showed that 85% of the 218 students with gain scoresmade grade equivalent gains in comprehension greater than gainsexpected for length of enrollment in the program. The mediangrade equivalent gain was +1.6 although the students had been onroll for less than half the school year.
1,.
The project featured the use of TV-like teaching machines andeducational materials deirelopird by Dorsett Educational Systems.Machines Were housed in two large trailers which were locatpd atBryant and North secondary schools.
Although students operated the machines and tested their ownprogress at the end of each lesson, assistance was available fromthe certified reading teacher and paraprofessional who staffed eachtrailer.
Financial support for this project came from Title I, ESEA.
Several recommendations, including continuation of the project,were made.
February 1974
7
3.4
8
11
12
20
0 Research and Evaluation Department
40'
M
Table of Contentsby
City of Minneapolis 1
The Minneapolis Schools 3
Historical Background 6
Objectives 7
Locations of the Mobile Learning Centers 7
Project Operations 8
Participants 9
Personnel 11
Parent and Community Involvement 11
Planning and Training 11
Budget 12
Tests Used 12
Evaluation Group Definition 12
Results 14
Attitudes Toward Reading 15
Discussion 19
Recommendations 20
I\
4.

List of Tables
Table . Page
1. Enrollment in MObi/e Learning Centers bySchool and Grade, 1972-73 10
2: 'Evaluation Group and Incomplete Test DataGroup Descriptive Data by Schools 13
3. Grade Equivalent Gains' Distribution, Gates-MacGinitie Beading Test, Comprehension,Bryant and North, 1972-73 16
4.. Grade Equivalent Gains Distribution, Gates -MacGinitie Reading Test, Comprehension,Form D2M, Bryant, 1972 -'?3
5. Grade Equivalent Gains Distribution, Gates-MacGinitie Reading Test, Comprehension,
. Form E2, North High, 1972-73
iv
17
18
P 13
The City of Minneapolis
The program described in this report was conduOted in the Ninneitpolis
Public Schools. Minneapolis is a city of 434,40o people located on the
Mississippi River in the southeastern part of Minnesota. With its some-
what Smaller twin city, St. Paul, it is the center of a seven-county
metropolitan area of over' 1,874,000, the largest population center between
Chicago and'the Pacific Coast. s such it serves as the hub for the entire
Upper Midwest region of the country.
The city, and its surrounding area, long has been noted for the high
quality of its labor force. The unemployment rate in Minneapolis is lower
than in other major cities, possibly due to the variety and density of
industry in the city as well as to rthe high level capability of its work
force. The Twin City metropolitan area unemployment rate in June of 1973
was 3.3%, compared with a 4.8% national rate for the same month. As the
economic center of a prosperous region rich in such natural resources as
forests, minerals, water power and productive agricultural land, Minneapolis
attracts commerce and workers from throughout the Upper Midwest region. Many
residents are drawn from th0 neighboring states of Iowa, Wisconsin, Nebraska
and the Dakotas as well as from the farming areas and the Iron Range region
of outstate Minnesota.
More Mindeapolitans (32%) work in clerical and sales jobs than in any
other occupation, reflecting the city's position as a major wholesale-retail
center and a center for banking, finance and insurance. Almost as many (2)
are employed as craftsmen, foremen and Operatives, and 23% of the work force
are professionals, technicians, managers, and officials. One out of five
workers is employed in laboring.and service. occupations,
Minneapolis city government is the council-dominated type. Its mayor,
elected for a two year term, has limited powers. Its elected city council
operates by committe%and engages in administrative as well as legislative
action.
Minneapolis is not a crowded city. While increasing industrial development
has occupied more and more land, the city's population has declined steadily
from a peak of 522,000 in 1950. The city limits have not been changed since
1927. Most homes are sturdy, single family dwellings built to withstand
severe winters. Row homes are practically non-existant even in low income
areas. In 1970, 48% of the housing units in Minneapolis were owner-occupied.
Most Minneapolitans are native born Americans, but about 35,000 (7%)
are foreign born. Simdes, Norwegians, Ge;mans, and Canadians comprise
most of the foreign born population.
Relatively few non-white citizens live in Minneapolis although their
numbers are increasing. In 1960 only three percent of the population was
non - white. The 1970 census figures indicate that the non-white population
hhd more than doubled (6.4%) in the intervening 10 years. About 70% of
the non-whites Ore black. Most of the remaining non-white population is
American Indian, mainly Chippewa and Sioux. Only a small number of resi-
dents from Spariish-surnamed or Oriental origins live in the city. In 1970
non-white residents made up 6.4% of the city'S population but accounted for
15% of the children in the city's elementary schools.
Minneapolis has not reached the stage of many other large cities in
terms of the level of social problems. has been relatively untouched
by racial disorders or by student unrest.-- Crime rates are below national
av'erages.
One's first impression is that Minneapolis doesn't really have serious
problems of blight and decay. But the signs of trouble are evident to one
who looks beyond the parks and lakes and tree-lined:streets. As with many
other larger cities, the problems are focused in the core city and are related
to increasing concentrations there of. the poor, many of them non-whites, and
of the elderly. For example, nine out of 10 black Americans in Minneapolis
live in just one-tenth of the city's area. While Minneapolis contains 1i
of the state's population, it supports 28% of the state's AFDC families.
There has been a steady migration to the city by ARerican Indians from
the reservations and by poor whites from the small towns and rural areas of
Minnesota. They come to the "promised land" of Minneapolis looking for a
job and a better way of life. Some make it; many do not. The American Indian
population is generally confined to the same small geographic areas in which
black AmeriOns live. These same areas of the city have the lowest median
incomes in the city and the highest concentrations of dilapidated hoUsing,
welfare cases, and juvenile delinquency.
The elderly also are concentrated in the central city. In 1970, 15%
of the city's population was over age 65. The elderly, like the 18 to 24 year.
old young adults, live near the central city becatise of the availability of
lenn expensive housing in multiple-uniC dwellings. Younger families have
continued to migrate toward the outer edges of the city and to the surrounding
suburban areas.
2
The Minneapolis Schools
About 69,477 children go to school in Minneapolis. Most of that, about
61,052, attend one of the city's 98 public schools; 8,425 attend parochial
or private schools.
The Minneapolis Public Schools, headed by Dr. John B. Davis, Jr., who
became superintendent in 1967, consists of 67 elementary schools (kindergarten -
6th grade), 15 junior high schools (grades 7-9), nine high schools (grades
10-12), two junior-senior high schools, and five special schools. Nearly
3,500 certificated personnel are employed.
Control of the public school system ultimately rests with a seven-member
'board which levies its own taxes and sells its own bonds. These non-salaried
officials are elected by popular votes for staggered six-year terms. The
superintendent is selected by the board and serves as its executive officer
and,. professional adViser.
Almost 40 cents of each local property tax dollar goes to support a
school system whose annual operating general fund budget in 1973-74 is
$81,038,330 up from $78,992,236 in 1972-73. Minneapolis received federal
funds totaling 11.8 million dollars ip 1972-73 from many different federal aid
programs. The Elementary and Secondary Education Act provided about 6.5
million dollars, bf which 3.4 million dollars were from Title I funds. The
adjusted 'maintenance cost per pupil unit in the system was $981 in 197 72
while the'range of per pupil unit costs in the state for districts /intaining
elementary and secondary schools was from $563 to $1,324.
One of the superintendent's goals has been to achieve grea er communication
among the system's schools through decentralization. Initially, two "pyramids"
or groups of geographically related schools were formed. First to be formed,
in 1967, was the North Pyramid, consisting of North High School and the elementary
and junior high'schools which feed into it. In 1969 the South-Central Pyramid
was formed around South and Central High Schools., Each pyramid had an area
assistant superintendent as well as advisory groups of principals, teachers,
and parents.' The goals of the pyramid structure were to effect greater
communication among schools and between schools and the community, to develop
collaborative and cooperative programs, and to share particular facilities
and competencies of teachers.
In the 'summer of 1973 decentralization was carried one step further when
the entire school district, with the exception of five schools involved in an
experimental program called Southeast Alternatives, was divided into three areas.
3

Eachof these areas -- East, West and North -- is headed by a superintendent'
wbo has autonomous decision-making power within the guidelines of school
district policies and philosophies.
Based on sjght counts on October 17, 1972 the percentage of black American
pupils for the school district was 10.6%. Eight years before, the proportion
was'5.4%. Ailerican Indian children currently comprise 3.8% of the school
population, more than double the proportion of eight years ago. The proportion
of minority children in the various elementary schools generally reflects the
prevailing housing pattern found in'each school area. Although some non-white
pupils are enrolled in every elementary school, non-white pupils are concentrated
in two relatively small areas of the.city. Of the 67 eleigntary schools, 11
have more than 30% non-white enrollment and four of these have over 50%. There
are no all-black nor all-white schools. Twenty-three elementary schools have
non-white enrollments of less than 5%.
The Minneapolis School Board has approved a desegregation plan involving
busing which has operated smoothly since taking effect in September 1973.
The proportion of school age children in AFDC homes has more than doubled
from approximately 12% in 1962 to 28% in 1972.
While the median pupil turnover rate for all the'city schools in 1971-72
was about 24.5%, this figure varied widely according to location (turnover rate
is the percentage'of students that comes new to the school or leaves the school
at some time during the school year, using the September enrollment as a base
figure). Target Area schools generally experience a much higher turnover
rate; in fact only four of the Target Area schools had 'turnover rates less than
the city median. Compared with the city, the median for the Target Area schools
was 36.1%.
The Target Area
The Target Area is a portion of the core city of Minneapolis where the
schools are eligible to receive benefits from programs funded under Title I
of the Elementary and Secondary Education Act (ESEA). A school is eligible to
receive Title I aid if the percentage of families residing in that school's
district which receives AFDC payments (in excess of $2,000 a year) -- or has an
annual income under $2,000 -- exceeds the citywide percentage for families in
those categories.
In 1972-73, nearly 26,871 children attended the 25 elementary schools,
five junior highs, three senior highs and seven parochial schools that were
eligible to receive this aid. One-third of these students were from minority
groups and one-third were defined by the State Department of Education as

educationally disadvantaged, i.e. one or more grade levels behind in basic
skills such as reading and arithmetic. Federal programs are concentrated
on the educationally disadvantaged group.
According to 1970 census data, over 170,000 persons resided in the Target
Area. Of that group, li percent were black and percent were Indian, more
than double the citywide percentage of minority group members. Over half
of the Target Area residents over 25 years Old had not completed high school,
compared to the 35 percent of the non Target Area residents who did not have
high school diplomas. One out of five Target Area residents over thee age of
25 had gone to college, and nine percent had completed four or more years.
One out of four of the non-Target Area residents had gone to college, and
15 percent had completed four or more years. 4
Thl income for an averazTprget Area family was $9,113 in 1970, about
$2,000 .less than the citywide average. The homes they lived in had an
average value of $10,385, over.40 percent less than the average value of a
single family residence in Minneapolis. One out of five Target Area children
between the ages of 6 and 17 was a member of a family that was below the
poverty level, while only 6 percent of the non-Target Area children had such
a family. status.
5

Historical gookground
The school year of 1972-73 was the third year of operation of the
Mobile Learning Centers. In 1970 the Minneapolis school system had recog-
"nized the need for an innovative approach to the reading, difficulties of a
number of secondary students in Target Area schools and had allocated f
for teaching machines. A group of teachers and administrators fly, the sys-
tem had been iliprfgsed with the programs and machines presented by the
Dorsett Educational Systems at the Aerospace Educational chnology meet-.
ings held in Washington, D.C. in January 1970. After further investigation
and discussion the Mobile Learning Centers project, incorpoiating the
Dorsett machines and programs, was initiated when funds from NDEA Title III
and ESEA Title I---as well as local finds ---became'available. Two large
trailers were bought to serve as Classrooms to provide mobility for the
project, The use of these Mobile Learning Centers was restricted to Title.
/ I schools because of the federal fundA which helped support the projpct.
The project's operations were successful in increasing the rate
progress in comprehension.and vocabulary of students who had been one
more years below grade level. In 1970-71, positive and definite gains in
vocabulary and comprehension were made by the 240 students for whom gain
scores were obtained. Their rate of progress was from two to six times
that which would have been expected based on their previous achievement.
All the students had been one or more years below grade level in reading
skills before their selection for the program Gates-Macdinitie tests
were used. In the second year of operation the program was again more
than successfly1 in reaching its goals. Eighty percent of the students
tested made grade equivalent gains in comprehension over those expected
for length of ?Astruction. Sixty-four percent made such gains on
vocabulary tests. Evaluation reports on these earlier years are available.1
1Clark, S.P. Evaluation of the Mobile Learning Centers in MinneapolisSecondary Schools, 1270-71. Minneapolis: Minneapolis Public Schools, 1972.
Clark, S.H. Mobile Learning Centers of Minneapolis, 1973-72.Minneapolis: Minneapolis Public Schools, 1973
6
Y.
Objectives
J
A
The general goal of this program was to raipe the rate of reading0"
growth of secondary students, in selected Title I schools, who- were one
or more years beloW grade levellA reading as of September-1972. Spe-
cifics117, a gain of at least one month in grade equivalents (using
Gates.,MacGinitie tests) for each month tof attendance at the Centers by
at least 50% of the students would show attainment of that objective.
This specific goal would meet state reqdirements for Title I secondary
schools. However, based on past experience it was. expected that more
than 50% of the students would, make the specified gains.
Locations of the Mobile Learning Center
Two Mobile'' Learning drenters or trailers, as th
were located in the Target Areas in 1972-73.
The South Trailell, was parked at Bryant Junior High for the entire
school year. AlthoUgh Bryant's enrollment of nearly 1000 students was
tiethe median for the city's junior high schools it rAnked far 'above the
are generally called,
city average (23%) in the percentage of students who came from homes
receiving AFDC (44%). The percentage of minority students (43%) was
also much higher than the average (16%) for the city's schools.No,
11
'The North Trailer was stationed at North High School. North High's'
enrolldedt of nearly 1500 students had 42% of its students from AFDC
homes. Its minority population (38%) Was.the highest in the ',yr for
senior high schools.. Accirdingto the 1970 census, roughly one third
of the people.in the Mort neighborhood had moved into their .present'
dwellings wfilhiA the past fifteen months; 43% of the persons under 18
were not residing with both parents and 12 of those between the ages
of 16 and 21 were neither employ nor in school.employ
Bryant and North have been Title I schools every,yea since-1965-66
when the Title I (ESEA) funds first became available.
Al ,. .
.
1
.... 1 ,... 7
12
1
0

z
. 'Project Operations
Two largelrailers, about 60-feet by 14 feet, were purchased,with
the aid of NDEA, Title III, money. Each trailer contained l Dorsett
teaching machines in ,semi-private carrels or'lopoihs. Students were as-
signed to the program for one period a day.Length of assignment varied
depending on school scheduling and the student's progress. Both trailers
were carpeted and air-conditioned. Eachtrailer had an inviting reading
corner with a lounge and'table with magazines of high interest level for
the students who attended.
Dorsett machines look something like TV sets. Lessons are projected
on screens from film stripswhich are sound synchronized with records.
Headphones are available for individual listening. The machines are simple
to operate so that students can change the records and filmstrips them-
selves. 'Pupils respond to questions in the lesson by pushing buttons
which allow either multiple or forded choice options. When the correct
response is given, the machine proceeds to the next frame in the program.
Students are also furnished with a printed version of the le6on called
a Reading Panel. The Reading Panel contains the story being presented
on the screen to which a student can refer at any time% The panel gives
the student a chance to reread the material at his own rate of speed and
it gives him another opportunity to assimilate the program before attempt-
ing to respond to questions on the machine.
At the end'of each filmstrip a progress check is given which consists
of multiple choice questions. Each check contains from five to ten ques-
tions. In this way the student's understanding of tach lesson is measured
as soon as he completes the instruction, Since the test is scored imme-p,,
diately, the teacher can either provide verbal reinforcement and encourage-
ment for good work or, if the student has scored less tllftri-811016, help him
find his errors before he repeats the lesson. If he has made only one or
two mistakes he can use the Reading' Panel to help make his corrections.4
This use of the panel incidentally gives him practice in scanning. A
score of 100% is necessary before a student can advance to another program.
8 13
"lb
The reading course includes programs in vocabulary and comprehension.
A curriculum guide provlded with the materials states that in the compre-
hension programs, .'The questions are designed to develop reading skills such
as recalling details and facts, understanding main ideas and sequence of
events, drawing conclusions, and finding and understanding key sentences and
words." Programs in this series cover first through eighth grade materials.
Vocabulary programs begin with a series which includes 800 sight words in
sentences and continues through eighth grade words. Additional units have
been added to the original course so materials are available for a whole
semester's work.
The program is flexible. Students can work at their own rate. The
average time needed to complete a lesson with 100% accuracy is about twelve
minutes so that a student can complete-up to three programs each day.
Usually a number of comprehension programs are presented first; later they
are alternated with the vocabulary programs which the student's find less
interesting. The use of the mach0.nes, with their headphones, captures the
pupils' attention to the extent that they generally ignore visitors who come
to observe the project in operation.
Although the students operate the machines themselves there have been
relatively few problems with the hardware.
C Participants
Students were selected for the program by counselors an teachers who
based their recommendations mainly on the students' city-wide reading test
scores. The pupils were either one or more years below grade level or below
the twenty-fifth percentile on Minneapolis reading norms and hence were
eligible for Title I programs. A total of 331 students were enrolled at
some time during 1972-73. The pupils came from grades 6 -9. at Bryant and
9-12 at North. About 10% of the student population at Bryant was in the
project; at NOrth 16% of the students were enrolled.

The boys (62%) outnumbered the girls (38%) at Bryant, but the sexes
were about evenly divided at North. Enrollment figures for the project, by
school and grade, are given in Table 1.
Table 1
Enrollment in Mobile Learning Centersby School and Grade
1972-73
School andGrade
School
EhrolImenta
NumberEnrolled
CenterPercent ofSchool Total
Bryant 16 84 1 1.2%7 310 -14 4.58 288 6o 20.89 5, 8
All Grades 976_22.92 77.4%
North
101 16 15.8%910 601 116 19.3
415. 70 16.9
277 35 12.6Special 81 --- ----Unknown Me 2 --_-
All Grades 14175 239 I6:2%
aInformational Services Center. Pupil 1972-73.Minneapolis: Minneapolis Public Schools, 1 2. (Sight count.taken October 17, 1972.)
10
i5
.10
Personnel
f
01.7
Each trailer was staffed at the beginning of the year with a certified
reading teacher and a paraprofessional; both of whom had received inservice
training on the use of the Dorsett materials and machines. During the second
semester the teacher at Bryant worked without an aide which caused fewer
problems than might have been expected since students had not been scheduled
f- to the full capacity of the trailer.
Although the Dorsett units are self-instructional, the teachers selected
the programs for each student according to his needs. In addition they gave
instruction and assistance to students who had difficulties with particular
lessons. The aides helped the students also and assisted 91e teacher in
scoring the progress checkswfiich the students completed after each lesson.
Keeping student records'and arranging for machine maintenance were other
responsibilities of the aides. No supplemental services were contributed
by non-staff members.
Parent and Community Involvement
Open houses were held at the trailers when similar events were spon-
sored by the PTA's at the respective schools. There was, otherwise, no
direct parent1.1 involvement in this program.
Planning and Training
Little new planning or training was needed for the 1972 -73 school year
although instruction to the staff was given concerning the implementation of
new programs which were added to the course.
11
4
Budget
This project received $49,864 from Title- I funds. This amount
covered all costs of the program. Eighty-five percent of this money
was-budgeted for salaries and fringe benefits. Since 331 students
were served at different times during the year, the average cost per
pupil was $151.
Tests Used,
Gates-MacGinitie Readihg Tests of comprehension were used for
assessing student gains. Level D, designed for gradesA-6i was used
at the junior high school and-Level B, intended for grades 7-9 was used
at the senior high school. These tests were selected because they re-
flected the actual reading levels of the students rather than their
school grade plabement.,
The tests were used each school quarter at North High. At Bryant
the scheduling was more flexible and students were tested whenever they
entered or left the program. According to the test's publisher, the
comprehension section "'Immures the student's ability to read complete
prose passages with understanding." Different forms of the tests from
those used in the city-wide testing program were administered.
Evaluation Group Definition
4*
The group on which the evaluation was based consisted of those pupils
Mfor whom both pre-16nd posttest data were available. No other criteria
wer, used for their selection. Comparisons between the "evaluation group"1
anpythe "incomplete data group" may be made based on the descriptive data
if Table 2.5.
17
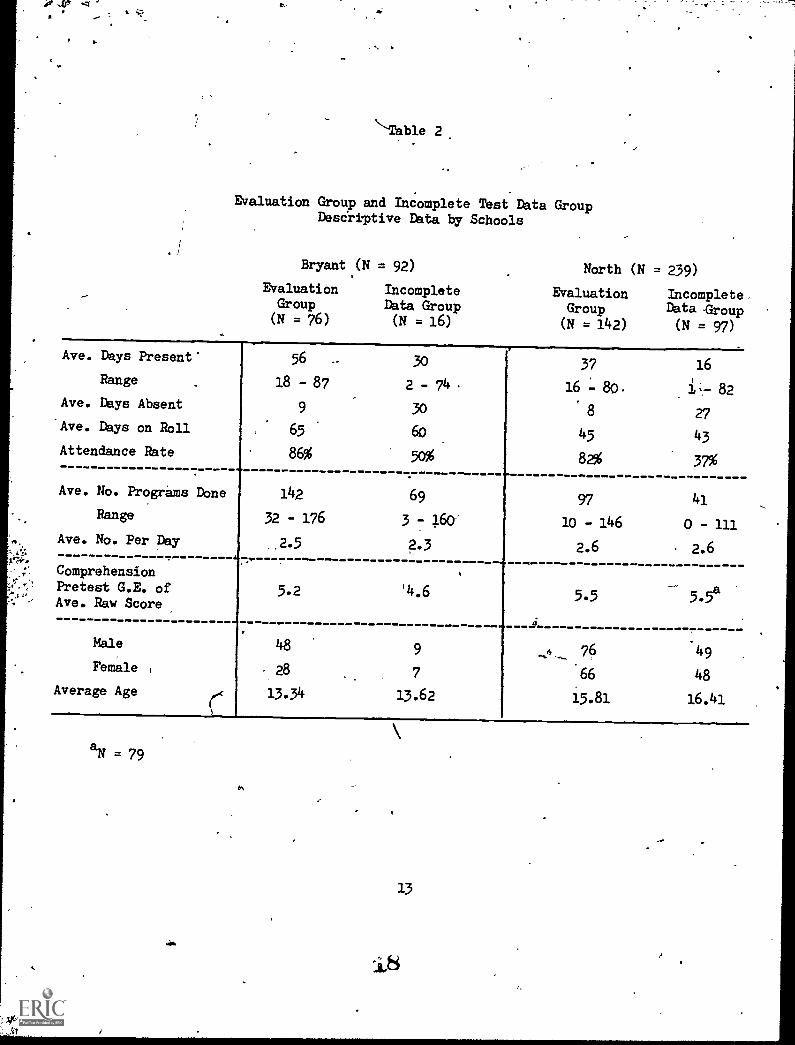
Table 2
Evaluation Group and Incomplete Test Data GroupDescriptive Data by Schools
Bryant (N = 92) North (N = 239)
Evaluation Incomplete Evaluation IncompleteGroup Data Group Group Data Group(N = 76) (N = 16) (N = 142) (N = 97)
Ave. Days Present'
Range
Ave. Days Absent
-Ave. Days on Roll
Attendance Rate
56 - 3o
18 - 87 2 - 74 .
9 30
65 60
86% 50%
Ave. No. Programs Done
Range
Ave. No. Per Day
ComprehensionPretest G.E. ofAve. Raw Score
Male
Female
Average Age
37 16
16 80. i;- 82
27
45 43
82% 37%
142 69
32 - 176 3 - 160-
2.5 2.3
97 41
lo - 146 o - 111
2.6 2.6
5.2 '4.6
48 9
28 7
13.34 13.62
5.5 5.5a
, ....,
4 7,6 49
66 48
15.81 16.41
= 79
al%
13
At the Center at North, where 40% of the pupils didinot have complete
data, the main reason for the lack of information was truancy. The attendance
rate of those with missing data was only 37%, compared with 82% for those
in the evaluation group. The overall attendance rate at North High for 1972-
73 was 81%. At North there were also some students who, were not tested at
the request of the school staff for various reasons including emotional
problems. The average pretest scores showed both groups reading at the 5.5
grade level. The students in the incomplete data group completed, on the
average, the same number of programs for each day of attendance as did those
in the evaluation group.
Ate the Bryant Center 17% of the students had incomplete test data. Their
atte ce rate was 50%, the rate for the evaluation group was 86%, and the
rate or Bryant as a whole was 89%. The average getest scores for these
junio high Itudents was as expected, lower than at North and there were
Jiffs noes between the'twO groups. The average for the evaluation group
was 5. grade level while the incomplete data group averaged 4.6. The
income ete data group also completed sliightly fewer programs per day tOan
did the'evaluatipn group.t
The smaller number of students who attended the Bryant Center compared..,
with North was partly because the Bryant students were enrolled for a longer
period of'time. There were also scheduling-problems at Bryant and no teacher
aide was available for half the year.
Results
The Mobile Learning Centers project again more than met its stated
objectives of having at least 50% of the students 14ke a gain of at least
one month in grade equivalents on the Gates-MacGini4e comprehension test
for each moth's enrollment. Combined results froiI Bryant Junior and North
High Schoo4 (N = 218) showed that 85% of the students gained three or more
11+
1*.

I
grade equivalent months in their average of three months on roll (see Table
3). The median grade equivalent gain was +1.60 which was well above expecta-
tion for` the average of three months in the program.
There was little difference between the two schools in the percentages
of students who'gained more than would have been expected for the.length
of time on roll.(see Tables 4.and 5). At Bryant, where the average enroll-_
ment was 4 months, 86% the students.made gains over expectaEion. At
North, 84% of the students made gains of 3 months or more in their 3 months
on roll. Note that these figures for months on roll are rounded up from
.36 school year at Bryant and .25 school year at North so the given results
are conservative figures.
`S.
Attitudes Toward Reading
Attitudes toward reading were measured at the Bryant Center in the
fall and again in the spring. The scale (Appendix A) which was used (with
a change in one question) had appeared in the Journal of Reading2 withhe
assurance that users were free to modify it. Instrdctions were read to the011 Ot
students for marking the scale. They were also told not to put their names
on their papers.
There was no attempt to measure attitudinal change since the group of
students in the spring was different from that in the fall. This was due
to the turnover of the student population and also to the anonymity assured
the respondents.
The av age scores of both groups did not significantly differ from each
other. general the scores indicated'that the students had slightly positive
attitudes toward reading. A completely neutral score on the scale would be
60. The average for the group in the fall was 69.7 and for the spring group
it was 68.3. The questions about which the students had the most positive
feelings were, "Reading is a good way to spend spare time" (agree), "Books
should not be read except for class requirements" (disagree), and "Reading,
2Estes, T.H. A scale to measure attitudes toward reading. Journal ofReading, November 1971, 135-13.
15
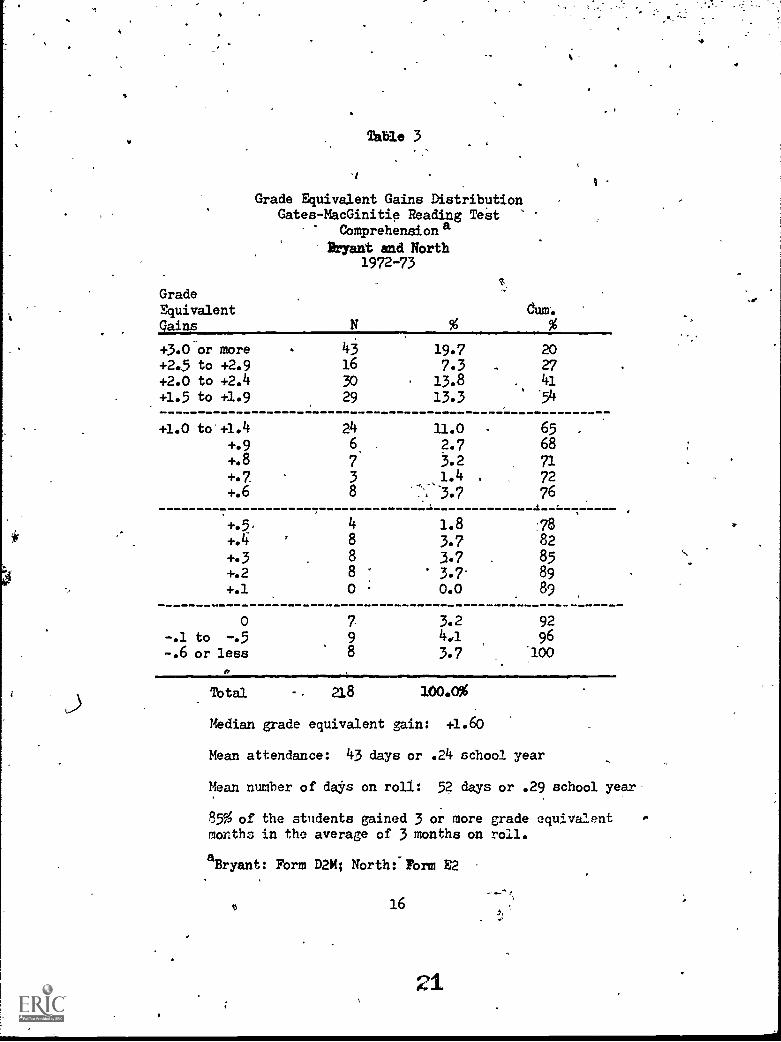
Table 3
rGrade Equivalent Gains Distribution
Gates-MacGinitie Reading TestComprehension a
GradeEquivalent
Gains
Bryant and North1972-73
dum.
+3.0 or more 45 19.7 20
+2,5 to +2.9 16 7.3 27+2.0 to +2.4 30 13.8 41
+1.5 to +1.9 29 13.3 '54
+1.0 to +1.4 24 11.0 - 65+.9 6. 2-7 68+.8 7 3.2 71+.7 3 1.4 , 72+.6 8 , 3. 76
'.y . 4
+.5, 4 1.8 .78
+.4 r 8 3.7 82
+.3 8 3.7 85+.2 8 3.7. 89+.1 0 : 0.0 89
0 7 3.2 92-.1 to -.5 9 4,1 96
-.6 or less 8 3.7 '100
p
Total 218 100.0%
Median grade equivalent gain: +1.60
Mean attendance: 43 days or .24 school year
Mean number of days on roll: 52 days or .29 school year-
85% of the students gained 3 or more grade equivalentmonths in the average of 3 months on roil.
aBryant: Form D2M; North: Form E2
61

Table 4
Grade Equivalent Gains DistributionGates-MacGinitie Reading Test
Comprehension, Form D2MBryant, 1972 -73
GradeEquivalentGains
Cum.
+3.0 or more 17 22.4 22+2.5 to +2.9 7 9.2 32+2.0 to +2.4 7 9.2 41+1.5 to +1.9 12 15.8 57
+1.0 to +1.4 9 11.9 68+.9 3 3.9 72+.8 1 1.3 74+.7 0 .0 74+.6 4 53 79
+.5 0 .0 79+.4 5 6.6 - 86+.3 2 2.6 88+.2 3 3.9 92+.1 0 .0 92
0 1 1.3-. 93-.1 to -.5 3 3.9 97-.6 or less 2 2.6 100
Total 76Amiaftw
99.9%
Median grade equivalent gain: +1.65
Mean attendance: 56 days or .31 school year
Mean number of days on roll: 65 days or .36school year
86% of the students gained 4 or more gradeequivalent months in the average of 4 monthson roll.
17

Table 5
Grade Equivalent Gains DistributionGates -MacGinitie Reading Test
Comprehension, Form E2North High, 1972-73
GradeEquivalentGains N- %
Cum.
ti
+3.0 or mere 26 18.5; 18+2.5 to +2.9 9 6.3 25+2.0 to +2.4 23 16.2 41+1.5 to +1.9 17 12.0 53
*1.0 to +1.4 15 10.6 63-+.9 3 2.1 66+.8 6 4.2 70+.7 3 2.1 72+.6, 4 2.8 75
411.+.5 4 78+.4 3
2.82.1 80
+.3 6 4.2 84+.2' '5 3.5 87+.1 0 .0 87
5'
0 6 4.2 92-.1 to -.5 6 4.2 96-.6 or less , 6 4.2 100
it,
Total 142 99.8%
Median grade equivalent gain: +1.5
Mean attendance: 37 days or .20 school year
Mean number of days on roll: 45;days or .25 school year
84% of the students gained 3 or more grade equivalentmonths in the average of 3 months on roll.
18
23
A

4
is something I can do without" (disagree). They tended to disagree with
"Reading turns me on", and "A certain amount of summer vacation should be
set aside for reading", and tended to agree that "Reading becomes boring
after about an hour."
Discussion
The program at the Mobile Learning Centers has again.been_effective
in improving the reading ability of those it served. The students who
attended the Centers had been selected by teachers and counselors, on the
basis of previous test scores and performance, as those in their schools
who were most in need of the individualized reading assistance offered by
the program. The grade equivalent of the average pretest raw score at
the junior high was 5.0; at the senior high it was 5.5.
The Center at Bryant was not used to full capacity in 1972-73, partly
because of problems in selection and scheduling. Two-thirds of the Bryant
students at the Center were in the eighth grade. At'North, the selection
process had been well worked out so that full use was made of the Center and
each grade was proportionately represented in attendance.
Below grade level testing was again used so that the tests were
appropriate to the students' reading levels rather than their actual
grade levels. Since the Gates-MacGinitie tests were standardized at
grade level perhaps the gains reported here should be viewed with some
caution. However, even a conservative interpretation of the outcome of
the Centers' program indicates that the program was effective in meeting
its objective Praising the rate of reading growth of secondary students
in the Title schools which it served.
Recommendations
1. Other things being equal, continue the Mobile Learning Centers program
since, for three years, it has consistently been effective in meeting .
its goals. This recommendation assumes that the goal of raising the
rate of reading growth of students who are one or more years below
grade level is a worthwhile objective and should be given a high priority
in the edudational process.
2. Investigate the possibility of using criterion- re'erenced testing as an
alternative to below grades level use of standardized tests.
3. Improve selection and schedulingoirocesties so that the Centers are used
to full capacity.
20
4


![The Minneapolis journal (Minneapolis, Minn.) 1906-04-16 [p 2]](https://img.dokumen.tips/doc/110x75/61ab1ff1053ee543243f419e/the-minneapolis-journal-minneapolis-minn-1906-04-16-p-2.jpg)