Embed Size (px)
Citation preview

1
3.2 Accidental Consequences
3.2.1. Pressure Waves and Pressure Loads 3.2.1.1. Chemical Explosions Essential to the consideration of accidental consequences is the estimation of hazards and hazard levels, e.g., overpressures, thermal radiation, the throw of debris or missiles, and the damage level or the vulnerability of the receiving objects. In chemical explosions which are usually exothermal oxidation reactions, a great portion of the combustion energy is carried by the developing blast wave uniformly distributed in all directions. Depending on the various types of combustion processes (slow deflagration or fast turbulent flame or detonation), the pressure history will be different. It is characterized by the peak overpressure and the pressure increase/decay rate. This effect is strongest at ground level (hemispherical) explosions where due to reflection the respective yield ratio can be twice as high as for a spherical explosion. Deflagration and detonation differ in peak overpressure, in the duration of the impulse (time-integrated pressure), in the steepness of the wave front, and in the decrease of overpressure with propagation distance. Secondary blast wave parameters are the peak reflected pressure, peak dynamic (blast wind) pressure, shock front velocity, and blast wave length. The different pressure transients for the two combustion modes are shown in Fig. 3-1.
Fig. 3-1: Characteristic shape of pressure-time function for a detonation shock wave (left)
and a deflagration pressure wave (right), from [TNO 1992] (Po: initial pressure; Ps: peak side-on overpressure; tp: duration of positive phase)
Deflagration In a deflagration with flame speeds of 1-10 m/s, the volume expansion of the gas acts like a piston displacing the unburnt gas. The deflagration pressure wave in a confined space is characterized by a slow increase of pressure and fluid velocity in the region preceding the flame front. Pressure build-up will take place even at low flame speeds and remain at the obtained level, since the gas cannot expand in a fixed volume. The pressure inside is independent of the location and mainly determined by the fraction of burnt gas. The static pressure loading in slow deflagration processes is described by the “adiabatic, isochoric, complete combustion (AICC)” pressure representing an upper bound in a confined space. For a given gas mixture at an initial temperature, the AICC pressure is a function of

2
the initial pressure. A mitigation of the AICC pressure is given by incomplete combustion, venting, radiation/conduction heat losses, or the addition of diluents. Therefore the maximum static pressure will be generally lower than the AICC pressure. On the other hand, initial turbulence increases the degree of combustion and thus the pressure. The peak pressure in a closed vessel for most hydrocarbon-air mixtures is in the order of 0.8 MPa, sufficient for many buildings to exceed their failure limits. For a hydrocarbon-oxygen mixture, it is even 1.6 MPa. An H2-air mixture, initially at NTP, will reach a pressure of 0.815 MPa; its volume will increase by a factor of 6.89 [Baker 1983]. The pressure build-up depends on the flame propagation and the degree of confinement. Particularly hazardous configurations are those, which are heavily confined like tubes, pipes, or channels, where – if long enough – even in insensitive methane-air mixtures, high flame speeds and pressures can be reached. Venting can reduce the pressure. Inside a spherical vessel, the pressure rise following the ignition of a flammable mixture is proportional to the cube of the burning velocity. In pipes with no obstacles, the transition distance increases with increasing diameter (example: 8 m for propane-air mixture in a 50 mm diameter pipe) [Moen 1993]. Effective burning velocity must be as high as ~ 100 m/s to produce significant blast overpressures of 10 kPa. Comparing explosion tests in tubes and in spherical vessels, it was observed that pressures are generally lower in a spherical propagation of the gas mixture (unconfined) than in a planar propagation. The pressure behind the flame front is decaying away from the flame, since wave energy dissipates. The combustion of a hydrogen-air mixture in an unconfined vapour cloud explosion (UVCE) typically liberates only a fraction of 0.1 - 10 % of its thermal energy content, in most cases less than 1 % [Lind 1975]. Depending on the combustion mode (deflagration/detonation), the explosion is connected with a more or less destructive pressure shock wave. The overpressure to be expected in the deflagration of an unconfined hydrogen-air vapour cloud is in the order of 10 kPa. Fast Deflagration In the intermediate stage of a fast deflagration with the flame front still travelling at subsonic speed, a preceding shock wave is developing in the still unburnt mixture. The peak overpressure is lower, the pressure drop, however, takes place over a longer period of time. This means that the impulse, i.e., the integral of pressure over time, which is a measure for the load upon a structure, is about the same in both cases. The peak overpressure increases with increasing flame speed. Transient pressures can be locally higher than the AICC pressure. Inhomogeneities can result in local detonations decaying to deflagrations. When the shock wave leaves the cloud, it turns into an expanding decaying wave. In the long-distance range, the pressure wave for both deflagration and detonation exhibits about the same shape decaying with 1/r. Local explosions like from jet flames result in locally high pressures and can also lead to high flame speeds in less confined areas and even trigger a detonation wave. Detonation In contrast to a deflagration, the detonation is a combustion mode with the flame travelling at supersonic speed in the order of 2000 m/s. The flame front proceeds by shock wave compression of the unburnt gas. It is characterized by a distinct pressure spike and a subsequent almost exponential decrease. The shock wave, which is at the same time the flame front, is followed by the reaction zone, in which a pressure discontinuity is observed where the pressure even drops to values lower than atmospheric pressure (“molecular collapse”) due to the much denser oxidation product (water) upon hydrogen combustion. The essential parameters are peak overpressure and positive/negative phase of the specific impulse depending on the liberated explosion energy. The combustion process is completed without an expansion of the gas cloud. Peak overpressures in the near field are typically in the range of 1.5-2 MPa. The pressure wave gradually decays and eventually turns into an acoustic wave.
3
In geometries which allow the transition from deflagration to detonation, pressures near the location where detonation takes place, may be much higher than the CJ (Chapman-Jouguet) pressure of a stabilized (and idealized) detonation wave, which is due to a pre-compression effect by the propagating shock wave [Van Wingerden 1999]. In confined spaces, peak pressures can range between “normal” deflagration peak pressure and very high pressures following DDT. Worst case is considered the DDT on a reflected shock wave produced by a fast flame with an estimated peak pressure to be by a factor of 10 higher than the detonation pressure. The transfer of a detonation wave into adjacent mixtures is possible and has been observed for planar clouds, whereas in spherical clouds, fast deflagrations are more likely to occur. An explosion in a vessel which is connected by a small opening to another vessel creates a peak overpressure and a pressure increase rate much higher than in a single vessel explosion, a phenomenon known as “pressure piling”. A pressure of more than 3.5 MPa was measured in a two-chamber geometry for a stoichiometric hydrocarbon-air mixture, where 0.8 MPa were expected for the explosion in a single vessel. Unlike the length of the interconnecting tube, its diameter is pertinent for the peak overpressure. Real Gas Cloud In reality, a gas cloud shows the typically expected features of a non-premixed, inhomogeneous concentration distribution, air entrainment at the boundaries, and stratification if evolving from a pool of liquefied gas. Furthermore in case of an explosion, a real gas cloud is not an “ideal” explosion source due to a larger-than-infinitesimal volume and a lower energy density and energy deposition rate, thus leading to non-ideal blast waves. Deviations from the ideal situation are able to either enhance or to attenuate the pressure build-up. Non-stoichiometry as well as ignition at the cloud edge will certainly have a damping effect on the pressure build-up. The maximum blast impulse, which becomes larger with increasing shock duration, is not near the explosion centre, but about 13-15 charge radii. A near-ground flat long-stretched cloud of heavy gases or vaporized cryogens may experience multi-point ignition connected with a sequence of pressure peaks, and more turbulence-generating terrain roughness or obstacles in the flow path, both effects of which lead to an enhancement of the pressure build-up. Unlike a heavy gas cloud which would be of a pancake form, a hydrogen vapour cloud would soon cover an area, which is larger than that of a hemispherical cloud with the same explosive inventory. Only in case of just vaporized LH2 after a large-scale spill, the cold gas cloud would travel and stretch near ground, until sufficient air has entrained from the outside to make the gas positively buoyant and develop soon to a vertically stretched cloud shape. The flame spreading in a non-spherical cloud is spherically until it reaches the cloud edge at some point; then it continues in the direction, where still gas can be found. The pressure is decreasing immediately behind the flame front because of the upward expansion of the combustion products. 3.2.1.2. Physical Explosions Shock wave blasts can also be produced from physical explosions, i.e., the sudden violent expansion of a fluid not connected with a chemical reaction. The strongest man-made physical explosion is surely the nuclear explosion of an atomic bomb. The resulting blast wave reaches overpressures of 170 kPa in the central zone (14 km radius for the example of a 20 Mt explosion in 5.5 km height) and gradually decaying to the outside with still 20 kPa at 60 km distance). The most common physical explosion is a bursting or rocketing pressure vessel which may result from a fire-induced BLEVE (Boiling Liquid Expanding Vapour Cloud Explosion). The higher the liquid density, the more destructive is the BLEVE. If the liquid is flammable, a fireball will follow. Several pressure spikes are being created upon a BLEVE: from the flashing liquid, from the expanding vapour phase, and, if applicable, from the combustion. Missiles and projectiles may be emitted also from a

4
physical explosion and may cause injuries, fatalities, or damage at considerable distances depending on the explosion energy liberated. Projectile hazard increases with average liquid temperature. Another example of a physical explosion is the so-called rapid phase transition (RPT), a thermal vapour explosion resulting from the spontaneous phase change of a fluid getting in contact with a much hotter or colder liquid, e.g., a cryogen spilled onto water or the fluid-coolant interaction during a core melt accident in a light-water nuclear reactor. Prerequisites of such an explosive boiling are a temperature of the “hot” fluid above the boiling point of the “cold” fluid and a certain mixing of both fluids allowing a close and sufficiently long contact. Although the energy release is small compared with a chemical explosion, fragmentation and phase change of the “cold” fluid (vapour evolution) can occur at such a high rate that shock waves may be formed. For LNG onto a water surface, overpressures with damaging potential of up to 5 kPa were observed. RPT explosions with different materials (molten metal plus water) in the metal and chemical industries were even the cause for people killed by flying melt or the blast wave. Natural examples of RPT were the catastrophic explosions of the island volcanoes Krakatoa, Indonesia, in 1883 and Surtsey, Iceland, in 1963. 3.2.1.3. Experimental Work Apart from the experience obtained by observations and lessons learned from explosion accidents, numerous experiments have been performed worldwide to investigate the transient behaviour of overpressures following the explosive combustion of fuel-air mixtures. Tests were conducted under various conditions such as confined, partially confined, or unconfined, larger-scale or smaller-scale geometry, fuel type and constitution with the main goal of development of or comparison with simulation approaches. The most dangerous configurations were found to be, as expected, those with a major obstruction, even for less sensitive fuel gases such as methane. For DDT cases, travelling distance for the flame must be sufficiently long, which would be around 3 m for a stoichiometric hydrogen-air mixture. Only a few of those test series are mentioned in the following showing the broad range of activities. Large-scale experiments were conducted by the Russian Kurchatov Institute using premixed hydrogen-air mixtures. The RUT facility with a confined volume of 480 m3 was employed for a series of tests ranging from slow deflagration to detonation. H2 concentration varied between 10 and 14 %. During slow deflagration (no obstacles present), the overpressures measured increased with H2 concentration, from around 0.1 MPa to 0.17-0.23 MPa. Insertion of obstacles (blockage ratio of 30 and 60 %) resulted in accelerated flames creating overpressures (1.1-1.6 MPa) for gas mixtures with 14 % H2 concentration. There was even the observation of a detonation at a H2 concentration as low as 12.5 %. Examples of pressure transients are given in Fig. 3-2 [Breitung 1996].

5
Fig. 3-2: Measured overpressure transients in RUT tests with different blockage ratios (BR)
showing slow deflagration (top), fast deflagration (middle), detonation (bottom), from [Breitung 1996] The Russian UTR facility, a tube with 66 mm diameter and a maximum length of 3 m was used for systematic studies on peak overpressures if the location of DDT is varied influencing the degree of precombustion. Peak pressures observed were well above the Chapman-Jouguet pressures for detonation of the undisturbed mixture. Large-scale testing on DDT in hydrogen-air mixtures was conducted in the FLAME facility, a 30.5 m long, 2.44 m high, and 1.83 m wide rectangular channel with a closed ignition end and an open far end and venting/obstruction possibilities. An explosion tube of 2.5 m diameter and 10 m length with one open end was used in Norway to study peak overpressures of ignited stoichiometric propane-air mixtures. The tests have shown the significant influence of the blockage ratio inside the tube on the flame speed and pressure increase, respectively, which can come close to the detonation range [GEXCON]. Smaller-scale detonation test tubes have been conducted at the Research Centre Karlsruhe, the Technical University of Munich, the DLR in Stuttgart or the High-Temperature Combustion Facility,

6
HTCF, at BNL employing different types of obstruction and differently diluted hydrogen-air mixtures to study flame acceleration and various DDT mechanisms. Within the nuclear power plant safety program and the PNP gas cloud program, the German Fraunhofer Institute for Chemical Technology (FH-ICT) conducted various series of tests using mixtures of propane, ethylene, methane, and hydrogen with air to investigate detonation and DDT in spherical, hemispherical, and tube geometries. Unconfined hemisperically shaped H2-air mixtures at volumes between 7.5 and 2100 m3 were ignited measuring a maximum overpressure of 6.3 kPa which corresponds to a flame velocity of 84 m/s [Schneider 1978, Pfoertner 1983a, Pfoertner 1983b, Pfoertner 1985]. Balloon tests were conducted with hemisperically shaped H2-air mixtures with a volume of 50 m3 and concentrations of 20 and 29.6 vol%, respectively. Ignition occurred at the centre on the ground by means of an explosive to trigger detonation. Pressures were measured at various positions inside and outside the balloon. Visually measured flame speeds agreed well the theoretical values (see Fig. 3-3) [Breitung 1995]. The influence of partial confinement on the combustion behaviour of H2-air mixtures was examined in further ICT tests employing a 10 x 3 x 3 m3 lane with parallel walls [Schneider 1984a, Schneider 1984b, Schneider 2005].
Fig. 3-3: Measured and calculated pressure transient inside (left) and outside (right) the balloon
in an FH-ICT hemispherical balloon test with H2-air detonation, from [Breitung 1995] The extensive experimental research programs on gas explosions within the EU projects MERGE [Mercx 1994] and EMERGE [Mercx 1997] have shown that overpressures are mainly determined by fuel type, geometric scale as well as the arrangement and number of obstacles which are passed by the propagating flame.
7
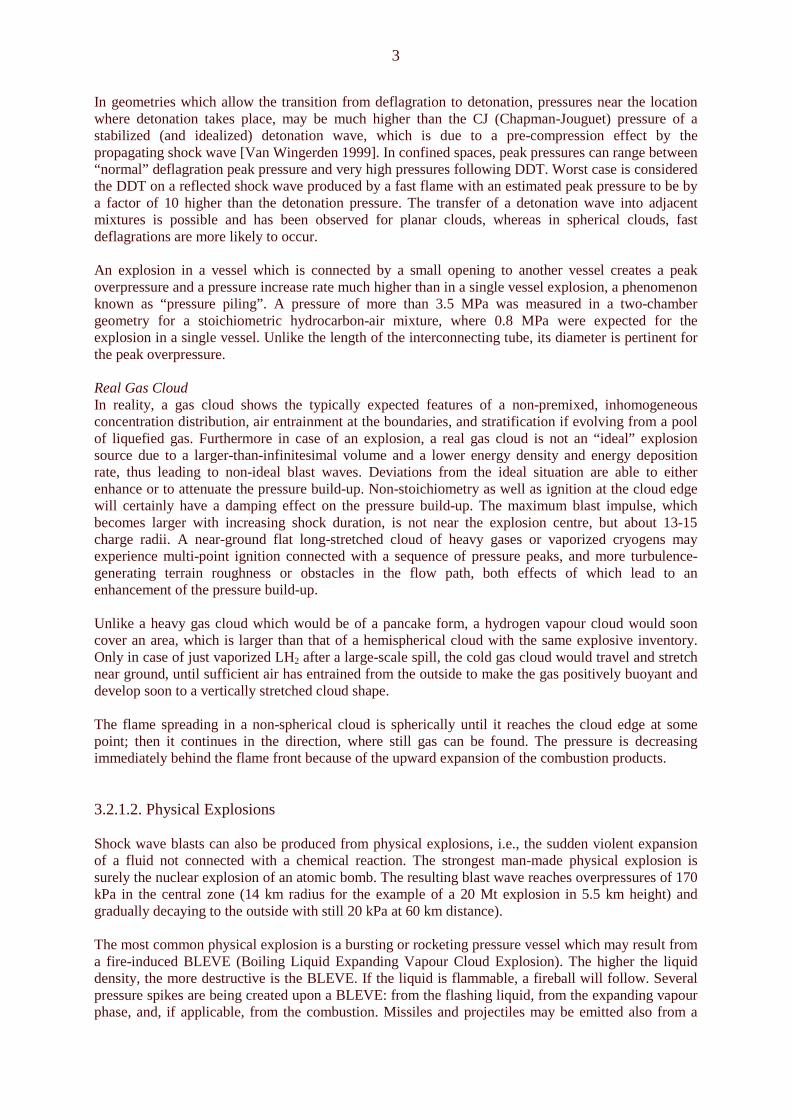
Fig. 3-4: Measured flame front profiles in an FH-ICT lane test with parallel walls
(37 % H2 air mixture), fan generated turbulence, and DDT near the wall (contour 34), from [Berman 1986]
Other unconfined explosion tests are known of the BASF company in Germany. In 1943 and 1948, explosion accidents occurred at BASF resulting from the bursting of liquid gas vessels, subsequent flash evaporation, and mixing of the fuel with ambient air and eventually ignition of the cloud. The cause of the bursting was a heating of the overfilled vessels by the radiation of the sun ,i.e., there was not enough vapour buffering inside of the tanks. The experimental simulation and modelling of these events has been performed in the 1970s by BASF and Fraunhofer ICT by use of differently sized vessels with volumes between 0.2 and 1.2 m3 corresponding to a mass of up to 452 kg of liquid propylene. Pressures observed were in the range of 0.5-1.5 kPa for the smaller and 4-7 kPa for the larger vessels [Maurer 1975, Maurer 1977, Giesbrecht 1980, Giesbrecht 1981]. With respect to other physical explosions, tests were conducted in the 1970s and 1980s with the spillage of LNG into a pond of water (e.g., Coyote series, Burro series, Maplin Sands series) to measure among other parameters the strength of RPT pressure waves. After releasing LNG amounts of 40 m3 onto water, observed RPT overpressures were as high as 5 kPa [Koopman 1982]. Gaz de France initiated an RPT research program in 1981 in Lorient with large-scale tests using LNG. The spillage of amounts between 1 and 9 m3 onto water has shown that the occurrence and strength of RPT were strongly related to the volume of the mixing zone. Maximum explosion pressure recorded was equivalent to 4.15 kg of TNT. Research activities also included fundamental studies of the phenomena and computer code development. Due to the larger temperature difference, consequences of LH2 spills onto water may be more severe. 3.2.1.4. Modelling of Pressure Waves

8
The explosion energy in case of a BLEVE can be assessed by the difference between final and initial state of the bursting vessel assuming isentropic expansion. This plus a certain portion of the bursting pressure energy contribute to the blast wave generation [CSChE 2004]. The propagation of a pressure wave in a compressible medium can be described by the Rankine-Hugoniot equations (or “jump conditions”) based on the conservation equations for mass, momentum, and energy. From this relationship, it can be derived that the density ratio of air, if assumed to be an ideal gas, behind and in front of the shock front is limited to about 6. For air as a real gas, however, assuming to dissociate or ionize at high temperatures, this ratio can be significantly higher. A computer code, BLAST (Building Loads Analysis and Systems Thermodynamics), was developed based on the above equations as well as on empirical data from nuclear tests. A first model description of the shock wave parameters for an explosion in air was given in 1870 by Rankine with shock front velocity, maximum dynamic pressure as functions of the peak static overpressure, speed of sound in air, and the atmospheric conditions. Later modelling efforts have used theoretical or empirical approaches to find agreement with experimental data [Pandey 2006]. Fig. 3-5 shows a comparison of measured explosion pressures with different models. It was generally stated that agreement between theory and experiment is less good in the near-field compared to the medium and far-field because of the more complex flow pattern.
Fig. 3-5: Blast pressures vs. scaled distance for a detonation of 1 kg of TNT [Pandey 2006] Accurate empirical and theoretical models are existing for detonation waves. According to the Chapman-Jouguet (CJ) theory from 1899 and 1905, respectively, detonation represents a linear discontinuity, transforming the reactants completely to products at an infinite reaction rate. Detonation velocity and pressure can be calculated from equilibrium chemistry as a function of the gas mixture only. Respective data for hydrogen at NTP in an unsupported detonation are
CJ velocity: 1968 m/s CJ detonation pressure: 1.58 MPa
The CJ theory predicts the thermodynamic state immediately behind the detonation wave, but cannot describe the structure of the wave. Processes inside the detonation front are extremely complex

9
involving multi-dimensional shock interactions in an intensive turbulent reacting medium. Still, the simple 1-dimensional CJ model prediction of velocity and overpressure is quite close to what is being observed, within a few per cent for velocity and 10-15 % difference for the pressure measurements [Tieszen 1993]. CJ (and AICC) pressures of a fixed gas mixture increase linearly with the initial pressure at constant initial temperature, and are inversely proportional to the initial temperature at constant initial pressure. However, the CJ theory is not capable of determining the dynamic detonation parameters such as detonability limits, initial energy or critical tube diameter. No theory exists so far that provides estimates of these parameters. CJ parameters of a gas or gas mixtures can be calculated with the code STANJAN developed at the Stanford University. In the ZND (Zel’dovich-von Neumann-Doering) theory, the detonation wave is described as a two-dimensional dome-shaped shock wave, where at its front both temperature and pressure rise. It is followed by a reaction zone whose thickness is determined by the reaction rate. Here the detonable substance reacts at high pressure and temperature until everything is transformed into product gases. The chemical reaction causes a rapid fall in pressure (“von Neumann spike”). The reaction zone remains unchanged (steady) when moving through the substance. A variable ranging between 0 and 1 describes the respective state and the progress of chemical reaction, respectively. Detonation velocities and pressures are less than for a plane shock front. A very simple way of modelling blast effects is the TNT Equivalent method derived from the decay of shock waves from high-explosive or nuclear explosions in the atmosphere. It is an estimation of the mass of TNT per unit mass of fuel, whose detonation would result in the same blast wave at the same distance. One kg of TNT translates into energy of 4520 kg meaning that 1 Nm3 of hydrogen gas corresponds to 2.22 kg of TNT. The weakness of the TNT Equivalent model, if applied to a VCE, is to ignore the pressure-time characteristic differences between a gas cloud and a detonative TNT explosion. It is deemed to overestimate near-field and underestimate far-field effects. Furthermore the model does not consider the influence of turbulence and confinement. The TNT model considers only the total amount of fuel involved and particularly does not take into account the yield factor in a VCE, which is generally only a small fraction, in most cases < 1 %. The most common form of blast scaling law is that according to Hopkinson and Cranz [Baker 1983]:
Z = R / E1/3 or Z = R / W1/3 where Z is the scaled distance, E is the heat of combustion, W is the weight of the explosive, can be applied to predict blast wave properties of large-scale explosions based on the data of small-scale experiments (assuming same explosive, same geometry). The above relation appears to become inappropriate for Z < 0.16 m/kg1/3. Numerous explosion experiments have been evaluated to derive blast charts. Commonly known and accepted are the Baker-Strehlow blast curves for VCE in the open atmosphere or the TNO blast waves for hemispherical explosions. It is a good engineering tool finding its limits when real gas clouds rather than idealized are considered. An improvement towards a more realistic modelling was made with a new set of blast curves, called the Baker-Strehlow-Tang curves (Fig. 3-6), by considering a more precise blast pressure decay behaviour. The result is a considerable reduction at long distances. The curves were validated in all combustion regimes [Tang 1999].

10
Fig. 3-6: Baker-Strehlow-Tang curves of overpressure vs. distance
for various flame Mach numbers Mf, from [Tang 1999] Models for BLEVE Blast prediction are also described in the CCPS guidelines [CCPS 1994] and the ‘Yellow Book’ [MVROM 2005]. These references also describe models to predict the magnitude and duration of the fireball which often follows a BLEVE. Recently a new numerical method to calculate the blast effects originating from an exploding vessel of liquefied gas have been derived [Van den Berg 2004, Van den Berg 2005]. Adequate blast calculation requires full knowledge of the blast source characteristics, i.e., the release and subsequent vaporization rate of the flashing liquid. As the conditions that allow explosive vaporization are not entirely clear and the vaporization rate of a flashing liquid is unknown, safe assumptions have been adopted as the starting point in the modelling. The blast effects from a BLEVE are numerically computed by imposing the vapour pressure of a flashing liquid as boundary condition for the gas dynamics of expansion. The modelling shows that the rupture of a pressure vessel containing a liquefied gas in free space only develops a blast of significant strength if the vessel near-instantaneously disintegrates. The TNO Multi-Energy method is based on the Multi-Energy concept, which consists in the feature of gas deflagration that overpressure and blast develop only under appropriate boundary conditions, i.e., only where the flammable mixture is partially confined and/or obstructed [CCPS 1994, Mercx 1991, Mercx 2000]. This assumption can be made provided that transition to detonation to DDT does not take place. For hydrogen, this requirement is not as easily fulfilled as it is for most hydrocarbons. Based on the Multi-Energy concept, a vapour cloud explosion is modelled as series of hemispherical model charges. Each model charge is characterized by a charge size and a charge strength. The charge size is related to the heat of combustion present in the source, while the charge strength is related to the explosion overpressure. Based on these characterizations, scaled blast parameters (peak overpressure, positive phase duration) as a function of scaled distance have been calculated with the TNO FCT Euler solver ‘BLAST’ (Fig. 3-7). [Mercx 2000]. The strength of the blast wave is expressed as a number between 1 and 10 representing categories of “insignificant” to “detonative”. Calculation results suggest that damaging explosions can occur only, when flame acceleration takes place within a plant structure [Mercx 1991, Mercx 2000]. The charge strength can be determined either by numerical calculation (CFD) or by using the experimentally based GAME correlation [Van den Berg 1996], a relation between the overpressure and details of obstacle configurations. The charge size is influenced by the Critical Separation Distance (CSD), the distance between two obstructed regions above which a vapour cloud explosion can be modelled as two separate sources of blast. Guidance on the CSD has been obtained in experimental research

11
projects such as RIGOS [Van den Berg 2003]. It has been found that the CSD between a ‘donor’ and an ‘acceptor’ increases with the explosion overpressure up to a maximum of half the donor dimension.
Fig. 3-7: Blast overpressure vs. scaled distance for different explosion strengths
according to the Multi-Energy method, from [Mercx 2000] The Research Centre Karlsruhe has developed the calculation models DET1D and DET3D to determine the characteristic detonation parameters within the reaction zone and outside in the unburnt mixture. These models have been mainly applied to assess the load on a nuclear containment upon confined combustion of homogeneous mixtures of H2, O2, N2, H2O. Code validation was made against the Russian RUT experiments and FH-ICT balloon tests (see Figs. 3-2 and 3-3). Parameter calculations of a 3D detonation have shown that the 3D structure is not important for the pressure load and that a relatively coarse grid provides sufficient accuracy [Breitung 1995]. The state-of-the-art approach to modelling of combustion phenomena are 3D CFD codes, which need to be adapted to the spatial and temporal lengths characteristic for chemical reactions. Typical time steps for hydrodynamic flow calculations are in the order of 10-6 s and for the H2-O2 reaction mechanism 10-10 s [Breitung 1995]. Many approaches are based on the assumption of incompressible flows and are restricted to slow deflagrations or to pure detonations. For fast deflagrations with Mach numbers > 0.3, incompressibility can no longer be assumed, since pressure waves are not negligible. Several methods of turbulence modelling have been developed. In the “Reynolds Averaged Navier Stokes” (RANS) equations, turbulence is modelled by means of a turbulence viscosity which can be calculated in a k- two-equations system. In contrast, the “Direct Numerical Simulation” (DNS)

12
employs the direct and complete solution of the conservation equations taking into consideration all turbulent structures. Somewhere in between is the method “Large Eddy Simulation” (LES) where only the large turbulence structures are being dissolved by the calculation grid, whereas small turbulences are filtered away and covered a turbulence viscosity model approach. Today’s modelling and simulation show good agreement with a variety of fast combustion phenomena [Fischer 1996]. It has the potential to provide accurate data for realistic scenarios depending on how accurately the respective submodels are working. For example, the above mentioned LES method for turbulent flows with high Reynolds numbers was successfully applied to the FH-ICT deflagration test with stoichiometric H2-air mixture [Molkov 2005]. The application of computer models, however, should be limited to cases or ranges, for which the codes were validated. Examples of CFD codes applied to combustion are AIXCO (RWTH, Germany), AUTOREAGAS (TNO & ANSYS Century Dynamics, The Netherlands), CFX (Harwell, UK), FLACS (CMI, Norway), FLUENT (Fluent, USA), GASFLOW (FZK, Germany), PHOENICS (CHAM, UK). 3.2.1.5. Throw of Debris and Missiles No fully validated model exists in terms of predicting projectile hazards from bursting pressure vessels. However, this difficult physical problem may be divided in two parts:
• fragmentation process evaluation; • projectiles trajectories;
The first part is probably the most complex one, and only numerical simulation seems to allow for prediction using appropriate material and fracture models as, e.g., shown in [Gurson 1977, Erdogan 1977, Mott 1943]. The second part couples beginning solicitation and ballistic considerations. Solutions as suggested in [Baum 1999, Baker 1983, UFIP 2002] are the most widely applied and easy-to-handle models. The software PROJEX using a method developed by INERIS may also be used and seems to give better results [INERIS 2004]. A global model based on statistical considerations is also being conceived in [Hauptmanns 2001]. Most modelling approaches deal with the effects of blast and fire. In many hydrogen explosion scenarios however, the throw of missiles or debris is also important and in some cases even dominant. For hydrogen gas explosions this is typically the case for scenarios where some degree of confinement or enclosure is present. When in combination the combustion process changes from a deflagration to a detonation the throw of missiles or debris can be devastating. Examples are gas explosions inside industrial equipment, inside a garage or car park, or in a nuclear plant. These scenarios may lead to a major hazard of debris or missiles. Other types of explosions involving hydrogen are BLEVE’s and physical explosions. In these scenarios, it is typically a vessel rupture leading to the throw of missiles. Any risk assessment methodology for hydrogen should contain models for the throw of debris or missiles. The Initial Conditions In general the initial conditions for throw are defined by the distributions of the missile or debris mass, launch velocity, and launch direction. These conditions are determined by the failure process and the subsequent acceleration by the expanding gasses, or reaction products. This is accompanied by pressure relief as a result of the increasing vent area between the accelerating items. The initial conditions for throw of missiles from vessels, as a result of physical explosions, BLEVE’s and internal gas explosions can be determined with PGS02 [MVROM 2005], referred to as the ‘Yellow Book’, and the CCPS Guideline [CCPS 1994]. In these references, the models of Baum (BLEVE’s), Baker (physical explosions) and Gel’fand (physical explosions and internal gas

13
explosions) are presented. For BLEVE’s, the model of Baum predicts the initial velocity of missiles based on the amount of liberated energy. The model of Baker for physical explosions relates the initial velocity of missiles to a scaled overpressure, the vessel geometry, and the number of fragments. With the model of Gel’fand for internal gas explosions, the initial velocity is based on the scaled overpressure and a scaled energy release rate. Numerical simulation in combination with appropriate material and fracture models, e.g., shown in [Gurson 1977, Erdogan 1977, Mott 1943] is another option. The break-up process of buildings constructed from reinforced concrete or brick during an internal gas explosion is a more complicated phenomenon. In the case of a (weak) deflagration, the combustion continues during the break-up process and debris launch. The coupling between pressure build-up, venting, and break-up determines the part of the structure that will participate in the throw, and the distributions of debris launch velocity and launch direction. When a hydrogen detonation takes place inside a building the combustion process is completed before the structure starts to break up. As a result, the structure is loaded with a quasi-static load of typically 0.8 MPa overpressure. This by far exceeds the structural strength of any typical industrial building. As a result, the structure will largely break up and accelerate. Hydrogen detonations in buildings can be compared with bare quantities of high explosives in ammunition magazines. A similar quasi-static load is obtained when a bare charge resulting in a loading density of 0.25 kg/m3 of TNT is detonated. In Fig. 3-8, the result after the detonation of 2 kg of TNT in an 8 m3 Kasun-building (Norwegian 'small quantities' ammunition storage building) is displayed [Langberg 2004].
Fig. 3-8: Kasun storage building with an internal volume of 8 m3 (left).
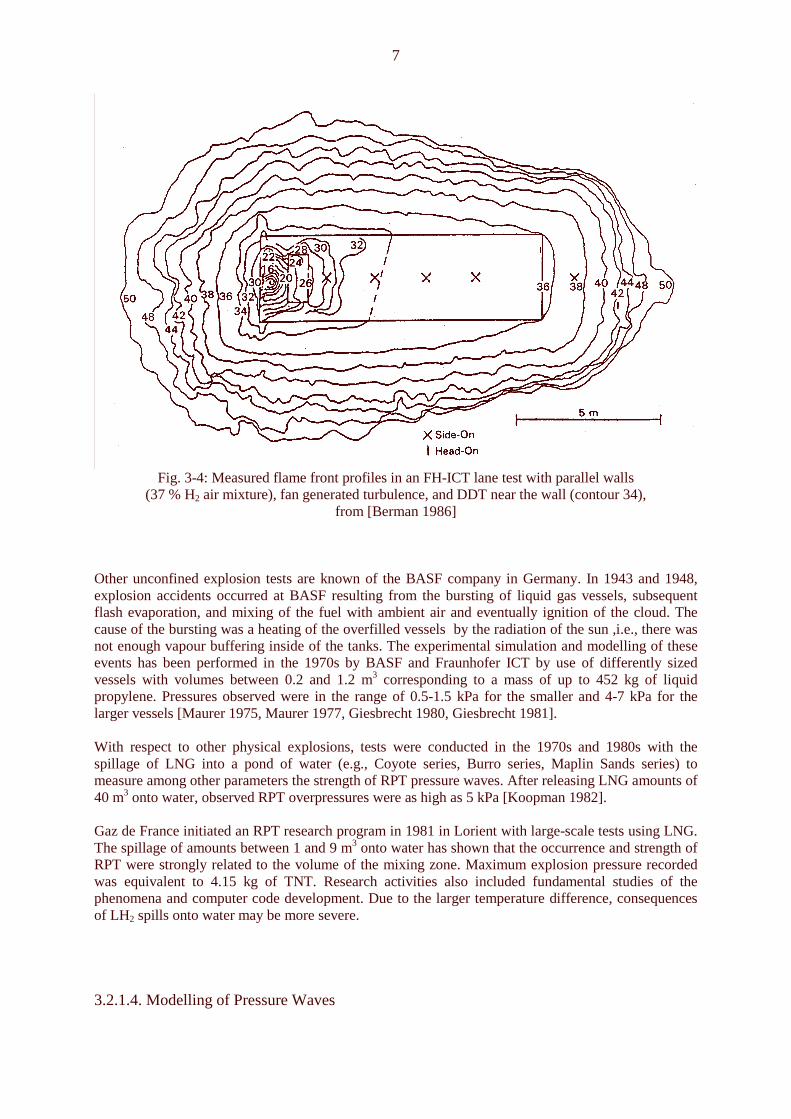
Result after detonation of 2 kg TNT (right). [Langberg 2004] For detonations of bare explosives in ammunition magazines, relations for the distributions of debris mass, launch velocity, and launch direction have been derived within the Klotz Group [Van Doormaal 2006a, Van Doormaal 2006b]. Those relations are based on debris pick-up data from a collection of large scale trials, and depend on loading density and wall thickness. The cumulative debris mass distribution was found to decay exponentially with debris mass. The characteristic length of debris decreases slowly with loading density. Fig. 3-9 shows this characteristic length for a large collection of trial data. Note that the effective loading density for hydrogen detonations of 0.25 kg/m3 is situated at the low loading density regime of the trial database.
14
Fig. 3-9: Characteristic length versus loading density for the Klotz Group trial database
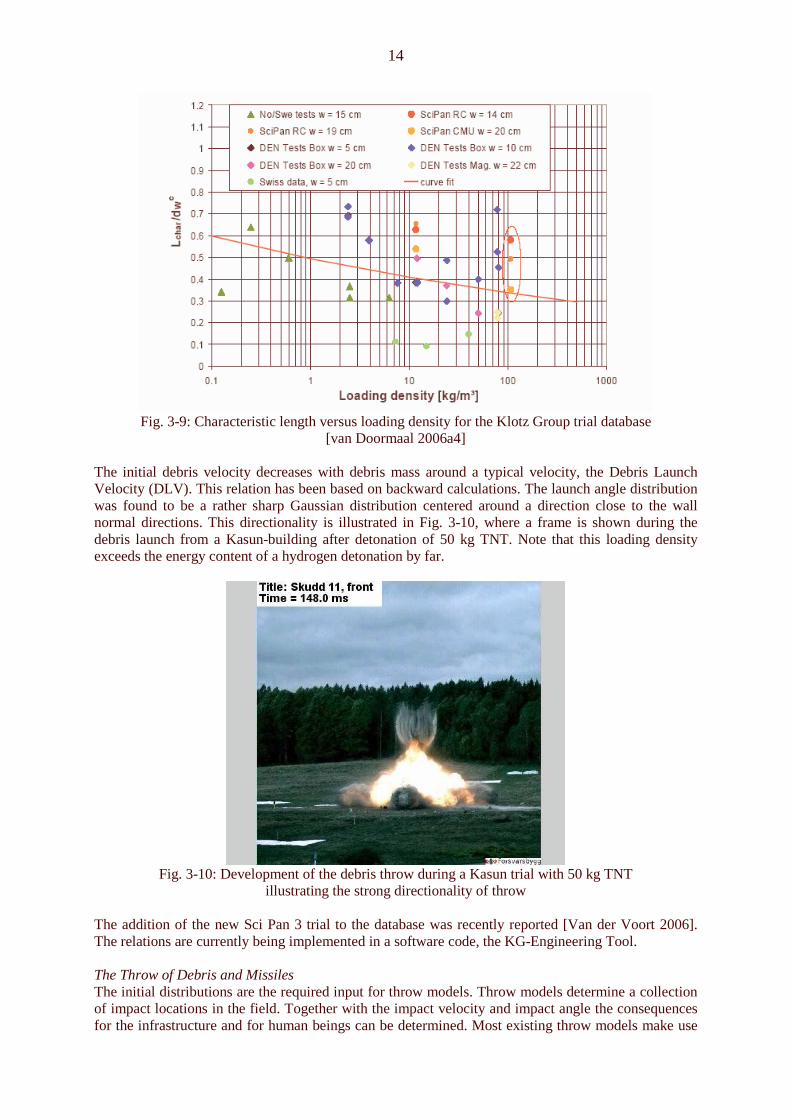
[van Doormaal 2006a4] The initial debris velocity decreases with debris mass around a typical velocity, the Debris Launch Velocity (DLV). This relation has been based on backward calculations. The launch angle distribution was found to be a rather sharp Gaussian distribution centered around a direction close to the wall normal directions. This directionality is illustrated in Fig. 3-10, where a frame is shown during the debris launch from a Kasun-building after detonation of 50 kg TNT. Note that this loading density exceeds the energy content of a hydrogen detonation by far.
Fig. 3-10: Development of the debris throw during a Kasun trial with 50 kg TNT
illustrating the strong directionality of throw The addition of the new Sci Pan 3 trial to the database was recently reported [Van der Voort 2006]. The relations are currently being implemented in a software code, the KG-Engineering Tool. The Throw of Debris and Missiles The initial distributions are the required input for throw models. Throw models determine a collection of impact locations in the field. Together with the impact velocity and impact angle the consequences for the infrastructure and for human beings can be determined. Most existing throw models make use

15
of a Monte Carlo technique. Predefined initial distributions of debris or missile mass, launch velocity and launch direction are sampled to obtain the initial conditions for a number of trajectory calculations. To obtain a proper representation of the debris or missile density in the field, the required number of Monte Carlo simulations needs to be very large. A global model based on statistical considerations is also being conceived in [Hauptmanns 2001]. Recently TNO has developed a universal throw model [Van der Voort 2006]. The basis is the source function theorem, an underlying mathematical relation between the debris or missile density and the initial distributions. This model reduces the required number of trajectory calculations dramatically. Trajectory calculations have to be carried out with caution since the selected shape, orientation and drag coefficient of debris and missiles have a significant influence on throw distances. In Fig. 3-11 an application to the Sci Pan 3 trial is shown together with experimental results [Van der Voort 2006]. Compared to hydrogen detonations, this trial is situated at the other end of the loading density regime (> 100 kg/m3), but illustrates the validity of the model in general. The calculations are in reasonable agreement with the experimental data. Differences can be recognized and understood as the model does not take into account:
• ricochet and roll (transport of missiles and debris after the first trajectory); • coupled trajectories: • break-up at impact.
In reality, these phenomena play a role, but are on the other hand not always important in the field of risk assessment.
Fig. 3-11: Debris density calculated with the universal throw model together with experimental result.
Sci pan 3 trial [Van der Voort 2006] Solutions as suggested in [Baum 1999, Baker 1983, UFIP 2002] are widely applied and easy-to-handle models. The software PROJEX using a method developed by INERIS may also be used and seems to give better results [INERIS 2004]. Experimental data for the projectile hazards from bursting pressure vessels is displayed in Fig. 3-12. Data available are either from actual plant accidents on a large scale or from small-scale testing. The analysis shows among other findings that 80 % of all vessel ruptures resulting from fires lead to missiles, that non-fire ruptures have an increased number of fragments, that spherical vessels produce

16
more fragments than cylindrical vessels, or that the end tubs of vessels travel further than other types of fragments. There is also the observed tendency of missiles to export fire [Leslie 1991].
Fig. 3-12: Projectiles travelling after catastrophic pressure vessel failure
+: experimental data; case studies, from [Leslie 1991]
3.2.2. Interaction of Blast Wave with Structure and Structural Response The effects from an explosion, which have an impact on structures, are pressure changes (blast wave) and air movement (“explosion wind”) as well as thermal radiation and flying missiles. Only a third of the chemical explosion energy is involved in the generation of the detonation blast wave; the other two thirds are released much slower during the subsequent mixing and burning of the detonation products with the air [FEMA 2003]. In general, structural responses are highly dynamic, highly inelastic, and highly interactive. The mechanical effect of a blast wave is determined by the overpressure and the duration of the positive phase. 3.2.2.1. Interaction of Blast Wave with Structure The blast parameters are dependent on the distance between structure and blast centre. At close distances, the target is exposed to a high-intensity pressure load over a localized region; at greater distances, the load is reduced, but covers a larger surface area. The diagram in Fig. 3-13 describes the pressure load on a rectangular structure.

17
Fig. 3-13: Simplified blast loading diagram on a rectangular building [Benteftifa 1995]
The dynamic interaction of a blast wave with the structure depends on the pressure-time history, i.e., rise time and duration of positive phase and peak pressure or the impulse (which is the time integral of the pressure). Two phases are distinguished:
1. The initial “diffraction loading” Diffraction loading is given by forces resulting from direct and reflected pressures during the initial phase. Reflection of the pressure wave at the front side amplifies the incident peak pressure with a normally reflected wave to represent an upper limit. Also density and temperature of the reflected wave are increased compared to the incident wave. The flow around the obstacle determines the further pressure development at the front and at the back side. The net horizontal loading is that on the front minus that on the back face. The reflection coefficient, i.e., the ratio between reflected and incident overpressure, is dependent on the blast wave type (pressure or shock wave), its intensity, and on the incident angle. For a pressure wave, this coefficient can have a value up to about 3 depending on the incident angle (the more usual case will have an oblique incidence). For a shock wave, it can be in the range of 2 to 8 and even higher for explosives (see Fig. 3-14). Dynamic loads of fast transient pressures are imposed, if the combustion energy is inhomogeneously distributed, and are specific to the structure geometry.

18
Fig. 3-14: Reflected pressure coefficient as a function of the incidence angle, from [FEMA 2003] (100 psi = 2.26 MPa)
2. The “drag loading”
After the diffraction phase is completed, the structure is subjected to a “stagnation pressure”. The distance of the incident wave when interacting with the structure, causes major pressure differences developing from the edges of the structure. Resulting from this rarefaction wave, pressures decrease. During this so-called drag phase, strong transient winds (explosion wind) with flow velocities of several 100 m/s are effective. Drag forces will particularly have an impact on smaller structures such as pipe work. Load duration during vapour cloud explosions may be long enough to be comparable with the time required for the dynamic response time of the structure. In case of large structures, the rarefaction from the edges is insignificant.
Confined Areas In a confined or partially obstructed area, an explosion will create a structure loading, where two phases can be distinguished, the reflected blast loading followed by the gas loading phase. When the pressure wave hits the (rigid) wall, gases are brought to a rest and the wave is reflected. At normal incidence, the reflected shock wave further compresses the burnt gases increasing the pressure by about a factor of 2.3. The mixture of reflected pressure waves and deflected air flows are the result of reverberation of the initial high-pressure, short-duration reflected wave with the amplitude decaying with each reflection until eventually pressure levels out at gas pressure loading. The latter phase lasts longer, the less venting is available. The more complex the structure, the more difficult is the prediction of the critical conditions for mechanical failure for a given load history.

19
Fig. 3-15: Theoretical detonation pressure and normally reflected detonation pressure
for hydrogen-air mixtures [IAEA 1990]
Fig. 3-16: Theoretical detonation temperature and normally reflected detonation temperature
for hydrogen-air mixtures [IAEA 1990] For a vented volume or a volume with weak surfaces, venting formula [NFPA 2002], [CEN 2004] may be a tool in order to predict the pressure applied. In case of a detonation, the loading may be divided in two parts [USACE 1990]: a shock pressure and a constant load.

20
3.2.2.2. Methods to Determine Structural Responses Forces acting on a structure will lead to a deformation to an extend which depends on the material properties and structure composition. For a static or quasi-static load, i.e., a constant or slowly changing load like from a simple deflagration, it will be in equilibrium with the internal forces resulting in a deformation of the structure. For a dynamic load, i.e., a fast load transient, however, a “dynamic” contribution from inertia forces will add to the equilibrium, which can show positive or negative acceleration, i.e., mass and stiffness of the structure will play a major role. The load from a gas explosion is considered a dynamic load due to its short overpressure duration, which is typically in the range of 100 - 200 ms. Detonations tend to excite the high natural frequencies of a building, whereas deflagrations are more effective for the lower frequencies. It appears to be technically more difficult to design a building against both explosion modes rather than only one. Methods used in order to determine structural response and resistance belong to three main categories:
• empirical methods that are widely used in risk assessment and that are mainly based on pressure peak values or P-I diagrams;
• analytical methods • numerical methods that can be handled with the help of a CFD code coupled with a finite
element method; a) Empirical Methods Methods Based on Pressure Peak Values An empirical and very global approach of determining the strength of structures is to relate overpressures to the degree of observed damage. This very useful and easy handling method is widely used. The relationship between pressure and damage, which is derived from TNT explosions, cannot satisfactorily be transferred to vapour cloud explosions. The pressure decay from a TNT explosion is much faster than from a vapour cloud explosion. The high impulse and the suction effect due to the below-atmospheric pressure phase will certainly result in a different damage pattern. Thus damage criteria such as those derived by Schardin (see Fig. 3-17) from TNT explosions are not directly applicable [Giesbrecht 1988].
Fig. 3-17: Schardin destruction curves for detonation waves, from [Giesbrecht 1988]

21
Many pressure criteria were defined in the past related to various structures and specific components, however, varying over a large uncertainty range. A rough classification is given in Table 3-1.
Table 3-1: Damage classification, from [TNO 1992]
Zone Damage level Overpressure of incident blast wave [kPa]
A Total destruction > 83
B Heavy damage > 35
C Moderate damage > 17
D Minor damage > 3.5
A pressure peak for domino effect really useful for risk assessment may also be defined at a value of 20 kPa [MEDD 2004]. Methods based on P-I diagrams Another global approach may couple pressure peak with impulse. The impulse, i.e., the pressure – negative and positive – integrated over time, is a measure for the explosion energy (Fig. 3-18), which also varies in time and space over the exposed structure surface. Damage to the structure resulting from a blast wave may be subdivided into direct effects and what is named “progressive collapse”, a kind of secondary failure following the change of the load pattern on a structure due to the direct effects. Features of a P-I diagram are the asymptotes in P and I direction and the monotonic relation between P and I, which suggests a subdivision into three regimes: impulse-controlled, peak load-controlled, and an intermediate dynamic stage [Li 2002]. P-I diagrams are being widely used in damage assessments not only for structural damage, but also for predicting blast-induced human injuries. They are providing useful information on the vulnerability of targets.
Fig. 3-18: Transient behaviour of impulse, from [FEMA 2003] Damage levels can also be visualized in pressure-impulse diagrams, where different regions can be defined by iso-lines. An example is given in Fig. 3-19 showing the experimental results for the observed damage in per cent, after different types of houses were exposed to a certain explosion (pressure/impulse) load [TNO 1992]. Important for the damage effect of a short-term load (= shock

22
wave) is only the impulse, whereas it is the maximum overpressure for that of the longer-term load (= pressure wave). The solid lines in the figure indicate the lower boundaries for light damages, for severe damages, and for collapsing structures of the houses investigated.
Fig. 3-19: Pressure-impulse diagram with experimental damage values for different types of houses,
from [Mercx 1991] The estimation of the level of damage is usually done taking either fixed-limits methods or the PROBIT method. In a fixed-limits method, the hazard level is compared to fixed limits like IDLH (Immediately Dangerous to Life or Health) values or pressure thresholds, as given in the literature. It is a simple method, but may lead to wrong conclusions in transient hazards. In such cases, the PROBIT method is the more appropriate one. First a hazard load, L, is estimated, which could be the overpressure in an explosion or the integrated thermal flux at a certain location. Then the PROBIT or probability unit, y, is given by y = k1 + k2*ln L, which can be related to a certain probability of death, injury, or damage. k1 and k2 are empirical parameters, which are specific to, e.g., toxic chemicals or fire and explosion effects and can taken also from the literature [CSChE 2004]. For the assessment of the probability to obtain a certain level of damage, so-called probit functions have been introduced and suitable damage criteria have been defined [TNO 1992]. Computer simulation techniques have been developed by SRI International, USA, for analyzing hydrogen explosions and the subsequent response of structures and humans. The thermodynamic code TIGER is used to calculate explosion pressures and expansion characteristics, which are input to the DYNA3D model to determine the impact on structures. A simplification of the blast load damage analysis has led to the development of the pressure-impulse (PI) methodology which is based on the observation that for a broad range of structures, the final damage state depends on peak pressure (P) and total impulse intensity (I) only. This methodology allows for a quick and easy evaluation of accident scenarios by employing a continuously growing library of pressure-impulse load and damage curves that are based on either experimental data or computer simulations [Sanai 1996].

23
b) Analytical Methods A structure can be schematically represented by a system of masses coupled with springs or dampers. For the static case, if linear-elastic or non-linear-elastic forces are acting, displacements of the masses become zero again, when the load disappears. In case of plastic or elasto-plastic behaviour, displacement is zero or very small, until the maximum load is reached. Under a static load, the structure will then fail; under dynamic load, it may retain a residual displacement. In general, structures must be designed to react elastically under typical loads like wind. Plastic displacement must be limited to abnormal load conditions. The maximum displacement depends on load duration, tD, and the natural frequency of the structure, T. For low tD/T ratios, the displacement is smaller than for static loads. For large tD/T ratios, the displacement can be larger than under static load conditions. Other important parameters are the static strength and the ductility. Load schemes are distinguished between a step function for a long-duration pressure wave and an impulse load for a short-impact shock wave. Detonations tend to excite the high natural frequencies of a building, whereas deflagrations are more effective for the lower frequencies. It appears to be technically more difficult to design a building against both explosion modes rather than only one. However for hydrogen explosions experience proves that detonations or strong deflagrations must be preferred. Several analytical procedures may be distinguished. They have to be coupled with structural engineering calculations. Still these methods are likely to lead to very conservative structural designs, and are rather suitable for hand calculations. A comparison between detonations of explosives and blast waves resulting from nuclear weapon explosions, characterized by quasi-static pressure due to a longer impulse time shows that, assuming the same damage, the detonation pressure or the pressure resistance of an object is much higher than the resistance against a blast wave from nuclear tests [Pfoertner 1975]. The pressure resistance behaviour of a building under detonative dynamic and quasi-static loading derived from numerous detonative explosion studies can be summarized in an empirical equation for the quasi-static reference overpressure of the building pst:
pst = 0.15 ∗ pr2/3,
where pr is the perpendicularly reflected overpressure or the pressure resistance of the building subjected to a detonation. If the TNT equivalent, as derived from the damage of some of the severe accidents, is interpreted as the incident pressure wave in the order of 70 kPa, resulting from a deflagration, the respective quasi-static pressure would be with pst = 22 kPa much smaller. Dynamic Load Factor DLF The analytical procedure is usually simplified by introducing a so-called dynamic load factor (DLF), which is defined as the ratio of maximum dynamic displacement over static displacement. It transforms a dynamic peak load into a static load with the same effect on the structure. The DLF is dependent on the dynamic load time and the natural frequencies of the structure. For long explosion times and in case of an idealized triangle-shaped shock wave load, the DLF approaches its boundary limit of 2 [MEDD 1994]. Single Degree-of-Freedom Model SDOF In a simple method, a static working load is assumed to simulate the effects of blast loads onto structures. This conservative approach, however, cannot predict structure performance and seems to be not optimal for transient blast loads. An improvement of modelling is given with the quasi-static methods which specify a triangular pressure pulse and determine the dynamic structural capacity as a function of the material strengths of the structure. The structural response can be found by using the charts. Single degree-of-freedom (SDOF) models analyze critical components in terms of their structural resistance and predict the response of the structure which then determines the damage level [USACE 1990].

24
c) Numerical Methods More information is obtained from multi-degree-of-freedom (MDOF) models, sophisticated CFD models with the possibility to consider flame propagation and pressure profiles also from local explosions. Dynamic finite-element analyses with tools such as ADINA, LS-DYNA, AUTODYN, ABAQUS Explicit may provide the best judgement on whether or not a structure is able to withstand a blast wave. However, one must be very careful when using software which is still under development and which is still not fully validated to industrial applications. Numerical methods are also usually very sensitive to parameters and calculation grid changes.
3.2.3. Heat Radiation There exists an extensive published literature on flame radiation from hydrocarbon flames and pool fires (see, for example, [De Ris 1979; Tien 1982; Mudan 1984; Faeth 1985; Viskanta 1987]). However, there is a limited number of studies on hydrogen flame radiation, particularly on large scale. Thermal radiation is a primary mode of heat transfer. Radiation is the dominant mechanism of heat transfer in large fires involving hydrocarbons, producing intermediate unstable radicals (e.g., O, H, OH, N, etc.) and stable non-luminous gaseous combustion products (CO2, CO, H2O, NOX, etc.) and soot particulates. The contribution to the radiative transfer in flames can be regarded as due to luminous and non-luminous radiation. Non-luminous flame radiation originates from transitions in the molecular energy levels due to the absorption or emission of photons. Discrete absorption-emission lines of radiation are produced in the infrared spectrum as a result of transitions between quantised electronic states for monatomic gases. Energy released by the gaseous combustion products results from the transitions between the vibrational and rotational energy levels of the molecules of gas species, particularly CO2, H2O, CO, etc., producing non-luminous radiation concentrated in spectral lines. These gases do not scatter radiation significantly but they are strong selective absorbers and emitters of radiant energy. In practical engineering systems, where pressure and geometric scales are large, pressure broadening of spectral lines cause them to overlap with each other, The resulting radiation is thus concentrated in gaseous absorption bands in infrared spectrum produced by various types of transitions between the molecular energy states, particularly the vibrational-rotational states. In luminous flames a continuum radiation in the visible and infrared is also emitted by the unburnt carbon particulates called soot that contribute greatly to the luminosity of the flames. The actual quantity and distribution of combustion products and/or soot produced in fires depend on the type and configuration of fuel and local supply of oxygen. In contrast to hydrocarbon fuels, the hydrogen burns more cleanly in air, producing non-luminous, almost invisible, pale blue flame due to spectral water vapour bands. In order to understand thermal radiation hazards from hydrogen flames, it is crucial to understand the relative assessment of the physical properties and combustion characteristics of hydrogen and hydrocarbon flames. Table 3-2 provides comparison of the physical properties of hydrogen with hydrocarbon methane.

25
Table 3-2: Physical properties of hydrogen and methane Hydrogen Methane Auto-ignition temperature 520°C 630°C Heat of combustion (lower heating value) (upper heating value)
119.9 MJ/kg 141.9 MJ/kg
50.1 MJ/kg 55.6 MJ/kg
Lower flammable limit (in air) 4.0 vol% 5.3 vol% Upper flammable limit (in air) 75.0 vol% 15 vol% Stoichiometric mixture (in air) 29.5 vol% 9.5 vol% Density (@ 20°C, 100kPa) 0.08988 kg/m3 0.71 kg/m3 Diffusivity (@ 20°C, 100kPa) 0.61 cm2/s 0.16 cm2/s Viscosity (@ 20°C, 100kPa) 8.814 µPa-s 11.023 µPa-s Flame temperature (in air) 2045°C 1875°C Minimum ignition energy (in air) 0.017 mJ 0.274 mJ 3.2.3.1. Flammability and Combustion Characteristics Hydrogen has a much wider range of flammability in air (4% to 75% by volume) than methane (5% to 17% by volume), propane, or gasoline, and the minimum ignition energy (for a stoichiometric mixture) is about an order of magnitude lower (1/16th that of methane). In many accidental situations the lower flammable limit (LFL) is more important. The LFL for hydrogen is similar to that of methane, about twice that of propane, and four times that of gasoline. In addition, the minimum ignition energy for hydrogen at the LFL is also similar to that of methane. Hydrogen-air mixture can burn either as a jet flame at a fixed point, with combustion taking place along the edges of the jet where it mixes with sufficient air. In a stationary mixture in the open with no confinement a flammable hydrogen mixture will undergo slow deflagration. Deflagration refers to a flame that relies on heat- and mass-transfer mechanisms to combust and move into areas of unburned fuel. If the flame speed is accelerated, perhaps due to extreme initial turbulence or turbulence induced by obstacles or confinement, the result is an explosion. In the extreme case the flame speed becomes supersonic and results in detonation. Once initiated, detonation is self-sustaining (no further turbulence or confinement is required) as long as the combusting mixture is within the detonable range. The heat of combustion of hydrogen per unit weight is higher than any other material, but hydrogen has a relatively low heat of combustion per unit volume. Thus the combustion of a given volume of hydrogen will release less energy than the same volume of either natural gas or gasoline. 3.2.3.2. Radiation Characteristics In contrast to other hydrocarbon fuels, a hydrogen flame radiates significantly less infrared (IR) radiation (heat) and virtually no visible radiation (light). As a result, hydrogen burns with a pale blue, almost invisible flame that is almost visually imperceptible in artificial light or daylight. However, in contrast to hydrocarbon flames, hydrogen flame also emits some limited amount of radiation in the ultraviolet (UV) region around 180 to 300 nm, which is exploited by UV detectors to detect hydrogen flame. Most UV detectors are made immune to solar sensitivity by using a sensing device only sensitive to the UV radiation below the 360-nm range. The lower radiation from a hydrogen flame makes the flame itself hotter than a hydrocarbon flame, and objects engulfed by a hydrogen flame tend to heat faster. However, the lower radiation of heat from the flame means that less heat is radiated to objects or people outside the flame. The consequence of the almost invisible hydrogen flame is that the human physical perception of the heat from a hydrogen fire does not occur until direct contact with the combustion gases. This problem

26
is often resolved by throwing a dry fire extinguisher or dust into the air that will cause the flame to emit visible radiation. 3.2.3.3. Radiation Emissions from Intermediate Radicals and Atoms in Hydrogen Flames The combustion chemistry of hydrogen flame gives rise to H, O and N atoms, and OH radicals, which emit specific peaks at specific wave lengths. The typical emission spectrum of the laser-induced plasma spectroscopy (LIPS) formed in hydrogen-air flame in the infrared region is shown in Fig. 3-20, and their wavelengths are listed in Table 3-3. LIPS is a promising method that enables spatially resolved elemental analysis of various chemical species based on their atomic emissions. The spectrometer was set to be centred at a wavelength of 720 nm so that atomic emissions of hydrogen H, nitrogen N, oxygen O, and tungsten W could be observed simultaneously. The continuum spectrum is also observed with the emission lines, which is mainly due to the recombination of ions with free electrons.
Table 3-3: Wavelength of each emission line [Itoh 2001] Element Wavelength [nm]
H 656.3 N 742.4, 744.3, 746.9, 818.5, 818.8, 821.6, 822.3, 824.2 O 777.2, 777.4, 777.5, 844.6
Fig. 3-20: A typical spectrum of laser induced plasma spectroscopy (LIPS) in a hydrogen-air flame
for wavelength range of 550-900 nm, from [Itoh 2001] More recently, Choudhuri and Gollahalli [Choudhuri 2004] have used laser-induced fluorescence (LIFS) technique for measurements of H atom near 656 nm (2s → 3p) O atom near 845 nm (3s 3S), and OH hydroxyl radical in the UV region near 315 nm. The OH radical is one of the important intermediates in the combustion reaction mechanism, which is a reliable indicator of the flame zone, flow structure and flame temperature near stoichiometry. Here, the flame temperature was determined by measuring the rotational energy distribution of the OH radical at the excitation of (1,0) band of (A2 Σ ← X2 Π) system. Please note that it is not possible to avoid interference of the photolytic production of O atom at the wavelength of 845 nm with the adjacent NO excitation band (1,1) of (A2 ∆ ← X2 Π) system. Here the symbols s, p, d stand for the

27
atomic orbitals and Σ, Π, ∆ stand for the molecular orbitals. Maximum statistical uncertainties in measurements were estimated to be 20-30 K in the temperature range. 3.2.3.4. Radiation Emissions from Water Vapour Bands The hydrogen-air flame emit infrared (heat) radiation mainly due to water vapour bands in the 1-6 µm wavelength region. The contribution of atoms and radicals to heat radiation in hydrogen flame is negligible. However, as mentioned earlier, OH radical effects the maximum temperature of the flame. Figure 3-21 shows the comparison of the predicted and measured radial temperature distribution of H2-air flame for different degrees of dilution by natural gas (NG), the dilution ranging between 0 and 100%. The measured values shown in Fig. 3-21(a) have been derived from OH fluorescence signals, and the predicted values shown in Fig. 3-21(b) have been computed using detailed chemical kinetics.
Fig. 3-21: Radial temperature distribution at the near-burner region, from [Choudhuri 2004] (a) spectrally derived from OH measurements (b) computed using detailed chemical kinetics
It can be seen from the figure that the peak temperature of the 100% hydrogen-air flame is 2320K and that of the 100% NG-air flame is 1600K. The lower peak temperature of the NG flame is attributed to the higher heat losses both in the form of banded non-luminous radiation from CO2 and continuous luminous radiation from solid soot particulates, which are absent in the H2-air flame. Both flames have heat losses from banded non-luminous radiation from H2O. The computed stoichiometric temperature contours using the detailed chemical kinetics show a similar trend for the different mixture conditions. Compared to experimental results, predicted temperatures are higher and steeper in shape for all mixture conditions. Liu et al [Liu 2004] have considered 6.3 µm, 2.7 µm, 1.87 µm, and 1.38 µm infrared bands of water vapour to calculate frequency distributions of radiative source terms. Due to different band intensity parameters and temperature for each band, the symmetrisation of frequency distributions in each band is different. The symmetrisation of frequency distributions for the radiative source term at 6.3 µm and 2.7 µm bands is better than at 1.87 µm and 1.38 µm bands.
(a)

28
3.2.3.5. Effect of Turbulence on Flame Radiation Flame radiation intensities or fluxes are often computed from mean properties (e.g., mean emissivity, mean flame temperature). However, Cox [Cox 1977] has shown that neglecting turbulent fluctuations could cause significant error in flame radiation intensities, which is due to non-linear nature of radiation properties. Assuming a grey gas, the mean radiation intensity can be represented as:
4.0
''4,';...61
2
4
2
2
4
>
=
==
+
+
+=
−
−−−−
−−
−
−
−−−−
T
Awhen
TI
TBTAT
B
T
ATI
πεσφ
εεπ
εσφ
where σ is the Stefan Boltzman constant, φ is the geometrical view factor, ε is the grey gas emissivity of flame, T is the flame temperature, and I is the flame intensity. While this result suggests a strong effect of turbulence on radiation properties, the grey gas approximation is not very appropriate for turbulent flames. However, Faeth et al [Faeth 1985] have shown that the use of mean properties, in conjunction with existing narrow band models, provide an adequate framework for estimating flame radiation in both non-luminous and luminous flames. Fig. 3-22 shows the comparison of the predicted spectral radiation intensities by the mean and stochastic property methods with measurements, in the 1-6 µm wavelength range, for a turbulent hydrogen/air flame. The stochastic method is based on the assumption that the turbulent flow field consists of many eddies and that the properties of each eddy are uniform and statistically independent of one another. The figure shows that for hydrogen/air flames, effects of turbulent fluctuations are large, with as much as 2:1 difference between mean and stochastic property predictions. Faeth et al [Faeth 1985] have argued that this is because radiation properties of hydrogen/air diffusion flames vary rapidly near the stoichiometric condition.

29
Fig. 3-22: Spectral radiation intensities of hydrogen/air diffusion flame at NTP
3.2.3.6. Radiation Transfer Calculation Methods The theory of thermal radiation is very complex and an exact solution, even for reasonably simple situations, is generally impossible. The combustion products and soot, acting as participating media, add further complexity to the situation. Therefore, a wide range of calculation methods and mathematical models with varying levels of complexity and accuracy have been developed. A number of radiation solution methods exist for solving the equation governing the transfer of thermal radiation [Siegel 1981]. The methods differ in complexity and accuracy of the calculation of

30
view factors and economy of the solution algorithm. The most commonly used radiation solution methods and their key features are summarised below: Zonal or View Factor Calculation Method This popular method has been widely used by engineers to estimate the radiative transfer in the absence of detailed knowledge of participating media. The walls and interior of the enclosure are divided into zones of finite size. View factors are defined which are measures of the radiation exchange occurring between pairs of zones. This procedure results in n simultaneous equations for each of the n zones and leads to a system with a n2 x n2 matrix. This method is very accurate but its main drawback is that the view factor, for each geometry, must be worked in advance and for complex geometries the view factors are not available [Hottel 1958]. Statistical or Monte-Carlo Method The purely statistical methods, such as the Monte-Carlo method, usually yield radiation heat transfer predictions as accurate as the exact method. There is no single Monte-Carlo method because there are many different statistical approaches. The simplest Monte-Carlo method is based on simulating a finite number of photons (discretised energy bundles) histories through the use of a random number generator. For each photon, random numbers are generated and used to sample appropriate probability distributions for scattering angles and path lengths between collisions. As the number of photons initiated from each surface and/or volume element increases, this method is expected to converge to the exact solution of a problem. Thus, this statistical method is numerically precise provided the number of photons is large and the random number generator of the computer good enough. Furthermore, in contrast to the zonal method, the Monte-Carlo method does also not suffer from the calculation of view factors in advance because the view factors are automatically calculated as the randomly chosen energy release bundles are tracked through the enclosure containing the fire. However, since the directions of photons are obtained from a random number generator of the computer used, the method is always subjected to statistical errors and lack of guaranteed convergence but this would improve as the next generation of computers (with more powerful random number generators) become more readily available [Howell 1964]. The Flux (or Multi-Flux) Method The radiation intensity is a function of the location, the direction of propagation of radiation and of wavelength. Usually the angular dependence of the intensity complicates the problem since all possible directions must be taken into account. It is, therefore desirable to separate the angular (directional) dependence of the radiation intensity from its spatial dependence to simplify the governing radiation transfer equation (RTE). If it is assumed that the intensity is uniform on given intervals of the solid angle, then the RTE can be significantly simplified as the integro-differential RTE would be reduced to a series of coupled linear differential equations in terms of average radiation intensities or fluxes. This procedure yields the flux methods. By changing the number of solid angles over which radiative intensity is assumed constant, one can obtain different flux methods, such as two-flux for one-dimensional geometry, four-flux for two-dimensional geometry or six-flux methods for three-dimensional geometry. The accuracy of flux-methods will increase by increasing the number of fluxes. The six-flux methods have been reasonably successful for fire spread and smoke movement inside compartments [Kumar 1989; Kumar 1991]. They are not suitable for predicting flame spread over surfaces or flames projecting outside openings, where finer discretisation of the solid angle than offered by the six-flux method would be necessary [Gosman 1973].

31
The Discrete Ordinate Method The discrete-ordinate method [e.g., Chandrasekhar 1950, Lockwood 1978, Fiveland 1982] was originally suggested by [Chandrasekhar 1950] for astrophysical problems. It is derived by applying discrete-ordinate approximation to the RTE through discretising the entire solid angle (Ω = 4π) using a finite number of ordinate directions and corresponding factors. A simpler version of the method is also called SN-approximation because it is obtained by dividing the spherical space into N equal solid angles. More accurate SN-approximations of the N discrete ordinates are obtained by using Gaussian or Lobatto quadratures and choosing N discrete values of the direction cosines ξn, ηn, µn such that they satisfy the identity ξn
2 + ηn2 + µn
2 =1.The SN-approximation has been used successfully for two-dimensional cylindrical and rectangular radiative transfer problems with combustion chamber applications, where reasonably accurate results were obtained in comparison to exact solutions [Fiveland 1982; Fiveland 1984]. However, the method suffers from the so called “ray effects”, causing anomalies in the scalar flux distribution [Lathrop 1968; Lathrop1971]. The ray effects are particularly more pronounced when there are localised radiation sources in the medium (e.g., flame in an enclosure) and radiation is less important in comparison to absorption. Clearly, as scattering increases and radiation field becomes more isotropic, they become less noticeable. However, with increasing scattering and/or optical thickness, the convergence rate may become slow [Lewis 1984]. The Discrete Transfer Method The discrete transfer method is a mixture of the Monte-Carlo, zone and flux methods [Lockwood 1981]. Similar to the zone method, the enclosure is divided into cells and equation is analytically integrated along rays in each cell, but the method is much faster and the calculation of the view factors is an inherent feature of the procedure. The only drawback of the method is that to obtain ray-insensitive solution the method may require more rays than affordable on economy grounds for practical problems [Cumber 2000]. 3.2.3.7. Gas Property Models for Participating Media The radiative properties (absorption and scattering coefficients) of the combustion products and enclosure wall emittance are required for the modelling. In an enclosure fire, the gas radiative properties vary considerably from the comparatively transparent entrained air close to the floor to the highly emissive, luminous flames of fire source, and the optically dense ceiling smoke layer. Various models are available to predict the gas radiative properties. The participating media models (see, for example, [Tien 1982]) currently available for characterizing the flaming and smouldering fires and the resulting combustion products differ in their generality, sophistication, accuracy and computational cost. They are assessed in terms of their ability to predict radiative heat transfer from one-dimensional, idealised representations of the internal structure of buoyant and jet fires. Exact results can be obtained by line-by-line calculations of spectral absorption-emission lines of molecular gases. However, such calculations are useful in the study of radiative transfer in the atmosphere but are not practical for most engineering applications, and are therefore not discussed here. Narrow-band and wide-band models constructed from the spectral lines, and on a simpler level, the grey gas representation of the molecular spectrum can be considered. The simplest treatment for the case of enclosure fire is to consider the gas to be a grey gas of prescribed constant absorption coefficient.

32
Narrow Band Model A well known narrow band model is that proposed by Grosshandler and Modak [Grosshandler 1981], which is based on the statistical model by Goody [Goody 1964] for tri-atomic molecules with equal line strengths within each narrow band region, and with homogeneous effects accounted for through the Curtis-Godson approximation which employs suitable averages along a line-of-sight. For hydrogen flame, the five gas bands of the H2O, the main combustion products in the infrared region (1-6m) are considered which are 1.14 µm, 1.38 µm, 1.87 µm, 2.7 µm and 6.3 µm. For flames involving mixtures of hydrogen and hydrocarbon (e.g., hydrogen flame diluted by CH4), band overlap is also taken into account for multiple bands and mixture of CO2, H2O, CO and CH4 gases, particularly for 4.3 µm of CO2, 2.3 µm and 3.3 µm of CH4, and 4.7 µm of CO. Wide Band Model Edward and Balakrishnan [Edwards 1973] developed a spectral version of exponential wide band model, which is based on the fact that the absorption and emission of radiation by a molecular gas is concentrated in between one and six vibrational bands. Within these bands, the spectral lines associated with rotational modes of energy storage are reordered in wave number space with exponentially decreasing line intensities moving from the band head. The band shape is then approximated by one of the three simple exponential functions, with radiative properties of each absorption band obtained from specified model parameters. Grosshandler’s Total Transmittance, Non-Homogeneous (TTNH) Model The total transmittance, non-homogeneous (TTNH) model for CO2 and H2O mixture is based on total transmittance data for homogeneous systems, with effective pressure-path lengths and temperatures for non-homogeneous systems taken as gas concentrations weighted averages along a line-of-sight [Grosshandler 1980]. Mixed Gray Gas Model The most popular mixed grey gas model for modelling combustion products (including soot) from fires is that proposed by Truelove [Truelove 1976], which is based on representing the banded spectra of CO2 and H2O as a mixture of clear and grey gases. The total emittance of the combined emissions of the CO2 and H2O vapours was obtained by Truelove by fitting the spectral data of the gases as grey gas mixture of one clear and three grey gases. Banded Mixed Gray Gas Model Truelove’s mixed grey gas model, employing one clear and three grey gas representations, can be written in a banded form where, for a given model spectrum, the grey gas weightings are determined as the fractional amount of black body energy in the spectral regions where “grey gas absorption coefficients” exist [Modest 1991]. Recently, Cumber and Fairweather [Cumber 1999] have improved the method by incorporating CO and CH4 emissions. Expressing total absorptivity and emissivity of a gas in terms of the weighted-sum of grey gases are useful, especially for the zonal method of analysis of radiative transfer.

33
3.2.4. Physiological Impact 3.2.4.1. Jet Impact from High-Momentum Releases
potential knowledge gap - intentionally left blank 3.2.4.2. Damage by Low Temperature Releases Skin contact with liquid hydrogen or cold hydrogen gas may cause severe cold burns, comparable with those caused by boiling water. Unprotected skin may freeze onto surfaces cooled by the liquid, causing severe damage on removal. Prolonged skin exposure to cold hydrogen may result in frostbite. A symptom is local pain which usually gives warning of freezing but sometimes no pain is felt or it is short-lived. Frozen tissues are painless and appear waxy, with a pale whitish or yellowish colour. Thawing of the frozen tissue can cause intense pain. Shock may also occur. The eyes are particularly susceptible – even small splashes of liquid hydrogen, or short exposures to cold vapour or gas, may cause instant freezing of eye tissues and permanent damage. Transient exposure to very cold gas produces discomfort in breathing and can provoke an attack of asthma in susceptible people. Prolonged inhalation of cold vapour or gas may cause serious lung damage. Prolonged exposure of the entire body to cold can result in hypothermia. 3.2.4.3 Asphyxiation by hydrogen Hydrogen is not poisonous, but as with any gas (except oxygen) a risk of asphyxiation exists mainly in confined areas as a result of oxygen depletion. Normal air contains around 20.8 % of oxygen, by volume. Besides the dilution by mixing with other gases, oxygen may be consumed in combustion of hydrogen or other burning gases and may be depleted via condensation on very cold surfaces like liquid hydrogen pools. Thus diluting the oxygen volumetric content below 19.5 % will cause effects on human beings. Alarm levels are generally set at 19 % oxygen. This is less than 2 % below normal levels, so it is important that sensors are precise and stable in order to avoid false alarms. The different stages of asphyxiation at ground level are related to the remaining oxygen concentration as shown in the following Table 3-4.
Table 3-4: Asphyxia – Effect of O2 concentration, from [NASA 1997], partially accomplished and synchronized with [DNV 2001] data
O2 [vol %] Effects and Symptoms 19-21 No discernible symptoms can be detected by the individual. 15-19 Reduction of physical and intellectual performance without the sufferer
being aware. Early symptoms in persons with heart, lung, or circulatory problems may be induced.
12-15 Deeper respiration, faster pulse, poor coordination 10-12 Headaches, giddiness, poor judgement, slightly blue lips.
Risk of death below 11 vol %, tolerance time 30 min 8-10 Nausea, vomiting, unconsciousness, pale face, fainting within a few
minutes without prior warning, mental failure, tolerance time 5 min 6-8 Fainting occurs after approximately 3 min. Death in 8 min; 50 % death
and 50 % recovery with treatment in 6 min, 100 % recovery with treatment in 4 to 5 min.
3-6 Coma in 40 s, respiration ceases, death or permanent brain damage, even if rescued
0-3 Death within 45 s

34
3.2.4.4 Pressure effects from explosions Direct Blast Effects These direct effects, also called primary effects, are caused by the dynamic pressure waves. Although the human body is able to adapt to slow pressure changes (diving, high altitudes, etc.) the dynamic changes in a blast front may cause severe damage. Those organs where large differences in densities are encountered, like the lung or the inner ear, are particularly vulnerable. Ear damage is not leading to death, but due to the ears’ high sensitivity it is often used as an indicator for an exposure. Lung damage is depending on a combination of peak overpressure Ps and on the pulse duration tp (Fig. 3-23).
Fig. 3-23: Simplified relationship between positive impulse and time of the overpressure peak Similar as for the structural effects threshold limits for ear and lung damage are displayed in pressure-impulse diagrams (Fig. 3-24).
Fig. 3-24: Threshold data, from [Baker 1983, NASA 1997],
and gaseous detonation data, from [Dorofeev 1995]
103
104
105
106
100 101 102 103 104 105
Positive impulse I + [Pa*s]
Pos
itive
ove
rpre
ssur
e P s[
Pa]
Lung rupture
NASA 50% ear drum rupture
ear drum rupture
Temporary ear threshold shift
FZK experiments
2g H2
16g H2
16g H2
2g H2
Unconfined gaseous detonations
Skull fracture (60 kg body weight)
Lethality from whole body impact (60 kg body weight)
Ps
I+
t
tp =2 I+/ Ps
tp

35
However, as impulse and pressure are correlated, the coordinates pressure and pulse duration provide a clearer and decoupled view. The transformed data are given in Figure 3-25.
Fig. 3-25: Threshold data converted to pressure over impulse duration
Not only for the general mixing and detonation initiation but also for the physiological effects the spatial confinement is a very important factor. Generally one has to expect an increased immediate and late mortality in closed space blast scenarios compared to open-air explosions [Kluger 2003], [Kaiser 2002]. However, usually only little mortality is due to these primary effects compared to the more severe combination of indirect blast effects, like missiles, body translation and associated impact and heat effects. Indirect Blast Effects Indirect blast effects include secondary effects, these are generated by missiles (e.g. accelerated parts of the pressure vessel, parts of the building, glass, etc.) and tertiary effects linked to the body translation. Especially the impact, the deceleration when hitting a wall or any other a solid structure, can cause skull fractures with traumatic consequences, even death. With a simplified model the body displacement caused by the blast may be calculated and a lethality threshold may be attributed to the resulting velocities, see [Baker 1983]. See Figures 3-24 and 3-25 with the skull fracture as the representative indirect blast effect. 3.2.4.5 Thermal effects from fires These effects are also called quaternary effects. Basically there are two phenomena linked with hydrogen fires which could harm human beings: elevated air temperature and heat radiation. Depending on the scenario only one of both or a suitable combination has to be considered. Elevated Air Temperature Effect Below 70°C no severe effect has to be expected. Between 70°C and 150°C the time to incapacitation may be 94 minutes and 6 minutes, respectively [TNO 1992]. Fig. 3-26 shows a plot of the empiric dependency.
10-4 10-3 10-2 10-1 100 101
Positive impulse duration tp[s]
NASA 50% ear drum rupture
ear drum rupture
FZK experiments
2g H2
16g H2
16g H2
2g H2
Skull fracture (60 kg body weight)
Pos
itive
ove
rpre
ssur
e P s
[Pa]
103
104
105
106
Lung rupture Unconfined gaseous
detonations
Temporary ear threshold shift

36
Fig. 3-26: Time to incapacitation as a function of the air temperature [TNO 1992]
Other physiological responses are summarized in the following Table 3-5.
Table 3-5: Elevated air temperature effects Temperature
[°C] Effects and Symptoms
127 Difficult breathing 140 Tolerance time 5 min 149 Mouth breathing difficult, T limit for escape 160 Rapid, unbearable pain with dry skin 182 Irreversible injury in 30 s 203 Respiratory systems tolerance time less than 4 min with wet skin
Above 150°C, radiation effects become the dominant factor. Heat Radiation Effect Heat radiation may cause pain, first, second and third degree burns as well as fatal burns. The different burn types are characterized by the depth they reach in the skin. Similar as for the pressure effects a combination of the peak load, here radiation intensity, and the characteristic duration are the most important factors. Above 1.6 kW/m2 negative effects on human beings have to be expected. The following Table 3-6 relates exposure times and pain thresholds.

37
Table 3-6: Threshold of pain, from [Kaiser 2002] Exposure time
[s] Radiation Intensity
[kW/m 2] (lightly clothed)
60 1.7 40 2.3 30 2.9 16 4.7 9 6.9 6 9.5 4 11.7 2 19.9
The fatality rate may be calculated by use of probit functions. Prominent probit functions are the Eisenberg functions and the TNO functions. The first is based on nuclear radiation, the second on the radiation of hydrocarbon fires. So, both are not directly applicable to hydrogen fires.
Potential knowledge gap: suitable probit function The following Table 3-7 based on the TNO probit function relates the exposure time and the radiation intensity for 100 % fatality:
Table 3-7: Maximum radiation exposure time [DNV 2001] Exposure time leading to death Radiation intensity
[kW/m 2] (lightly clothed)
Radiation intensity [kW/m 2]
(protectively clothed) 2 min … 10 min 2 4 1 min … 2 min 4 8 0.5 min … 1 min 10 13
< 0.5 min 16 25 Besides the infrared content hydrogen combustion produces UV radiation capable of sunburn-like effects. Hydrogen fires are difficult to see at daylight and due to the optical properties, the heat of smaller flames is felt late. 3.2.4.6 Personal Protective Equipment [ISO 2004] Using the appropriate protective equipment can reduce the possible consequences of the above described hazards. The concerned personnel should be protected against exposure to cryogenic temperatures, high temperatures, thermal radiation from a hydrogen flame, and oxygen-deficient atmospheres. Procedures that are established for operations involving hydrogen should describe the personal protective equipment (PPE) that is needed for the operations to be performed. Some general guidelines for PPE that should be considered beneficial in working with hydrogen are summarized below. These guidelines do not address PPE that should be considered when involved in other activities such as working on electrical circuits or performing a cleaning or decontamination operation. Some specific recommendations for PPE are:
• Eye protection or better complete face shield should be worn when liquid hydrogen is handled, • Properly insulated gloves should be worn when handling anything that comes in contact with
liquid hydrogen or cold gaseous hydrogen. The gloves should fit loosely, remove easily, and not have large cuffs.
• Full-length trousers, preferably without cuffs, should be worn with the legs kept on the outside of boots or work shoes.

38
• Closed-toe shoes should be worn (open or porous shoes should not be worn).• Clothing made of ordinary cotton or flame-retardant cotton should be worn. Avoid wearing
clothing made of nylon or other synthetics, silk or wool because these materials can produce static electricity charges that can ignite flammable mixtures. Synthetics can melt and stick to the flesh, causing greater burn damage. Any clothing sprayed or splashed with hydrogen should be removed until they are completely free of hydrogen.
• Self-contained breathing equipment should be worn when working in a confined space that may have an oxygen-deficient atmosphere.
• Portable hydrogen- and fire-detection equipment should be used to warn of hydrogen leaks and fires.
• Alternatively it is often recommended to wave with a broom in front of oneself or to pluck some grass and throw it in the direction of the intended movement. If the broom or the grass comes in contact with the barely visible flame, the smoke indicates the flame position.
• Personnel should ground themselves before touching or using a tool on a hydrogen system.• The use of spark-proof tools is often recommended; however, the energy required for ignition
of a flammable hydrogen/air mixture is so small that even spark-proof tools can cause an ignition. Consequently, all tools should be used with caution to prevent slipping, glancing blows or dropping, all of which can cause sparks.
• Water sprays and wet clothes may reduce the thermal effects induced by hydrogen flames considerably.
The immediate treatment of persons which came in contact with liquid hydrogen or have been exposed to the very cold gases is to loosen any clothing that may restrict blood circulation and seek immediate hospital attention for all but the most superficial injuries. Do not apply direct heat to the affected parts, but if possible place in lukewarm water. Sterile dry dressings should be used to protect damaged tissues from infection or further injury, but they should not be allowed to restrict the blood circulation. Alcohol and cigarettes should not be given.
3.2.5. Effect on the Environment One major claim for the introduction of hydrogen based technologies is the promising environmental benefits of such technologies. Hydrogen is considered a clean fuel capable to avoid the greenhouse effect caused by carbon dioxide releases using fossil fuels. A supporting argument is as follows: Hydrogen may be produced by water electrolysis and under usage it is oxidized back to water without producing any pollutants. However, this is to a certain extent an idealistic view as the major amount of hydrogen is currently produced based on fossil fuels, though in the future hydrogen to a much higher degree may be produced using sustainable energy sources as e.g. wind or water power. The environmentally friendly production of hydrogen depends therefore strongly on the technology applied. The usage of fossil fuels like natural gas conversion to produce hydrogen (see chapter 2.2) may result in an increase of greenhouse gas emissions and other pollutants compared with the present situation. More fossil fuels are needed to produce enough “hydrogen energy” for the customers. A solution to avoid such pollution could be technologies of carbon sequestration and other cleaning measures to capture the pollutants to be considered for the specific fuel used, which also would favour central, large-scale hydrogen production and distribution facilities.

39
BIOSPHERETROPOSPHERE
TROPOPAUSE
STRATOSPHERE
STRATOPAUSE
MESOPHERE
MESOPAUSE
THERMOSPHERE
0
20
40
60
80
100
120
150 200 250 300 350 400
Temperature K
Alti
tude
km
Fig. 3-27: Definition of the atmosphere based on the average temperature profile,
from [Heicklen 1976] Hydrogen is a permanent gas and any diffusive, targeted or accidental release will emit predominantly into the atmosphere. Presently, the major sources for hydrogen emissions are biomass burning, e.g., forest fires, emissions from the traffic using ICE’s. It is also produced by photochemical atmospheric reactions of formaldehyde. It is resulting, e.g., from methane oxidation cycle in the atmosphere as shown in the following reaction equations where one photolysis path for formaldehyde (CH2O) is generating hydrogen.
2
2
2 2 2
4 3
,3 3 2
, ,3 2 3 2
2 2
H O
O M
NO NO O HO
h
CH OH CH
CH CH O
CH O CH O CH O
CH O CO Hν
−
+
+ − + − ⋅
+ ⋅ → ⋅
⋅ → ⋅
⋅ → ⋅ →
→ +
The hydrogen content of the atmosphere is compared to other atmospheric gases in Table 3-8 and is found to be on the trace gas level. The atmosphere is divided into different spheres as shown in Fig. 3-27 based on an average temperature profile, which is very important concerning the gas exchange between these spheres.
Table 3-8: Average relative composition of the troposphere at mid latitudes, from [Heicklen 1976] Gas Concentration
[ppm] Nitrogen, N2 780840 Oxygen, O2 209460 Argon, Ar 9340 Carbon dioxide, CO2 325 Sum of noble gases (He, Ne, Kr, Xe) 24.6 Methane, CH4 1.4 Hydrogen, H2 0.5 Nitrous oxide, N2O 0.25 Carbon monoxide, CO 0.08 Ozone, O3 0.025 Nitroxides, NO+NO2 0.006

40
The hydrogen concentration profile with altitude is found constant at a level of about 0.5 ppm in the troposphere and stratosphere as shown in Table 3-9. Only in the very high atmosphere, there is an increase of hydrogen.
Table 3-9: Average relative hydrogen concentration in different altitudes, from [Heicklen 1976] Altitude [km] Hydrogen [ppm]
0 0.5 20 0.5 40 0.5 60 0.5 80 4.3
100 1.0 Hydrogen is the only gas capable to escape into space, but it is found that nearly 100 % of the hydrogen is degraded by the photochemical atmospheric processes or deposited back to the biosphere. The atmospheric degradation accounts for about 25 %, while the dry deposition is about 73 %1 (Schultz 2004b). Therefore the biological processes to degrade hydrogen are very important for its overall atmospheric balance. These processes are not well understood presently as, e.g., the capacity for hydrogen degradation is unknown. The biosphere could be acting as a large buffer keeping the atmospheric hydrogen concentration constant even though the releases are increased due to the activities from a hydrogen economy. Recently some concerns on possible adverse environmental effects caused by large increased atmospheric hydrogen concentrations have been described in the literature. [Logan 1981; Schultz 2003; Tromp 2003; Prather 2003; Schultz 2004a; Wennberg 1998)]. In the following the present knowledge is presented. Hydrogen is not a greenhouse gas, as it does not absorb electromagnetic radiation within the infrared spectrum. Therefore higher atmospheric hydrogen concentrations will not directly contribute to the climate forcing. The consumption of hydrogen will result in water regardless its usage in fuel cells, being burned under controlled or uncontrolled conditions like under accidental fires or explosions. The water will be released into the troposphere with its normally huge content of water. So the additional water will not raise considerably the overall content of water vapour in the troposphere. An adverse effect is identified when hydrogen is atmospherically degraded in the lower stratosphere, where the persistent ice (from the water) may have a cooling effect that again influences the temperature dependent ozone depletion mechanism. This has a direct effect on the above mentioned possible cooling effect for the lower stratosphere, as it has been predicted through model calculations. It has been shown [Tromp 2003] that, e.g., a fourfold increase of atmospheric hydrogen will have considerable effects on the ozone depletion. For atmospheric photochemical degradation of hydrogen, the initiating and rate determining step is by an OH free radical reaction with hydrogen.
2 2
2 2M
H OH H H O
H O HO
+ ⋅ → ⋅+
⋅ + → ⋅
For atmospheric photochemical degradation of carbon monoxide or other hydrocarbons, the initiating and rate determining step is by an OH free radical reaction with the CO or the hydrocarbon leading to stable products and other free radicals. The later (blue coloured equations) are reacting with other
1 The current hydrogen releases are estimated as follows: 40 million tonnes/year from methane, VOC releases and their photochemical degradation, 16 million t/yr from biomass burning, 15 million t/yr from traffic and industries, and 6 million t/yr from soils and ocean. The sinks for hydrogen are: 19 million t/yr degraded by reaction with OH free radicals, and 56 million t/yr soil uptake. The numbers are uncertain and are estimated to be within ± 10 million t/yr for traffic and industry emissions and ± 15 million t/yr for soil deposition.

41
atmospheric components e.g. NO to give ozone and to regenerate OH free radicals in chemical and photolytic reaction steps. By that the atmosphere contains a stable OH concentration of about 106
molecules per cm3 that is sufficient to remove pollutants. 2
2 2
32
32 3
13 2
2
2 2
1
( )
( )
( )
( ) 2
h
O
M
h
NO HO OH NO
NO NO O
CO OH HO
P
O P O O
O O O S
O S H O OH
CO
ν
ν
+ ⋅ → ⋅ +
→ +
+ →
→
+ ⋅ →
+
+ →
⋅ +
⋅
The emissions of hydrocarbons and nitrogen oxides lead to the generation of ozone. While this is a very important protection against short wave ultraviolet radiation in the stratosphere, ozone is to be considered a pollutant in the troposphere. It is part of the effects that lead to “forest dead” by acid rain as ozone destroys the protecting wax layer on leaves, and it has adverse health effects to people. In summertime, dangerous ozone levels can build up leading to restrictions for traffic, e.g., in Germany to mitigate high ozone levels. Therefore the establishment of the hydrogen economy will improve the air quality in the cities as the hydrocarbon and nitrogen oxide emissions are reduced. On the other hand nitrogen oxide is an important intermediate for the generation of the constant background concentration of OH free radicals. Model calculations have shown that the OH concentration is slightly decreasing when the nitrogen oxide concentration is substantially decreased. By that the oxidative capacity of the atmosphere is slightly reduced that would give a bit longer lifetime for e.g. the green house gas methane thus supporting the climate forcing effect [Schultz 2003]. On the other hand, the emission of carbon dioxide will be reduced avoiding climate forcing. Nevertheless, less environmental pollution using hydrogen is only to be achieved using sustainable primary energy sources for hydrogen production. Using fossil fuels without carbon dioxide sequestration will result in total in even more pollutant emissions. Therefore the overall environmental benefits need to be assessed using live cycle assessments for the larger-scale production systems. Conclusions The environmental problems with hydrogen are connected with a strong increase of the emissions into the atmosphere. Most of the hydrogen is degraded in the biosphere. More precise knowledge on the mechanisms and capacities are needed to make better model calculations on the possible increase of hydrogen due to the new technologies based on hydrogen and fuel cells. At the moment, a precaution may be to reduce the emissions as much as possible, which is not only related to the environment, but also to safety, as hydrogen fires and gas phase explosions are very prominent concerns for hydrogen applications. There may also be some economic benefits as production, distribution and storage of hydrogen need substantial amounts of energy making the hydrogen rather costly, but more detailed analyses are needed here. Therefore it would be a win-win situation to minimize leakages.

42
3.2.6. References Baek S.W., et.al., Effects of Addition of Solid Particles on Thermal Characteristics in Hydrogen-Air Flame, Combustion, Science and Technology, 174 (2002) 99-116. Baker W.E., et.al., Explosion Hazards and Evaluation, Fundamental Studies in Engineering 5, Elsevier (1983). Baum M.R., Failure of a Horizontal Pressure Vessel Containing a High Temperature Liquid : The Velocity of End-Cap and Rocket Missiles, J. Loss Prevention in the Process Industries 12 (1999) 137-145. Barlow R.S., et.al, Effect of Damköhler Number on Superequilibrium OH Concentration in Turbulent Nonpremixed Jet Flames, Combustion, Science and Technology, 82 (1990) 235-251. Barlow R.S., et.al., Nitric Oxides Formation in Dilute Hydrogen Jet Flames: Isolation of the Effects of Radiation and Turbulent-Chemistry Submodels, Combustion and Flame 117 (1999) 4-31. Benteftifa C.A., Becht C., Improve Building Performance to Survive Vapour-Cloud Explosions, Hydrocarbon Processing (1995) 85-90. Berman M., A Critical Review of Recent Large-Scale Experiments on Hydrogen-Air Detonations, Nucl. Sci. Eng. 93 (1986) 321-347. Breitung W., Redlinger R., Containment Pressure Loads from Hydrogen Combustion in Unmitigated Severe Accidents, Nuc Tech 111 (1995) 395-419. Breitung W., Kotchourko A., Numerische Simulation von turbulenten Wasserstoff-Verbrennungen bei schweren Kernreaktorunfaellen, Nachrichten-Forschungszentrum Karlsruhe, 28 (1996) No. 2-3 175-191. CCPS, Guidelines for Evaluating the Characteristics of Vapour Cloud Explosions, Flash Fires and BLEVE’s, Centre for Chemical Process Safety, American Institute of Chemical Engineers, New York, USA (1994). CEN, Gas Explosion Venting Protective Systems, PrEN 14494, European Committee for Standardization, Brussels, Belgium (2004). Chandrasekhar, S., Radiative Transfer, Oxford University Press, Oxford, UK (1950). Chelin P., Pina V., Investigative Method for Radiative Properties of Water Vapour in the 0.8m Region by Optical Diagnostic of H2-Air Combustion, Combustion Science and Technology, 174 (2002) 215-229. Choudhuri A.R., Gollahalli S.R., Intermediate Radical Concentrations in Hydrogen-Natural Gas Blended Fuel Jet Flames’, Int. J. Hydrogen Energy, 29 (2004) 1291-1302. Cox G., On Radiation Heat Transfer from Turbulent Flames, Combustion Science and Technology, 1 (1977) 75-78. CSChE, Risk Assessment – Recommended Practices for Municipalities and Industry, Canadian Society for Chemical Engineering, Ottawa, Canada (2004).

43
Cumber P.S., Fairweather M., Evaluation of Participating Media Models for Fire Simulation, Proc. Sixth Int. Symp. on Fire Safety Science, (July 1999, Poitiers, France), Int. Ass. for Fire Safety Science, Boston, USA (1999) 337-348. Cumber P.S., Ray Effect Mitigation in Jet Fire Radiation Modelling, Int. J. Heat Mass Transfer, 43 (2000) 935-943. Cumber P.S., Fairweather M., Evaluation of Flame Emission Models Combined with the Discrete Transfer Method for Combustion System Simulation”, Int. J. Heat and Mass Transfer, 48 (2005) 5221-5239. Cumber P.S., Fairweather M., Ledin H.S., Application of Wide Band Radiation Models to Nonhomogeneous Combustion Systems, Int. J. Heat Mass Transfer, 41 (1998) 1573-1584. De Ris J., Fire Radiation – A Review”, Seventeenth Symp. (Int.) on Combustion, Combustion Institute, Pittsburgh, USA (1979) 1003. DNV, Human Resistance against Thermal Effects, Explosion Effects, Toxic Effects, and Obscuration of Vision, DNV Technica, Scandpower A/S, Det Norske Veritas, Oslo, Norway (2001), (http://www.preventor.no/tol_lim.pdf). Dorofeev S.B., Blast Effect of Confined and Unconfined Explosions, Proc. 20th Symp. on Shock Waves, Pasadena, USA (1995) 77-86. Edwards D.K., Balakrishnan A., Thermal Radiation by Combustion Gases, Int. J. Heat Mass Transfer, 16 (1973) 25-40. Edwards D.K., Molecular Gas Band Radiation, in: Irvine T.F., Hartnett J.P. (Eds.), Advances in Heat Transfer, Vol. 12, Academic Press, New York, USA (1976) 115 -193. Erdogan F., Delale F., Owczarek J.A., Crack Propagation and Arrest in Pressurized Containers, J. Pressure Vessel Technology, 99 (1977) 90-99. Faeth G.M., Jeng S.M., Gore J., Radiation from Fires, in: Law C.K., Yuen W.W., Miyasaka K. (Eds.), Heat Transfer in Fire and Combustion Systems, HTD, Vol. 45, ASME, New York, USA (1985) 137-151. Felske J.D., Tien C.L., Wide Band Characterization of the Total Band Absorptance of Overlapping Infrared Gas Bands, Combustion Science and Technology, 11 (1975) 111-117. FEMA, Explosive Blast, Chapter 4 in: Reference Manual to Mitigate Potential Terrorist Attacks Against Buildings, Report FEMA426, Federal Emergency Management Agency, Washington D.C., USA (2003). Fischer M., Kratzel T., Pantow E., Turbulent Combustion and Detonation Processes in Hydrogen-Air Mixtures, Proc. 11th World Hydrogen Energy Conf., Stuttgart, Germany (1996) 2125-2136. Fishburne E.S., Fergament H.S., The Dynamics and Radiant Intensity of Large Hydrogen Flames, 17th Int. Symp. on Combustion, The Combustion Institute, Pittsburgh, USA (1979) 1063-73. Fiveland W.A., A Discrete Ordinate Method for Predicting Radiative Heat Transfer in Axisymmetric Enclosures”, ASME Paper No. 82-HT-20 (1982). Fiveland W.A., Discrete Ordinates Solutions of Radiation Transport Equation of Rectangular Enclosures", ASME Journal of Heat Transfer, 106 (1984) 699-706.

44
GEXCON, Gas Explosion Handbook, (http://www.gexcon.com/index.php?src=gas/handbook.html). Giesbrecht H., et.al., Analyse der potentiellen Explosionswirkung von kurzzeitig in die Atmosphaere freigesetzten Brenngasmengen, Teil 1, Chemie-Ingenieur-Technik 52 (1980) No.2 114-122. Giesbrecht H., et.al., Analyse der potentiellen Explosionswirkung von kurzzeitig in die Atmosphaere freigesetzten Brenngasmengen, Teil 2, Chemie-Ingenieur-Technik 53 (1981) No.1 1-10. Giesbrecht H., Evaluation of Vapour Cloud Explosions by Damage Analysis, J. Haz. Mat. 17 (1988) 247-257. Goody R.M., Atmospheric Radiation I: Theoretical Basis, Claredon Press, Oxford, UK (1964). Gore J.P., Jeng S.M., Faith G.M., Spectral and Total Radiative Properties in Hydrogen/Air Diffusion Flames, J. Heat Transfer, 109 (1987) 165-171. Gosman A.D., Lockwood F.C., Incorporation of a Flux Model for Radiation into a Finite-Difference Procedure for Furnace Calculations, 14th Int. Symp. on Combustion, The Combustion Institute, Pittsburgh, USA (1973) 661-671. Gottuck D.T., White D.A., Liquid Fuel Fires, SFPE Handbook of Fire Protection Engineering, 3rd Edition, NFPA, Quincy, USA (2002) Section 2, Ch.15, 2-297 - 2-316. Grosshandler W.L, Radiative Heat Transfer in Nonhomogeneous Gases: A Simplified Approach, Int. J. Heat Mass Transfer, 23 (1980) 1447-1459. Grosshandler W.L., Modak A.T., Radiation from Nonhomogeneous Combustion Products, 18th Int. Symp. on Combustion, The Combustion Institute, Pittsburgh, USA (1981) 601-609. Gurson A.L., Continuum Theory of Ductile Rupture by Void Nucleation and Growth, J. Eng. Mat. Technol., 123 (1977) 203-209. Hauptmanns U., A Procedure for Analyzing the Flight of Missiles from Explosions of Cylindrical Vessels. J. Loss Prevention in the Process Industries, 14 (2001) 395-402. Heicklen, J. Atmospheric Chemistry. Academic Press, London, UK (1976). Hottel H.C., Cohen E.S., Radiant Heat Exchange in a Gas Filled Enclosure: Allowance for Non-Uniformity of Gas Temperature, AIChE Journal, 4 (1958) No 1. Hottel H.C., Sarofim A.F., Radiative Heat Transfer, McGraw-Hill New York, USA (1967). Howell J.R., Permutter M., Monte-Carlo Solution of Thermal Transfer through Radiant Media between Gray Walls, J. Heat Transfer, Trans ASME, 86 (1964) 116. IAEA, Hydrogen in Water-Cooled Nuclear Power Reactors, International Atomic Energy Agency, Vienna, Austria, and Commission of the European Communities, Brussels, Belgium (1990). Iibas M., The Effect of Thermal Radiation and Radiation Models on Hydrogen-Hydrocarbon Combustion Modelling, Int. J. Hydrogen Energy, 30 (2005) 1113-1126. INERIS, Formalisation du Savoir et des Outils dans le Domaine des Risques Accidentels (DRA-35),Version Projet, Les éclatements de reservoirs, L'Institut National de l'Environnement Industriel et des Risques, Verneuil-en-Halatte, France (2004).

45
ISO, Basic Considerations for the Safety of Hydrogen Systems, Technical Report ISO/TR 15916:2004(E), International Organization of Standardization, Geneve, Switzerland (2004). Itoh S., et.al., Spatially Resolved Elemental Analysis of a Hydrogen-Air Diffusion Flame by Laser-Induced Plasma Spectroscopy (LIPS), Microchemical Journal, 70 (2001) 143-152. Kaiser W., et.al., Ermittlung und Berechnung von Stoerfallaublaufszenarien nach Massgabe der 3. Stoerfallverwaltungsvorschrift, Umweltbundesamt, Berlin, Germany (2002), (http://www. umweltbundesamt.de/anlagen/Leitfaden.pdf). Kim S. H., et.al., The Effect of Flame Radiation on the Scaling of Nitrogen Oxide Emission in Turbulent Hydrogen Non-Premixed Flames, Proceedings of Combustion Institute, 29 (2002) 1951-1956. Kluger, Y., Bomb Explosions in Acts of Terrorism, Israeli Medical Association, IMAJ 5 (2003) 235-240. Koopman R.P., et.al., Analysis of BURRO Series 40 m3 LNG Spill Experiments, J. Hazardous Materials, 6 (1982) 43-83. Kumar S., Cox G., Radiation, Convection and Surface Roughness Effects in the Numerical Modelling of Enclosure Fires, Proc. 2nd Int. Symp. on Fire Safety Science, (June 1988, Tokyo, Japan), Hemisphere Publishers, Washington D.C., USA (1989) 851-860. Kumar S., Gupta A.K., Cox G., Effect of Thermal Radiation on the Fluid Dynamics of Compartment Fires, Proc. 3rd Int. Symp. on Fire Safety Science, (July 1991, Edingburgh, UK), Elsevier Applied Science, London, UK (1991) 345-354. Kusharin A.Y., et.al., Initiation of Premixed Flames in H2-Air-H 2O Mixtures, Experimental Thermal and Fluid Sciences, 21 (2000) 2-8. Langberg H., Christensen S.O., Skudal S., Test Program with Small Concrete “Kasun” Houses, Forsvarsbygg, FoU Rapport Nr. 24/2004, Kristiansand, Norway (2004). Lathrop K.D., Ray Effects in Discrete Ordinates Equations, Nucl. Sci. Eng., 32 (1968) 357; ibid, 45 (1971) 255. Leslie I.R.M., Birk A.M., State of the Art Review of Pressure Liquefied Gas Container Failure Modes and Associated Projectile Hazards. J. Hazardous Materials, 28 (1991) 329-365. Lewis E.E., Miller Jr. W.F., Computational Methods of Neutron Transport, Wiley, New York, USA (1984). Li Q.M., Meng H., Pressure-Impulse Diagram for Blast Loads Based on Dimensional Analysis and Single-Degree-of-Freedom Model, J. Eng. Mechanics, 128 (2002) 87-92. Lind C.D., What Causes Unconfined Vapour Cloud Explosions, Loss Prevention, 9 (1975) 101-105. Liu L.H., et.al., Fluctuating Characteristics of Radiative Source Term in Hydrogen Turbulent Jet Diffusion Flame”, J. Quantitative Spectroscopy & Radiative Transfer, 87 (2004) 193-201. Lockwood F.C., Shah N.G., Heat Transfer, Vol. 2, Hemisphere Publishing Corporation, Washington D.C., USA (1978) 33-40.

46
Lockwood F.C., Shah N.G., A New Radiation Solution Method for Incorporation in General Combustion Prediction Procedures, 18th Int. Symp. on Combustion, The Combustion Institute, Pittsburgh, USA (1981) 1405-1414. Logan J.A., Tropospheric Chemistry: A Global Perspective, J. Geophysical Research, 86 (1981) 7210-7254. Ludwig C.B., et.al., Handbook of Radiation from Combustion Gases, Report NASA SP-3080, Washington D.C., USA (1973). Maurer B., et.al., Modellversuche zur Flash-Entspannung, atmosphaerischer Vermischung und Deflagration von Fluessiggasen nach deren Freisetzung bei Behaelterzerknall, Int. Sem. ELCALAP, Berlin, Germany (1975). Maurer B., et.al., Modelling of Vapour Cloud Dispersion and Deflagration after Bursting of Tanks Filled with Liquified Gas, 2nd Int. Symp. on Loss Prevention and Safety Promotion in the Process Industries (1977). MEDD, Guide de Sécurité pour la Conception de Salles de Contrôle Résistant à l’Explosion dans les Raffineries de Pétrole et sur les Sites Pétrochimiques, Ministère de l’Ecologie et du Développement Durable, Paris, France (1994). MEDD, Durable Relatif aux Valeurs de Référence de Seuils d'Effets des Phénomènes Accidentels des Installations Classées, Arrêté du 22 Octobre 2004 du Ministère de l'Ecologie et du Développement Durable, Paris, France (2004). Mercx W.P.M., Weerheijm J., Verhagen T.L.A., Some Considerations on the Damage Criteria and Safety Distances for Industrial Explosions, HAZARDS XI – New Directions in Process Safety, UMIST, Manchester, UK, April 16-18, 1991. Mercx W.P.M. (Ed.), Modelling and Experimental Research into Gas Explosions, Overall Final Report of the Project MERGE, CEC Contract STEP-CT-0111 (SSMA), European Commission, Directorate General XII, Brussels, Belgium (1994). Mercx W.P.M. (Ed.), Extended Modelling and Experimental Research into Gas Explosions, Final Summary Report of the Project EMERGE, CEC Contract EV5VCT930274, European Commission, Directorate General XII, Brussels, Belgium (1997). Mercx W.P.M., et.al., Developments in Vapour Cloud Explosion Blast Modelling, J. Hazardous Materials, 71 (2000) 301-319. Modest M. F., The Weighted-Sum-of-Gray-Gases Model for Arbitrary Solution Methods in Radiative Transfer, J. Heat Transfer, 113 (1991) 650-656. Moen I.O., Transition to Detonation in Fuel-Air Explosive Clouds, J. Hazardous Materials, 33 (1993) 159-192. Molkov V.V., Makarov D.V., Schneider H., Hydrogen Air Deflagrations in Open Atmosphere: Large Eddy Simulation Analysis of Experimental Data, Int. Conf. on Hydrogen Safety (ICHS), Pisa, Italy (2005). Mott N.F., Fragmentation of H.E. Shells, A Theoretical Formula for the Distribution of Weight of Fragments, A.O.R.G. Memorandum, Army Operational Research Group, Richmond, UK (1943). Mudan K.S., Thermal Radiation Hazards from Hydrocarbon Pool Fires, Prog. Energy Combus. Sci., 10 (1984) 59-80.

47
MVROM, Methods for the calculations of physical effects. Publicatiereeks Gevaarlijke Stoffen 2 (PGS 02)., Ministerie van Volkshuisvesting, Ruimtelijke Ordening en Milieubeheer, Den Haag, The Netherlands (2005). NASA, Safety Standard for Hydrogen and Hydrogen Systems NSS 1740.16, National Aeronautics and Space Administration, Washington D.C., USA (1997). NFPA 68, National Fire Codes, Guide for Venting of Deflagrations, National Fire Protection Association, Quincy, USA (2002). Pandey A.K., et.al., Non-Linear Response of Reinforced Concrete Containment Structure under Blast Loading, Nucl. Eng. Des., 236 (2006) 993-1002. Pfoertner H., Gas Cloud Explosions and Resulting Blast Effects, Int. Seminar on Extreme Load Conditions and Limit Analysis Procedures for Structural Reactor Safeguards and Containment Structures, Berlin, Germany (1975). Pfoertner H., et.al., Flame Acceleration and Pressure Build Up in Free and Partially Confined Hydrogen Air Clouds. 9th ICDERS, Poitiers, France (1983a). Pfoertner H., Schneider H., Ballonversuche zur Untersuchung der Deflagration von Wasserstoff Luft Gemischen (Abschlussbericht). PNP-Sicherheitssofortprogramm: “Prozessgasfreisetzung - Explosion in der Gasfabrik und Auswirkungen von Druckwellen auf das Containment”, ICT Internal Report, Fraunhofer Institut für Chemische Technologie, Pfinztal, Germany (1983b). Pfoertner H., The Effects of Gas Explosions in Free and Partially Confined Fuel/Air Mixtures, Propellants, Explosives, Pyrotechnics, 10 (1985) No.5 151-155. Prather M. J., An Environmental Experiment with H2?, Science, 302 (2003) 581-582. Sanai M., Computer Simulation of Explosion of a Hydrogen Storage Tank, Proc. 11th World Hydrogen Energy Conf., Stuttgart, Germany (1996) 2149-2158. Schneider H., Pfoertner H., Flammen- und Druckwellenausbreitung bei der Deflagration von Wasserstoff Luft Gemischen. PNP-Sicherheitssofortprogramm: “Prozessgasfreisetzung - Explosion in der Gasfabrik und Auswirkungen von Druckwellen auf das Containment”, Jahrestagung des Fraunhofer Instituts für Treib- und Explosivstoffe, Karlsruhe, Germany (1978). Schneider H., Pfoertner H., Explosion von Wasserstoff Luft Gemischen unter teilverdaemmten Bedingungen und unter dem Einfluss einer turbulenten Stroemung, PNP-Sicherheitssofortprogramm: “Prozessgasfreisetzung - Explosion in der Gasfabrik und Auswirkungen von Druckwellen auf das Containment”, ICT Internal Report, Fraunhofer Institut für Chemische Technologie, Pfinztal, Germany (1984a). Schneider H., Pfoertner, H., Versuche zur Freistrahlzuendung partiell verdaemmter Wasserstoff Luft Gemische im Hinblick auf die Skalierbarkeit des Uebergangs Deflagration Detonation, Final Report for Firma Interatom, Bergisch-Gladbach, ICT Internal Report, Fraunhofer Institut für Chemische Technologie, Pfinztal, Germany (1984b). Schneider H., Large Scale Experiments: Deflagration and Deflagration to Detonation Transition within a Partial Confinement Similar to a Lane, Int. Conf. on Hydrogen Safety (ICHS), Pisa, Italy (2005). Shah N.G., Radiation Heat Transfer, PhD Thesis, Imperial College, London, UK (1979).

48
Schultz M.G., Air pollution and Climate-Forcing Impacts of a Global Hydrogen Economy, Science, 302 (2003) 624-627. Schultz, M.G., et al., Ozone and Climate Impacts of a Global Hydrogen Economy, Poster at the Quadrennial Ozone Symposium 2004, Kos, Greece (2004a). Schultz M.G., Markert F., Pilegaard K., Hydrogen and the Environment, Larsen H., Feidenhans'l R., Pedersen L. S. (Ed.), Hydrogen and its Competitors (3), 58-62, 2004. Risø Energy Report, Roskilde, Risø National Laboratory (2004b). Siegel R., Howell H.R., Thermal Radiation Heat Transfer, McGraw-Hill, New York, USA (1981). Sparrow E.M., Cess R.D., Radiation Heat Transfer; McGraw-Hill, New York, USA (1978). Tang M.J., Baker Q.A., A New Set of Blast Curves from Vapour Cloud Explosion, Process Safety Progress, 18 (1999) No. 3, 235-240. Tien C.L., in: Handbook of Heat Transfer Fundamentals, McGraw-Hill, New York, USA (1985). Tien C.L., Lee S.C., Flame Radiation, Progress in Energy and Combustion Science, 8 (1982) 41-59. Tieszen S.R., Effect of Initial Conditions on Combustion Generated Loads, Nucl. Eng. Des., 140 (1993) 81-94. TNO Green Book, Methods for the Determination of Possible Damage to People and Objects Resulting from Releases of Hazardous Materials, Report CPR 16E, Voorburg, The Netherlands (1992). Tromp T.K., et al., Potential Environmental Impact of a Hydrogen Economy on the Stratosphere, Science, 300 (2003) 1740-1742. Truelove J.S., A Mixed Gray Gas Model for Flame Radiation, Report AERE-R8494, UKAEA Harwell, UK (1976). UFIP, Guide Méthodologique UFIP pour la Réalisation des Études de Dangers en Raffineries, Stockages et Dépôts de Produits Liquides et Liquéfiés, L’Universite de Formation Inter-professionnelle, Saint Laurent du Var, France (2002). USACE, Structures to Resist Accidental Explosions, TM5-1300, US Army Corps of Engineers, Hyattsville, USA (1990). Van den Berg A.C., Eggen J.B.M., GAME-Guidance for the Application of the Multi-Energy Method, 2nd Int. Specialist Meeting on Fuel Air Explosions, held at Bergen, Norway, June 27-28, 1996. Van den Berg A.C., Versloot N.H.A., The Multi-Energy Critical Separation Distance, J. Loss Prevention in the Process Industries, 16 (2003) 111-120. Van den Berg A.C., et.al., Expansion-Controlled Evaporation: A Safe Approach to BLEVE Blast, J. Loss Prevention in the Process Industries, 17 (2004) 397-405. Van den Berg A.C., et.al., BLEVE Blast by Expansion-Controlled Evaporation, Process Safety Progress, 25 (2005) No. 1. Van der Voort M.M., et.al., Analysis of the Sci Pan 3 Debris Throw Data Using the Klotz Group Approach, Presented at the 32th Explosives Safety Seminar, held at Philadelphia, August 22-24, 2006, Department of Defense Explosives Safety Board (2006).

49
Van Doormaal J.C.A.M., et.al., Design of KG-Engineering Tool for Debris Throw Prediction. TNO Report TNO-DV2 2005 C112, Rijswijk, The Netherlands (2006a). Van Doormaal J.C.A.M., Weerheijm J., Klotz Group Engineering Tool for Debris Launch Prediction, Presented at the 32th Explosives Safety Seminar, held at Philadelphia, August 22-24, 2006, Department of Defense Explosives Safety Board (2006b). Van Wingerden K., Detonations in Pipes and in the Open, CMR Internal Report, Christian Michelsen Research, Bergen, Norway (1999). Viskanta R., Menguc M.P., Radiation Transfer in Combustion Systems”, Prog. Energy Combus. Sci., 13 (1987) 97-160. Wennberg P. O., et al., Hydrogen Radicals, Nitrogen Radicals, and the Production of O3 in the Upper Troposphere, Science, 279 (1998) 49-53.