Embed Size (px)
Citation preview

Utilities and Service Systems
UC Davis Volume 1 2018 Long Range Development Plan EIR 3.17-1
3.17 UTILITIES AND SERVICE SYSTEMS
This section evaluates the adequacy of existing and planned utilities to accommodate the demands/ generation associated with implementation of the 2018 LRDP. Specifically, this section addresses:
water supply, distribution, and treatment; wastewater treatment and disposal; solid waste disposal; and steam and chilled water systems.
Please refer to Section 3.6, “Energy,” for an analysis of energy efficiency related to implementation of the project pursuant to State CEQA Guidelines, Appendix F requirements, and evaluation of existing energy-related infrastructure and its ability to serve the projected needs of UC Davis with implementation of the 2018 LRDP. Impacts related to stormwater drainage, groundwater aquifers, and water quality are addressed in Section 3.10, “Hydrology and Water Quality.”
Concerns received in response to the NOP consisted of impacts of additional and incremental demand on water supplies, treatment, and stormwater conveyance. Additionally, concerns with capacity levels of existing facilities and infrastructure, were expressed.
3.17.1 Regulatory Setting
FEDERAL
Clean Water Act The Clean Water Act (CWA) employs a variety of regulatory and non-regulatory tools to reduce direct pollutant discharges into waterways, finance municipal wastewater treatment facilities, and manage polluted runoff. The U.S. Environmental Protection Agency (EPA) established primary drinking water standards in Section 304 of the CWA. States are required to ensure that the public’s potable water meets these standards.
Section 402 of the CWA creates the NPDES regulatory program. Point sources must obtain a discharge permit from the proper authority (usually a state, sometimes EPA, a tribe, or a territory). NPDES permits cover various industrial and municipal discharges, including discharges from storm sewer systems in larger cities, storm water associated with numerous kinds of industrial activity, runoff from construction sites disturbing more than 1 acre, and mining operations. All so-called “indirect” dischargers are not required to obtain NPDES permits. “Indirect” dischargers send their wastewater into a public sewer system, which carries it to the municipal sewage treatment plant, through which it passes before entering a surface water.
Safe Drinking Water Act As mandated by the Safe Drinking Water Act (Public Law 93‐523), passed in 1974, EPA regulates contaminants of concern to domestic water supply. Such contaminants are defined as those that pose a public health threat or that alter the aesthetic acceptability of the water. These types of contaminants are regulated by EPA primary and secondary maximum contaminant levels (MCLs). MCLs and the process for setting these standards are reviewed triennially. Amendments to the Safe

Utilities and Service Systems
Volume 1 UC Davis 3.17-2 2018 Long Range Development Plan EIR
Drinking Water Act enacted in 1986 established an accelerated schedule for setting drinking water MCLs. EPA has delegated responsibility for California’s drinking water program to the State Water Resources Control Board (SWRCB) Division of Drinking Water. SWRCB Division of Drinking Water is accountable to EPA for program implementation and for adoption of standards and regulations that are at least as stringent as those developed by EPA.
STATE
California Green Building Standards Code The State of California historically establishes progressive standards that serve as models for other states and even the federal government. With the adoption of the 2010 California Green Building Standards Code (CALGreen), California became the first state to incorporate green building strategies into its building code. This section comprises Part 11 of the California Buildings Standards Code in Title 24 of the California Code of Regulations. CALGreen outlines mandatory and voluntary requirements for new residential and nonresidential buildings (e.g., retail, office, public schools, hospitals) throughout the state beginning on January 1, 2011.
The development and implementation of the CALGreen Code aims to (1) reduce GHG emissions from buildings; (2) promote environmentally responsible, cost-effective, healthier places to live and work; (3) reduce energy and water consumption; and (4) respond to directives by the Governor. Pursuant to the California Global Warming Solutions Act of 2006 (AB 32), CALGreen provides strategies to reduce building-related sources of GHG to attain California’s 2020 and 2050 goals.
The provisions of CALGreen include both voluntary and mandatory measures for green building. Buildings/communities that have obtained the sole CALGreen title have met the minimum requirements of the code; these include: (1) reduction in water consumption, (2) diversion of construction waste from landfills, (3) installation of low-emitting materials, and (4) commission of new buildings over 10,000 square feet (sf).
CALGreen also includes Appendices which consist of voluntary measures designed to be adopted by local governments. This gives local jurisdictions the power to decide which measures they wish to pursue. Tier 1 communities must comply with the provisions of section A4.601.4.2 of CALGreen. This includes compliance with all mandatory measures, improvements in efficiency and reduction of waste, as well as the adoption of at least eight additional measures from each category: planning and design, energy efficiency, water efficiency and conservation, material conservation and resource efficiency, and environmental quality. Tier 2 rated communities must exceed the Tier 1 standard by adopting at least 12 voluntary measures, and establish even more stringent efficiency policies.
The measures apply to residential and nonresidential projects that include new construction, demolition, and/or additions and alterations. Upon submission of an application, projects must provide plans to comply with the Tier 1 standards set forth by CALGreen.
In implementing a statewide baseline for green building strategies, California recognized the adverse effects of anthropogenic climate change. CALGreen serves as a tool for California to reduce GHG emissions and physical waste, increase energy efficiency, and achieve water conservation and water efficiency.
The standards included in the 2016 (CALGreen) Code became effective on January 1, 2017. The CALGreen Code was developed to enhance the design and construction of buildings, and the use of sustainable construction practices, through planning and design, energy efficiency, water efficiency and conservation, material conservation and resource efficiency, and environmental air quality.

Utilities and Service Systems
UC Davis Volume 1 2018 Long Range Development Plan EIR 3.17-3
Chapter 5 (Division 5.3) of the 2016 CALGreen Code describes measures to reduce indoor demand for potable water and to reduce landscape water usage. Division 5.4 requires all construction contractors to reduce construction waste and demolition debris by 65 percent. Code requirements include preparing a construction waste management plan that identifies the materials to be diverted from disposal by efficient usage, recycling, reuse on the project, or salvage for future use or sale; determining whether materials will be sorted on-site or mixed; and identifying diversion facilities where the materials collected will be taken. In addition, CALGreen Code requires that 100 percent of trees, stumps, rocks, and associated vegetation and soils resulting primarily from land clearing be reused or recycled.
California Water Code, Water Supply According to California Water Code (CWC) Section 10910 (referenced in CEQA Guidelines Section 15155), local lead agencies (such as the University of California, Davis), are required to identify the public water system(s) that would serve a project and assess whether the water supply is sufficient to provide for projected water demand associated with a project when existing and future uses are also considered (CWC Section 10910 [c] [3]). The definition of a water-demand project is the same as CEQA Guidelines Section 15155.
UC Davis is a designated small water supplier, per the California Department of Water Resources (DWR).
California Water Code, Water Supply Wells and Groundwater Management The California Water Code (CWC) is enforced by DWR. DWR’s mission is “to manage the water resources of California in cooperation with other agencies, to benefit the State’s people, and to protect, restore, and enhance the natural and human environments.” DWR is responsible for promoting California’s general welfare by ensuring beneficial water use and development statewide. The laws regarding groundwater wells are described in CWC Division 1, Article 2 and Articles 4.300 to 4.311; and Division 7, Articles 1-4. Further guidance is provided by bulletins published by DWR, such as bulletins 74-81 and 74-90 related to groundwater well construction and abandonment standards.
Groundwater Management is outlined in the CWC, Division 6, Part 2.75, Chapters 1-5, Sections 10750 through 10755.4. The Groundwater Management Act was first introduced in 1992 as Assembly Bill (AB) 3030, and has since been modified by Senate Bill (SB) 1938 in 2002, AB 359 in 2011, and AB 1739 in 2014. The intent of the Groundwater Management Act is to encourage local agencies to work cooperatively to manage groundwater resources within their jurisdictions and to provide a methodology for developing a Groundwater Management Plan.
Sustainable Groundwater Management Act of 2014 The Sustainable Groundwater Management Act of 2014 (SGMA)1 became law on January 1, 2015, and applies to all groundwater basins in the state (Water Code Section 10720.3). By enacting the SGMA, the legislature intended to provide local agencies with the authority and the technical and financial assistance necessary to sustainably manage groundwater within their jurisdiction (CWC Section 10720.1). The SGMA is a follow up to SB X7-6, adopted in November 2009, which mandated a statewide groundwater elevation monitoring program to track seasonal and long-term trends in groundwater elevations in California’s groundwater basins. In accordance with this amendment to the CWC, DWR developed the California Statewide Groundwater Elevation Monitoring (CASGEM) program.
Pursuant to the SGMA, any local agency that has water supply, water management or land use responsibilities within a groundwater basin may elect to be a “groundwater sustainability agency” for
1 The SGMA is comprised of three separate bills: Senate Bill 1168, Senate Bill 1319, and Assembly Bill 1739. All three were signed into
law by the Governor on September 16, 2014.

Utilities and Service Systems
Volume 1 UC Davis 3.17-4 2018 Long Range Development Plan EIR
that basin (CWC Section 10723). Local agencies have until January 1, 2017 to elect to become or form a groundwater sustainability agency. In the event a basin is not within the management area of a groundwater sustainability agency, the county within which the basin is located will be presumed to be the groundwater sustainability agency for the basin. However, the county may decline to serve in this capacity (CWC Section 19724). The City is currently in the planning stages to partner with other local agencies in compliance with the SGMA.
The SGMA also requires DWR to categorize each groundwater basin in the state as high-, medium-, low-, or very low priority (CWC Sections 10720.7, 10722.4). All basins designated as high- or medium-priority basins must be managed by a groundwater sustainability agency under a groundwater sustainability plan that complies with Water Code Section 10727 et seq. If required to be prepared, groundwater sustainability plans must be prepared by January 31, 2020 for all high- and medium-priority basins that are subject to critical conditions of overdraft, as determined by DWR, or by January 31, 2022 for all other high- and medium-priority basins. In lieu of preparation of a groundwater sustainability plan, a local agency may submit an alternative that complies with the SGMA no later than January 1, 2017 (CWC Section 10733.6).
In June 2014, DWR released the final CASGEM Basin Prioritization Results which show that DWR has ranked the Sacramento basin and Yolo sub-basin as “high priority” and state that there are two problems with this sub-basin; using untreated groundwater for manufacturing because of total dissolved solids and some subsidence in the sub-basin northeast of Davis and in northern Yolo County. While UC Davis is not a local agency, and therefore not eligible to form a groundwater sustainability agency, UC Davis is attaining compliance with SGMA by becoming an affiliated partner of the Yolo Sub-basin Groundwater Agency (YSGA). Under the regulatory schedule, the YSGA has begun preparing a Groundwater Sustainability Plan, which is due by January 1, 2022.
Water Conservation Act of 2009 Requirements regarding per capita water use targets are defined in the Water Conservation Act of 2009 that was signed into law in November 2009 as part of a comprehensive water legislation package. Known as SB X7-7, the legislation sets a goal of achieving a 20 percent reduction in urban per capita water use statewide by 2020. SB X7-7 requires that retail water suppliers define in their 2010 urban water management plans the gallons-per-capita-per-day (gpcd) targets for 2020, with an interim 2015 target. Water purveyors are required to select one of the four methods that the legislation defines for establishing a gpcd target. Through a jointly held water right and contract with the Woodland-Davis Clean Water Agency (WDCWA), WDCWA supplies up to 1.8 million gallons per day of surface water supplies to UC Davis.
California’s Integrated Waste Management Act of 1989 The California Integrated Waste Management Act (CIWMA) of 1989 created the California Integrated Waste Management Board, now known as the California Department of Resources Recycling and Recovery (CalRecycle). CalRecycle is the agency designated to oversee, manage, and track California’s 92 million tons of waste generated each year. CalRecycle provides grants and loans to help cities, counties, businesses, and organizations meet the state’s waste reduction, reuse, and recycling goals. CalRecycle promotes a sustainable environment in which these resources are not wasted, but can be reused or recycled. In addition to many programs and incentives, CalRecycle promotes the use of new technologies to divert resources away from landfills. CalRecycle is responsible for ensuring that waste management programs are carried out primarily through local enforcement agencies.
The CIWMA is the result of two pieces of legislation, AB 939 and SB 1322. The CIWMA was intended to minimize the amount of solid waste that must be disposed of through transformation and land

Utilities and Service Systems
UC Davis Volume 1 2018 Long Range Development Plan EIR 3.17-5
disposal by requiring all cities and counties to divert 25 percent of all solid waste from landfill facilities by January 1, 1995, and 50 percent by January 1, 2000.
The 50 percent diversion requirement is measured in terms of per-capita disposal expressed as pounds per day (lb/day) per resident and per employee. The per-capita disposal and goal measurement system uses an actual disposal measurement based on population and disposal rates reported by disposal facilities, and it evaluates program implementation efforts.
Assembly Bill 341 AB 341 requires CalRecycle to issue a report to the legislature that includes strategies and recommendations that would enable the state to recycle 75 percent of the solid waste generated in the state by January 1, 2020, requires businesses that meet specified thresholds in the bill to arrange for recycling services by July 1, 2012, and also streamlines various regulatory processes.
Senate Bill 1374 SB 1374, Construction and Demolition Waste Materials Diversion Requirements, requires that jurisdictions summarize their progress realized in diverting construction and demolition waste from the waste stream in their annual AB 939 reports. SB 1374 required the California Integrated Waste Management Board (which is now CalRecycle) to adopt a model construction and demolition ordinance for voluntary implementation by local jurisdictions.
Assembly Bill 1826 AB 1826 requires a business that generates 4 cubic yards or more of organic waste per week to arrange for recycling services for that organic waste in a specified manner. The bill would also require a business that generates 4 cubic yards or more of commercial solid waste per week, on and after January 1, 2019, to arrange for organic waste recycling services and, if CalRecycle makes a specified determination, would decrease that amount to 2 cubic yards, on or after January 1, 2020. The bill would require each jurisdiction to report to CalRecycle on its progress in implementing the organic waste recycling program, and CalRecycle would be required to review whether a jurisdiction is in compliance with this act.
AB 1826 would require CalRecycle to identify and recommend actions to address permitting and siting challenges and to encourage the continued viability of the state’s organic waste processing and recycling infrastructure, in partnership with the California Environmental Protection Agency and /other specified state and regional agencies. The bill also would require the department to cooperate with local jurisdictions and industry to provide assistance for increasing the feasibility of organic waste recycling and to identify certain state financing mechanisms and state funding incentives and post this information on its Internet Web site.
Senate Bill 1383 The California Global Warming Solutions Act of 2006 designates the California State Air Resources Board (CARB) as the state agency charged with monitoring and regulating sources of emissions of greenhouse gases. SB 1383 would require CARB, no later than January 1, 2018, to approve and begin implementing that comprehensive strategy to reduce emissions of short-lived climate pollutants to achieve a reduction in methane by 40 percent, hydrofluorocarbon gases by 40 percent, and anthropogenic black carbon by 50 percent below 2013 levels by 2030, as specified. The bill also would establish specified targets for reducing organic waste in landfills.
SB 1383 would require CalRecycle, in consultation with CARB, to adopt regulations that achieve the specified targets for reducing organic waste in landfills. The bill would authorize local jurisdictions to charge and collect fees to recover the local jurisdiction’s costs incurred in complying with the

Utilities and Service Systems
Volume 1 UC Davis 3.17-6 2018 Long Range Development Plan EIR
regulations. SB 1383 would require, no later than July 1, 2020, CalRecycle, in consultation with CARB, to analyze the progress that the waste sector, state government, and local governments have made in achieving the specified targets for reducing organic waste in landfills. The bill would authorize CalRecycle, depending on the outcome of that analysis, to amend the regulations to include incentives or additional requirements, as specified. By adding to the duties of local governments related to organic waste in landfills, SB 1383 would impose a state-mandated local program.
UNIVERSITY OF CALIFORNIA
UC Sustainable Practices Policy The University of California has a system-wide policy regarding sustainability practices and performance goals and targets. The policy covers nine areas of operational sustainability, which include: Green Building Design, Clean Energy, Climate Protection, Sustainable Transportation, Sustainable Procurement, Sustainable Building Operations, Recycling and Waste Management, Sustainable Food Services, and Sustainable Water Systems. The UC Sustainable Practices Policy is frequently updated. The most recent changes were adopted in January 2018, and are expected to be formally issued in summer 2018. The policy changes include extensive revisions to the goals and practices of the Recycling and Waste Management (to be renamed Zero Waste) section.
The Recycling and Waste Management/Zero Waste section will call for the following goals and practices with the upcoming issuance in summer 2018:
The University prioritizes waste reduction in the following order: reduce, reuse, and then recycle and compost.
The University supports the integration of waste, climate and other sustainability goals, including the reduction of embodied carbon in the supply chain through the promotion of a circular economy and the management of organic waste to promote atmospheric carbon reduction. In support of this goal, waste reporting will include tracking estimated scope 3 greenhouse gas emissions.
The University will reduce per capita total municipal solid waste generation at all locations other than medical centers as follows: reduce waste generation per capita to FY2015/16 levels by 2020, reduce waste generation by 25 percent per capita from FY2015/16 levels by 2025, and reduce waste generation by 50 percent per capita from FY2015/16 levels by 2030.
The University will achieve zero waste by 2020 at all locations other than medical centers. Minimum compliance for zero waste is 90 percent diversion of municipal solid waste from landfills.
By 2020, the University will prohibit the sale, procurement or distribution of Expanded Polystyrene (EPS) other than that utilized for laboratory supply or medical packaging and products.
By 2018, no EPS shall be used in foodservice facilities for takeaway containers.
The University seeks to reduce, reuse and find alternatives for EPS and laboratory and medical packaging products.
It is important to note that changes to the Recycling and Waste Management/Zero Waste section are not yet formally issued by the UC Office of the President, and therefore are not yet required of campuses and their new capital projects or long-range development plans. However, campus staff are proceeding on the assumption that these policy changes will be issued in summer 2018, and are planning for the changes to take effect.
The Sustainable Water Systems section calls for the following goals and practices:

Utilities and Service Systems
UC Davis Volume 1 2018 Long Range Development Plan EIR 3.17-7
Reduce growth-adjusted potable water consumption 20 percent by 2020 and 36 percent by 2025, when compared to a three-year average baseline of FY 2005-05, FY 2006-07, and FY 2007-08.
Develop and maintain a water Action Plan that identifies long-term strategies for achieving sustainable water systems, including quantification of turf areas.
Identify existing single-pass cooling systems and constant-flow lab equipment, and develop a place for replacement and avoid once-through or single-pass cooling systems for soft-plumbed systems.
UC Davis Drought Response Action Plan Potable water conservation and efficiency are necessary to meet the policy targets for water use reduction. The 2014 Drought Response Action Plan outlines 49 measures across multiple campus sectors, including Operations; Dining Services; Landscape Management; Research Water Use; Communication, Behavior Education, and Outreach; Utilities Infrastructure; and New Construction and Renovation.
Key conservation actions that can substantially reduce water use include:
use of reclaimed water in some of the cooling towers; operational changes to cooling tower cycling; retrofit on research fisheries’ well to recycle water use, and pump less water; replacement of a number of older water fixtures; significantly reduced irrigation; retrofit of some landscaped areas; and implementation of behavior education and leak and water waste reporting programs.
The campus has met both the 2020 and the 2025 water conservation targets established in the UC Sustainable Practices Policy through these actions.
UC Davis Waste Reduction and Recycling The UC Davis campus has actively pursued a variety of waste reduction and recycling efforts for several decades and will continue to do so. Various programs are in place and are summarized below.
Action-Based Conservation Programs Conservation programs are largely personal actions-based, and the Office of Sustainability and the Student Housing & Dining Service (SHDS) Sustainability Program offer various behavior-based programs to encourage individuals to reduce their waste generation on campus. The Office of Sustainability offers the Green Workplace program, which includes office and lab programs for groups and individuals, and the Aggie Green Pledge program, which is aimed solely at individual actions. These programs address a wide variety of sustainable/green actions, covering more than waste. The Office of Sustainability also offers copious information about purchasing, recycling and zero waste actions, and holding green events in the Take Action section of its website. In addition, the #MyLastTrash campaign works to promote awareness of the systemwide Zero Waste by 2020 goal through interactive workshops, educational tabling, and online pledges.
Education, Outreach, and Engagement Both SHDS and the Associated Students, University of California, Davis (ASUCD) Coffee House conduct quarterly waste audits, in their respective areas, to gather data used to promote food waste reduction by dining patrons in the Dining Commons, and to guide the signage and waste reduction efforts in the Coffee House. Both groups also promote food waste reduction by allowing patrons to customize their food orders (“Just Ask”) or sample specific dishes before getting a full serving (“Try a

Utilities and Service Systems
Volume 1 UC Davis 3.17-8 2018 Long Range Development Plan EIR
Taste”). To further reduce waste, the Coffee House and retail markets also provide a small discount for certain beverages purchased in a reusable mug.
In addition, the Office of Sustainability’s Waste Reduction and Recycling students conduct weekly tablings and waste audits to test and refine educational waste bin signage. Annually these students coordinate Zero Waste efforts at events like the BUZZ and Pajaramarino as well as during home football games as part of the GameDay Recycling Challenge. They also promote recycling efforts, and collect and report campus-wide waste and recycling data as part of the Recyclemania competition. This team of students assists with collecting small e-waste and used batteries or empty inkjet and toner cartridges, which are then properly disposed of with the help of partners at Distribution Services and Environmental Health and Safety.
On-Campus Reduction and Re-Use Efforts Unwanted items can be diverted from landfilling and given a next use at two locations:
the Aggie Surplus store, a campus unit under Distribution Services that sells a wide variety of campus-owned items such as furniture, office equipment, and supplies; and
the ASUCD Aggie Reuse store, a student-run store specializing in clothes, kitchen items, and other home or school supplies.
Transportation Services collects abandoned bikes and sells them at biannual bike auctions; nearly 1,000 are sold annually instead of being landfilled. Unserved food from the Dining Commons and some on-campus events is also collected and donated to local shelters or food pantries by the UC Davis chapter of the Food Recovery Network, which diverts more than 4 tons of edible food waste each year.
SHDS actively works to reduce waste at “Move-in” and “Move-out” from on-campus student housing in residential halls. The fall Move-In program sends new residents information about how to reduce their moving waste, and collects packaging materials for recycling. The spring Move-Out program sends residents information about how to recycle and donate unwanted belongings, and provides central collection points for unwanted belongings that are then donated and picked up by Goodwill Industries, or other similar reuse non-profits. SHDS also donates or recycles its dormitory furniture and mattresses to local partners when they upgrade or clean out their existing inventory.
LOCAL As noted in Section 3.0.2, “University of California Autonomy,” UC Davis, a constitutionally created State entity, is not subject to municipal regulations of surrounding local governments for uses on property owned or controlled by UC Davis that are in furtherance of the university’s education purposes. However, UC Davis may consider, for coordination purposes, aspects of local plans and policies for the communities surrounding the campus when it is appropriate and feasible, but it is not bound by those plans and policies in its planning efforts.
City of Davis Groundwater Management Plan Under mutual agreement, the City and UC Davis Groundwater Management Plan (GWMP) was developed in 2006 to address groundwater management needs specific to the City and UC Davis service areas. These areas are not directly included or managed under the Yolo County Flood Control and Water Conservation District GWMP. The GWMP documents planned groundwater management activities and describe potential future actions to increase the effectiveness of groundwater management in the Davis area. The GWMP incorporates information from the Phase I and Phase II Deep Aquifer Studies and other regional groundwater investigations into a plan for managing and

Utilities and Service Systems
UC Davis Volume 1 2018 Long Range Development Plan EIR 3.17-9
monitoring the effects of groundwater utilization. The GWMP includes all mandatory and suggested components outlined in CWC §10750 et seq. and §10753.7. As of March 2018, the Yolo Subbasin Groundwater Management Agency, which includes the City of Davis and UC Davis, is preparing a groundwater sustainability plan for the Yolo Subbasin, which may necessitate updates to this GWMP.
Woodland-Davis Clean Water Agency In 2011, the SWRCB approved the diversion of up to 45,000 acre-feet per year (afy) from the Sacramento River for the Davis Woodland Water Supply Project (DWWSP), to be operated by the WDCWA. The purpose behind the DWWSP was to provide additional/redundant water supplies for the Cities of Davis and Woodland and UC Davis and to address localized issues associated with providing water, including aging water systems, more stringent water quality standards and regulations, and increasing water demands (Reclamation 2013). A surface water treatment plant operated by WDCWA was recently completed and has a capacity of 30 million gallons per day (mgd) (WDCWA 2015). Of the 30 mgd capacity of the water treatment plant that is currently under construction, up to 12 mgd, which includes the University’s 1.8 mgd, will be conveyed to the City of Davis through a 30-inch diameter transmission pipeline. The City supplies up to 1.8 mgd of surface water to UC Davis (Brown and Caldwell 2016), and UC Davis receives the surface water through piping into the northeastern corner of the campus.
3.17.2 Environmental Setting
WATER The campus is served by three water supply systems consisting of: the combined domestic/fire water system, the utility water system, and the agricultural water system. These systems operate independently, draw water from different sources, and contain different water quality. Water is supplied from WDCWA, Solano County Water Agency (SCWA), and groundwater sources managed by UC Davis. Table 3.17-1 identifies the existing water sources and amounts in acre feet per year available to UC Davis.
Table 3.17-1 Existing Water Sources
Water Source Water Use Type Annual Available Supplies (afy)
WDCWA Domestic and Fire Suppression (Potable) 2,016
SCWA Aquaculture and Field Irrigation 4,000
UC Davis Groundwater Wells (Deep Aquifer) Domestic (Potable) >3,0001
UC Davis Groundwater Wells (Intermediate Aquifer) Utility, Landscape Irrigation, and Agricultural Needs 2,351 Notes:
1 Available quantity of groundwater is based on the pumping capacity of the existing groundwater wells (up to 8,500 afy). Refer to Section 3.10, “Hydrology and Water Quality,” regarding potential impacts to groundwater levels associated with the 2018 LRDP.
Source: UC Davis 2018a
Infrastructure related to the domestic/fire water system includes: six groundwater wells; a surface water pump station; three above-ground storage tanks, an underground reservoir, and distribution pipelines.

Utilities and Service Systems
Volume 1 UC Davis 3.17-10 2018 Long Range Development Plan EIR
Water Supply and Infrastructure
Woodland-Davis Clean Water Agency As noted above, the WDCWA is a joint powers authority responsible for managing a sustainable, high-quality water supply for the cities of Woodland and Davis, and UC Davis. In 2011, SWRCB approved the diversion of up to 45,000 afy from the Sacramento River for the DWWSP, to be operated by WDCWA. Water diversions are limited during summer and other dry periods. A more senior surface water right for 10,000 acre feet was purchased from the Conaway Preservation Group to provide summer water supply. WDCWA operates a surface water treatment plant in Woodland that has a capacity of 30 mgd, with an option for future expansion to 34 mgd. Of the 30 mgd, UC Davis is contracted to receive 1.8 mgd or 2,016 afy (WDCWA 2018). All water derived from WDCWA is for domestic/fire use. The water is delivered to the campus water mains near the northeastern corner of the campus.
Solano County Water Agency With respect to agricultural water and aquaculture, water supplies used for agricultural fields and research are derived from the “Solano Project,” and delivered to users without treatment. Water rights associated with the Solano Project, stored behind Monticello Dam and water diverted at the Putah Diversion Dam, are held by the U.S. Bureau of Reclamation. The Bureau of Reclamation sells this water to SCWA. UC Davis is a member of the Solano Project, and currently has rights to purchase 4,000 acre-feet of water from the SCWA per year, although reductions in deliveries can occur during drought conditions. The water is delivered to the southwest corner of the campus via an underground pipeline. Since Fiscal Year 2009-2010, an average of approximately 1,490 acre-feet of untreated Solano Project water has been delivered to the campus per year for agricultural and fisheries purposes. Based on annual average usage rates over this timeframe, approximately 10 percent of Solano Project water supplies aquaculture research and 90 percent is used for field irrigation. UC Davis also has access to surface water from Putah and Cache creeks.
Groundwater The aquifers underlying the campus are within sand and gravel alluvial deposits. The campus draws water from the deep aquifer to serve domestic and fire protection needs, and from intermediate depth aquifers to serve landscape irrigation, utility and agricultural needs.
Six campus wells tap into the deep aquifer at depths between approximately 1,360 and 1,470 feet below ground surface (bgs) to supply the campus domestic/fire system. This system serves campus buildings, cooling and heating systems, and limited landscape irrigation in the west and south campuses (where the campus utility water system does not extend). A water tower and storage tank with a combined capacity of 500,000 gallons and an underground storage reservoir with a capacity of approximately 1,300,000 gallons provide water delivery system stability and storage for UC Davis. The majority of campus domestic water use is for research and cooling/heating systems, as opposed to individual use.
On the main campus, six wells draw water from intermediate depth aquifers to supply the campus utility water system used mainly for irrigation, 21 wells draw from these aquifers to supply main campus agricultural water needs (including aquaculture and field irrigation), and 12 wells are installed into these aquifers at the Russell Ranch to serve campus irrigation needs. The campus utility water system supplies water for central campus landscape irrigation, greenhouse use, and some laboratory use. Utility water demand on campus has declined by approximately 26 percent since 2005-2006, primarily as a result of increasingly efficient landscape watering practices (UC Davis 2018a).

Utilities and Service Systems
UC Davis Volume 1 2018 Long Range Development Plan EIR 3.17-11
Water Demand As discussed above, the campus has three major water use types and systems: the domestic (potable) water system; the utility (irrigation/non-potable) water system; the agricultural/aquacultural water system. Table 3.17-2 provides the 2016–2017 annual water usage by water type.
Table 3.17-2 Existing Water Usage by Water Type Water Type Existing Demand (afy) Percentage (%)
Domestic (potable) Water 1,758 31
Landscape Irrigation1 and Utility2 668 12
Aquaculture (Fisheries) Research 1,192 21
Agricultural Research 1,980 35
Total Water Used (all types)3 5,600 100 Notes:
1 Does not include irrigation for West Village, which is fed from the Domestic Water System and accounted for as part of Domestic (potable) Water demand.
2 103 afy of utility-water demand is satisfied by tertiary-treated reclaimed water from the UC Davis wastewater treatment plant and, as a sustainability feature/efficiency provided by UC Davis, is not considered as part of the total water demand.
3 May not sum to total due to rounding.
Source: UC Davis 2018a
Water Use Trends As discussed above, under Section 3.17.1, “Regulatory Setting,” campus-wide efforts to reduce water consumption have been on-going. These efforts include goals and practices under the Sustainable Water Systems section of the UC Sustainable Practices Policy and 2014 Drought Response Action Plan. The actions included: use of reclaimed water, replacement of older water fixtures, reductions in irrigation, and public education (UC Davis 2018a). Due to these actions, water use per square foot of campus building area has decreased by approximately 50 percent from fiscal year 2005-2006 through fiscal year 2016-2017 (Table 3.17-3).
Table 3.17-3 UC Davis Annual Water Usage in Gallons Per Square Foot 2005-2017
Fiscal Year Building Area (Square Feet)
Potable Irrigation Annual Use 3-Year Average Annual Use 3-Year Average
GPY GPY/ SF GPY/SF GPY GPY/ SF GPY/SF
2005-06 8,987,628 799,081,125 89
87
295,578,667 33
35 2006-07 9,266,606 826,472,907 89 328,182,705 35
2007-08 9,693,870 791,056,967 82 353,838,629 37
2014-15 12,454,337 665,655,000 53
48
229,040,056 18
17 2015-16 12,398,448 573,034,000 46 204,072,000 16
2016-17 12,518,088 572,770,938 46 217,770,938 17 Notes: GPY: Gallons per year; SF=square foot; Square footage calculated based on basic building square footage total plus one-half of all exterior building areas that are covered and unenclosed.
Source: UC Davis 2018a

Utilities and Service Systems
Volume 1 UC Davis 3.17-12 2018 Long Range Development Plan EIR
WASTEWATER UC Davis maintains its own wastewater collection and treatment system. The campus wastewater system includes sewer main lines, service lines, sewer lift stations, and a treatment plant that the campus owns and operates. The plant, located in south campus east of Old Davis Road, provides tertiary treatment of wastewater though use of a mechanical bar screen, oxidation ditch (which offers aerobic biological treatment), sedimentation, filtration and UV disinfection. The tertiary treated effluent is then discharged to the Arboretum Waterway and to the South Fork Putah Creek. Scum and sludge byproducts from wastewater treatment are first pumped to solids storage basins (SSB) for stabilization and then from the SSB to drying beds for dewatering, and finally trucked for landfill disposal. The UC Davis SSB is equipped with two aerators that keep the water column in the first four feet of the SSB aerobic.
Current design capacity of the wastewater treatment plant is 3.6 mgd for average dry weather flow and 9.4 mgd for peak wet weather flow. The campus reuses an old main to deliver some of the tertiary-treated water back to the campus for use in cooling towers. This project enables the campus to make beneficial use of the highly treated water and reduce domestic potable water use by about 33 million gallons/year or 103 afy (UC Davis 2018a).
SOLID WASTE
Collection and Recycling Services UC Davis provides solid waste collection and recycling services for the campus and manages its own landfill waste and recycling collection and hauling, as well as portions of its organics collection and hauling. After collection, landfilled waste is taken to the Yolo County Central Landfill, which is located off County Road 28H near its intersection with County Road 104. The landfill is owned and operated by the Yolo County Department of Planning and Public Works. The facility includes 10 acres of transfer/processing, 473 acres for disposal, and 5 acres used for composting. The landfill has a maximum permitted capacity of 49,035,200 cubic yards and 1,800 tons per day (CalRecycle 2008). The average daily throughput for disposal purposes is approximately 500 tons per day (Kieffer, pers. comm., 2015). The closure date for the landfill is estimated to be January 1, 2081 (CalRecycle 2008). Table 3.17-4 describes existing waste generated at UC Davis during the 2016-2017 fiscal year that was disposed of at the Yolo County Central Landfill.
Table 3.17-4 Existing UC Davis Solid Waste Generation
Waste Type1 Existing (tons per year)
Total Municipal Solid Waste Generated 8,632 Municipal Solid Waste Diverted from Landfill 2,624 Municipal Solid Waste Landfilled at Yolo County Central Landfill 6,008 Notes:
1 Excludes construction and demolition waste, landscape organics, and agricultural/animal waste, which are all considered non-standard municipal solid waste in the UC Sustainable Practices Policy. The campus handles these waste streams through recycling, composting, or other means of landfill diversion.
Source: UC Davis 2018c
In addition to hauling trucks, outdoor and indoor collection bins, compactors, and other typical waste management equipment, UC Davis has two closed landfills located within existing campus property.

Utilities and Service Systems
UC Davis Volume 1 2018 Long Range Development Plan EIR 3.17-13
Neither currently accept solid waste or are anticipated to serve as active disposal sites in the future. The older of the two landfills is a Superfund site and is actively in remediation clean-up. The second landfill, located on the western edge of campus, closed in August 2012 and has a landfill closure plan in place. This landfill consists of a methane collection and monitoring system that utilizes collected landfill gas to power microturbines at the on-site UC Davis Biodigester facility. Landfill gas was previously used to power boilers at the California National Primate Research Center facility, located on the western edge of campus.
Biodigester and Organic Waste Management The on-campus anaerobic digester opened in April 2015 and accepts feedstock from both on-campus and off-campus sources. The digester is designed to handle 50 tons of organic waste a day, though, since start-up, the digester has not consistently received or handled that maximum, because the amount of organic waste feedstock needed has been lacking, and some of the digester’s component equipment has had mechanical failures that have required shut-down time. UC Davis intends to operate the digester to accept up to 50 tons per day, maximum.
The digester generates two “waste” outputs: solid and liquid digestate. The liquid digestate is too high in nitrogen to be disposed of in the campus sanitary sewer system. Currently, to dispose of the digestates in compliance with law, the campus is paying to haul off both the solids and liquid.
STEAM AND CHILLED WATER SYSTEMS UC Davis central campus uses district steam heating and chilled water cooling via three central plants to serve the heating and cooling needs of about 68 percent of built square footage on the campus (UC Davis 2018b). The largest of these is located at the Central Heating and Cooling Plant (Central Plant) within central campus, with smaller plants located south of La Rue Road and at the Primate Center in west campus. Buildings that are not connected to central systems use individual heating, ventilation and air conditioning equipment; that equipment varies depending upon building size, age, and program in the building.
The steam system at the Central Plant consists of four natural gas-fired boilers with a total firm capacity conservatively rated at approximately 380,000 pounds per hour (PPH). The following identifies the specific dates and capacities of the boilers:
2 circa-1967 boilers, one with 75,000 PPH firm capacity, the other with 80,000 PPH firm capacity; 1 circa-1995 boiler, with 75,000 PPH firm capacity; and 1 circa-2007 boiler, with 150,000 PPH firm capacity (UC Davis 2018d).
The four boilers are designed to ensure there is redundancy so that current peak demand can be met with the largest (150,000 PPH) boiler out of service. Centralized heating infrastructure includes a condensing economizer, heat exchangers, and steam supply and condensate return lines. The campus has a heating energy input of about 109 billion Btu/month, during the peak month of December, and an average winter rate of 90 billion Btu/month from November through March.
The campus also operates the following chilled water systems:
Four 2,500-ton electric centrifugal chillers located at the Central Plant with a total design capacity of 10,000 tons.
A Thermal Energy Storage Plant located south of La Rue Road, with four 2,000-ton electric chillers, and a Thermal Energy Storage Tank with a design capacity of 40,000-ton-hours, capable

Utilities and Service Systems
Volume 1 UC Davis 3.17-14 2018 Long Range Development Plan EIR
of approximately 5,800 tons of cooling for 7 hours. (One ton equals 12,000/Btu/hour, thus one ton is the capacity for one hour of cooling).
The Primate Center plant provides district steam heating and chilled water cooling for a much smaller, distinct and separate building footprint on west campus at the California National Primate Research Center. The boilers and chillers at the plant are aging and an infrastructure master plan update has been funded at the time of writing of this memorandum and will begin studying a similar conversion from steam heating to hot water heating. That study will also characterize the possibility of using biogas from the campus biodigester, and a possible solar thermal system co-located with the biodigester (UC Davis 2018d).
ENERGY FACILITIES AND SERVICES Electric and natural gas services in UC Davis are purchased via a Direct Access contract from the Western Area Power Association (WAPA), a federally-run utilities company that markets and transmits wholesale electricity from multi-use water projects (hydropower). Direct Access service is a retail electric service that allows customers to purchase electricity from third party providers instead of from a regulated electric utility, such as the Pacific Gas and Electric company (PG&E), even though such a utility may provide the infrastructure to deliver the electricity. WAPA’s supply of hydropower is contingent upon atmospheric conditions and precipitation events, and therefore varies widely year to year. Due to the inherent uncertainty of hydropower availability, WAPA supplements their energy with other sources (e.g., natural gas, solar).
Additionally, UC Davis operates several renewable electricity installations on campus, including solar generators and a biodigester. The University operates several rooftop solar installations throughout the campus and recently completed the 62-acre UC Davis South Campus Large Solar Power Plant that began generating electricity in August 2015. On-campus solar systems have 17 megawatt (MW) capacity for the campus, with an additional 4 MW of capacity within West Village, which is used exclusively by the existing West Village development. The large solar power plant alone generates approximately 33,000 megawatt-hours (MWh) per year, or 14 percent of the campus’s electricity needs (UC Davis 2017). In 2014, the campus began operating the UC Davis Renewable Energy Anaerobic Digester (READ), a biodigester that converts food and other organic waste to methane through anaerobic digestion and uses the methane to power four-200 kilowatt (kW) micro-turbines, generating electricity (CEC 2017).
With respect to transportation fuels, the University operates a self-service fueling facility offering unleaded gasoline, diesel, oil, and compressed natural gas (CNG) for University-owned and operated fleet vehicles (UC Davis 2016).
3.17.3 Environmental Impacts and Mitigation Measures
SIGNIFICANCE CRITERIA Based on Appendix G of the State CEQA Guidelines, the project would result in a potentially significant impact on utilities and service systems if it would:
exceed wastewater treatment requirements of the applicable RWQCB; require or result in the construction of new water or wastewater treatment facilities or expansion
of existing facilities, the construction of which could cause significant environmental effects; create a water supply demand in excess of existing entitlements and resources;

Utilities and Service Systems
UC Davis Volume 1 2018 Long Range Development Plan EIR 3.17-15
result in the determination by the wastewater treatment provider that serves or may serve the project that it does not have adequate capacity to serve the project’s projected demand in addition to the provider’s existing commitments;
require or result in the construction of new or expanded landfill facilities, the construction of which could cause significant environmental effects;
comply with federal, state, and local statutes and regulations related to solid waste; require or result in the construction or expansion of chilled water or steam facilities, which would
cause significant environmental impacts; or require or result in the construction of new energy production, and/or transmission facilities or
expansion of existing facilities, the construction of which could cause significant environmental effects.
ANALYSIS METHODOLOGY Impacts on utilities that would result from implementation of the 2018 LRDP were identified by comparing existing service capacity against future demand associated with project implementation. When possible, a quantitative comparison was used to determine impacts of the project on future demands. Details related to methodology are provided below.
Water
Domestic (Potable) Water Table 3.17-5 provides demand factors used to forecast domestic (potable) water demands. These demand factors are based on historic potable water demands for on-campus residents, but also consider water use reduction features associated with new development. To calculate academic and lab space water use, the current consumption of water (gallons per year per square foot [gpy/sf]) is used. For this analysis, 48 gpy/sf was used for potable demand, which represent the average from fiscal years: 2014–2015, 2015–2016, and 2016–2017 (averaging is used to address weather and other variations from year to year).
Table 3.17-5 Domestic Water System – Demand Projection Values Residential Type Resident Count Demand Factor in gallons/day/resident
Residential Student Apartment (includes residential halls)1 11,083 75
Residential Student Apartment - West Village2 6,448 95
Residential Family3 2,292 285 Notes:
1. 4,700 additional students (2018 LRDP) + 1,848 existing students on campus water system in apartments, co-op housing, etc. + 4,535 students in residence halls
2. 3,800 additional students (2018 LRDP) + 550 'double-up' students + 2,098 existing residents
3. 1,682 additional faculty/staff and dependents (2018 LRDP) + 610 existing students and dependents
Source: UC Davis 2018a
Utility (Irrigation) Water To forecast utility (irrigation) water demand for the 2018 LRDP, all square footage – existing and projected growth – was multiplied at current GPY/SF demand levels. For this analysis, 17 gpy/sf was used for irrigation, which represent the average from fiscal years: 2014–2015, 2015–2016, and 2016–2017 (averaging is used to address weather and other variations from year to year).

Utilities and Service Systems
Volume 1 UC Davis 3.17-16 2018 Long Range Development Plan EIR
Agricultural and Aquaculture Water Agricultural water is projected to remain steady with current values to reflect a balance between the likelihood of increased water use due to heat impacts and drought conditions under climate change, and reinvestment over the next decade in irrigation equipment that will improve water use efficiency (more drip irrigation, for example).
Aquaculture water is projected to increase by 10 percent to account for possible program growth (UC Davis 2018a), although the campus is also seeking additional water conservation and efficiency in existing practices, which could result in no increase in aquaculture water use. The conservative approach was requested by the campus.
Water Supply As discussed above under Section 3.17.2, “Environmental Setting,” water used within the plan area is derived from three major sources: WDCWA surface water, SCWA surface water, and groundwater. These sources are related to specific water uses, as shown in Table 3.17-1 above.
For domestic uses, historical data indicates that water from the deep aquifer has been available in sufficient quantities to provide domestic supplies (see Impact 3.10-4 in Section 3.10, “Hydrology and Water Quality” for a full discussion on groundwater and the deep aquifer). Under existing conditions (2016–2017), approximately 1,758 afy of water was extracted and reflects existing campus demands prior to surface water deliveries under the DWWSP. Historically, groundwater withdrawal has been substantially greater historically (i.e., 2,536 was extracted in 2006–2007) (UC Davis 2018a). With respect to non-domestic (potable) water demands at UC Davis, current demands for agricultural, aquaculture, landscaping, and other utility needs under existing conditions is approximately 3,841 afy. Of this, approximately 1,490 afy are currently provided via SCWA. Thus, approximately 2,351 afy of water was extracted from the intermediate groundwater aquifer in 2016–2017.
Wastewater To forecast future wastewater generation, current annual consumption was projected by with consideration of 2030–2031 population levels under the 2018 LRDP and compared against available capacity of the UC Davis wastewater treatment plant. Further, for the purposes of this programmatic analysis, it is assumed that adequate capacity for average dry weather flows has been demonstrated because there is adequate capacity for peak flows. With respect to wastewater treatment plant capacity design analysis in the EIR, peak flows refer to wet-weather peak flows.
Solid Waste This analysis considers a reasonable worst-case scenario, which assumes that UC Davis does not meet the policy goal of reducing waste per capita by 50 percent by 2030, and can only achieve a 10 percent reduction. It is assumed, however, that UC Davis will meet the policy goal of diverting 90 percent of municipal waste from the landfill. Waste projections factors used to determine future generation rates at UC Davis are consistent with policy baseline conditions (0.22 tons per campus user per year). This ratio is intended to reflect a business-as-usual projection and does not estimate waste reduction achieved through additional campus conservation programs.
Steam and Chilled Water Systems UC Davis infrastructure for steam and chilled water system would be extended to new/renovated facilities on-campus, as appropriate. As the specific connections would depend on site-specific planning, this analysis focuses on the total demand under future year conditions, taking into account increased energy efficiency for new/renovated uses compared to older structures to be replaced.

Utilities and Service Systems
UC Davis Volume 1 2018 Long Range Development Plan EIR 3.17-17
ISSUES NOT EVALUATED FURTHER All issues applicable to utilities and service systems listed under the significance criteria above are addressed in this section.
IMPACTS AND MITIGATION MEASURES
Impact 3.17-1: Impacts on water supply. Implementation of the 2018 LRDP would generate an additional demand for water, but would not require water supplies in excess of existing entitlements and resources, or result in the need for new or expanded entitlements. This impact would be less than significant.
With implementation of the 2018 LRDP, on-campus population (faculty and staff) would increase, which would result in greater demand for potable water. Additional water demand would occur through expansion of irrigation and aquaculture on-campus. In addition, demand of utility water is anticipated to increase with additional landscaping and possible need for research uses in agriculture and aquaculture programs on the UC Davis campus. Existing and future (2018 LRDP) water demands at UC Davis are shown in Table 3.17-6.
Table 3.17-6 UC Davis Campus Existing and Projected Demand for All Water Types Water User Type (annual consumption) Existing Demand (afy) Projected Demand with 2018 LRDP (afy) Change in Demand (afy)
Domestic (potable) Water 1,758 2,970 1,212
Landscape Irrigation1 and Utility2 668 954 286
Agricultural Research 1,981 1,981 0
Aquaculture (Fisheries) Research 1,192 1,311 119 Notes:
1 Does not include irrigation for West Village, which is fed from the Domestic Water System. 2 103 afy of utility-related water demand is satisfied by tertiary treated water supplies from the UC Davis wastewater treatment plant. This program may be
expanded into the future, however, for the purposes of this analysis, it is conservatively assumed that no increase in existing capacity would occur. Expansion of the program would further reduce projected water demands for intermediate groundwater supplies.
Source: UC Davis 2018a
As discussed above, water used within the UC Davis campus is provided by three major sources: WDCWA surface water, SCWA surface water, and groundwater. These sources are related to specific water uses, as shown in Table 3.17-7. Tertiary-treated water and stormwater also provide some additional supply and groundwater recharge benefits, as described above and in Section 3.10, “Hydrology and Water Quality.”
Table 3.17-7 Available Water Supplies and Projected Water Demand by Water Source
Water User Type Water Source Available Quantity (afy) Projected Demand with 2018 LRDP (afy)
Domestic/Fire (Potable) WDCWA1 2,016
2,970 Groundwater – Deep Aquifer >3,0002
Landscape Irrigation, Utility,3 Aquaculture and Agricultural Research
SCWA 4,000 4,245
Groundwater – Intermediate Aquifer 2,351 Notes: afy=acre-feet per year; SCWA=Solano County Water Agency; WDCWA=Woodland-Davis Clean Water Agency
Utilities and Service Systems
Volume 1 UC Davis 3.17-18 2018 Long Range Development Plan EIR
1 The three participating parties (UC Davis, City of Davis, and Woodland) in the WDCWA have also purchased an additional 10,000 afy of senior water right to ensure some water delivery during curtailment years. During Term 91 conditions (i.e., curtailment of surface water deliveries), dependence on groundwater supplies would temporarily increase.
2 Available quantity of groundwater is based on the pumping capacity of the existing groundwater wells (up to 8,500 afy). Refer to Section 3.10, “Hydrology and Water Quality,” regarding potential impacts to groundwater levels associated with the 2018 LRDP.
3 As noted in Table 3.17-6, 103 afy of utility-related water demand is satisfied by tertiary treated water supplies from the UC Davis wastewater treatment plant. This program may be expanded into the future, however, for the purposes of this analysis, it is conservatively assumed that no increase in existing capacity would occur. Expansion of the program would further reduce projected water demands for intermediate groundwater supplies.
Source: UC Davis 2018a
As noted previously, while potable water use at the UC Davis campus has historically been derived from a deep groundwater aquifer, UC Davis began using water supplied by WDCWA in the summer of 2017 to reduce groundwater demand. Based on the assumptions related to available quantities of water in the deep aquifer and contracted water supplies from WDCWA, projected domestic water demand in 2030-2031 (2,970 afy) would be met through available supplies, as shown in Table 3.17-7. Thus, adequate water supplies would be available to meet the anticipated demand associated with implementation of the 2018 LRDP. Utility water is used for aquaculture, landscape irrigation, utilities, and agricultural needs. As shown in Table 3.17-7, utility water is supplied by SCWA and groundwater. Under the 2018 LRDP, these two water supplies (4,000 afy from SCWA and 2,351 afy from groundwater) would similarly be sufficient to meet projected demand (4,245 afy total) in 2030-2031.
With respect to the reliability of groundwater supplies for domestic/potable use and as discussed in Section 3.10, “Hydrology and Water Quality,” the Yolo Subbasin was not identified by DWR as one of several basins subject to critical conditions of overdraft (DWR 2016). Groundwater levels within the UC Davis campus did not see an overall decline in elevation between 2012 and 2017, which includes the multi-year drought period of 2012 to 2016 (DWR 2018). Further, the City of Davis and the City of Woodland, which have historically used groundwater supplies to satisfy the majority of water demands, has substantially transitioned to using surface water supplies available through the DWWSP, thereby further reducing groundwater pumping in the Yolo Subbasin.
With respect to the reliability of Solano Project water, the 2015 SCWA UWMP states that adequate water supplies are available for its users with limited water use reductions. SCWA identifies up to a 12 percent reduction in available supplies, including those to UC Davis, during multiple dry year conditions (SCWA 2016). UC Davis has historically not used all of its allocated supply (up to 4,000 afy), and a potential 12 percent reduction in allocated supply (3,520 afy) is not anticipated to result in inadequate Solano Project water deliveries to UC Davis.
Furthermore, and as noted above, UC Davis is currently implementing and has plans for future implementation of water conservation measures throughout campus. Currently, the campus reuses an old main to deliver some of the tertiary-treated water back to the campus for use in cooling towers. This project enables the campus to make beneficial use of the highly treated water and reduce domestic potable water use by about 33 million gallons/year. UC Davis is also implementing various water reduction strategies/actions to reduce campus water consumption rates in the future. These actions include:
replacing/modernizing older water fixtures (water-efficient plumbing includes low-flow toilets and showerheads) and cooling systems that use water,
reducing irrigation within landscaping and agricultural areas, using drought-tolerant plant choices such as UC Verde buffalograss; capturing rainwater and using for flushing toilets at the brewery, winery, and food processing
plant,

Utilities and Service Systems
UC Davis Volume 1 2018 Long Range Development Plan EIR 3.17-19
using reclaimed water for irrigation, and implementing behavior education and leak and water waste reporting programs.
Development and implementation of these strategies/actions would further reduce water demand for both domestic and utility uses. Because sufficient water supplies are available to meet projected demand, this impact would be less than significant.
Mitigation Measures No mitigation measures are necessary.
Impact 3.17-2: Require construction of new/expanded water infrastructure. Implementation of the 2018 LRDP could require new water connections or expanded water conveyance systems. However, beyond projects identified as part of the plan, the 2018 LRDP would not require or result in the construction of new or expanded water supply or treatment facilities, the construction of which could cause significant environmental effects. This impact is considered less than significant.
The existing water infrastructure throughout the UC Davis campus would provide some of the distribution infrastructure necessary to provide water service to future uses. However, it is likely that new on-site improvements would be necessary to provide adequate service for localized increases in water demand. Construction of new water pipes would require demolition of surface improvements and excavation activities, which are typically done during the construction of any new land use. Future construction of water infrastructure would adhere to existing laws and regulations, and the water conveyance infrastructure would be appropriately sized for each site-specific development, which includes potable water, domestic irrigation, and fire flow demands. With respect to water treatment and as noted above, the campus uses sodium hypochlorite for treatment of domestic groundwater supplies and the WDCWA water treatment facility for treatment of domestic surface water supplies. The capacity of the existing groundwater extraction/treatment infrastructure has demonstrated through historically higher levels of extraction and treatment that it has the capacity to handle the projected demand for groundwater shown above in Table 3.17-7. With respect to surface water, the WDCWA water treatment facility would provide up to 2,016 afy of treated, domestic water supplies to UC Davis, in accordance with the current agreement and within the operating capacity of the plant.
Implementation of the 2018 LRDP, consistent with the UC Davis Capital Improvement Plan (refer to Chapter 1, “Introduction”), may include water infrastructure improvement projects to further ensure water quality and reliability of distribution/treatment infrastructure, including:
Campus Water System Improvements: replace a domestic well and water tower; continue to retrofit landscape to reduce irrigation needs; and replace aging irrigation system equipment.
Campus Water Source Improvements: potential construction and operation of a satellite water treatment facility for the SCWA water to serve west campus potable water needs; and to distribute SCWA water to parts of campus for landscape irrigation needs to replace groundwater, which is high in boron salts that impair vegetation health.
Recycled Water Expansion: expand the use of recycled water permanently to cooling towers and provide recycled water for irrigation to some areas of campus.

Utilities and Service Systems
Volume 1 UC Davis 3.17-20 2018 Long Range Development Plan EIR
These water infrastructure improvement projects would likely require earth-moving activities, which would result in typical construction-related impacts. These types of impacts are address throughout this EIR (e.g, within Sections 3.1, “Aesthetics;” 3.3, “Air Quality;” 3.5, “Biological Resources,” 3.10, “Hydrology and Water Quality;” 3.12, “Noise;” and 3.16, “Transportation, Circulation, and Parking”). Because the impacts associated with the potential construction of water facility improvements within campus are considered as part of the programmatic development and construction impact discussions in the appropriate technical sections of this EIR, implementation of the 2018 LRDP would not result in the construction of water distribution/treatment infrastructure beyond what has already been assumed, impacts related to the possible need for new/expanded facilities as a result of the 2018 LRDP would be considered less than significant.
Mitigation Measures No mitigation measures are necessary.
Impact 3.17-3: Require construction of new/expanded wastewater infrastructure to comply with applicable wastewater treatment requirements. Implementation of the 2018 LRDP would not exceed the available capacity of existing wastewater infrastructure nor would it require the construction or expansion of wastewater treatment facilities or conveyance systems that could cause significant environmental effects. This impact would be less than significant.
Under the 2018 LRDP, population increases would result in greater levels of wastewater flows, as shown in Table 3.17-8. Under future conditions, on-campus uses are projected to generate up to 1.4 mgd of wastewater, an increase of 0.23 mgd compared to existing conditions (UC Davis 2018a). Similar to existing conditions, projected wastewater flows would remain below the current design capacity of the UC Davis wastewater treatment plant, which can currently treat an average dry weather flow of 3.6 mgd.
Table 3.17-8 Existing and Projected Wastewater Generation Existing Projected Total Campus Demand
Annual Wastewater Generation (million gallons per year) 427.5 512.4
Daily Wastewater Generation – Average (mgd) 1.17 1.40
Wastewater Treatment Plant Capacity – Average (mgd) 3.60 3.60
Adequate Capacity Yes Yes Source: UC Davis 2018a
It is likely that 2030-2031 wastewater flow rates would be less than projected because of planned campus water conservation actions, which could result in reduced wastewater volumes (see Impact 3.17-1 for a description of these actions). However, changes in the composition of wastewater flows may result in additional wastewater treatment requirements. In anticipation of this, UC Davis has preliminarily identified a need to evaluate and potentially improve certain sanitary sewer facilities, through implementation of the Capital Improvement Plan, to address localized changes in wastewater composition and volumes, including at West Village and Orchard Park. Further, implementation of the 2018 LRDP, consistent with the UC Davis Capital Improvement Plan (refer to

Utilities and Service Systems
UC Davis Volume 1 2018 Long Range Development Plan EIR 3.17-21
Chapter 1, “Introduction”), may include wastewater infrastructure improvement projects to further ensure water quality and reliability of the wastewater collection/treatment infrastructure, including:
Campus Wastewater Treatment Plant Improvements: improve plant operations in anticipation of new discharge requirements and for efficiency purposes. This may include upgrading the existing ultraviolet (UV) light disinfection system.
Inflow & Infiltration (I&I) Improvement Project: reduce sewer peak flow and therefore increase capacity in the sanitary system by eliminating stormwater runoff into the sanitary system.
Lift Station Improvements: Improve functionality at two sewer lift stations (5B and 12A).
Thus, because adequate capacity remains at the campus wastewater treatment plant to accommodate project flows, and water conservation efforts would reduce flow rates, significant impacts are not anticipated. Further, impacts associated with the potential construction of wastewater facility improvements to localized increases in flow or to respond to potential changes in wastewater treatment requirements within campus are considered as part of the programmatic development and construction impact discussions in the appropriate technical sections of this EIR (e.g, within Sections 3.1, “Aesthetics;” 3.3, “Air Quality;” 3.5, “Biological Resources,” 3.10, “Hydrology and Water Quality;” 3.12, “Noise;” and 3.16, “Transportation, Circulation, and Parking”). Therefore, implementation of the 2018 LRDP would not result in the construction of wastewater collection/treatment infrastructure beyond what has already been assumed, impacts related to the possible need for new/expanded facilities as a result of the 2018 LRDP would be considered less than significant.
Mitigation Measures No mitigation measures are necessary.
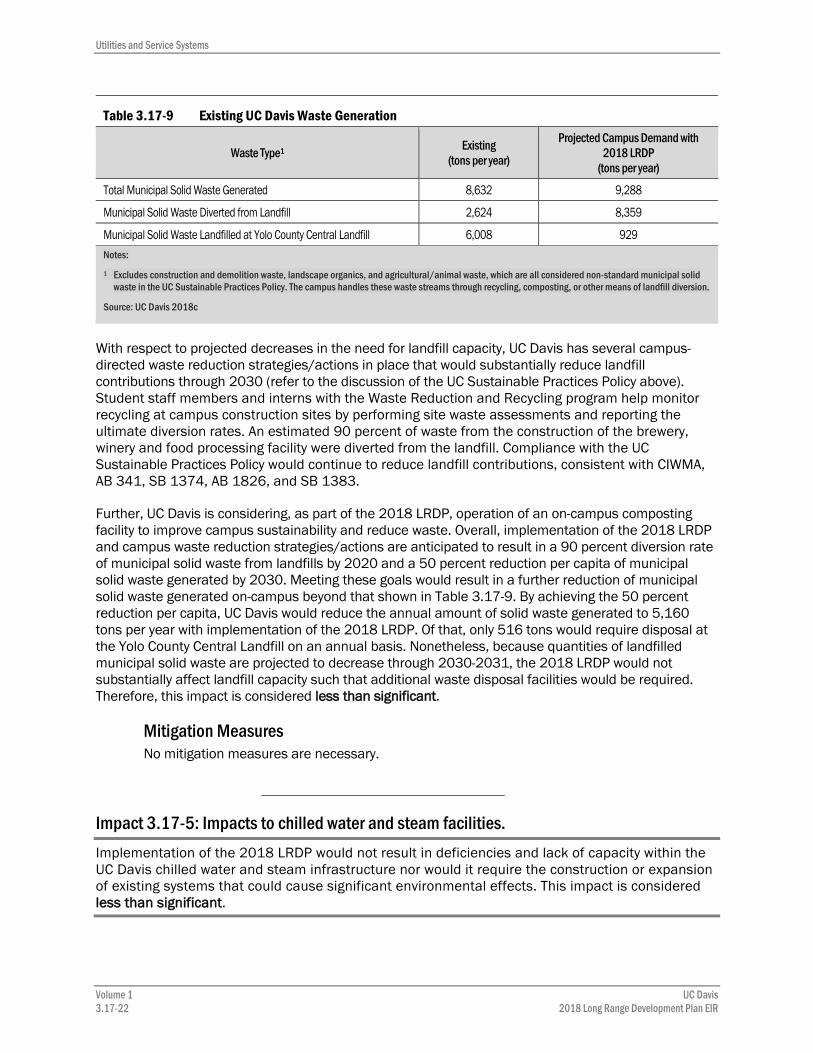
Impact 3.17-4: Impacts to solid waste facilities and compliance with regulations related to solid waste. Implementation of the 2018 LRDP would increase solid waste generation at the campus. However, adequate landfill capacity is available at local and regional landfills to accommodate additional solid waste generated by the project. Compliance with the UC Sustainable Practices Policy would continue to reduce landfill contributions, consistent with CIWMA, AB 341, SB 1374, AB 1826, and SB 1383. This impact would therefore be less than significant.
Implementation of the 2018 LRDP would increase on-campus population levels through 2030–2031. Assuming that waste generation rates remain the same as baseline conditions (see “Analysis Methodology,” above), this would result in an increase in municipal solid waste produced at UC Davis. However, because of increased diversion rate requirements, landfilled quantities are anticipated to be substantially decreased by 2030-2031 (refer to “Regulatory Setting” related to solid waste). Existing and projected solid waste generation at UC Davis, as well as the total anticipated amount to be disposal of at the Yolo County Central Landfill, are shown in Table 3.17-9. As noted above, the landfill has a maximum permitted capacity of 1,800 tons per day with an average daily throughput of 500 tons per day and an anticipated closure date of January 1, 2081. As shown in this table, future demand for landfill capacity by UC Davis, inclusive of implementation of the 2018 LRDP, is projected to decrease, largely through diversion efforts (e.g., composting and recycling). Because the anticipated amount and rate of solid waste to be disposed of at the Yolo County Central Landfill is anticipated to decrease compared to existing conditions, implementation of the 2018 LRDP would not result in inadequate capacity of solid waste facilities in the region such that construction of a new landfill or expansion of an existing landfill would be necessary.
Utilities and Service Systems
Volume 1 UC Davis 3.17-22 2018 Long Range Development Plan EIR
Table 3.17-9 Existing UC Davis Waste Generation
Waste Type1 Existing (tons per year)
Projected Campus Demand with 2018 LRDP
(tons per year)
Total Municipal Solid Waste Generated 8,632 9,288
Municipal Solid Waste Diverted from Landfill 2,624 8,359
Municipal Solid Waste Landfilled at Yolo County Central Landfill 6,008 929 Notes:
1 Excludes construction and demolition waste, landscape organics, and agricultural/animal waste, which are all considered non-standard municipal solid waste in the UC Sustainable Practices Policy. The campus handles these waste streams through recycling, composting, or other means of landfill diversion.
Source: UC Davis 2018c
With respect to projected decreases in the need for landfill capacity, UC Davis has several campus-directed waste reduction strategies/actions in place that would substantially reduce landfill contributions through 2030 (refer to the discussion of the UC Sustainable Practices Policy above). Student staff members and interns with the Waste Reduction and Recycling program help monitor recycling at campus construction sites by performing site waste assessments and reporting the ultimate diversion rates. An estimated 90 percent of waste from the construction of the brewery, winery and food processing facility were diverted from the landfill. Compliance with the UC Sustainable Practices Policy would continue to reduce landfill contributions, consistent with CIWMA, AB 341, SB 1374, AB 1826, and SB 1383.
Further, UC Davis is considering, as part of the 2018 LRDP, operation of an on-campus composting facility to improve campus sustainability and reduce waste. Overall, implementation of the 2018 LRDP and campus waste reduction strategies/actions are anticipated to result in a 90 percent diversion rate of municipal solid waste from landfills by 2020 and a 50 percent reduction per capita of municipal solid waste generated by 2030. Meeting these goals would result in a further reduction of municipal solid waste generated on-campus beyond that shown in Table 3.17-9. By achieving the 50 percent reduction per capita, UC Davis would reduce the annual amount of solid waste generated to 5,160 tons per year with implementation of the 2018 LRDP. Of that, only 516 tons would require disposal at the Yolo County Central Landfill on an annual basis. Nonetheless, because quantities of landfilled municipal solid waste are projected to decrease through 2030-2031, the 2018 LRDP would not substantially affect landfill capacity such that additional waste disposal facilities would be required. Therefore, this impact is considered less than significant.
Mitigation Measures No mitigation measures are necessary.
Impact 3.17-5: Impacts to chilled water and steam facilities. Implementation of the 2018 LRDP would not result in deficiencies and lack of capacity within the UC Davis chilled water and steam infrastructure nor would it require the construction or expansion of existing systems that could cause significant environmental effects. This impact is considered less than significant.

Utilities and Service Systems
UC Davis Volume 1 2018 Long Range Development Plan EIR 3.17-23
UC Davis is currently preparing a phased planning study to consider a conversion from steam heating to heating hot water as part of ongoing campus planning efforts and consistent with the 2018 LRDP. The campus has not formally committed to undertaking the steam to heating hot water conversion. While details related to these improvements are currently under development, the overall plan would involve interrelating the heating and cooling systems for buildings on the centralized systems. Implementation of the system would involve direct-bury (shallow) hot water supply and return distribution pipe network. There are currently two scenarios under consideration: (1) central plant services entailing a combined heating and cooling system with building airside heat recovery, which would reduce natural gas use but keep gas-fired boilers; and (2) central plant services which would be entirely electrified by the end of the useful life of the existing boilers at the Central Plant.
Under either scenario, the campus would lay a new direct-bury (shallow) hot water supply and return distribution pipe network; this would entail disruption of campus circulation, and it is anticipated that much of the new pipe network would follow the existing steam pipe routes, to the extent possible. The intention would be to bury shallow, though there are some areas that would need to be buried deeper to avoid other in-ground utilities.
For any small clusters of buildings identified as appropriate for a distributed approach, a new pipe network would not be required, but each building’s mechanical room would need to be retrofitted with a refrigeration mechanical room to accommodate the heat recovery equipment needed in each building to provide heating recovered from the chilled water loop.
Under the fully electrified centralized approach, a possible geo-exchange system of undetermined size could be built and connected to the campus chilled water loop and central plant. Geo-exchange field construction would entail similar activities as associated with hot water piping distribution such as trenching, barricaded and layback areas, weld testing, and cover, and would necessitate the use of several drilling rigs, spoils testing, and off-haul. Construction extent and timing would depend upon size of field. The field infrastructure visible to the eye after completion of construction would include a small pumping station. No well-heads would be visible. Allowable accompanying land uses of a geo-exchange field could include athletic fields, surface parking lots, agriculture, or similar lightweight land uses. Pastures or holding pens might have some impacts on pipe materials if acidic animal wastes seeped through the soils. Heavy loads, such as buildings, would not be constructible on a geo-exchange field. A maximum of 18 acres would be required to implement a geo-exchange system.
The types of impacts associated with implementation of an improved heated and chilled water system, as well as improved connections to it, would be similar to other ground-disturbing effects described throughout this EIR. These impacts may include the construction-related effects described for air quality, biological resources, cultural resources, hydrology and water quality, and noise (e.g, within Sections 3.1, “Aesthetics;” 3.3, “Air Quality;” 3.5, “Biological Resources,” 3.10, “Hydrology and Water Quality;” 3.12, “Noise;” and 3.16, “Transportation, Circulation, and Parking”). Because the impacts associated with the potential construction of an improved chilled water and steam network within campus are considered as part of the programmatic development and construction impact discussions in the appropriate technical sections of this EIR, implementation of the 2018 LRDP would not result in the construction of infrastructure beyond what has already been assumed, impacts related to the possible need for new facilities as a result of the 2018 LRDP would be considered less than significant.
Mitigation Measures No mitigation measures are necessary.

Utilities and Service Systems
Volume 1 UC Davis 3.17-24 2018 Long Range Development Plan EIR
Impact 3.17-6: Demand for energy services and facilities the construction of which would result in significant environmental impacts. Existing on-site electrical infrastructure and natural gas infrastructure is expected to be sufficient to serve the 2018 LRDP. Energy facilities would meet the 2018 LRDP’s energy needs. Thus, this impact would be less than significant.
PG&E provides both natural gas and electricity distribution infrastructure to customers in Yolo County, including those of WAPA (as noted above). PG&E owns and operates overhead electric transmission and electric distribution facilities as well as gas transmission facilities within the proposed 2018 LRDP boundary. Implementation of the 2018 LRDP would increase energy usage as noted above. However, PG&E periodically prepares load forecasts to ensure the reliability of its electricity/natural gas distribution system. As implementation of the 2018 LRDP would occur over a multi-year period, the projected energy demands of UC Davis under the 2018 LRDP would be factored into PG&E’s load forecasts now and in the future. Though PG&E’s total system demand is expected to continue to increase annually, excluding any unforeseen problems, PG&E’s plans for new distribution resources would be adequate to serve all existing and new customer loads during implementation of the 2018 LRDP. Upon updating their load forecasts, PG&E may determine a need to provide additional distribution facilities within the campus to serve UC Davis and potential P3 projects. However, general construction impacts anticipated to result from implementation of the 2018 LRDP, including the construction or undergrounding of energy transmission and/or distribution lines, are comprehensively analyzed in this EIR (e.g, within Sections 3.1, “Aesthetics;” 3.3, “Air Quality;” 3.5, “Biological Resources,” 3.10, “Hydrology and Water Quality;” 3.12, “Noise;” and 3.16, “Transportation, Circulation, and Parking”). Further, as required by law, all utility connections would be constructed in accordance with all applicable building codes and applicable standards to ensure an adequately sized and properly constructed energy transmission and conveyance system. Any necessary connections would be constructed prior to occupancy and in a manner that would minimize the potential for utility service disruption of existing uses. Thus, the potential impacts resulting from the extension of utility infrastructure to serve new/redeveloped land uses within the UC Davis campus are considered to be evaluated within the scope of this EIR’s analysis.
Because the impacts associated with the potential construction of on-site transmission and/or electrical distribution lines are considered as part of the programmatic development and construction impact discussions in the appropriate technical sections of the 2018 LRDP EIR, implementation of the 2018 LRDP would not result in the construction of electrical infrastructure beyond what has already been assumed and will be assumed in pertinent load forecasts, impacts related to the possible need for new electrical generation or transmission facilities as a result of the proposed project would be considered less than significant.
Mitigation Measures No mitigation measures are necessary.