Embed Size (px)
DESCRIPTION
report
Citation preview

Retail Research
1
Monthly Equity Commentary
D 03 04 05 06 09 10 11 12 13 16 17 18 19 20 23 24 26 27 30 31 J14
21500
21450
21400
21350
21300
21250
21200
21150
21100
21050
21 T
20950
20900
20850
20800
20750
20700
20650
20600
20550
1-1.S&P BSESENSX.BSE - 01/01/14 Trend7
Daily
Month Gone By • The Benchmark indices ended positive for the month of December 2013. BSE Sensex rose
by 1.82%. Nifty rose by 2.07% for the month. Frontline Indices: Week
No % Chg
Key Positives Key Negatives Sensex Nifty
1 +0.98 +1.36
• The HSBC Manufacturing PMI, compiled by Markit, rose to51.3 in November from October's 49.6.
• Peak power deficit in the country shrunk to 3% in October,as against 9.4% in the same month last year, helped byhigher hydel generation due to heavy rains and lowerindustrial growth. Less agricultural load and more hydelgeneration due to heavy monsoon are the prime reasonsfor reduced peak power deficit. Also the industrial sectordid not grow as expected leading to reduction in demand.
• India’s economy expanded 4.8 per cent in July-September, thefourth straight quarter of sub-5 per cent growth. Slower expansionof government-supported services and continued contraction in themining sector were major drags while 4.6 per cent growth inagriculture after just 2.7 per cent in the previous quarter providedcomfort. Gross domestic product (GDP) had grown 5.2 per cent inthe same quarter of the previous financial year.
2 -1.34 -1.46
• Week began on a positive note with investors givingthumbs up to a strong performance of Bharatiya JanataParty (BJP) in assembly elections.
• Key benchmark indices edged lower as gains triggered by strongperformance of Bharatiya Janata Party (BJP) in assembly electionswere washed away by heightened speculation that the FederalReserve may be about to start cutting back on its stimulus program.
• Hawkish comments on inflation from Reserve Bank of India (RBI)Governor Raghuram Rajan triggered speculation that the central
Monthly Strategy Report – January 2014

Retail Research
2
bank will raise its main lending rate viz. the repo rate at thescheduled monetary policy review, this also impacted the marketsentiment.
• Speculation that the Federal Reserve may be about to start cuttingback on its stimulus program also played its part in the week.
3 +1.76 +1.72
• Indian stocks surged after the Reserve Bank of India (RBI)surprised markets by keeping its main lending rate viz.the repo rate unchanged at 7.75% after mid-quartermonetary policy review.
• Investor sentiment was also boosted by stock marketregulator Securities and Exchange Board of India's (Sebi)decision to rationalize the rules on trading of thinly-traded stocks.
• The US Federal Reserve's move to cut its bond-buying programrekindled concerns of slowing foreign inflows.
4 +0.54 +0.63
• Market sentiment was boosted by data showing thatforeign funds remained net buyers of Indian stocks.
• The BSE Mid-Cap and the BSE Small-Cap indicesoutperformed the Sensex during the week.
• RBI Governor Raghuram Rajan said he would stick with theearlier 5% growth projection for the full year, with minorfluctuations in the number.
• The wholesale price inflation continued to show an uptick inNovember as it casts a shadow over possibility of a rate cut by theReserve Bank of India in its upcoming monetary policy review.
• The WPI rose to 7.52% in November from 7% a month ago mainly dueto continued rise in vegetable prices. This takes the wholesale priceinflation to a 14 month high.
• Ratings agency Crisil said government will overshoot its 4.8% fiscaldeficit target by 0.40% this fiscal and suggested state-run companiesshould dip into their cash reserves to narrow the gap by payingextra dividends.
• Indian refiners processed 5 per cent less oil in November than a yearearlier, the second fall in as many months mainly due tomaintenance shutdowns at some plants and soft demand.
5 -0.11 -0.16
• The country may end 2013-14 with a current accountdeficit as low as 2 per cent of GDP thanks mainly to thesignificant drop in gold imports. According to a seniorgovernment official, encouraging signs on various frontssuggest a significantly reduced CAD - at around $40billion. This assessment is much lower than the initialestimate of $70 billion or 3.7 per cent of GDP.
• Reserve Bank of India (RBI) Governor Raghuram Rajan said that thecommencement of tapering by the US Federal Reserve will mean arepricing of certain assets with consequent volatility in the globalfinancial markets and that a potential additional source ofuncertainty for India is the coming general election.
• Investor sentiment was hit adversely after the RBI's latest financialstability report (FSR) said that the risks to the Indian banking sectorhave further increased since the publication of the previous FSR inJune this year.
• Increase in Brent crude oil prices also hit sentiment adversely.Higher crude oil prices stoked worries of increase in current accountdeficit and the government's fiscal deficit.
Retail Research
3
Global markets:
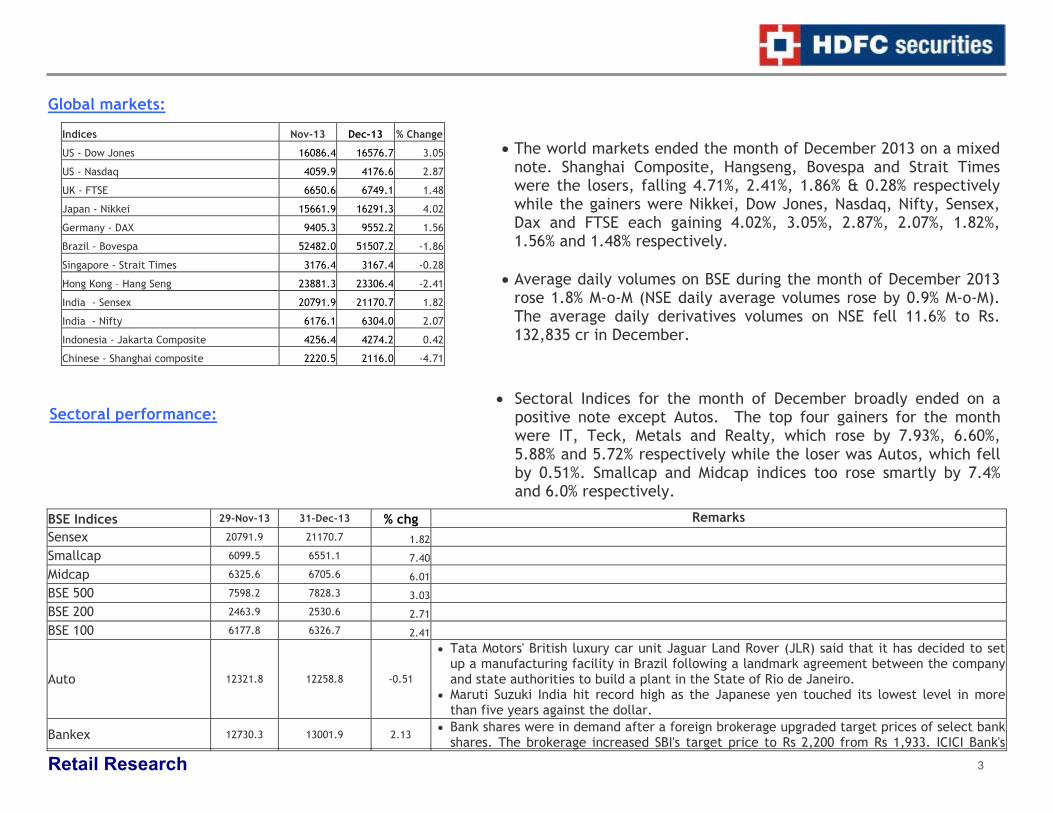
• Sectoral Indices for the month of December broadly ended on a positive note except Autos. The top four gainers for the month were IT, Teck, Metals and Realty, which rose by 7.93%, 6.60%, 5.88% and 5.72% respectively while the loser was Autos, which fell by 0.51%. Smallcap and Midcap indices too rose smartly by 7.4% and 6.0% respectively.
BSE Indices 29-Nov-13 31-Dec-13 % chg Remarks Sensex 20791.9 21170.7 1.82 Smallcap 6099.5 6551.1 7.40 Midcap 6325.6 6705.6 6.01 BSE 500 7598.2 7828.3 3.03 BSE 200 2463.9 2530.6 2.71 BSE 100 6177.8 6326.7 2.41
Auto 12321.8 12258.8 -0.51
• Tata Motors' British luxury car unit Jaguar Land Rover (JLR) said that it has decided to setup a manufacturing facility in Brazil following a landmark agreement between the companyand state authorities to build a plant in the State of Rio de Janeiro.
• Maruti Suzuki India hit record high as the Japanese yen touched its lowest level in morethan five years against the dollar.
Bankex 12730.3 13001.9 2.13 • Bank shares were in demand after a foreign brokerage upgraded target prices of select bank
shares. The brokerage increased SBI's target price to Rs 2,200 from Rs 1,933. ICICI Bank's
Indices Nov-13 Dec-13 % Change
US - Dow Jones 16086.4 16576.7 3.05
US - Nasdaq 4059.9 4176.6 2.87
UK - FTSE 6650.6 6749.1 1.48
Japan - Nikkei 15661.9 16291.3 4.02
Germany - DAX 9405.3 9552.2 1.56
Brazil - Bovespa 52482.0 51507.2 -1.86
Singapore - Strait Times 3176.4 3167.4 -0.28
Hong Kong – Hang Seng 23881.3 23306.4 -2.41
India - Sensex 20791.9 21170.7 1.82
India - Nifty 6176.1 6304.0 2.07
Indonesia - Jakarta Composite 4256.4 4274.2 0.42
Chinese - Shanghai composite 2220.5 2116.0 -4.71
• The world markets ended the month of December 2013 on a mixed note. Shanghai Composite, Hangseng, Bovespa and Strait Times were the losers, falling 4.71%, 2.41%, 1.86% & 0.28% respectively while the gainers were Nikkei, Dow Jones, Nasdaq, Nifty, Sensex, Dax and FTSE each gaining 4.02%, 3.05%, 2.87%, 2.07%, 1.82%, 1.56% and 1.48% respectively.
• Average daily volumes on BSE during the month of December 2013
rose 1.8% M-o-M (NSE daily average volumes rose by 0.9% M-o-M). The average daily derivatives volumes on NSE fell 11.6% to Rs. 132,835 cr in December.
Sectoral performance:
Retail Research
4
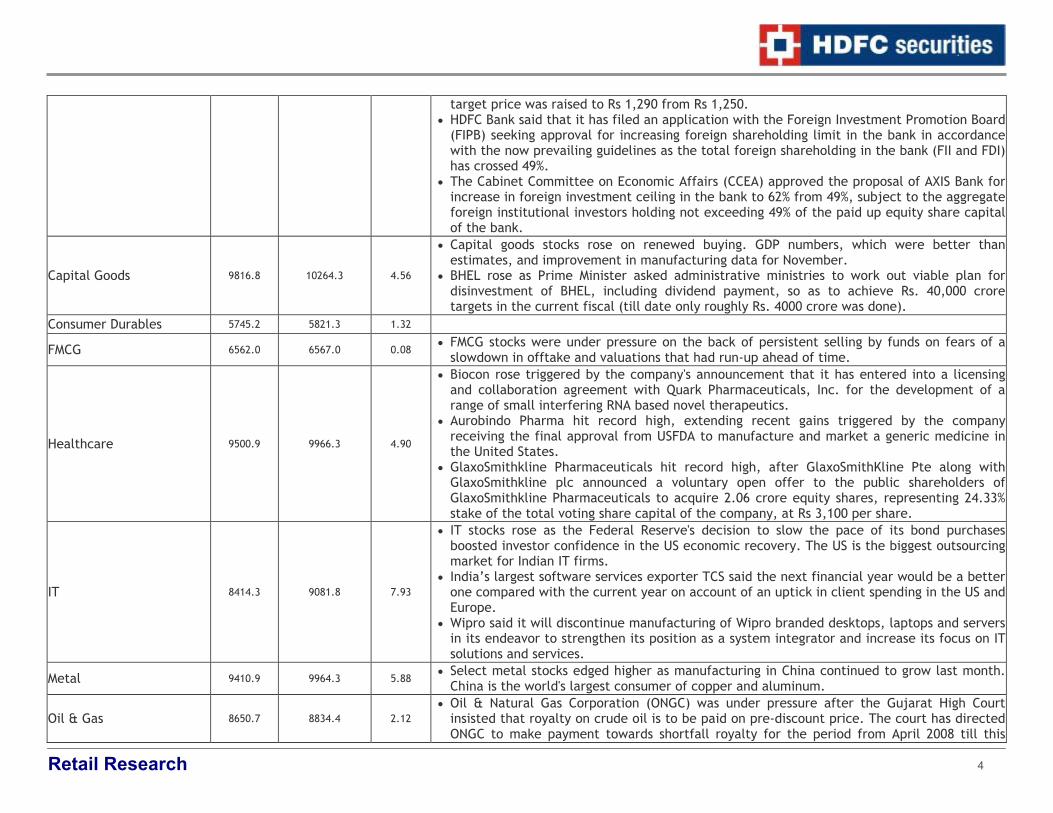
target price was raised to Rs 1,290 from Rs 1,250. • HDFC Bank said that it has filed an application with the Foreign Investment Promotion Board
(FIPB) seeking approval for increasing foreign shareholding limit in the bank in accordancewith the now prevailing guidelines as the total foreign shareholding in the bank (FII and FDI)has crossed 49%.
• The Cabinet Committee on Economic Affairs (CCEA) approved the proposal of AXIS Bank forincrease in foreign investment ceiling in the bank to 62% from 49%, subject to the aggregateforeign institutional investors holding not exceeding 49% of the paid up equity share capitalof the bank.
Capital Goods 9816.8 10264.3 4.56
• Capital goods stocks rose on renewed buying. GDP numbers, which were better thanestimates, and improvement in manufacturing data for November.
• BHEL rose as Prime Minister asked administrative ministries to work out viable plan fordisinvestment of BHEL, including dividend payment, so as to achieve Rs. 40,000 croretargets in the current fiscal (till date only roughly Rs. 4000 crore was done).
Consumer Durables 5745.2 5821.3 1.32
FMCG 6562.0 6567.0 0.08 • FMCG stocks were under pressure on the back of persistent selling by funds on fears of a
slowdown in offtake and valuations that had run-up ahead of time.
Healthcare 9500.9 9966.3 4.90
• Biocon rose triggered by the company's announcement that it has entered into a licensingand collaboration agreement with Quark Pharmaceuticals, Inc. for the development of arange of small interfering RNA based novel therapeutics.
• Aurobindo Pharma hit record high, extending recent gains triggered by the companyreceiving the final approval from USFDA to manufacture and market a generic medicine inthe United States.
• GlaxoSmithkline Pharmaceuticals hit record high, after GlaxoSmithKline Pte along withGlaxoSmithkline plc announced a voluntary open offer to the public shareholders ofGlaxoSmithkline Pharmaceuticals to acquire 2.06 crore equity shares, representing 24.33%stake of the total voting share capital of the company, at Rs 3,100 per share.
IT 8414.3 9081.8 7.93
• IT stocks rose as the Federal Reserve's decision to slow the pace of its bond purchasesboosted investor confidence in the US economic recovery. The US is the biggest outsourcingmarket for Indian IT firms.
• India’s largest software services exporter TCS said the next financial year would be a betterone compared with the current year on account of an uptick in client spending in the US andEurope.
• Wipro said it will discontinue manufacturing of Wipro branded desktops, laptops and serversin its endeavor to strengthen its position as a system integrator and increase its focus on ITsolutions and services.
Metal 9410.9 9964.3 5.88 • Select metal stocks edged higher as manufacturing in China continued to grow last month.
China is the world's largest consumer of copper and aluminum.
Oil & Gas 8650.7 8834.4 2.12 • Oil & Natural Gas Corporation (ONGC) was under pressure after the Gujarat High Court
insisted that royalty on crude oil is to be paid on pre-discount price. The court has directedONGC to make payment towards shortfall royalty for the period from April 2008 till this

Retail Research
5
date, within a period of two months. • Refining stocks were back in favour on expectations that they would bear lower amount of
subsidy even as the Govt is thinking of removing diesel subsidy faster than earlier expected.
Power 1631.7 1700.7 4.23
• Central Electricity Regulatory Commission (CERC) tightened certain rules for tariffs andoperations for the sector in its draft 2014-19 guidelines. CERC's draft regulations havetightened some operational parameters, reducing the use of financial incentives forachieving transmission and generation targets. The guidelines also propose that some of thesavings from fuel costs be partially passed on to consumers. The rules need to be finalisedby March.
• Select power stocks were in demand on hopes that the current and the next Govt due afterthe elections would take steps to remove bottlenecks in the sector.
PSU 5809.3 5909.7 1.73
Realty 1355.9 1433.4 5.72 • Real estate companies, seen as oversold in recent months, rose on value-buying, after the
Reserve Bank of India surprised investors by holding interest rates. TECk 4738.5 5051.3 6.60
Fund Activity
Particulars Net Buy / Sell Net Buy / Sell Open Interest Open Interest
Remarks Nov –13 Dec –13 Nov –13 Dec –13 FII Activity (Rs. in Cr) FII Activity (Rs. in Cr)
Equities (Cash) +7201 +13823 • FIIs were reported large net buyers in December.
Index Futures -2421 +3219 12754 13785 • FIIs were net buyers along with increase in open interest suggesting
building up of long positions. Index Options 10123 3966.6 42634 30112 • FIIs were net buyers along with decrease in open interest.
Stock Futures -2851 -4210.1 29107 30713 • FIIs were net sellers along with increase in open interest suggesting
cash-futures arbitrage possibilities thrown up during the month.
Stock Options -142 -183 360 603 • FIIs were net sellers along with increase in open interest suggesting
creation of fresh shorts. *MF Activity (Rs. In Cr) MF Activity (Rs. In Cr)
Equities (Cash) -482.6 -572.1 • MFs continued to be net sellers in the month of December. * = data till 26th Dec 2013,
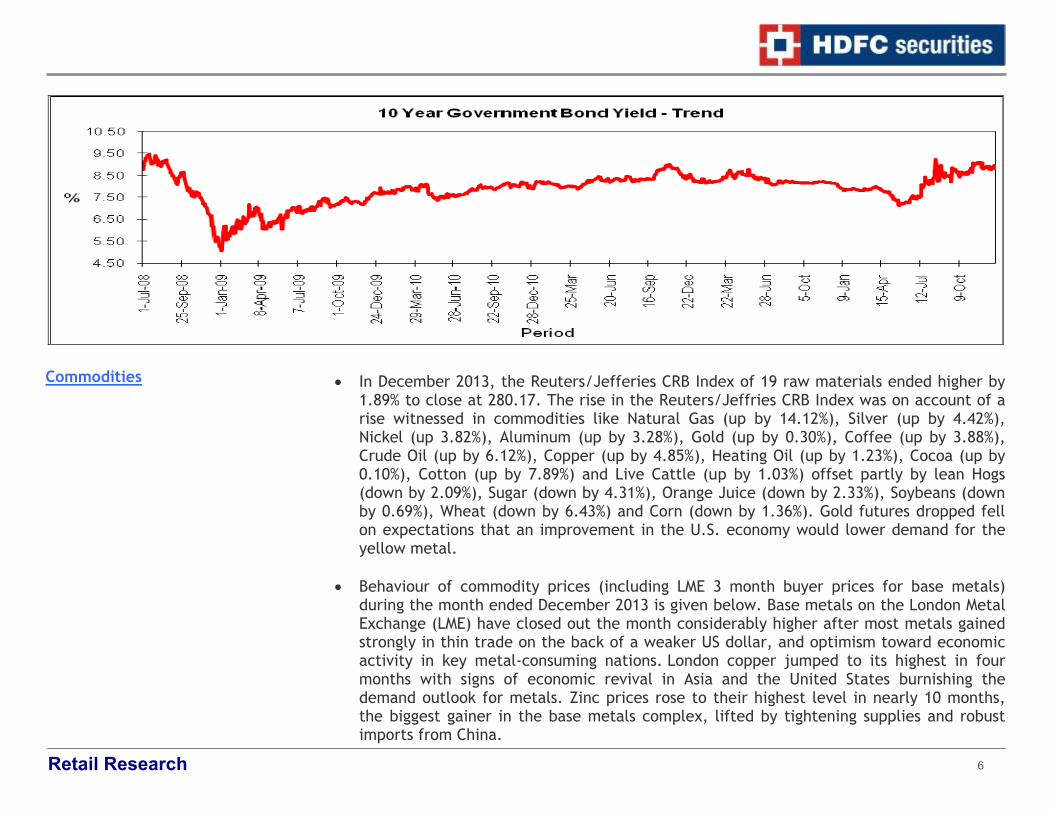
• Indian G-Sec bond yields ended lower by 27 bps at 8.82% at the end of December 2013
over November 2013. Bond yields declined, which means it became less expensive for the RBI to borrow money from investors.
Bond Yields
Retail Research
6
• In December 2013, the Reuters/Jefferies CRB Index of 19 raw materials ended higher by
1.89% to close at 280.17. The rise in the Reuters/Jeffries CRB Index was on account of a rise witnessed in commodities like Natural Gas (up by 14.12%), Silver (up by 4.42%), Nickel (up 3.82%), Aluminum (up by 3.28%), Gold (up by 0.30%), Coffee (up by 3.88%), Crude Oil (up by 6.12%), Copper (up by 4.85%), Heating Oil (up by 1.23%), Cocoa (up by 0.10%), Cotton (up by 7.89%) and Live Cattle (up by 1.03%) offset partly by lean Hogs (down by 2.09%), Sugar (down by 4.31%), Orange Juice (down by 2.33%), Soybeans (down by 0.69%), Wheat (down by 6.43%) and Corn (down by 1.36%). Gold futures dropped fell on expectations that an improvement in the U.S. economy would lower demand for the yellow metal.
• Behaviour of commodity prices (including LME 3 month buyer prices for base metals) during the month ended December 2013 is given below. Base metals on the London Metal Exchange (LME) have closed out the month considerably higher after most metals gained strongly in thin trade on the back of a weaker US dollar, and optimism toward economic activity in key metal-consuming nations. London copper jumped to its highest in four months with signs of economic revival in Asia and the United States burnishing the demand outlook for metals. Zinc prices rose to their highest level in nearly 10 months, the biggest gainer in the base metals complex, lifted by tightening supplies and robust imports from China.
Commodities
Retail Research
7
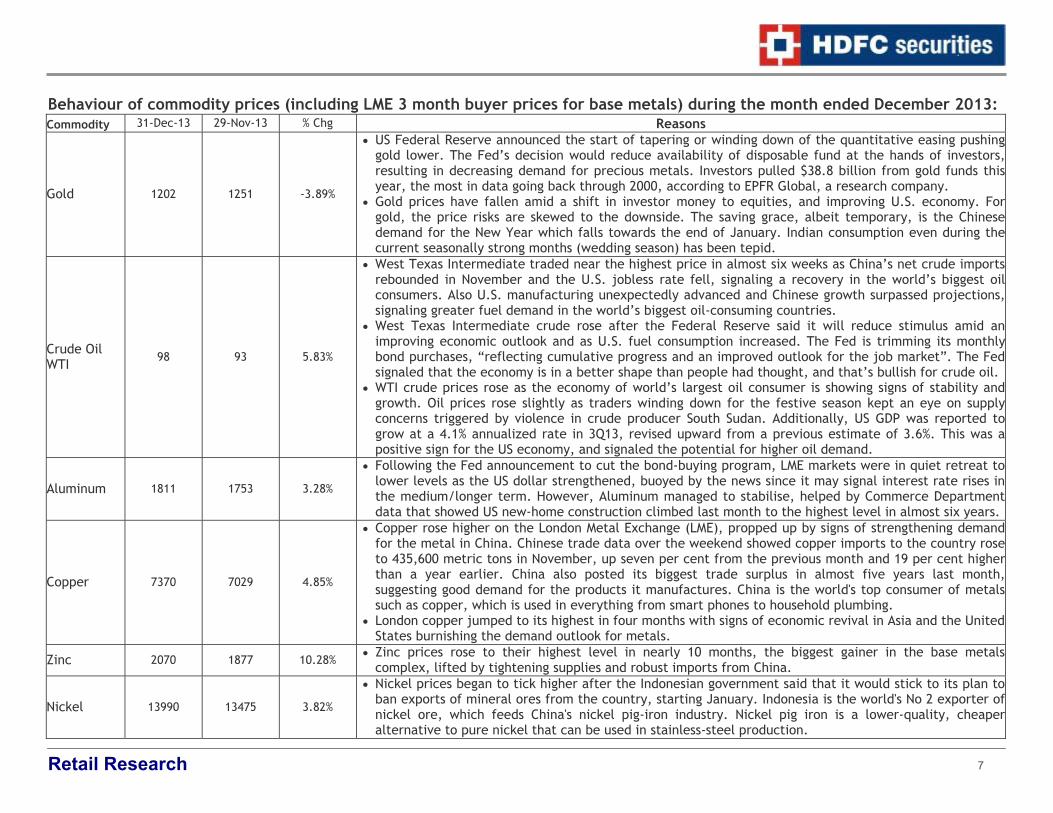
Behaviour of commodity prices (including LME 3 month buyer prices for base metals) during the month ended December 2013: Commodity 31-Dec-13 29-Nov-13 % Chg Reasons
Gold 1202 1251 -3.89%
• US Federal Reserve announced the start of tapering or winding down of the quantitative easing pushinggold lower. The Fed’s decision would reduce availability of disposable fund at the hands of investors,resulting in decreasing demand for precious metals. Investors pulled $38.8 billion from gold funds thisyear, the most in data going back through 2000, according to EPFR Global, a research company.
• Gold prices have fallen amid a shift in investor money to equities, and improving U.S. economy. Forgold, the price risks are skewed to the downside. The saving grace, albeit temporary, is the Chinesedemand for the New Year which falls towards the end of January. Indian consumption even during thecurrent seasonally strong months (wedding season) has been tepid.
Crude Oil WTI
98 93 5.83%
• West Texas Intermediate traded near the highest price in almost six weeks as China’s net crude importsrebounded in November and the U.S. jobless rate fell, signaling a recovery in the world’s biggest oilconsumers. Also U.S. manufacturing unexpectedly advanced and Chinese growth surpassed projections,signaling greater fuel demand in the world’s biggest oil-consuming countries.
• West Texas Intermediate crude rose after the Federal Reserve said it will reduce stimulus amid animproving economic outlook and as U.S. fuel consumption increased. The Fed is trimming its monthlybond purchases, “reflecting cumulative progress and an improved outlook for the job market”. The Fedsignaled that the economy is in a better shape than people had thought, and that’s bullish for crude oil.
• WTI crude prices rose as the economy of world’s largest oil consumer is showing signs of stability andgrowth. Oil prices rose slightly as traders winding down for the festive season kept an eye on supplyconcerns triggered by violence in crude producer South Sudan. Additionally, US GDP was reported togrow at a 4.1% annualized rate in 3Q13, revised upward from a previous estimate of 3.6%. This was apositive sign for the US economy, and signaled the potential for higher oil demand.
Aluminum 1811 1753 3.28%
• Following the Fed announcement to cut the bond-buying program, LME markets were in quiet retreat tolower levels as the US dollar strengthened, buoyed by the news since it may signal interest rate rises inthe medium/longer term. However, Aluminum managed to stabilise, helped by Commerce Departmentdata that showed US new-home construction climbed last month to the highest level in almost six years.
Copper 7370 7029 4.85%
• Copper rose higher on the London Metal Exchange (LME), propped up by signs of strengthening demandfor the metal in China. Chinese trade data over the weekend showed copper imports to the country roseto 435,600 metric tons in November, up seven per cent from the previous month and 19 per cent higherthan a year earlier. China also posted its biggest trade surplus in almost five years last month,suggesting good demand for the products it manufactures. China is the world's top consumer of metalssuch as copper, which is used in everything from smart phones to household plumbing.
• London copper jumped to its highest in four months with signs of economic revival in Asia and the UnitedStates burnishing the demand outlook for metals.
Zinc 2070 1877 10.28% • Zinc prices rose to their highest level in nearly 10 months, the biggest gainer in the base metals
complex, lifted by tightening supplies and robust imports from China.
Nickel 13990 13475 3.82%
• Nickel prices began to tick higher after the Indonesian government said that it would stick to its plan toban exports of mineral ores from the country, starting January. Indonesia is the world's No 2 exporter ofnickel ore, which feeds China's nickel pig-iron industry. Nickel pig iron is a lower-quality, cheaperalternative to pure nickel that can be used in stainless-steel production.

Retail Research
8
Tin 22500 22575 -0.33% • Indonesia's tin exports picked up in November to around two thirds of typical levels, Reuters analysis of
exchange data showed, recovering from a two-month slump triggered by a change in the country'sexport rules.
Lead 2232 2075 7.57% • Lead rose to higher on the back of US tapering news. Source:www.lme.com and www.barcharts.com
• The Baltic Dry Index (BDI) rose 25.04% in the month to close at 2277. The Baltic Dry Index, which tracks global freight rates for ships carrying dry-bulk commodities such as coal and iron ore, gained on signs of recovery in global trade and increase in imports from China.
• The USD strengthened vs other currencies in December 2013 except Pakistani rupee,
Indian rupee and Euro. The dollar rose against most currencies, supported by a rise in U.S. Treasury yields a day after the Federal Reserve announced it would begin to gradually wind down its massive bond-buying program from January.
• The dollar had rallied broadly after the Fed said it would reduce its monthly asset
purchases by $10 billion, bringing them down to $75 billion. A reduction in Fed stimulus would help lift U.S. bond yields and buoy the currency. But in a move to prevent any sharp market reaction, the Fed also said it would likely "be appropriate" to keep overnight rates near zero "well past the time" that the U.S. jobless rate falls below 6.5 percent - effectively extending the timeline for beginning to raise base interest rates.
Given below is a table that shows the depreciation (-)/appreciation (+) of the dollar against various currencies for the month of December 2013: USD to: 31-Dec-13 29-Nov-13 % Chg Reasons Pakistani rupee 106.82 108.45 -1.5% Hong Kong dollar 7.75 7.75 0.1% Chinese yuan 6.11 6.09 0.4%
Indian rupee 61.92 62.39 -0.7%
• The dollar has taken a lot of strengthening from the tapering news. US dollar rose after the FederalOpen Market Committee said it would slow monetary stimulus to $75 billion a month from $85billion.
• The rupee recovered most of its losses and closed up against the Greenback following rally in localequities amid fresh dollar selling by exporters.
Taiwan dollar 30.02 29.59 1.5% Singapore dollar 1.27 1.25 1.5% Argentine peso 6.52 6.14 6.1%
Currencies

Retail Research
9
Euro 0.73 0.74 -1.8%
• The euro fell as ECB President Mario Draghi refrained from introducing further monetary stimulus.The ECB kept its interest-rate targets unchanged and gave no indication that policy makers willintroduce a negative deposit rate that would drive investors into riskier assets.
• Data releases have been mixed with German Industrial Production figures for October showing a1.2% decline; Italian manufacturing figures showing increased growth; and both the French FinalNon-farm Payrolls and German Final Consumer Price Index figures coming out unchanged from thepreliminary estimate.
Thai baht 32.92 32.05 2.7% Malaysian ringgit 3.30 3.22 2.3% Indonesian rupiah 12210.00 11962.00 2.1%
Japanese yen 105.24 102.40 2.8%
• The US dollar touched a five-year high against the yen on account of stronger-than-expected USdata and a budget deal in Washington has brightened the outlook for the US economy. Thegreenback strengthened to almost the highest level since May versus Japan’s currency after Bullard,who votes on policy this year, commented on a report last week that showed the jobless ratedropped to a five-year low of 7 percent in November as employers added more workers thanforecast.
• The yen declined for an eighth week against the greenback after the Bank of Japan retained its planto add 60 trillion yen ($574 billion) to 70 trillion yen a year to the monetary base. The Fed also saidit would likely "be appropriate" to keep overnight rates near zero "well past the time" that the U.S.jobless rate falls below 6.5 percent - effectively extending the timeline for beginning to raise baseinterest rates.
Brazilian real 2.36 2.34 1.0% • Brazil's currency closed weaker against the U.S. dollar amid a gloomy domestic outlook for 2014
fueling inflation fears and causing interest-rate futures to change course and rise as investors betthe central bank will be forced to keep tightening monetary policy despite a weak economy.
Korean won 1063.26 1058.21 0.5% (Source:www.oanda.com)
Comparison of Equity Returns in various markets - MSCI Indices in US$ terms MSCI Index Last MTD 3MTD YTD 1 Yr MSCI Index Last MTD 3MTD YTD 1 Yr BRIC 278.4 -2.2% 1.4% -6.3% -6.3% EUROPE 1,759.2 2.2% 7.5% 21.7% 21.7%
EM (EMERGING MARKETS) 1,002.7 -1.5% 1.5% -5.0% -5.0% G7 INDEX 1,460.0 2.2% 8.2% 25.7% 25.7%
EM ASIA 446.4 -1.3% 3.6% -0.2% -0.2% WORLD 1,661.1 2.0% 7.6% 24.1% 24.1%
EM EUROPE 437.7 -2.6% -1.8% -7.6% -7.6%
EM EUROPE & MIDDLE EAST 372.1 -2.6% -1.8% -7.6% -7.6% SWEDEN 8,161.0 3.9% 5.2% 21.4% 21.4%
EM LATIN AMERICA 3,200.8 -2.8% -3.1% -15.7% -15.7% BELGIUM 1,557.4 3.7% 7.6% 24.6% 24.6%
DENMARK 7,310.2 3.5% 10.2% 23.4% 23.4%
CHINA 63.1 -3.4% 3.8% 0.4% 0.4% GERMANY 2,230.2 2.8% 13.3% 28.2% 28.2%
INDIA 407.3 3.3% 10.1% -5.3% -5.3% UNITED KINGDOM 1,375.4 2.6% 6.7% 16.2% 16.2%
INDONESIA 665.5 -0.9% -5.0% -25.0% -25.0% USA 1,768.4 2.5% 9.7% 29.9% 29.9%
KOREA 442.5 -1.7% 4.0% 3.1% 3.1% NETHERLANDS 2,576.3 2.2% 8.4% 28.5% 28.5%

Retail Research
10
MALAYSIA 507.3 1.1% 4.7% 4.2% 4.2% SPAIN 514.9 2.2% 10.8% 27.7% 27.7%
PHILIPPINES 467.3 -6.6% -5.1% -4.3% -4.3% FRANCE 1,747.5 1.5% 5.7% 23.3% 23.3%
TAIWAN 289.9 1.4% 4.3% 6.6% 6.6% AUSTRALIA 873.9 -1.9% -1.8% -0.3% -0.3%
THAILAND 349.6 -7.8% -10.5% -16.9% -16.9% PORTUGAL 99.4 -2.6% 1.3% 7.5% 7.5%
BRAZIL 2,218.1 -4.8% -6.2% -18.7% -18.7% AUSTRIA 1,276.6 -2.8% 2.8% 10.9% 10.9%
CHILE 1,842.8 -1.8% -7.3% -23.1% -23.1%
COLOMBIA 1,038.3 -2.4% -11.5% -23.7% -23.7% Frontier Markets
MEXICO 6,976.5 0.7% 7.0% -2.0% -2.0% FM (FRONTIER MARKETS) 594.5 2.1% 6.4% 21.4% 21.4%
PERU 1,101.7 5.2% 2.9% -31.1% -31.1%
CZECH REPUBLIC 368.7 -4.0% -0.8% -14.9% -14.9% UNITED ARAB EMIRATES 402.3 17.0% 18.9% 84.7% 84.7%
GREECE 118.5 -2.3% 10.1% 46.3% 46.3% BULGARIA 176.4 10.9% 19.6% 94.7% 94.7%
HUNGARY 467.2 -0.9% -6.3% -9.1% -9.1% SRI LANKA 228.7 7.5% 7.4% 8.3% 8.3%
POLAND 888.5 -4.6% 3.3% -1.7% -1.7% UKRAINE 75.9 7.5% 6.5% -15.8% -15.8%
RUSSIA 786.9 1.6% 0.2% -2.6% -2.6% PAKISTAN 126.9 4.6% 11.7% 26.5% 26.5%
TURKEY 456.1 -15.1% -14.2% -28.1% -28.1% KENYA 1,237.5 -5.3% 1.1% 43.4% 43.4%
EGYPT 675.6 9.0% 19.4% 6.2% 6.2% ZIMBABWE 1,840.7 -5.9% 7.8% 37.5% 37.5%
SOUTH AFRICA 529.3 1.1% 1.7% -8.9% -8.9% ARGENTINA 2,050.9 -9.0% 18.0% 63.7% 63.7%
• Equity markets across the globe ended the month of December 2013 on a mixed note. Among the developed markets, Europe & G7 were the top performers, which increased by 2.2% each. Even World index did well, gaining 2%. Frontier markets reported decent gains of 2.1%. However, emerging markets underperformed during the month, declining by 1.5%. The fall was led by Latin America, which fell by 2.8%. Europe and Europe & Middle East fell by 2.6%, while BRIC index fell by 2.2%. EM – Asia fell the least by 1.3%.
• Amongst the Developed markets, Sweden, Denmark & Belgium were the top three gainers,
up 3.9%, 3.7% & 3.5% respectively. Other markets like Germany, UK, USA, Netherlands, Spain and France also did well, gaining in the range of 1.5-2.8%. However, the index gains were restricted due to underperformance from countries like Austria, Portugal & Australia, which fell by 2.8%, 2.6% & 1.9% respectively during the month.
• Swedish markets outperformed on better than expected economic data released during the month. Retail Sales rose to a seasonally adjusted 0.9% in November, from 0.2% in the preceding month. This was better than the analyst expectations. Sweden’s economy has been showing recent signs of strength. Sweden’s GDP is expected to grow at 1% this year, and will accelerate to 2.4% next year. At that pace, Sweden will overtake the growth rate of fellow Nordic country Norway, and it will grow faster than any other economy in the
Developed & Frontier markets did well; Emerging Markets underperformed
Sweden, Denmark & Belgium - top gainers in developed markets; Austria, Portugal & Australia underperform

Retail Research
11
European Union outside of the Baltic States. In addition, consumer confidence numbers released in November exceeded analysts’ expectations.
• Portugal’s market underperformed, as the economy’s budget deficit in the 12 months to the end of September edged up to 6.3% of GDP from 6.1% at the end of June as spending rose more than revenues. Portugal needs to reduce the gap to 4% next year, when it hopes to follow Ireland in making a smooth exit from the bailout it took in 2011 from the European Union and International Monetary Fund.
• Among the frontier markets, UAE & Bulgaria reported strong double digit gains of 17% &
10.9% respectively in the month of December 2013. Sri Lanka, Ukraine & Pakistan also performed well, gaining 7.5%, 7.5% & 4.6% respectively. However, index gains were restricted due to underperformance from Argentina, Zimbabwe & Kenya, which fell by 9%, 5.9% & 5.3% respectively.
• UAE reported robust gains in December on the back of improvement in the economic fortunes of the country. Dubai’s stock market has more than doubled in 2013. Emaar prices rose significantly (more than 100%) as housing prices in the emirates rebounded. The index has gained 14% since winning the right to host World Expo on November 27. The economy of Dubai, which was hit hard by a housing crash and debt crisis five years ago, is expected to receive a US$23 billion boost through to 2021 on the back of clinching the exhibition, according to official estimates.
• Stocks in Argentina had a negative performance during the last month. The economic data was below expectations. Consumer Confidence decreased to 46.15 in December of 2013 from 49.89 in November of 2013. Argentina's economic activity grew 3.2% in October compared with the same month last year, a result that came in a bit below market expectations. The economy’s GDP contracted 0.20% in the third quarter of 2013 over the previous quarter.
• The emerging markets underperformed during the month, declining 1.5%, led by Latin
America, Europe and Europe & Middle East and BRIC index, which fell by 2.8%, 2.6% & 2.2% respectively. EM-Asia fell the least by 1.3%.
• The fall in the EM – Asia index was mainly led by Thailand, Philippines & China, which fell by
7.8%, 6.6% & 3.4% respectively. However, India, Taiwan & Malaysia outperformed, gaining 3.3%, 1.4% & 1.1% respectively, thus restricting the index losses.
• Thailand fell sharply during the month on concerns that the capital outflows will quicken amid prolonged political unrest in the country. The currency touched the weakest level since
All EMs fell except Asia; Indonesia, Thailand fell 12.2% & 8.9% while China up 4.9%
Latin America, a top loser amongst the EM index; EM – Asia fell the least
Thailand & Philippines top losers; India, Taiwan & Malaysia restrict the EM – Asia losses.
Retail Research
12
March 2010, adding to the worst annual loss in 13 years, and the benchmark stock index dropped to a 15-month low. Global funds pulled $1.3 bn from Thai stocks in December 2013. The central bank would review policy on Jan. 22 after official figures showed exports contracted for a third month in November.
• The Philippines’ benchmark stock index sank to a three-month low and bonds fell on concern that inflation will accelerate after regulators allowed the nation’s biggest power supplier to increase prices by a record. Inflation accelerated to a nine-month high in November as a powerful typhoon damaged crops, crippled infrastructure and downed power lines.
• Taiwan stocks rose, as investor sentiment was encouraged by a Wall Street rally paced by gains in tech heavyweights such as TSMC. US is Taiwan’s second-biggest export market. Taiwan’s export orders rose for the fifth month in November.
• Among the BRIC countries, Brazil & China fell by 4.8% & 3.4% respectively. However, India &
Russia outperformed, gaining 3.3% & 1.6% respectively. • Brazilian markets underperformed as investor caution over a potential reduction in monetary
stimulus from the U.S. Federal Reserve led to a fall in the most heavily-weighted shares. The extremely poor performance of Brazil's stock market -- one of the world's worst for this year is partly attributed to the collapse of EBX group, owned by Eike Batista, Brazil's once-richest man and the seventh richest in the world.
• China reported decline during the month, as the property shares fell after Bank of China predicted in a report Thursday that liquidity would remain tight in 2014 and more Chinese cities would see a decrease in housing price. Further, investors worried about rising funding costs hurting corporate profits after China's money rates spiked.
• Russian stock markets gained during the month on news that President Vladimir Putin would pardon jailed oil tycoon Mikhail Khodorkovsky, a boost for investors increasingly worried about political freedoms and Russia's ability to reform the economy.
• Fall in Latin American markets was led by Brazil, Colombia and Chile which fell by 4.8%,
2.4% & 1.8% respectively. However, index fall was restricted due to outperformance by Peru and Mexico, which gained 5.2% & 0.7% respectively.
• Chilean stocks fell and the peso strengthened after Michelle Bachelet won a second term as president of the South American country on a platform to raise corporate taxes to fund education and health reforms.
China & Brazil pull down the BRIC index; however, Russia & India outperform
Brazil – top loser in Latin America; Peru outperforms

Retail Research
13
• Peru outperformed as the economy’s GDP rose more-than-expected in Nov 2013. In a report, INEI Peru said that Peruvian GDP rose to a seasonally adjusted annual rate of 5.42%, from 4.37% in the preceding month.
• Among the Europe and Europe & Middle East, Turkey was a top loser, down 15.1%. Other
underperformers were Poland, Czech Republic & Greece, which fell by 4.6%, 4% & 2.3% respectively. However, index losses were restricted due to outperformance from Russia, which rose 1.6% and Hungary, which fell marginally by 0.9%.
• Turkey’s stock index slid to the lowest in four months and the lira fell after a third minister implicated in a corruption probe resigned, saying Prime Minister Recep Tayyip Erdogan was responsible and should quit.
• Polish stocks underperformed during the month on the back of disappointing economic data. Construction output in Poland decreased 4.30 percent in October of 2013 over the same month in the previous year. Polish PPI unexpectedly fell in November to a seasonally adjusted -1.5%, from -1.3% in the preceding month.
• Among the African markets, Egypt outperformed with sharp gains of 9%. The stock index reached 35 month high after the finance minister announced plans for a second economic stimulus package worth around 30 bn Egyptian pounds ($4.4 bn).
• Global bond issues fell by more than 4% in 2013, to reach $3.66tn. The concerns of US Fed tapering impacted bond raising plans in 2013 on account of significant volatility in interest rates.
• The US 10-year bond yields crossed 3% in December 2013, on account of positive indicators in the US economy and the announcement of tapering by the US Fed. January marks the beginning of the Fed's tapering, though it has not translated into a major trend change for the dollar. Unwinding the tapering is not only going to be challenging for markets but also for the US Fed. The communication strategy of the US Fed will be critical.
• If the recovery of the US economy is faster in the 1st half of 2014, it can surprise the US Fed as well. The fiscal challenges of the US economy may also have an impact on the US Fed action.
Outlook going forward
Global Market Outlook
Fed Tapering – Limited Impact
Turkey, Poland & Czech Republic pull the EM – Europe and Europe & Middle East lower; However, Russia outperforms
Egypt outperforms in Africa
Retail Research
14
• The Fed has decided to reduce the quantum of bond buying per month from the next year. So, it would reduce its monthly asset purchases by $10 billion to total $75 billion. Chairman Ben Bernanke said the Fed will take "similar moderate steps" throughout next year to reduce the purchases further if the economy shows continued improvement.
• Though the Fed will cut back on bond purchases, it plans to hold its key short-term rate near zero at least until unemployment falls below 6.5 per cent. Fed's outlook on rates was interpreted as more dovish than expected leading to a rally in stock markets globally.
• There will definitely be an impact on the countries which benefited from the QE programme as funds did flow into both equities and debt. The news of tapering prompted them to move away from the debt segments and thus put pressure on the balance of payments of the concerned countries and hence their exchange rates. If the funds were being directed to debt, then interest rates will matter for potential investors. Further, exchange rate stability would be assessed when funds are taking a decision on in which country to invest.
• We therefore expect the US economy to continue picking up pace in the course of 2014 and to grow by 3%+ for the full year compared with ~1.8% in 2013.
• China’s economy had a roller-coaster ride in 2013, with a rosy start giving way to a
slowdown and widespread gloom, before a rebound in the third quarter brought things full circle.
• The extensive reforms passed in November are likely to curb state influence on companies and the financial system and thus boost the efficiency of the economy considerably.
• China has been making big plans towards economic stabilization and improvement in recent times, and the latest efforts from the central bank and policy makers have them making promises for the future.
• Those within the Chinese government are looking to reduce local government debt while the central bank is working to keep fiscal policy predictable during 2014 reforms. The reform plan, announced earlier this year, marks the beginning of major changes meant to improve China’s economy by transitioning the country’s economy from one based on investment to one based on consumption. Included in the plan are governmental urgings to improve departmental delegations and streamline administrative actions.
• The biggest question mark hanging over China’s economy is the real-estate market. A massive building boom and years of double-digit prices rises have pushed the dream of home ownership out of reach for many Chinese and led to fears of a bubble.
China – on the verge of a debt crisis?

Retail Research
15
• After the global financial crisis broke in late 2008, China relied heavily on new construction — financed by local bodies — to cushion the adverse effects on employment and economic growth. Now dependence on this investment spending poses a dilemma for China. If construction and the accompanying debt are cut too rapidly, the economy will suffer. But if the spending isn’t curbed, the financial risks may multiply as the projects become less viable.
• The total debt of local governments in China has soared to nearly $3 trillion as the country’s addiction to credit-fuelled growth has deepened in recent years. Although the debt load shows China's government to be far less indebted than fiscally-troubled Japan and Greece, it raised eyebrows among analysts for its 67 percent jump since the last state audit was published in 2011.
• A gale of change has started sweeping across India. It has brought palpable hope. Millions, pushed beyond the periphery and treated with indifference by the larger established parties and smaller look-alike parties, are rejoicing. That slight-looking man, Arvind Kejriwal, the like of which has not appeared on the Indian political scene for a long time, has set on a path where ordinary Indians feel they would have a say in creating their own future. No more business as usual in politics.
• Riding on its anti-corruption campaigns political newbie Aam Aadmi Party assumed power in Delhi, the BJP wrested Rajasthan from the Congress in the 'mini' general elections and the country braced itself for the general elections in 2014 as the year drew to a close.
• The rise of Kejriwal, a social activist who until a year ago was a relative unknown, has sent shockwaves through Indian politics. The Delhi elections were the AAP’s first electoral test, and the party’s spectacular performance at the ballot box has been heralded as a new phase in the country’s politics.
• The AAP rode on the promise of combating corruption to oust Sheila Dixit, who had held the Delhi Assembly for the Congress for 15 years. The AAP were 8 seats short of a majority and, after an offer of “outside support” from Congress, took the Delhi Assembly with a minority government.
• In the forthcoming general elections (due in May 2014) a stable new government would be positive for the economy. Although a stable new government may be a blessing for an economy battered by slowest growth in nearly a decade, developments point to a coalition which may be unstable. While coalition governments have become the norm since 1989,
Indian Politics – Early General Elections
Indian Market Outlook

Retail Research
16
their composition matter. The elections to New Delhi Assembly show that emergence of new parties such as the Aam Aadmi Party could make the forecast unpredictable.
• A rag-tag coalition post the elections without policy focus, could adversely affect the nation's standing among rating companies which have said that early steps of the new government will decide the fate of sovereign rating which is at the risk of getting downgraded to junk.
• The 2014 election’s verdict could be decisive, as indicated by the voting pattern in the recent state elections, which could set the ball rolling in terms of reforms. This could shift the sentiment in a meaningful way, though the macro indicators could improve with a lag. Traditionally, the markets move up 8-10% in six months before a general election. The same is expected to happen this time as well. However, the possibility of a hung parliament and sustained trend in inflation could rein in excessive optimism.
• The tapering announcement came as a surprise but the good thing is that the Indian market
did not respond too negatively. This is because foreign institutional investor (FII) inflows are unlikely to be affected immediately.
• The entire process of tapering is based on the premise that the US economy is on the recovery path and does not require any unconventional means of support from the Fed. This has been calibrated with the unemployment rate being brought down to 7%.
• The tapering programme actually should not affect other countries because the QE programme was meant to stimulate the US economy really. But quite to the contrary, it ended up being used to invest in emerging markets where returns were better.
• The Reserve Bank of India said the effects of the withdrawal of the US Federal Reserve stimulus programme will be limited and short-lived, thanks to the breathing space provided by a decision on this having only been taken in December.
• India utilised the delay in tapering to bring about adjustment in the current account deficit and built buffers by replenishing its foreign exchange reserves.
• The tapering, from January, of the USD 85-billion monthly bond buying programme by US Fed to prop the American economy, has given India time to replenish forex reserves and rein in high CAD, which was at 3.05 percent in first half of this fiscal (2013-14) as against 4.8 percent last fiscal.
• At the same time it will be too naïve to assume that tapering will not have any impact on Indian debt, equity and currency markets. If some local negative issue plays out in the interim (due to political or other issues) the pending tapering could exacerbate the
Impact of Fed Tapering on India
Retail Research
17
downward impact by preponing the outflows. Though later on long term FII inflows could come in, in the interim a lot of volatility could hurt our markets.
• WPI inflation accelerated to 7.5% in Nov from 7% in the previous month, led by still elevated food prices (veg prices) as non food inflation remained steady. Inflation as measured by the CPI index, which we believe is more important to track, also accelerated to a new high of 11.2% in Nov vs. 10.1% in Oct. Food inflation accelerated while non-food non-fuel CPI inflation remained steady at 8%. Old CPI (IW) inflation also remained high, at 11.1%, in October.
• Interest rates in Asia’s third largest economy could remain stable in 2014 on the back of an expected decline in the inflation numbers, but rates are unlikely to fall from the current levels, as inflation—the main worry for the Reserve Bank of India (RBI) since mid-2009—is likely to hover above the apex bank’s comfort zone, leaving little room for any significant monetary easing. Bank lending rates, too, will remain stable in the new year, but will not come down unless RBI cuts its key lending rate.
• The Indian central bank unexpectedly chose to keep its key lending rate unchanged in its mid-quarter policy review on Dec 18, saying inflation is showing a declining trend due to a fall in vegetable prices and aided by a stable rupee.
• However, the apex bank may raise interest rates one more time if inflation (especially core) doesn’t slow as expected, but that could be the last increase in the current policy cycle.
• In Q3FY13, India Inc flattered only to deceive. After the early birds posted sterling numbers in Q3FY13, it had been a story of continued deceleration in corporate earnings. In September 2014, Indian companies have reported encouraging earnings and sales in the fiscal second quarter as the weakening of the local currency against the dollar boosted exports.
• IIP for October 2013 disappointed by contracting 1.8 percent, and at the same time the CPI inflation data came as a major negative surprise at 11.2 percent for November 2013. Crucial eight infrastructure industries saw a rise in production in November after a contraction in the previous month. However, the growth stood muted at just 1.7 per cent. Production of these industries declined 0.6 per cent in October this year and rose 5.8 per cent in November, 2012.
• Forex impact in Q3FY14 has been minimal after 2 quarters of turmoil. In fact there has been marginal appreciation of INR in December quarter to 61.897 vis-à-vis 62.777 at the end of September quarter. Rupee appreciation could benefit companies having ECB exposure while
Possible Rate Hike ?
Quarterly Preview - Q3FY14/Q4CY13

Retail Research
18
companies in IT and Pharma sectors could witness small impact due to this appreciation (depending upon the quantum of hedging done). Net importers could be a beneficiary of this rise in INR to USD.
• In Q3FY14, sequential growth in numbers is expected to be lower than the y-o-y growth on account of the festive season activity getting preponed to Q2FY14.
• Overall in Q3FY14 we expect a very small y-o-y sales growth but a slightly better PAT growth. No fireworks are expected out of these results (unless the results disappoint majorly) and the markets will perform based on expectations of the scenario improving post Q4FY14.
• The year 2014 is likely to be no better or worse than 2013. That is a dramatic statement. But in markets like India only large global events can bring deep corrections in its equity markets (say 2008 - lehman crisis and 2000 – tech bubble). Local events and developments - all said and done - are not so important given the fact that India’s demographic situation does not lead itself to sharp and sudden falls in growth rates.
• While the markets in 2013 fell from February to August only to rise again, in 2014 we feel such a period of correction could get postponed by a couple of months (in view of the forthcoming general elections). But before that we may witness our markets making new highs.
• We however feel that 2014 may witness the return of Indian investor into equity markets even as the other asset classes (gold, real estate etc) do not show similar promise and the broader markets begin to perform. Interest rates in the system could remain high till atleast April (given the seasonally high liquidity requirements and tight Govt spending looking at the fiscal situation) and then start softening. This expectation could lead to build up in stocks that could benefit out of easing interest rate cycle.
• After underperforming severely in the past few years, midcaps and smallcaps (even as the BSE Sensex reached an all-time high in 2013, the broader market represented by the mid- and small-cap indices are traded 20% and 50%, respectively, below their historical highs) may make a comeback in 2014 and narrow the difference with the largecap in terms of valuations. Hence the broader markets may perform better than the frontline indices. Even as farm sector growth slows down (owing to a high base effect), a pick-up in industrial sector growth is likely to propel GDP growth in FY15.
• We could see some volatility in January, thanks to QE tapering coming in. Also, investors will be watchful of the inflation data and corporate results. The pre election buildup may
Markets likely to remain range bound between 20,300-21,700 in the month of January
Retail Research
19
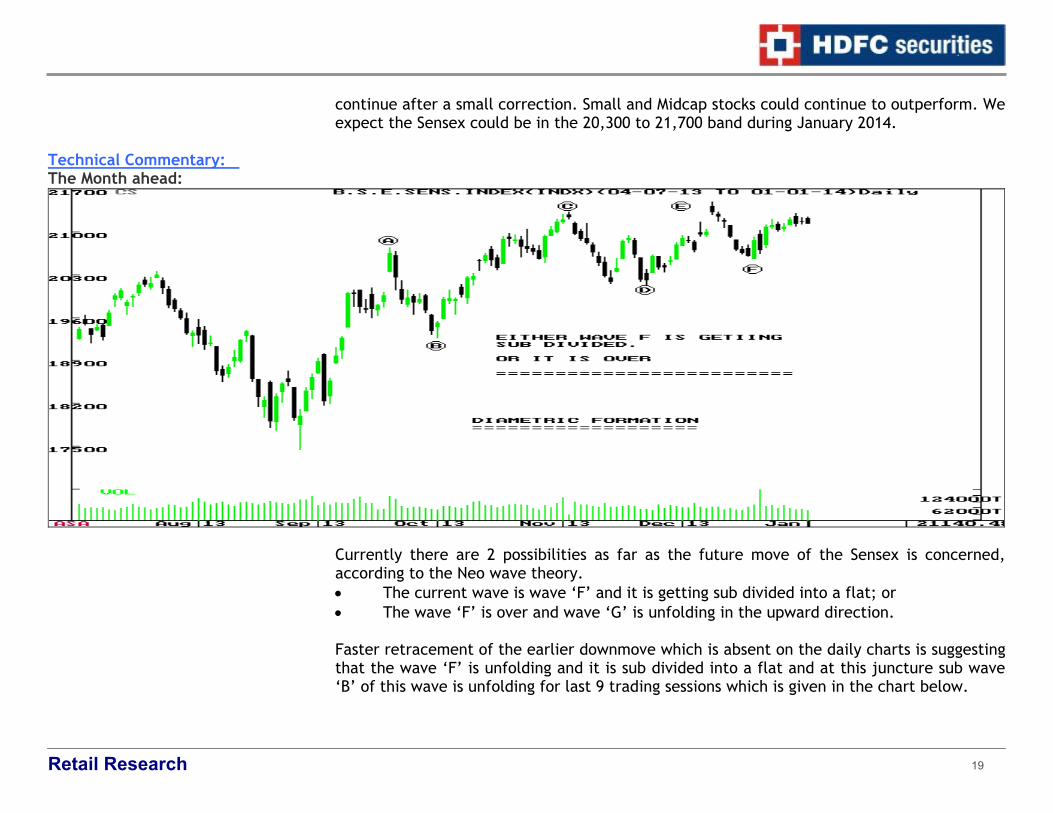
continue after a small correction. Small and Midcap stocks could continue to outperform. We expect the Sensex could be in the 20,300 to 21,700 band during January 2014.
Technical Commentary: The Month ahead:
Currently there are 2 possibilities as far as the future move of the Sensex is concerned, according to the Neo wave theory. • The current wave is wave ‘F’ and it is getting sub divided into a flat; or • The wave ‘F’ is over and wave ‘G’ is unfolding in the upward direction. Faster retracement of the earlier downmove which is absent on the daily charts is suggesting that the wave ‘F’ is unfolding and it is sub divided into a flat and at this juncture sub wave ‘B’ of this wave is unfolding for last 9 trading sessions which is given in the chart below.

Retail Research
20
The wave ‘F’ began from 21,484 which was a new all time high and from there onwards it came down for 8 trading sessions which is an important Fibonacci number. It took support at the b-d line which is marked on the chart above. This is labelled as subwave ‘A’ on the chart above which was retraced thereafter by exactly 80% which is an important ratio in Neo wave analysis. This is labelled as subwave ‘B’ on the chart above. According to the rules wave ‘B’ must consume more time than wave ‘A’ when flat structure is unfolding. Once subwave ‘B’ is over subwave ‘C’ will open in the downward direction.This could go to a little lower than 20,569. For this to take place here onwards the level of 21,305 must be used as stop loss level. In such a case, it would be safe to assume that wave ‘F’ got over at 20,569 and upward wave ‘G’ has started from there.
Retail Research
21
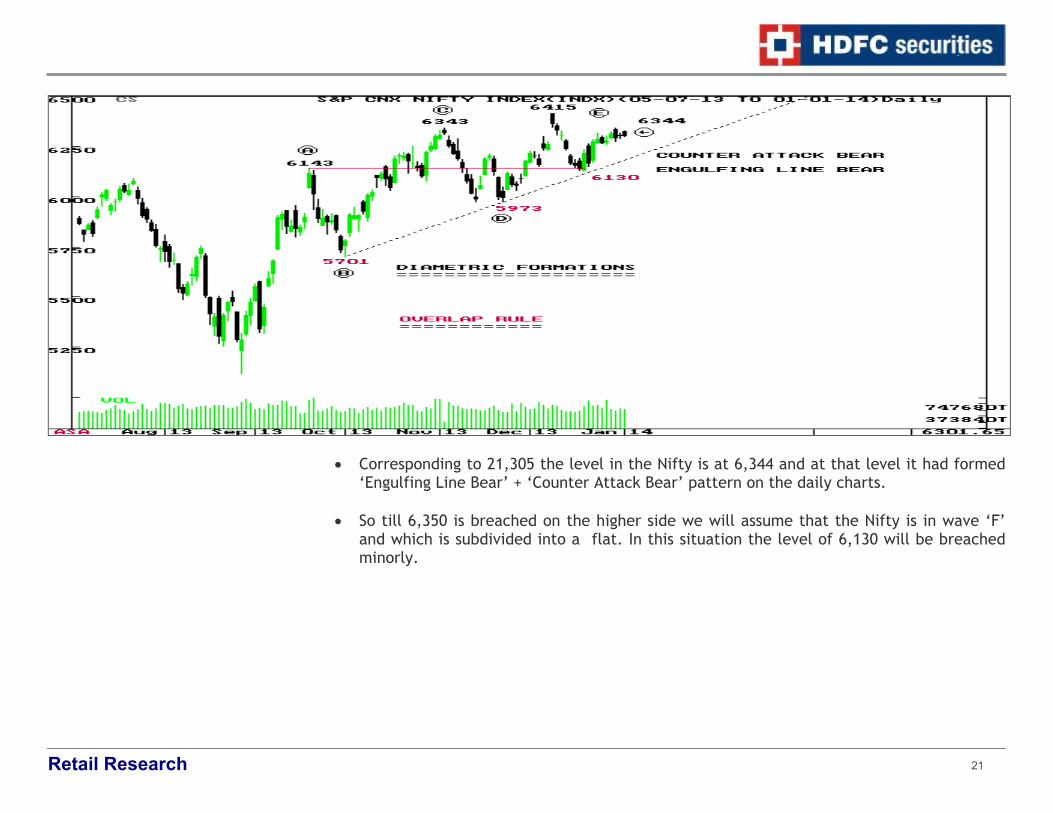
• Corresponding to 21,305 the level in the Nifty is at 6,344 and at that level it had formed ‘Engulfing Line Bear’ + ‘Counter Attack Bear’ pattern on the daily charts.
• So till 6,350 is breached on the higher side we will assume that the Nifty is in wave ‘F’
and which is subdivided into a flat. In this situation the level of 6,130 will be breached minorly.

Retail Research
22
• Channelling technique is considered as a very important tool in Neo wave analysis. According to it the final target when wave ‘G’ will unfold once 6,415 will be breached will be closer to 6,600.

Retail Research
23
The month gone by:
• For the month of December the Sensex opened at 20,771. The Sensex went sideways for
next 2 trading sessions after making an upgap. It once again made an upgap reaching a high of 21,484 on Dec 09, which was the high for the month. For the next 8 trading sessions it was continuously coming down, forming ‘Lower Lows and Lower Highs’ on the daily charts.
• The Sensex formed an intermediate bottom at 20,569 and formed a ‘Large Bull Candle’ on the daily charts and which was followed by a bearish ‘Dark Cloud Cover’ pattern on the daily charts. But this pattern was not confirmed on the next trading sessions which resulted into an upward rally. For the next 7 trading session the Sensex moved in a sideways manner and finally closed the month at 21,171.
Learning Technical Analysis
• Goals are an excellent way to become a better trader. Goal-setting and working to improve your trading through goals are an efficient way to develop a trading edge. Having a goal is a key practice of trading psychology.
Trading Psychology –5 Ways Trading Goals Make You A Better Trader
Traders: Do you have goals?

Retail Research
24
• Are you one of the few traders who have goals? Or, are you like most traders and think that it is too much effort to set goals so you just don't bother?
• If you want to be a better trader, having and working on goals will help to set you apart from other traders. Here are five key reasons to have trading goals.
• Trading goals give you direction. Many traders work hard, but not always on the right
things. Goals are the first important step in giving yourself the right map to follow. • Trading goals focus your attention. Once you are working on things constructive to your
trading, goals help you focus. If you are working on a goal to improve you entries, for example, your attention will be focused on making better entries. Goals help you to channel your effort into actions that will improve your trading skills and that help make you a better trader. Isn't that reason enough to start thinking about your goals?
• Well-constructed trading goals tell you how well you are doing. Most traders track how
much money they made or lost, but this has limited utility and it is doesn't say much about your true abilities as a trader. It is only by having a goal as a reference point that you can measure yourself. Not only do goals tell you how well you are doing, they also tell you what you need to work on. It is only by first knowing where we fall short that we can actually take the needed steps to improve.
• Working on your trading goals puts you in control of the right things. We can never
control how the market will trade, what other traders do, or whether any given trade will win or lose. But we can control our actions and goals help us in this regard. Let's again use the example of improving our entries. When working on our entries, we naturally put ourselves in a position of controlling our actions with respect to what type of entry we look for, when we pull the trigger, and letting it pass if it doesn't set up properly. Goals help us control what can be controlled and let go of the things we can't control.
• Trading goals help you develop confidence. More than anything else in this game, working on and making progress toward our goals gives us that elusive confidence every trader desires and needs. If you really think about it, nothing else in trading brings us the confidence we seek as quickly or as effectively.
5 Ways Goals Help You Become A Better Trader
Ego and Anxiety and the Effects on Trading
Retail Research
25
• Goals are a vital part of trading. Start working on your goals and you may be surprised at
how quickly results begin to follow.
• An important part of setting up your trading goals is reviewing your trading day. The daily review gives important information on what we do well, where we fall short, and where goal setting can be particularly helpful.
From - Dr. Gary Dayton - TradingPsychologyEdge.com Acknowledgement: http://EzineArticles.com/5064651
Derivatives Commentary:
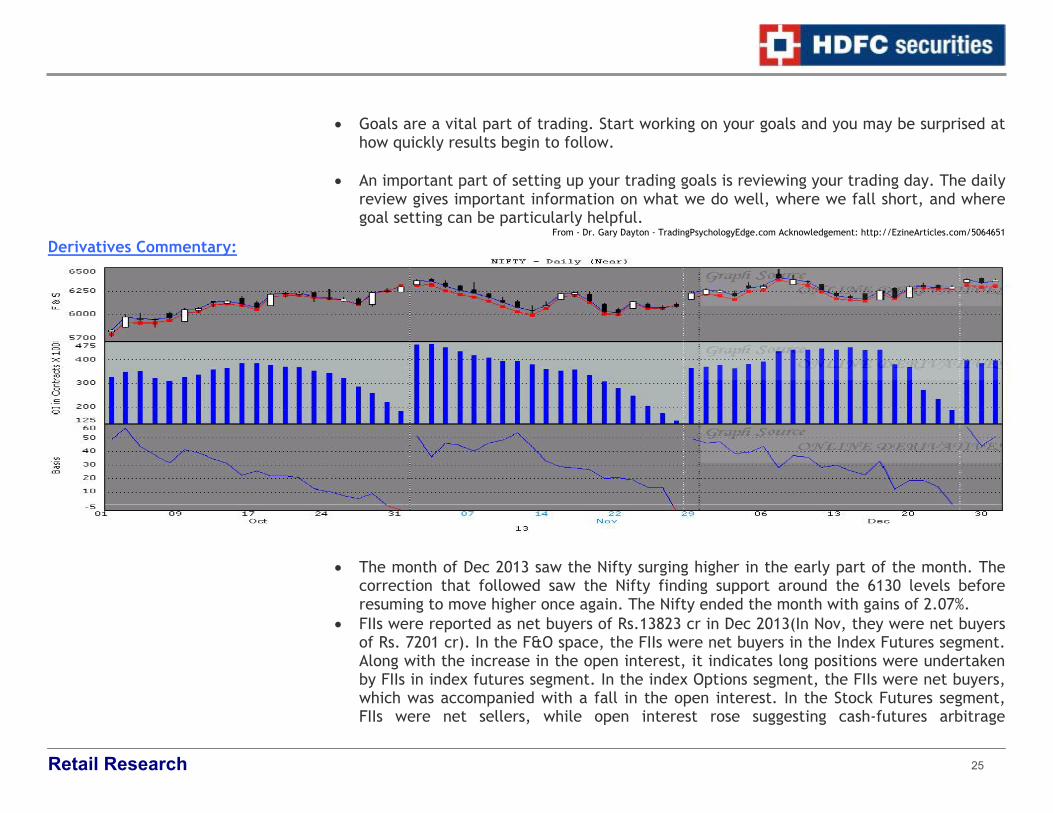
• The month of Dec 2013 saw the Nifty surging higher in the early part of the month. The
correction that followed saw the Nifty finding support around the 6130 levels before resuming to move higher once again. The Nifty ended the month with gains of 2.07%.
• FIIs were reported as net buyers of Rs.13823 cr in Dec 2013(In Nov, they were net buyers of Rs. 7201 cr). In the F&O space, the FIIs were net buyers in the Index Futures segment. Along with the increase in the open interest, it indicates long positions were undertaken by FIIs in index futures segment. In the index Options segment, the FIIs were net buyers, which was accompanied with a fall in the open interest. In the Stock Futures segment, FIIs were net sellers, while open interest rose suggesting cash-futures arbitrage
Retail Research
26
possibilities thrown up during the month. Stock Options segment witnessed very low participation during the month of Dec.
• The Jan 2014 series has started on a lighter note compared to the previous series. In terms of value, the Jan 2014 series has begun with market wide OI at Rs.89,522 crs. Vs. Rs.99,472 crs. at the beginning of the Dec 2013 series. It was Rs.102,732 crs. at the beginning of the Nov 2013 series.
• Along with the lower participation levels in the Jan series (compared to the previous series), market wide rollovers too were lower at 80% Vs. 82% the same time seen in the last series. Nifty rollovers to the Jan series were lower at 68% Vs. 73% the same time in the previous series.
• Coming to stock specific action, the highest rollovers were seen in UPL, McDowell, Jain Irrigation and Glenmark. The lowest rollovers were seen in Powergrid, IOB, HDIL and Havells.
• Reflecting the strength seen in the month of Dec, the Nifty OI PCR slid to 0.92 at the beginning of the Jan series from 1.13 levels (at the beginning of the Dec series). This indicates that puts were wound up and calls were built. Reflecting the range bound price action in Dec, the Nifty IV dipped to 14.46% (at the beginning of the Jan series) from 21.12% the same time in the previous series.
• Technically, the Nifty is now in a short term downtrend after breaking the 6259 supports, which was the lower end support of the narrow range in which the Nifty was trading recently. The Nifty could now target the 6130 lows in the coming sessions. A larger correction towards the 5972-5700 intermediate supports is likely once the 6130 supports are broken.
• Index option activity is suggesting a trading range of 6000-6500 in the near term as the maximum Call OI is currently being seen in the 6500 strikes indicating this is the maximum expected upside for the Nifty in the near term. In the put segment, maximum OI is currently being seen in the 6200-6000 puts, suggesting this is the maximum risk on the downside for the near term.
VOLATILITY STRATEGIES In this issue we discuss various kinds of volatility strategies that can be adopted by traders Long straddle Short straddle
Learning Derivatives Analysis

Retail Research
27
Anticipations and characteristics Market direction neutral (delta=0) and implied volatility up (vega>0). Limited loss - Unlimited profit - Important cost - Needs a large market move in either direction (gamma>0).
Market direction neutral (delta=0) and implied volatility down (vega<0). Unlimited loss - Limited profit - Cash credit - Needs market direction stability (gamma < 0).
Strategy Buy call and put with same strike price.
Sell call and put with same strike price.
Long strangle Short strangle
Anticipations and characteristics
Market direction neutral (delta=0) and implied volatility up (vega>0) Limited loss - Unlimited profit - Important cost - Needs a large market move in either direction (gamma>0).
Market direction neutral (delta=0) and implied volatility down (vega<0) Unlimited loss - Limited profit - Cash credit - Needs market direction stability (gamma < 0).
2 ways of creating a Strangle:
Long strangle: Buy call and Buy put with lower strike. Example : buy 1*put(100) / buy 1*call(105) Long gut strangle: Buy call and Buy put with a higher strike. Example :buy 1*call(100) / buy 1*put(105)
Short strangle: Sell call and Sell put with lower strike. Example : sell 1*put(100) / sell 1*call(105) Short gut strangle: Sell call and Sell put with a higher strike. Example :sell 1*call(100) / sell 1*put(105)
Call back spread Call ratio spread
Anticipations and characteristics
Market direction neutral (delta=0) and implied volatility up (vega>0). Limited loss - Unlimited profit if market direction up - Cash credit - Needs a large market move in either direction (gamma>0).
Market direction neutral (delta=0) and implied volatility down (vega<0). Unlimited loss if market direction up - Limited profit - Low cost - Needs market direction stability (gamma<0).
Strategy
Sell call and buy more call with higher strike price. Example: sell 1*call (100) / buy 2*call (105).
Buy call and sell more call with higher strike. Example: buy 1*call (100) / sell 2*call (105).
Strangle: volatility trading strategy
Straddle: volatility trading strategy
Call ratio & back spread: volatility trading strategy
Retail Research
28
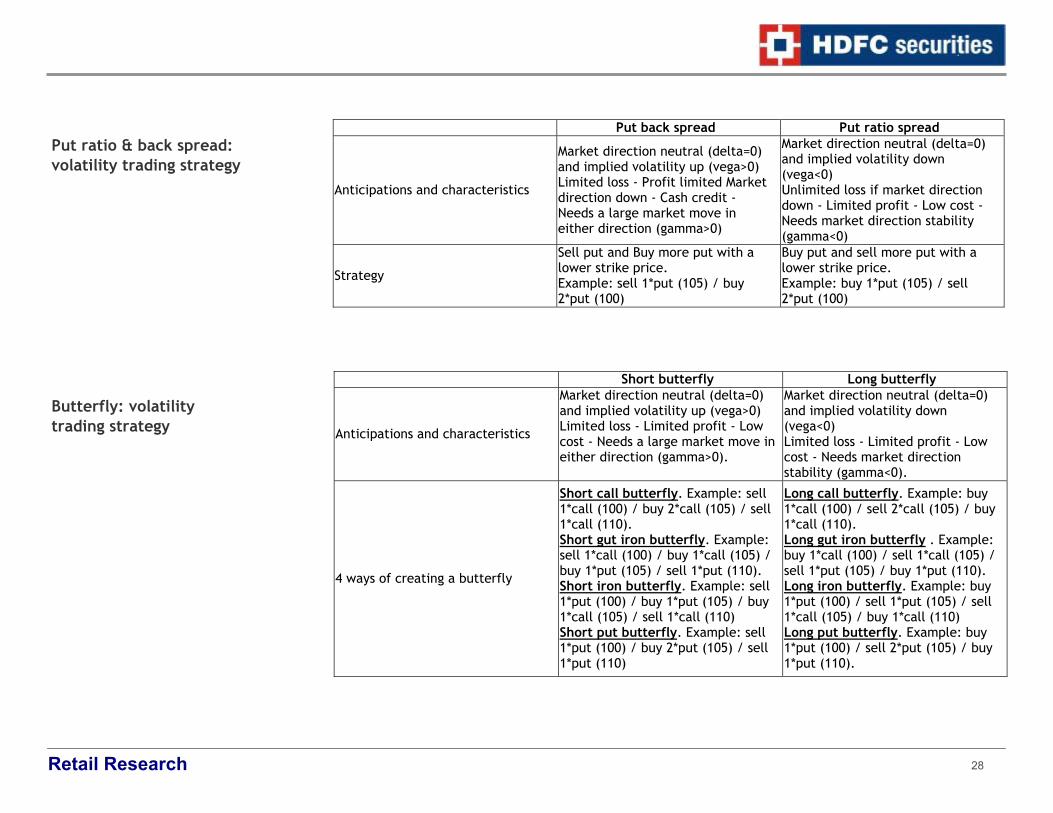
Put back spread Put ratio spread
Anticipations and characteristics
Market direction neutral (delta=0) and implied volatility up (vega>0) Limited loss - Profit limited Market direction down - Cash credit - Needs a large market move in either direction (gamma>0)
Market direction neutral (delta=0) and implied volatility down (vega<0) Unlimited loss if market direction down - Limited profit - Low cost - Needs market direction stability (gamma<0)
Strategy
Sell put and Buy more put with a lower strike price. Example: sell 1*put (105) / buy 2*put (100)
Buy put and sell more put with a lower strike price. Example: buy 1*put (105) / sell 2*put (100)
Short butterfly Long butterfly
Anticipations and characteristics
Market direction neutral (delta=0) and implied volatility up (vega>0) Limited loss - Limited profit - Low cost - Needs a large market move in either direction (gamma>0).
Market direction neutral (delta=0) and implied volatility down (vega<0) Limited loss - Limited profit - Low cost - Needs market direction stability (gamma<0).
4 ways of creating a butterfly
Short call butterfly. Example: sell 1*call (100) / buy 2*call (105) / sell 1*call (110). Short gut iron butterfly. Example: sell 1*call (100) / buy 1*call (105) / buy 1*put (105) / sell 1*put (110). Short iron butterfly. Example: sell 1*put (100) / buy 1*put (105) / buy 1*call (105) / sell 1*call (110) Short put butterfly. Example: sell 1*put (100) / buy 2*put (105) / sell 1*put (110)
Long call butterfly. Example: buy 1*call (100) / sell 2*call (105) / buy 1*call (110). Long gut iron butterfly . Example: buy 1*call (100) / sell 1*call (105) / sell 1*put (105) / buy 1*put (110). Long iron butterfly. Example: buy 1*put (100) / sell 1*put (105) / sell 1*call (105) / buy 1*call (110) Long put butterfly. Example: buy 1*put (100) / sell 2*put (105) / buy 1*put (110).
Put ratio & back spread: volatility trading strategy
Butterfly: volatility trading strategy

Retail Research
29
Short condor Long condor
Anticipations and characteristics
Market direction neutral (delta=0) and implied volatility up (vega>0) Limited loss - Limited profit - Low cost - Needs a large market move in either direction (gamma>0).
Market direction neutral (delta=0) and implied volatility down (vega<0) Limited loss - Limited profit - Low cost - Needs market direction stability (gamma<0).
4 ways of creating a condor
Short call condor. Example : sell 1*call (100) / buy 1*call (105) / buy 1*call (110) / sell 1*call (115) Short gut iron condor. Example: sell 1*call (100) / buy 1*call (105) / buy 1*put (110) / sell 1*put (115) Short iron condor. Example : sell 1*put (100) / buy 1*put (105) / buy 1*call (110) / sell 1*call (115) Short put condor. Example : sell 1*put (100) / buy 1*put (105) / buy 1*put (110) / sell 1*put (115)
Long call condor. Example : buy 1*call (100) / sell 1*call (105) / sell 1*call (110) / buy 1*call (115) Long gut iron condor. Example: buy 1*call (100) / sell 1*call (105) / sell 1*put (110) / buy 1*put (115) Long iron condor. Example : buy 1*put (100) / sell 1*put (105) / sell 1*call (110) / buy 1*call (115) Long condor put. Example : buy 1*put (100) / sell 1*put (105) / sell 1*put (110) / buy 1*put (115)
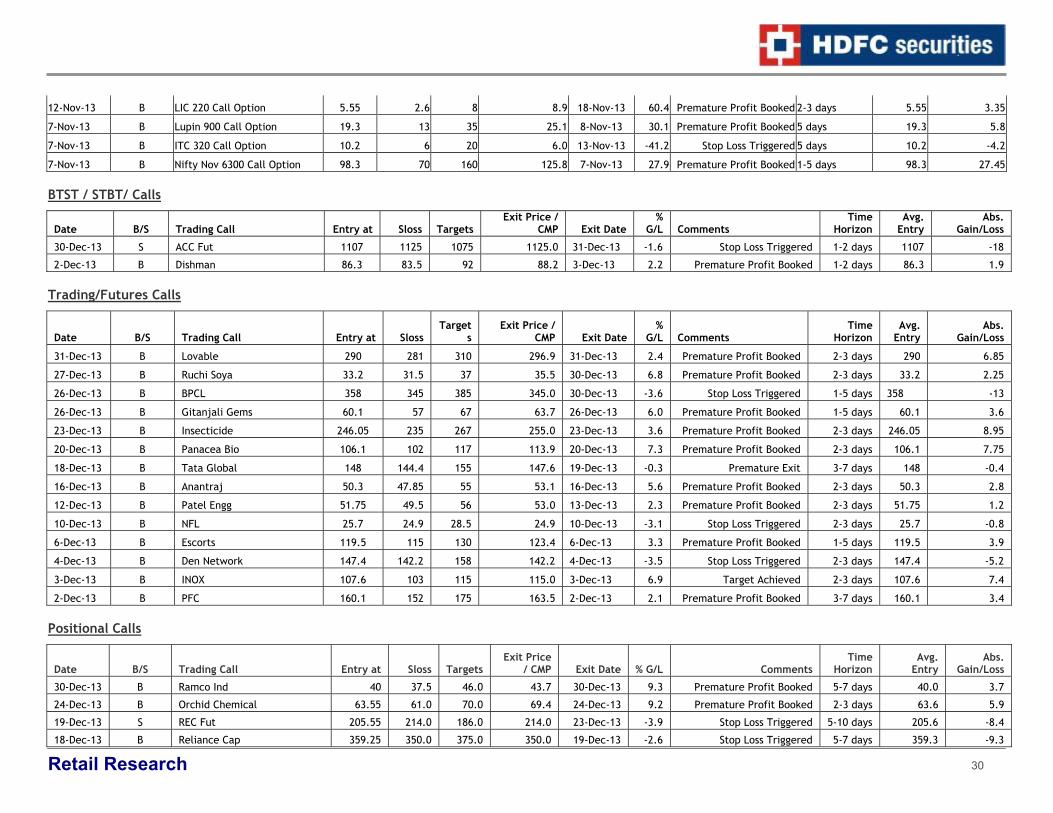
Extract of Calls during December 2013 Index Futures Calls
Date B/S Trading Call Entry at Sloss Targets Exit Price /
CMP Exit Date %
G/L Comments Time
Horizon Avg.
Entry Abs.
Gain/Loss
24-Dec-13 S Nifty Jan Fut 6333 6370 6250 6370.0 27-Dec-13 -0.6 Stop Loss Triggered 1-5 days 6333 -37
16-Dec-13 B Bank Nifty Fut 11404.7 11299 11520 11484.9 16-Dec-13 0.7 Premature Profit Booked 2-3 days 11404.7 80.15
13-Dec-13 B Bank Nifty Fut 11467 11370 11580 11495.0 13-Dec-13 0.2 Premature Profit Booked 2-3 days 11467 28
12-Dec-13 B Nifty Dec Fut 6290 6258 6350 6267.5 12-Dec-13 -0.4 Stop Loss Triggered 1-3 days 6290 -22.5
6-Dec-13 B Nifty Dec Fut 6302 6260 6500 6437.6 9-Dec-13 2.2 Premature Profit Booked 1-4 days 6302 135.6
Stock and Nifty Options Calls
Date B/S Trading Call Entry at Sloss Targets Exit Price / CMP Exit Date % G/L Comments Time Horizon Avg. Entry Abs. Gain/Loss
25-Nov-13 B Nifty Dec 6200 Call Option 120 85 190 151.0 29-Nov-13 25.8 Premature Profit Booked 1-5 days 120 31
22-Nov-13 B SBI 1750 Put Option 26.55 14 50 35.0 22-Nov-13 31.8 Premature Profit Booked 5 days 26.55 8.45
21-Nov-13 B Tata Steel 370 Put Option 4.4 2.5 8 3.9 21-Nov-13 -11.4 Premature Exit 1-5 days 4.4 -0.5
20-Nov-13 B DLF 160 Call Option 3.3 1.8 6 1.8 21-Nov-13 -45.5 Stop Loss Triggered 2-3 days 3.3 -1.5
Condor: volatility trading strategy
Retail Research
30
12-Nov-13 B LIC 220 Call Option 5.55 2.6 8 8.9 18-Nov-13 60.4 Premature Profit Booked 2-3 days 5.55 3.35
7-Nov-13 B Lupin 900 Call Option 19.3 13 35 25.1 8-Nov-13 30.1 Premature Profit Booked 5 days 19.3 5.8
7-Nov-13 B ITC 320 Call Option 10.2 6 20 6.0 13-Nov-13 -41.2 Stop Loss Triggered 5 days 10.2 -4.2
7-Nov-13 B Nifty Nov 6300 Call Option 98.3 70 160 125.8 7-Nov-13 27.9 Premature Profit Booked 1-5 days 98.3 27.45 BTST / STBT/ Calls
Date B/S Trading Call Entry at Sloss Targets Exit Price /
CMP Exit Date %
G/L Comments Time
Horizon Avg.
Entry Abs.
Gain/Loss
30-Dec-13 S ACC Fut 1107 1125 1075 1125.0 31-Dec-13 -1.6 Stop Loss Triggered 1-2 days 1107 -18
2-Dec-13 B Dishman 86.3 83.5 92 88.2 3-Dec-13 2.2 Premature Profit Booked 1-2 days 86.3 1.9 Trading/Futures Calls
Date B/S Trading Call Entry at Sloss Target
s Exit Price /
CMP Exit Date %
G/L Comments Time
Horizon Avg.
Entry Abs.
Gain/Loss
31-Dec-13 B Lovable 290 281 310 296.9 31-Dec-13 2.4 Premature Profit Booked 2-3 days 290 6.85
27-Dec-13 B Ruchi Soya 33.2 31.5 37 35.5 30-Dec-13 6.8 Premature Profit Booked 2-3 days 33.2 2.25
26-Dec-13 B BPCL 358 345 385 345.0 30-Dec-13 -3.6 Stop Loss Triggered 1-5 days 358 -13
26-Dec-13 B Gitanjali Gems 60.1 57 67 63.7 26-Dec-13 6.0 Premature Profit Booked 1-5 days 60.1 3.6
23-Dec-13 B Insecticide 246.05 235 267 255.0 23-Dec-13 3.6 Premature Profit Booked 2-3 days 246.05 8.95
20-Dec-13 B Panacea Bio 106.1 102 117 113.9 20-Dec-13 7.3 Premature Profit Booked 2-3 days 106.1 7.75
18-Dec-13 B Tata Global 148 144.4 155 147.6 19-Dec-13 -0.3 Premature Exit 3-7 days 148 -0.4
16-Dec-13 B Anantraj 50.3 47.85 55 53.1 16-Dec-13 5.6 Premature Profit Booked 2-3 days 50.3 2.8
12-Dec-13 B Patel Engg 51.75 49.5 56 53.0 13-Dec-13 2.3 Premature Profit Booked 2-3 days 51.75 1.2
10-Dec-13 B NFL 25.7 24.9 28.5 24.9 10-Dec-13 -3.1 Stop Loss Triggered 2-3 days 25.7 -0.8
6-Dec-13 B Escorts 119.5 115 130 123.4 6-Dec-13 3.3 Premature Profit Booked 1-5 days 119.5 3.9
4-Dec-13 B Den Network 147.4 142.2 158 142.2 4-Dec-13 -3.5 Stop Loss Triggered 2-3 days 147.4 -5.2
3-Dec-13 B INOX 107.6 103 115 115.0 3-Dec-13 6.9 Target Achieved 2-3 days 107.6 7.4
2-Dec-13 B PFC 160.1 152 175 163.5 2-Dec-13 2.1 Premature Profit Booked 3-7 days 160.1 3.4 Positional Calls
Date B/S Trading Call Entry at Sloss Targets Exit Price
/ CMP Exit Date % G/L Comments Time
Horizon Avg.
Entry Abs.
Gain/Loss
30-Dec-13 B Ramco Ind 40 37.5 46.0 43.7 30-Dec-13 9.3 Premature Profit Booked 5-7 days 40.0 3.7
24-Dec-13 B Orchid Chemical 63.55 61.0 70.0 69.4 24-Dec-13 9.2 Premature Profit Booked 2-3 days 63.6 5.9
19-Dec-13 S REC Fut 205.55 214.0 186.0 214.0 23-Dec-13 -3.9 Stop Loss Triggered 5-10 days 205.6 -8.4
18-Dec-13 B Reliance Cap 359.25 350.0 375.0 350.0 19-Dec-13 -2.6 Stop Loss Triggered 5-7 days 359.3 -9.3
Retail Research
31
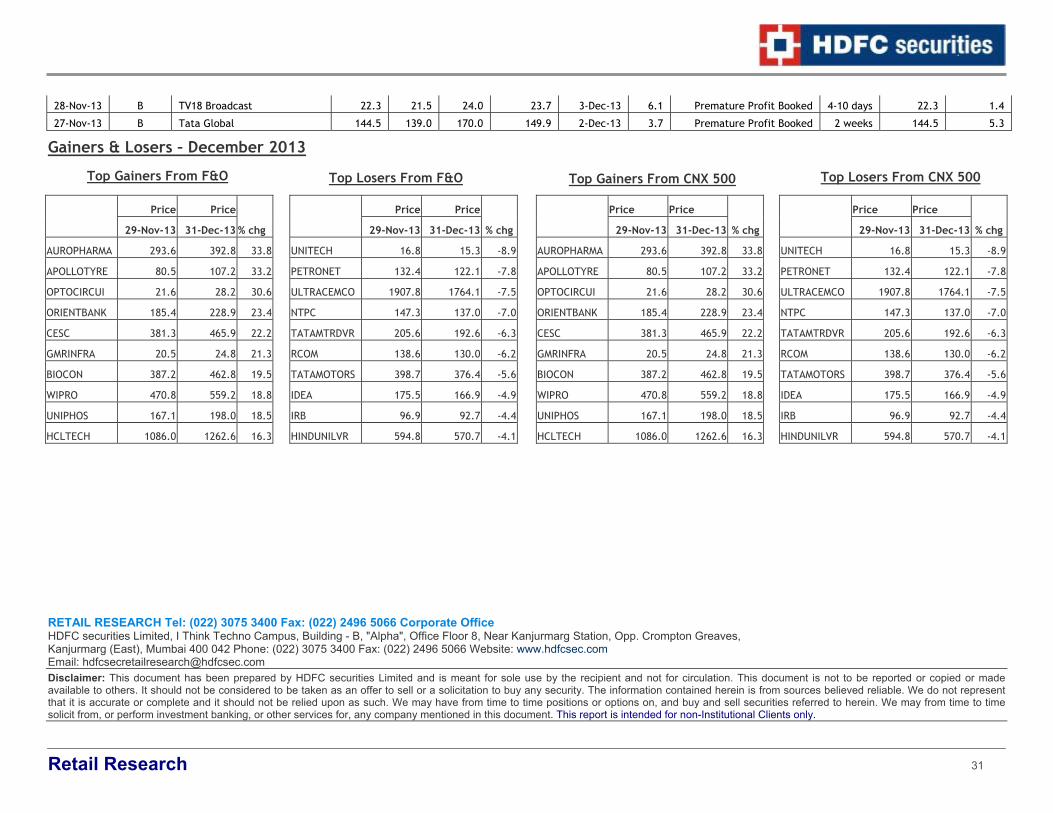
28-Nov-13 B TV18 Broadcast 22.3 21.5 24.0 23.7 3-Dec-13 6.1 Premature Profit Booked 4-10 days 22.3 1.4
27-Nov-13 B Tata Global 144.5 139.0 170.0 149.9 2-Dec-13 3.7 Premature Profit Booked 2 weeks 144.5 5.3
Gainers & Losers – December 2013
Price Price % chg 29-Nov-13 31-Dec-13
AUROPHARMA 293.6 392.8 33.8
APOLLOTYRE 80.5 107.2 33.2
OPTOCIRCUI 21.6 28.2 30.6
ORIENTBANK 185.4 228.9 23.4
CESC 381.3 465.9 22.2
GMRINFRA 20.5 24.8 21.3
BIOCON 387.2 462.8 19.5
WIPRO 470.8 559.2 18.8
UNIPHOS 167.1 198.0 18.5
HCLTECH 1086.0 1262.6 16.3
Price Price
% chg 29-Nov-13 31-Dec-13
UNITECH 16.8 15.3 -8.9
PETRONET 132.4 122.1 -7.8
ULTRACEMCO 1907.8 1764.1 -7.5
NTPC 147.3 137.0 -7.0
TATAMTRDVR 205.6 192.6 -6.3
RCOM 138.6 130.0 -6.2
TATAMOTORS 398.7 376.4 -5.6
IDEA 175.5 166.9 -4.9
IRB 96.9 92.7 -4.4
HINDUNILVR 594.8 570.7 -4.1
Price Price
% chg 29-Nov-13 31-Dec-13
AUROPHARMA 293.6 392.8 33.8
APOLLOTYRE 80.5 107.2 33.2
OPTOCIRCUI 21.6 28.2 30.6
ORIENTBANK 185.4 228.9 23.4
CESC 381.3 465.9 22.2
GMRINFRA 20.5 24.8 21.3
BIOCON 387.2 462.8 19.5
WIPRO 470.8 559.2 18.8
UNIPHOS 167.1 198.0 18.5
HCLTECH 1086.0 1262.6 16.3
Price Price
% chg 29-Nov-13 31-Dec-13
UNITECH 16.8 15.3 -8.9
PETRONET 132.4 122.1 -7.8
ULTRACEMCO 1907.8 1764.1 -7.5
NTPC 147.3 137.0 -7.0
TATAMTRDVR 205.6 192.6 -6.3
RCOM 138.6 130.0 -6.2
TATAMOTORS 398.7 376.4 -5.6
IDEA 175.5 166.9 -4.9
IRB 96.9 92.7 -4.4
HINDUNILVR 594.8 570.7 -4.1
Top Gainers From F&O Top Losers From F&O Top Gainers From CNX 500 Top Losers From CNX 500
RETAIL RESEARCH Tel: (022) 3075 3400 Fax: (022) 2496 5066 Corporate OfficeHDFC securities Limited, I Think Techno Campus, Building - B, "Alpha", Office Floor 8, Near Kanjurmarg Station, Opp. Crompton Greaves, Kanjurmarg (East), Mumbai 400 042 Phone: (022) 3075 3400 Fax: (022) 2496 5066 Website: www.hdfcsec.com Email: [email protected] Disclaimer: This document has been prepared by HDFC securities Limited and is meant for sole use by the recipient and not for circulation. This document is not to be reported or copied or made available to others. It should not be considered to be taken as an offer to sell or a solicitation to buy any security. The information contained herein is from sources believed reliable. We do not represent that it is accurate or complete and it should not be relied upon as such. We may have from time to time positions or options on, and buy and sell securities referred to herein. We may from time to time solicit from, or perform investment banking, or other services for, any company mentioned in this document. This report is intended for non-Institutional Clients only.


