Embed Size (px)
Citation preview

30 September 2010
The Manager
Company Announcements Office
Australian Securities Exchange
Annual Report and Completion of Inventory Review
Kresta Holdings Limited is pleased to release its Annual Report for the year ended 30 June 2010.
The Company’s net profit after tax for the year ended 30 June 2010 was $2,697,000 compared to
$3,658,000 for the year ended 30 June 2009. The profit for the year was affected by the inventory
write down announced on 14 September 2010.
The Board has completed its review into the carrying value of inventory and has received an
independent review of the inventory. Following that review, the Board resolved to write down the
carrying value of inventory by an additional $5.8 million as at 30 June 2010, in addition to the $1.5
million which had been provided prior to the review.
Yours faithfully
Kresta Holdings Limited
Ian N Trahar
Non-Executive Chairman
For
per
sona
l use
onl
y

Kresta Holdings Limited
Annual financial report for the year ended 30 June 2010
Kresta
For
per
sona
l use
onl
y

KRESTA HOLDINGS LIMITED—ANNUAL REPORT
Chairman’s Report
Chairman’s Report
The 2009/2010 financial year resulted in a solid operating cash flow performance as your Company
responded positively to the recovery from the global financial crisis and the wind back of the Federal
Government‟s stimulus package.
Group revenue for the year rose to $123 million compared to $117 million for the prior period.
Unfortunately the Company‟s strong cash flow performance was adversely impacted at the net profit
line where after significant investigation and external assessment the Board resolved to reduce the
value of inventory by $5.8 million on top of the $1.5 million already provided against the inventory
prior to the review.
Whilst this one off non-cash charge was extremely annoying the underlying cash flow strength of the
Company has enabled your Board to maintain the final dividend of 1.5 cents per share bringing the
full year dividend to 3.5 cents per share fully franked.
My fellow directors join me in thanking our staff for their diligent and continued efforts throughout the
year.
Ian N Trahar Chairman Perth 30 September 2010
For
per
sona
l use
onl
y

KRESTA HOLDINGS LIMITED—ANNUAL REPORT
Corporate Information
ABN 26 008 675 803
Directors Ian Norman Trahar (Chairman)
Trent Josiah Bartlett
Peter Hatfull
Company Secretary & Chief Financial Officer Thye Tan
Registered Office 389 Victoria Road
Malaga WA 6090
Telephone: (08) 9249 0777
Share Register Computershare Investor Services Pty Ltd
Level 2, Reserve Bank Building
45 St Georges Terrace
Perth WA 6000
Telephone: (08) 9323 2000
Kresta Holdings Limited shares are listed on the Australian Securities Exchange.
ASX Code: KRS
Bankers Australia and New Zealand Banking Group Limited
Commonwealth Bank of Australia Ltd
Auditors Ernst & Young
The Ernst & Young Building
11 Mounts Bay Road
Perth WA 6000
Internet Address www.kresta.com.au
For
per
sona
l use
onl
y

KRESTA HOLDINGS LIMITED – ANNUAL REPORT
Contents
Directors‟ report ......................................................................................................................................................... 1 Corporate governance statement ............................................................................................................................ 13 Income statement .................................................................................................................................................... 16 Statement of comprehensive income ....................................................................................................................... 17 Statement of financial position ................................................................................................................................. 18 Statement of changes in equity................................................................................................................................ 19 Statement of cash flows .......................................................................................................................................... 20 Notes to the financial statements 1. Corporate information ......................................................................................................................................... 21 2. Summary of significant accounting policies ......................................................................................................... 21 3. Revenues and expenses .................................................................................................................................... 33 4. Income tax .......................................................................................................................................................... 34 5. Earnings per share ............................................................................................................................................. 35 6. Dividends paid and proposed ............................................................................................................................. 36 7. Cash and cash equivalents ................................................................................................................................. 37 8. Trade and other receivables (current) ................................................................................................................. 38 9. Inventories ......................................................................................................................................................... 39 10. Parent entity information .................................................................................................................................... 39 11. Property, plant and equipment ........................................................................................................................... 41 12. Intangible assets and goodwill ........................................................................................................................... 42 13. Share-based payment plans .............................................................................................................................. 44 14. Trade and other payables (current) ................................................................................................................... 45 15. Interest-bearing loans and borrowings ............................................................................................................... 45 16. Provisions .......................................................................................................................................................... 47 17. Contributed equity and reserves ........................................................................................................................ 48 18. Government grants ............................................................................................................................................ 49 19. Financial risk management objectives and policies ............................................................................................ 50 20. Commitments .................................................................................................................................................... 55 21. Related party disclosures .................................................................................................................................. 56 22. Key management personnel .............................................................................................................................. 57 23. Business combination ........................................................................................................................................ 59 24. Events after the balance sheet date ................................................................................................................... 60 25. Auditor‟s remuneration....................................................................................................................................... 60 26. Operating segments .......................................................................................................................................... 60 27. Derivative financial instruments ........................................................................................................................ 61 Directors‟ declaration ............................................................................................................................................... 63 Auditor‟s Report....................................................................................................................................................... 64 ASX Additional Information ...................................................................................................................................... 66
For
per
sona
l use
onl
y

KRESTA HOLDINGS LIMITED—ANNUAL REPORT
Directors’ Report
1
Your directors submit their report for the year ended 30 June 2010. DIRECTORS The names and details of the Company‟s directors in office during the financial year and until the date of this report are as follows. Directors were in office for this entire period unless otherwise stated. Names, qualifications, experience and special responsibilities Neil Fearis, LL.B (Hons) MAICD, F FIN (Non-executive Chairman) – retired 31 December 2009 Mr Fearis is a commercial lawyer with 33 years‟ experience. During the past seven years, Mr Fearis has also served as a director of the following other listed companies - Carnarvon Petroleum Ltd, Perseus Mining Ltd and Liberty Resources Limited (resigned 2008). He also served on the audit and remuneration committees of the Group. Tass Zorbas (Managing Director) – retired 6 September 2010 Mr Zorbas has been involved in the window treatment industry for approximately 35 year and was instrumental in pioneering the marketing and manufacturing of vertical blinds in Australia. Trent Bartlett, Grad Dip Bus, Grad Cert E-Commerce, FAICD (Non-executive Director) Mr Bartlett is the Chief Executive Officer of Capricorn Society Ltd. Mr Bartlett joined Kresta Holdings Limited as a non-executive director in 2003 and has had considerable retail experience in senior management roles with Coles Myer, Aherns and David Jones before joining Capricorn Society Ltd. He also serves on the audit and remuneration committees of the Group. Peter Johnston, FCPA, FCIS (Non-executive Director) – retired 23 June 2010 Mr Johnston is an accountant by profession with a long career in the corporate sector and was the Company Secretary of Wesfarmers Limited until his retirement in 2001. Mr Johnston has served as a director of the ASX-Listed Bunnings Warehouse Property Trust since 2005. He also served on the audit and remuneration committees of the Group. Peter Hatfull, MAICD (Non-executive Director) – appointed 14
July 2009
Mr Hatfull is qualified as a Chartered Accountant and has over 30 years‟ experience in a range of senior executive positions with Australian and international companies. He has an extensive skill-set with listed companies in the areas of corporate governance, business optimization, capital raising and company restructuring. Mr Hatfull is currently a director of mining services company Barminco Pty Ltd and is a corporate advisor of and director of a range of private companies. He also serves on the audit and remuneration committees of the Group. Ian Trahar, B.Ec, MBA, MAICD (Non-executive Chairman) – appointed 23 February 2010 Mr Trahar joined the board as a non-executive director on 23 February 2010. Mr Trahar has a consumer products and finance background and is a member of the Australian Institute of Company Directors. He has served as a director and Chairman of CO2 Group Limited for the past eight year. He also serves on the audit and remuneration committees of the Group. COMPANY SECRETARY & CHIEF FINANCIAL OFFICER Thye Tan, FCPA Mr Tan is a fellow of CPA Australia and has worked in various senior commercial and financial positions at Wesfarmers Ltd, Bunnings Ltd, Schlumberger and ERG Ltd. Mr Tan also holds a Graduate Diploma in Chartered Secretaries and Administrators.
For
per
sona
l use
onl
y

KRESTA HOLDINGS LIMITED—ANNUAL REPORT
Directors’ Report continued
2
Interests in the shares and options of the company As at the date of this report, the interests of the directors in the shares of Kresta Holdings Limited were: Number of
Ordinary Shares
TJ Bartlett
5,000
I Trahar
27,890,068
DIVIDENDS Cents $‟000 Final dividends recommended for 2010 on:
Ordinary shares 1.5 2,162 Dividends paid in the year: Interim of the year
Ordinary shares 2.0 2,864 Final dividends for 2009 shown as recommended in the 2009 financial report:
Ordinary shares 1.0 1,432
For
per
sona
l use
onl
y

KRESTA HOLDINGS LIMITED—ANNUAL REPORT
Directors’ Report continued
3
CORPORATE INFORMATION Corporate structure Kresta Holdings Limited is a company limited by shares that is incorporated and domiciled in Australia. Kresta Holdings Limited has prepared a consolidated financial report incorporating the following entities that it controlled during the financial year: Kresta Holdings Limited (parent) Kresta Blinds (Holdings) Pty Ltd Kresta Blinds Ltd Kresta Blinds International Pty Ltd Kedena Holdings Pty Ltd Sharatan Pty Ltd Blind Wholesalers, Distributors and Manufacturers Pty Ltd Finmar Pty Ltd Mardo Australia Pty Ltd Mardo International Pty Ltd Twighlight Sun Pty Ltd Sandelle Pty Ltd Curtain Wonderland Pty Ltd
Principal activities The principal activities during the year of entities within the consolidated entity were the manufacture, distribution and retailing of window treatments and components. There have been no significant changes in the nature of those activities during the year. Employees The consolidated entity employed 907 employees as at 30 June 2010 (2009: 954 employees). OPERATING AND FINANCIAL REVIEW Group overview The Kresta Group has been a leading manufacturer and retailer of window furnishings for over 34 years and is renowned for pioneering the manufacture and marketing of vertical blinds in Australia. Although the Group‟s business activities are predominately centred in Western Australia, the Group has a significant chain of outlets located throughout Australia and New Zealand. During the financial year ended 30 June 2010, the Group acquired the Ace of Shades business based in Victoria. This business has been a well regarded and profitable supplier of external blinds and awnings in Melbourne for the last 17 years. This purchase will provide the Group with an immediate profitable entry point into the Victorian market for outdoor products and will allow the Group to expand this service throughout Australia and New Zealand and to complement the Group‟s existing range of indoor products. The Group also rolled out 2 new stores and relocated and/or refurbished 6 others as part of its ongoing business strategy to improve customer service and expand coverage to include geographical areas where the company does not have a retail presence. Although new stores and refurbishments as a general rule require time to contribute a satisfactory return, the investment made this financial year is expected to have a positive impact on Kresta‟s financial performance in the next 12 to 18 months. The Board of directors and management will continue to pursue this policy of expanding coverage in the forthcoming year in locations where the demographics support new store developments. Kresta operates several manufacturing plants involving textile weaving, the fabrication of timber, fabric and aluminium venetian blinds, curtains and vertical blinds. The manufacturing operations continue to be a major part of the Group‟s core activities. At the same time, the Group currently sources many finished product lines from overseas manufacturers and this policy will be continued, provided these imported “boxed products” can be manufactured off-shore at competitive prices and delivery time to customers is not compromised. In February 2010 the Group commissioned an independent valuer to value the land and buildings owned by the Group and this valuation has shown a significant increase in value compared to the current book value as noted in Note 11 of the Financial Report. The Group‟s strong sales results have been positively impacted by the successful introduction of a range of innovative product ranges, together with the recent acquisitions performing at or above expectations. Several new product lines have been introduced during the year ended 30 June 2010 to meet customer expectations and Kresta will continue to keep abreast with latest trends in window treatments and blinds to maintain its strong market position. A number of new products are being developed for launch in the 2010/11 financial year to maintain the Group‟s position as a leading supplier. In this regard, Kresta has maintained its market share and continues to be an industry leader through product innovation and range. Performance indicators The Board has adopted a number of financial and operational key performance indicators (KPIs) to monitor the Group‟s core activities. These KPIs are regularly reviewed by management to gauge the performance of operations and ensure that the measures adopted continue to be relevant in the changing economic environment in which the Group operates.
For
per
sona
l use
onl
y

KRESTA HOLDINGS LIMITED—ANNUAL REPORT
Directors’ Report continued
4
OPERATING AND FINANCIAL REVIEW continued Operating results for the year The Group‟s earnings before interest and tax of $4,895,000 for the year ended 30 June 2010 was 23 per cent lower than the previous year of $6,329,000. The decrease was mainly due to the inventory write down to net realisable value (please see notes 3(g) and 9). Summarised operating results are as follows: 2010 Sales Results $‟000 $‟000
Consolidated entity sales and profit before income tax expense 122,630 3,921 Shareholder returns Management is pleased with the results of the Group especially after coming through a turbulent 2009 and the impact of the global financial crisis and a continued global uncertainty which impacted on consumer spending and high unemployment.
2010 2009 2008 2007
Basic earnings per share (cents) 1.88 2.68 3.22 3.00
Investments for future performance The Group continues to direct significant resources into product development and remains committed to constant improvements in the products that are manufactured and marketed by its businesses. Kresta is the holder of a number of patents and registered designs which have resulted from this ongoing strategy. The Group remains committed to providing staff with access to appropriate training and development. Management has also been charged with responsibility to focus on executive succession planning and the development of internal candidates for promotion to senior positions in the Group as these opportunities present themselves. Management is also focused on the enhancement of the Group‟s information technology systems, recognizing the need to constantly upgrade and improve inventory management and reporting capabilities. A software package (particularly tailored to support the window treatment business), has been selected and is currently under evaluation for introduction in the 2010/11 financial year. Capital structure The Group had a capital gearing ratio of 10% at year end (2009: 21%). Liquidity and funding At year end, the Group had credit facilities (inclusive of bank guarantee) totalling $14,433,827 (2009: $17,200,000). At year end, credit facilities unused were $3,376,188 (2009: $2,457,000). In November 2009, the Group has cancelled the temporary overdraft facility of $3,000,000 entered in February 2009 and negotiated an increase of $1,000,000 to the existing $2,000,000 overdraft facility and a temporary overdraft facility of $1,000,000 for a period of seven months from April to October 2010. This additional credit facility has not been utilized due to the success of the Group‟s focus on the reduction of inventories and debtors and the improvement in overall liquidity. Share issues during the year One million shares were issued from the conversion of options for the year ended 30 June 2010. (refer Share Options) SIGNIFICANT CHANGES IN THE STATE OF AFFAIRS There have been no significant changes in the state of affairs during the financial year and up to the date of this report. SIGNIFICANT EVENTS AFTER THE BALANCE DATE On 19 August 2010, the directors of Kresta Holdings Limited announced a final dividend on ordinary shares in respect of the 2010 financial year. The total amount of the dividend is $2,162,378 which represents a fully franked dividend of 1.5 cents per share. The dividend has not been provided for in the 30 June 2010 financial statements. LIKELY DEVELOPMENTS AND EXPECTED RESULTS It is the Kresta Board‟s view that the general economy and the retail trading environment remains patchy, particularly with the risk of global uncertainty, but the directors are confident that as a result of the success of the range of initiatives undertaken to date, coupled with the growth related strategies now in place, will ensure the Group is well positioned to continue to achieve sustained and profitable growth moving forward. The Group will also continue to focus on its strategy of conserving a strong cash position and controlling costs.
For
per
sona
l use
onl
y

KRESTA HOLDINGS LIMITED—ANNUAL REPORT
Directors’ Report continued
5
ENVIRONMENTAL REGULATION AND PERFORMANCE The consolidated entity holds licences issued by the relevant environmental protection authorities. These licences specify limits to, and regulate the management of, discharges to the air and water run-off associated with the manufacturing operations. There have been no significant known breaches of the consolidated entity‟s licence conditions or any environmental regulations to which it is subject to. SHARE OPTIONS Unissued shares As at the date of this report, there were no unissued shares under options. Shares issued as a result of the exercise of options During the financial year, executives have exercised options to acquire 1,000,000 fully paid ordinary shares in Kresta Holdings Limited at a weighted average exercise price of $0.285 per share. INDEMNIFICATION AND INSURANCE OF DIRECTORS AND OFFICERS During the financial year, the Company has paid premiums in respect of a contract insuring all the directors and officers of Kresta Holdings Limited and its controlled entities against legal costs incurred in defending proceedings for conduct involving: a) a wilful breach of duty; or b) a contravention of sections 182 or 183 of the Corporations Act 2001, as permitted by section 199B of the Corporations Act 2001. The total amount of insurance contract premiums paid was $10,875. DIRECTORS’ MEETINGS The number of meetings of directors (including meetings of committees of directors) held during the year and the number of meetings attended by each director was as follows:
Directors’ Meetings Meetings of Committees
Audit Remuneration Number of meetings held:
7 1 1 Number of meetings attended:
TJ Bartlett
7 1 1 NC Fearis
4 1 1 T Zorbas
7 - - P Johnston
6 1 1 P Hatfull
6 1 1 I Trahar
2 - -
For
per
sona
l use
onl
y

KRESTA HOLDINGS LIMITED—ANNUAL REPORT
Directors’ Report continued
6
Committee membership As at the date of this report, the Company had an Audit Committee and a Remuneration Committee. Members acting on the committees of the Board during the year were: Audit Remuneration
TJ Bartlett (Chairman) I Trahar* (New Chairman)
NC Fearis (retired 31 December 2009) P Johnston (retired 23 June 2010)
P Johnston (retired 23 June 2010) TJ Bartlett
P Hatfull P Hatfull
I Trahar* NC Fearis (Chairman) (retired 31 December 2009)
* I Trahar was appointed to the Audit and Remuneration Committees on 24 June 2010. ROUNDING The amounts contained in this report and in the financial report have been rounded to the nearest $1,000 (where rounding is applicable) under the option available to the Company under ASIC Class Order 98/0100. The Company is an entity to which the Class Order applies.
For
per
sona
l use
onl
y

KRESTA HOLDINGS LIMITED—ANNUAL REPORT
Directors’ Report continued
7
REMUNERATION REPORT (audited) This Remuneration Report outlines the director and executive remuneration arrangements of the Company and the Group in accordance with the requirements of the Corporation Act 2001 and its Regulations. For the purpose of this report, Key Management Personnel (KMP) of the Group are defined as those persons having authority and responsibility for planning, directing and controlling the major activities of the Company and the Group, directly or indirectly, including any director (whether executive or otherwise) of the parent Company, and includes the executives in the parent and the Group receiving the highest remuneration. Details of key management personnel (including the two highest paid executives of the Company and the Group)
(i) Directors NC Fearis Chairman (Non-Executive) (retired 31 December 2009) T Zorbas Managing Director (retired 6 September 2010) TJ Bartlett Director (Non-Executive) P Johnston Director (Non-Executive) (retired 23 June 2010) P Hatfull Director (Non-Executive) (appointed 14 July 2009) I Trahar Chairman (Non-Executive) (appointed 23 February 2010)
(ii) Executives T Tan Company Secretary and Chief Financial Officer J Fulton General Manager – Sales and Marketing
Remuneration philosophy The performance of the Company depends upon the quality of its directors and executives. To prosper, the Company must attract, motivate and retain highly skilled directors and executives. To this end, the Company embodies the following principles in its remuneration framework: - Provide competitive rewards to attract high calibre executives; - Link executive rewards to shareholder value; and - Establish appropriate, demanding performance hurdles for variable executive remuneration. Remuneration Committee The Remuneration Committee of the Board of Directors is responsible for determining and reviewing compensation arrangements for the directors, the managing director and executives. The Remuneration Committee assesses the appropriateness of the nature and amount of emoluments of such executives on a periodic basis by reference to relevant employment market conditions with the overall objective of ensuring maximum stakeholder benefit from the retention of a high quality board and executive team. Such executives are given the opportunity to receive their base emolument in a variety of forms including cash and fringe benefits such as motor vehicles and expense payment plans. It is intended that the manner of payment chosen will be optimal for the recipient without creating undue cost for the Company. To assist in achieving these objectives, the Remuneration Committee links the nature and amount of each executive‟s and director‟s emolument to the Group‟s financial and operational performance. All variable remuneration needs to be approved by the Remuneration Committee. Remuneration structure In accordance with best practice corporate governance, the structure of non-executive director and executive remuneration is separate and distinct. Non-executive director remuneration
Objective The Board seeks to set aggregate remuneration at a level which provides the Company with the ability to attract and retain directors of the highest calibre, whilst incurring a cost which is acceptable to the shareholders. Structure Each non-executive director receives a fee for being a director of the Company and the fees and payments reflect the demands which are made on, and the responsibilities of, the directors. No additional fee is paid for membership of Board committees.
Executive remuneration
Objective The Group aims to reward executives with a level and mix of remuneration commensurate with their position and responsibilities within the Company and so as to:
For
per
sona
l use
onl
y

KRESTA HOLDINGS LIMITED—ANNUAL REPORT
Directors’ Report continued
8
REMUNERATION REPORT (audited) continued
reward executives for company, business unit and individual performance against targets set by reference to appropriate benchmarks;
align the interests of executives with those of shareholders;
link reward with the strategic goals and performance of the Group; and
ensure total remuneration is competitive by market standards. Structure In consultation with external remuneration consultants, the remuneration committee has structured an executive remuneration framework that is market competitive and complimentary to the reward strategy of the organisation. Remuneration consists of the following key elements:
Fixed Remuneration;
Variable Remuneration; - Short Term Incentive (STI); and - Long Term Incentive (LTI).
The proportion of fixed remuneration and variable remuneration (potential short term and long term incentives) is established for each executive by the remuneration committee. The Group has no policy on executives and directors entering into contracts to hedge their exposure to options or shares granted as part of their remuneration package.
Fixed Remuneration
Objective The level of fixed remuneration is set so as to provide a base level of remuneration which is both appropriate to the position and is competitive in the market.
Fixed remuneration is reviewed annually by the remuneration committee and the process consists of a review of company, business unit and individual performance, relevant comparative remuneration externally and internally and, where appropriate, external advice on policies and practices. As noted above, the committee has access to external advice independent of management. Structure Executive directors and executives are given the opportunity to receive their fixed (primary) remuneration in a variety of forms including cash and fringe benefits such as motor vehicles. It is intended that the manner of payment chosen will be optimal for the recipient without creating undue cost for the Group. Variable remuneration – short term incentive (STI)
Objective The objective of the STI program is to link the achievement of the Group‟s operational targets with the remuneration received by the executives charged with meeting those targets. The total potential STI available is set at a level so as to provide sufficient incentive to the executive to achieve the operational targets and such that the cost to the Group is reasonable in the circumstances. Structure Actual STI payments granted to each executive depend on the extent to which specific operating targets set at the beginning of the financial year are met. The operational targets consist of a number of key performance indicators (KPIs) covering both financial and non-financial measures of performance. Typically included are measures such as budgeted contribution to net profit after tax, customer service, product management and risk management. These measures were chosen as they represent the key drivers for the short term success of the business and provide a framework for delivering long term value. On an annual basis, after consideration of performance against KPIs, an overall performance rating for the Group is approved by the remuneration committee. The aggregate of annual STI payments available for executives across the Group is subject to the approval of the remuneration committee. Payments made are usually delivered as a cash bonus and at the discretion of the remuneration committee. STI Bonus for 2010 financial year (2009: $115,000) 100% of the STI cash bonus of $97,750 relating to the 2008/9 financial year was accrued and vested to executives and was paid in the 2010 financial year. There were no forfeitures. Bonus payments were made at the discretion of the remuneration committee.
Variable remuneration – long term incentive (LTI)
Objective The objective of the LTI plan is to reward executives in a manner which aligns this element of remuneration with the creation of shareholder wealth. As such, LTI grants are only made to executive directors and executives who are able to influence the generation of shareholder wealth and thus have a direct impact on the Group‟s performance against the relevant long term performance hurdle.
For
per
sona
l use
onl
y

KRESTA HOLDINGS LIMITED—ANNUAL REPORT
Directors’ Report continued
9
REMUNERATION REPORT (audited) continued Structure LTI grants to executive directors and executives are delivered in the form of options. The share options generally vest over varying periods and are not usually subject to a performance hurdle as these options are issued to executives as a form of retention bonus and incentive to contribute to the creation of shareholder wealth. They usually have a life from the date of grant of five years, and are exercisable at specific dates and proportions set at the time of granting the options. Group performance The table below shows the performance of the Company (as measured by the Company‟s Return on Shareholders‟ Fund (ROSF) for the last five years for the period ended 30 June.
Employment contracts
Executives Mr Tan and Mr Fulton are employed under written contracts. The current contracts commenced on 16 May 2005. Under the terms of the present contracts:
Mr Tan and Mr Fulton may resign from their positions and thus terminate these contracts by giving 12 months‟ written notice. On resignation, any unvested options will be forfeited.
The Company may terminate the employment agreement by providing 12 months‟ written notice or provide payment in lieu of the notice period (based on the total remuneration). On termination on notice by the Company, any options that have vested or will vest during the notice period can be exercised within a period of two years. After which, the options will be forfeited.
The Company may terminate the contract at any time without notice if serious misconduct has occurred. Where termination with cause occurs, the executives are only entitled to that portion of remuneration which is fixed, and only up to the date of termination. On termination with cause, any unvested options will immediately be forfeited.
2010 2009 2008 2007 2006
ROSF 12% 15% 21% 20% 19%
For
per
sona
l use
onl
y

KRESTA HOLDINGS LIMITED—ANNUAL REPORT
Directors’ Report continued
10
REMUNERATION REPORT (audited) continued Details of the nature and amount of each element of the compensation of each key management personnel are as follows: Table 1: Remuneration for the years ended 30 June 2010 and 30 June 2009
Short -Term
Post
Employment
Share-based
Payment
Salary &
fees Cash bonus
Non-monetary benefits
Super- annuation Options# Total
Performance related
Option related
$ $ $ $ $ $ % %
NC Fearis 2010 37,500 - - - - 37,500 - -
2009 75,000 - - - - 75,000 - -
T Zorbas 2010 518,066 55,250 62,031 51,599 - 686,946 8.0 -
2009 463,643 65,000 52,676 47,578 - 628,897 10.3 -
P Johnston 2010 52,499 - - 4,725 - 57,224 - -
2009 55,000 - - 4,950 - 59,950 - -
TJ Bartlett 2010 45,833 - - 4,125 - 49,958 - -
2009 55,000 - - 4,950 - 59,950 - -
P Hatfull 2010 43,911 - - 3,952 - 47,863 - -
T Tan 2010 254,145 25,500 26,192 25,168 - 331,005 7.7 -
2009 225,354 30,000 23,090 22,982 2,488 303,914 10.7 0.8
J Fulton 2010 181,195 17,000 69,846 17,838 - 285,879 5.9 -
2009 156,760 20,000 65,168 15,909 - 257,837 7.7 -
# These are not benefits paid but a fair value measurement of the options granted using the Binomial Option-Pricing model. Options were granted as equity compensation benefits under the long-term incentive plan to certain key management personnel as disclosed above. The options were issued free of charge. Each option entitles the holder to subscribe for one fully paid ordinary share in the entity at an exercise price equal to the market price of the shares on the date of grant of the option. The contractual life of each option granted is five years. There are no cash settlement alternatives.
There were no options granted during the financial year to key management personnel and the Board of Directors.
For
per
sona
l use
onl
y

KRESTA HOLDINGS LIMITED—ANNUAL REPORT
Directors’ Report continued
11
REMUNERATION REPORT (audited) continued
Table 2: Shares issued on exercise of compensation options 30 June 2010
Shares Issued No.
Paid per share (note 13) $
Executives T Tan
1,000,000
0.285
For
per
sona
l use
onl
y

KRESTA HOLDINGS LIMITED—ANNUAL REPORT
Directors’ Report continued
12
AUDITOR’S INDEPENDENCE AND NON-AUDIT SERVICES
The directors received the following declaration from the auditor of Kresta Holdings Limited.
NON-AUDIT SERVICES The following non-audit services were provided by the entity‟s auditor, Ernst & Young. The directors are satisfied that the provision of non-audit services is compatible with the general standard of independence for auditors imposed by the Corporations Act 2001. The nature and scope of each type of non-audit service provided means that auditor independence was not compromised. Ernst & Young received or are due to receive the following amounts for the provision of non-audit services: $ Special audits required for government grants 5,923 Assurance related and due diligence services 78,337 84,260
Signed in accordance with a resolution of the directors.
I Trahar Chairman 30 September 2010
For
per
sona
l use
onl
y

KRESTA HOLDINGS LIMITED—ANNUAL REPORT
Corporate Governance Statement
13
The Board of Directors of Kresta Holdings Limited is responsible for establishing the corporate governance framework of the Group having regard to the ASX Corporate Governance Council (CGC) published guidelines as well as its corporate governance principles and recommendations. The Board guides and monitors the business and affairs of Kresta Holdings Limited on behalf of the shareholders by whom they are elected and to whom they are accountable.
Kresta Holdings Limited‟s Corporate Governance Statement is structured with reference to the Corporate Governance Council‟s principles and recommendations, which are as follows:
Principle 1. Lay solid foundations for management and oversight Principle 2. Structure the board to add value Principle 3. Promote ethical and responsible decision making Principle 4. Safeguard integrity in financial reporting Principle 5. Make timely and balanced disclosure Principle 6. Respect the rights of shareholders Principle 7. Recognise and manage risk Principle 8. Remunerate fairly and responsibly
Kresta Holdings Limited‟s corporate governance practices were in place throughout the year ended 30 June 2010 and were compliant with the Council‟s best practice recommendations, except for there being no separate nomination committee. To ensure the Board is well equipped to discharge its responsibilities, it has established guidelines for the nomination and selection of directors and for the operation of the Board.
Structure of the Board The structure of the Board is determined in accordance with the following policies and guidelines:
The Board should comprise at least three directors and should maintain a majority of non-executive directors.
The Chairman must be a non-executive director.
The Board should comprise directors with an appropriate range of qualifications and expertise; and
The Board shall meet at least once every two months. The directors in office at the date of this statement are:
Name Position Term in Office Independent
I Trahar Chairman, Non-Executive Director 4 months Yes
TJ Bartlett Non-Executive Director 6 years Yes
P Hatfull Non-Executive Director 1 year Yes
Audit Committee The Board has established an Audit Committee. It is the Board‟s responsibility to ensure that an effective internal control framework exists within the entity. This includes internal controls to deal with both the effectiveness and efficiency of significant business processes, including the safeguarding of assets, the maintenance of proper accounting records, and the reliability of financial information. The Board has delegated responsibility for the establishment and maintenance of a framework of internal controls and ethical standards for the management of the consolidated entity to the Audit Committee. The committee also provides the Board with additional assurance regarding the reliability of financial information for inclusion in the financial reports. All members of the Audit Committee are non-executive directors. The members of the Audit Committee during the year were:
Independent Executive
NC Fearis – retired 31 December 2009 Yes No
TJ Bartlett (Chairman) Yes No
P Johnston – retired 23 June 2010 Yes No
P Hatfull Yes No
I Trahar Yes No
For
per
sona
l use
onl
y

KRESTA HOLDINGS LIMITED—ANNUAL REPORT
Corporate Governance Statement continued
14
Nomination Committee The Board is responsible for selecting candidates for the position of director. There is no separate Nomination Committee. Remuneration Committee The Board is responsible for determining and reviewing compensation arrangements for the directors themselves, the managing director and executives. The Board has established a remuneration committee, comprising three non-executive directors. Members of the remuneration committee throughout the year were:
Independent Executive NC Fearis (Chairman) – retired 31 December 2009 Yes No TJ Bartlett Yes No P Johnston – retired 23 June 2010 Yes No P Hatfull Yes No I Trahar Yes No
Board responsibilities As the Board acts on behalf of and is accountable to the shareholders, it seeks to identify the expectations of the shareholders, as well as other regulatory and ethical expectations and obligations. In addition, the Board is responsible for identifying areas of significant business risk and ensuring arrangements are in place to adequately manage those risks. The Board seeks to discharge these responsibilities in a number of ways.
The responsibility for the operation and administration of the consolidated entity is delegated by the Board to the Managing Director and the executive team. The Board is responsible for setting the strategic direction of the Company, establishing goals for management and monitoring the achievement of those goals. The Managing Director is responsible to the Board for the day to day management of the Company.
The Board is responsible for ensuring that management‟s objectives and activities are aligned with the expectations and risks identified by the Board.
Managing Director and Chief Financial Officer declaration Consistent with ASX Principle 4, the company‟s financial report preparation and approval process for the financial year ended 30 June 2010, involved both the Managing Director and Chief Financial Officer providing a written statement to the Board that, to the best of their knowledge and belief, the Company‟s financial report presents a true and fair view, in all material respects, of the Company‟s financial condition and operating results and is in accordance with applicable accounting standards. Independence declaration In respect of financial years commencing on or after 1 July 2004, the Corporate Law Economic Reform Programme (Audit Reform and Corporate Disclosure) Act 2004 (“CLERP 9”) amendments to the Corporations Act 2001 require external auditors to make an annual independence declaration, addressed to the Board, declaring that the auditors have maintained their independence in accordance with CLERP 9 amendments and the rules of the professional accounting bodies. Ernst & Young has provided such a declaration to the Board for the financial year ended 30 June 2010. Attendance of external auditors at Annual General Meeting Consistent with ASX Principle 6 and CLERP 9, Ernst & Young attend, and are available to answer questions at, the Company‟s annual general meeting relating to the conduct of the audit and preparation of the audit report. Shareholders may submit questions for the external auditors to the Company Secretary no later than five business days before an annual general meeting. Risk identification and management Consistent with ASX Principle 7, the Company is committed to the identification, monitoring and management of risks associated with its business activities and has embedded in its management and reporting systems a number of risk management controls. These include:
guidelines and limits for approval of capital expenditure and investments;
a group compliance programme supported by approved guidelines and standards covering such key areas as safety, the environment, legal liability, risk identification, quantification and reporting and financial controls;
a comprehensive annual insurance programme;
annual budgeting and monthly reporting systems for all operations which enable the monitoring of progress against performance targets and the evaluation of trends; and
directors‟ financial due diligence questionnaires to management.
Management is ultimately responsible to the Board for the Group‟s system of internal control and risk management. The Audit Committee assists the Board in monitoring this role.
For
per
sona
l use
onl
y

KRESTA HOLDINGS LIMITED—ANNUAL REPORT
Corporate Governance Statement continued
15
In accordance with ASX Principle 7, the Managing Director and Chief Financial Officer have provided the Board with a written statement that:
the statement given with respect to the integrity of the financial statements (referred to under the heading “Financial Reporting”) was founded on a sound system of risk management and internal compliance and control which implements the policies adopted by the Board; and
the Company‟s risk management and internal compliance and control system was operating efficiently and effectively in all material respects.
Continuous disclosure The Company understands and respects that timely disclosure of price sensitive information is central to the efficient operation of the Australian Securities Exchange‟s securities market and has adopted a comprehensive policy covering announcements to the Australian Securities Exchange, prevention of elective or inadvertent disclosure, conduct of investor and analysts briefings, media communications, commenting on expected earnings, communication black-out periods and review of briefings and communications. The Company‟s continuous disclosure policy is consistent with ASX Principle 5. Communication to shareholders The Board of Directors aims to ensure that the shareholders, on whose behalf they act, are informed of all information necessary to assess the performance of the directors. Information is communicated to the shareholders through:
the annual report which is distributed to all shareholders;
the annual general meeting and other meetings called to obtain approval for Board action as appropriate; and
continuous disclosure notices and periodic filings lodged with the ASX.
For
per
sona
l use
onl
y
KRESTA HOLDINGS LIMITED—ANNUAL REPORT
Income Statement FOR THE YEAR ENDED 30 JUNE 2010
16
Notes 2010 2009
$'000 $'000
Sale of goods 122,630 116,999
Finance revenue 286 105
Revenue 122,916 117,104
Other income 3(a) 1,024 948
Changes in inventories of finished goods and work in progress (1,337) (2,509)
Raw materials and consumables used (60,905) (52,157)
Employee benefits expense 3(b) (28,882) (27,692)
Depreciation and amortisation expense 3(c) (2,521) (2,355)
Other expenses 3(d) (25,400) (27,010)
Finance costs 3(e) (974) (1,062)
Profit from continuing operation before income tax 3,921 5,267
Income tax (expense) 4 (1,224) (1,609)
Net Profit attributable to the ordinary equity holders of the company 2,697 3,658
Earnings per share 5
Basic earnings per share (cents per share) 1.88 2.68
Diluted earnings per share (cents per share) 1.88 2.68
The above income statement should be read in conjunction with the accompanying notes.
For
per
sona
l use
onl
y

KRESTA HOLDINGS LIMITED—ANNUAL REPORT
Statement of comprehensive income FOR THE YEAR ENDED 30 JUNE 2010
17
2010 2009
$'000 $'000
Profit for the period 2,697 3,658
Other comprehensive income
Net foreign currency translation differences (77) (37)
Other comprehensive income for the period, net of tax (77) (37)
Total comprehensive income for the period 2,620 3,621
Total comprehensive income attributable to the ordinary equity holders of the company 2,620 3,621
For
per
sona
l use
onl
y
KRESTA HOLDINGS LIMITED—ANNUAL REPORT
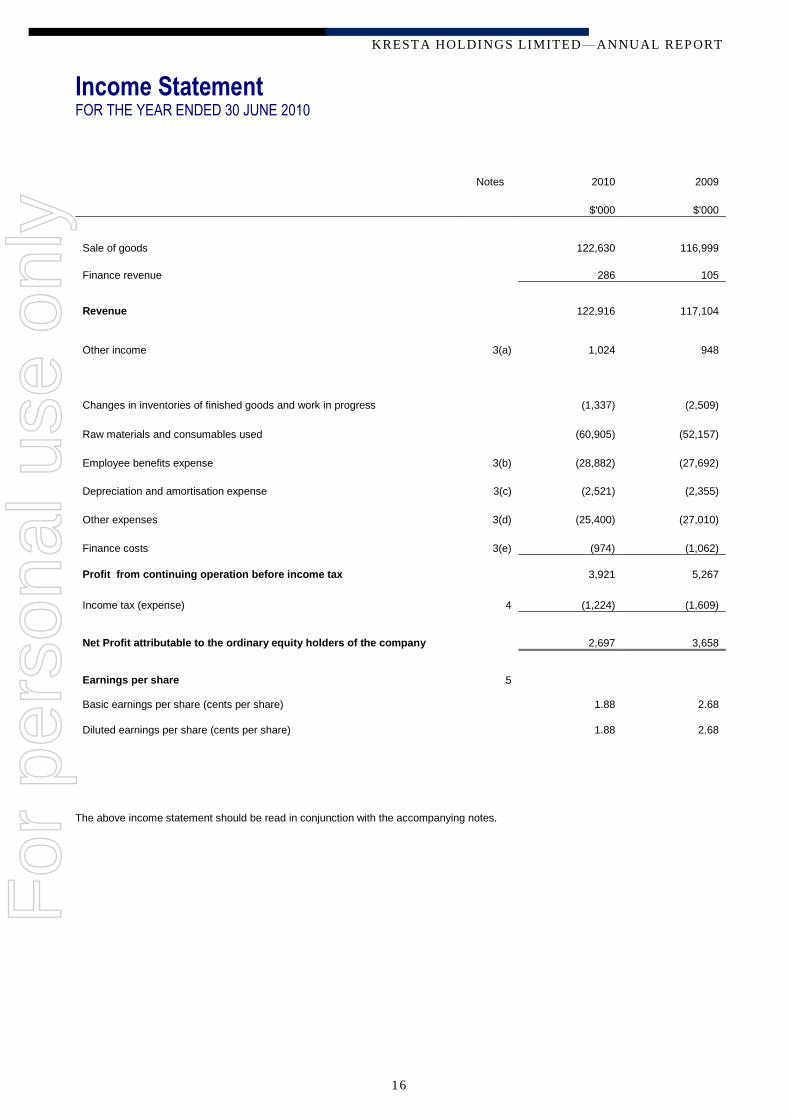
Statement of financial position AS AT 30 JUNE 2010
18
Notes 2010 2009
$'000 $'000
ASSETS
Current assets
Cash and cash equivalents 7 7,861 7,511
Trade and other receivables 8 3,612 3,462
Inventories 9 12,471 21,168
Prepayments 618 677
Derivative financial instruments 27 83 -
Total current assets 24,645 32,818
Non-current assets
Property, plant and equipment 11 17,052 18,130
Deferred tax assets 4 3,955 1,799
Intangible assets and goodwill 12 2,680 1,439
Total non-current assets 23,687 21,368
TOTAL ASSETS 48,332 54,186
LIABILITIES
Current liabilities
Trade and other payables 14 7,608 10,007
Interest-bearing loans and borrowings 15 10,215 3,618
Income tax payable 1,924 542
Provisions 16 4,645 4,120
Derivative financial instruments 27 42 471
Government grants 18 49 53
Total current liabilities 24,483 18,811
Non-current liabilities
Interest-bearing loans and borrowings 15 268 10,434
Provisions 16 678 603
Government grants 18 159 204
Total non-current liabilities 1,105 11,241
TOTAL LIABILITIES 25,588 30,052
NET ASSETS 22,744 24,134
EQUITY
Contributed equity 17 11,961 11,676
Reserves 17 (297) (220)
Retained earnings 17 11,080 12,678
TOTAL EQUITY 22,744 24,134
The above statement of financial position should be read in conjunction with the accompanying notes.
For
per
sona
l use
onl
y

KRESTA HOLDINGS LIMITED—ANNUAL REPORT
Statement of changes in equity FOR THE YEAR ENDED 30 JUNE 2010
19
Ordinary Foreign Employee Retained Total
shares currency equity earnings
translation benefits
reserve reserve
CONSOLIDATED $'000 $'000 $‟000 $'000 $'000
At 1 July 2009 11,676 (268) 48 12,678 24,134 Profit for the period - - - 2,697 2,697
Other comprehensive income - (77) - - (77)
Total comprehensive income for the period - (77) - 2,697 2,620
Transactions with owners in their capacity as owners
Dividends paid - - - (4,295) (4,295)
Share issued 285 - - - 285
At 30 June 2010 11,961 (345) 48 11,080 22,744
At 1 July 2008 10,679 (230) 46 10,351 20,846 Profit for the period - -
- 3,658 3,658
Other comprehensive income 1 (38)
-
- (37)
Total comprehensive income for the period 1 (38)
- 3,658 3,621
Transactions with owners in their capacity as owners
Share issued 1,000 - - - 1,000
Transaction costs on share issue (4) - - - (4)
Share-based payment - - 2 - 2
Dividends paid - - - (1,331) (1,331)
At 30 June 2009 11,676 (268) 48 12,678 24,134
The above statement of changes in equity should be read in conjunction with the accompanying notes.
For
per
sona
l use
onl
y

KRESTA HOLDINGS LIMITED—ANNUAL REPORT
Statement of cash flows FOR THE YEAR ENDED 30 JUNE 2010
20
Notes 2010 2009
$'000 $'000
Cash flows from operating activities
Receipts from customers 131,605 125,238
Payments to suppliers and employees (118,353) (113,416)
Receipt of government grants 475 457
Interest received 286 105
Interest paid (974) (1,062)
Income tax (paid)/received (1,999) (2,498)
Net cash flows from operating activities 7 11,040 8,824
Cash flows from investing activities
Proceeds from sale of property, plant and equipment 64 50
Purchase of property, plant and equipment (1,486) (5,011)
Acquisition of investment 23 (1,687) -
Net cash flows (used in) investing activities (3,109) (4,961)
Cash flows from financing activities
Proceeds from issue of shares - 1,000
Transaction costs on issue of shares - (4)
Options exercised 285 -
Equity dividend paid (4,295) (3,328)
Proceeds from borrowings 1,024 1,602
Repayment of borrowings (2,793) (3,011)
Net cash flows (used in) financing activities (5,779) (3,741)
Net increase in cash and cash equivalents 2,152 122
Net foreign exchange differences (1) 32
Cash and cash equivalents at beginning of period 5,710 5,556
Cash and cash equivalents at end of period 7 7,861 5,710
The above cash flow statement should be read in conjunction with the accompanying notes.F
or p
erso
nal u
se o
nly

KRESTA HOLDINGS LIMITED—ANNUAL REPORT
Notes to the Financial Statements FOR THE YEAR ENDED 30 JUNE 2010
21
1. CORPORATE INFORMATION
The financial report of Kresta Holdings Limited (the Company) for the year ended 30 June 2010 was authorised for issue in accordance with a resolution of the directors on 30 September 2010. Kresta Holdings Limited is a company limited by shares incorporated in Australia whose shares are publicly traded on the Australian Stock Exchange. The nature of the operations and principal activities of the Group are described in the Directors‟ Report.
2. SUMMARY OF SIGNIFICANT ACCOUNTING POLICIES
a) Basis of preparation The financial report is a general-purpose financial report, which has been prepared in accordance with the requirements
of the Corporations Act 2001, Australian Accounting Standards and other authoritative pronouncements of the Australian Accounting Standards Board. The financial report has also been prepared on a historical cost basis except for derivative financial instruments, which have been measured at fair value.
The financial report is presented in Australian dollars and all values are rounded to the nearest thousand dollars ($‟000)
unless otherwise stated under the option available to the Company under ASIC Class Order 98/0100. The Company is an entity to which the Class Order applies.
b) Compliance with IFRS
The financial report complies with Australian Accounting Standard and International Financial Reporting Standards (IFRS) as issued by the International Accounting Standards Board.
c) New accounting standards and interpretations
Changes in accounting policy and disclosures Since 1 July 2009, the Group has adopted all the Standards and Interpretations, mandatory for annual periods beginning on or after 1 July 2009 including the following. Adoption of these Standards and Interpretations did not have any effect on the financial position or performance of the Group.
AASB 101 Presentation of Financial Statements (revised). The revised Standard separates owner and non-owner changes in equity and requires a statement of comprehensive income to be prepared which discloses all changes in equity during a period resulting from non-owner transactions. The Group has elected to present comprehensive income using the two statement approach.
AASB 8 Operating Segments. The Standard requires a management approach to be used for segment reporting and replaces the requirement to determine primary and secondary reporting segments of the Group. This approach identifies operating segments by reference to internal reports that are evaluated regularly by the chief operating decision maker in deciding how to allocate resources and in assessing performance. The adoption of the Standard did not have any effect on the financial position or performance of the Group and resulted in the same operating segment as reported in the Annual Financial Report for the year ended 30 June 2009.
AASB 3 Business Combinations (revised). The revised Standard introduces a number of changes to accounting for business combination, including the requirement to expense transaction costs, accounting for non controlling interests and the recognition of contingent consideration at fair value. The Group adopted this revised Standard as of 1 July 2009 and has amended its accounting policy accordingly.
Accounting standards and interpretations issued but not yet effective Applicable Australian Accounting Standards and Interpretations that have recently been issued or amended but are not yet effective have not been adopted by the Group for the annual reporting period ended 30 June 2010. These are outlined in the table below.
Reference
Title
Summary
Impact on Group financial report
Application
date for Group*
AASB 2009-5 Further Amendments to Australian Accounting Standards arising from the Annual Improvements Project
The amendments to some Standards result in accounting changes for presentation, recognition or measurement purposes, while some amendments that relate to terminology and
The Group is in the process to determine the extent of the impact of the amendments, if any.
1 July 2010 For
per
sona
l use
onl
y

KRESTA HOLDINGS LIMITED—ANNUAL REPORT
Notes to the Financial Statements FOR THE YEAR ENDED 30 JUNE 2010
22
Reference
Title
Summary
Impact on Group financial report
Application
date for Group*
editorial changes.
AASB 2009-8 Amendments to Australian Accounting Standards – Group Cash-settled Share-based Payment Transactions [AASB 2]
The amendments clarify the accounting for group cash-settled share-based payment transactions in the separate or individual financial statements of the entity receiving the goods or services when the entity has no obligation to settle the share-based payment transaction.
The Group is in the process to determine the extent of the impact of the amendments, if any
1 July 2010
AASB 9 and AASB 2009-11
Financial instruments and amendments to Australian Accounting Standards arising from AASB 9
The revised Standard includes requirements for the classification and measurement of financial assets resulting from the first part of Phase 1 of the IASB‟s project to replace IAS 39 Financial Instruments: Recognition and Measurement (AASB 139 Financial Instruments: Recognition and Measurement). These requirements improve and simplify the approach for classification and measurement of financial assets.
The potential effect of this Standard is yet to be fully determined. However, it is not expected that the revised Standard will significantly affect the Group‟s financial position.
1 July 2013
AASB 2009-12
Amendments to Australian Accounting Standards
This amendment makes numerous editorial changes to a range of Australian Accounting Standards and Interpretations.
No change to accounting policy required. Therefore no impact.
July 2011
AASB 2010-3 Amendments to Australian Accounting Standards arising from the Annual Improvements Project [AASB 3, AASB 7, AASB 121, AASB 128, AASB 131, AASB 132 & AASB 139]
Limits the scope of the measurement choices of non-controlling interest at proportionate share of net assets in the event of liquidation. Other components of NCI are measured at fair value. Requires an entity (in a business combination) to account for the replacements of the acquiree‟s share-based payment transactions. Clarifies that contingent consideration from a business combination that occurred before the effective date of AASB 3 Revised is not restated. Eliminates the requirement to restate financial statements for a reporting period when significant influence or joint control is lost and the reporting entity accounts for the remaining investment under AASB 139. This includes the effect on
The Group is in the process to determine the extent of the impact of the amendments, if any
1 July 2010
For
per
sona
l use
onl
y

KRESTA HOLDINGS LIMITED—ANNUAL REPORT
Notes to the Financial Statements FOR THE YEAR ENDED 30 JUNE 2010
23
Reference
Title
Summary
Impact on Group financial report
Application
date for Group*
accumulated foreign exchange differences on such investments.
AASB 2010-4 Further Amendments to Australian Accounting Standards arising from the Annual Improvements Project [AASB 1, AASB 7, AASB 101, AASB 134 and Interpretation 13]
Emphasis the interaction between quantitative and qualitative AASB 7 disclosures and the nature and extent of risks associated with financial instruments. Clarifies that an entity will present an analysis of other comprehensive income for each component of equity, either in the statement of changes in equity or in the notes to the financial statements. Provides guidance to illustrate how to apply disclosure principles in AASB 134 for significant events and transactions.
The potential effect of this Standard is yet to be fully determined. However, it is not expected that the revised Standard will significantly affect the Group‟s financial position.
1 January 2011
For
per
sona
l use
onl
y
KRESTA HOLDINGS LIMITED—ANNUAL REPORT
Notes to the Financial Statements continued FOR THE YEAR ENDED 30 JUNE 2010
24
2. SUMMARY OF SIGNIFICANT ACCOUNTING POLICIES continued d) Basis of consolidation
The consolidated financial statements comprise the financial statements of Kresta Holdings Limited and its subsidiaries as at and for the period ended 30 June each year (the Group). Subsidiaries are all those entities over which the Group has the power to govern the financial and operating policies so as to obtain benefits from their activities. The existence and effect of potential voting rights that are currently exercisable or convertible are considered when assessing whether a group controls another entity. The financial statements of subsidiaries are prepared for the same reporting period as the parent company, using consistent accounting policies. In preparing the consolidated financial statements, all intercompany balances and transactions, income and expenses and profit and losses resulting from intra-group transactions have been eliminated in full. Subsidiaries are fully consolidated from the date on which control is obtained by the Group and cease to be consolidated from the date on which control is transferred out of the Group. Investments in subsidiaries are accounted for at cost in the parent entity less any impairment charges. Dividends received from subsidiaries are recorded as a component of other revenues in the parent entity and do not impact the recorded cost of the investment. The acquisition of subsidiaries is accounted for using the acquisition method of accounting. The acquisition method of accounting involves recognising at acquisition date, separately from goodwill, the identifiable assets acquired, the liabilities assumed and any non-controlling interest in the acquiree. The identifiable assets acquired and liabilities assumed are measured at their acquisition date fair values (see note (e)). The difference between the above items and the fair value of the consideration (including the fair value of any pre-existing investment in the acquiree) is goodwill or a discount on acquisition.
e) Business combination - refer to note 23 Subsequent to 1 July 2009 Business combinations are accounted for using the acquisition method. The consideration transferred in a business
combination shall be measured at fair value, which shall be calculated as the sum of the acquisition date fair values of assets transferred by the acquirer, the liabilities incurred by the acquirer to former owners of the acquiree and the equity issued by the acquirer, and the amount of any non-controlling interest in the acquiree. For each business combination, the acquirer measures the non-controlling interest in the acquiree either at fair value or at the proportionate share of the acquiree‟s identifiable net assets. Acquisition-related costs are expensed as incurred.
When the Group acquires a business, it assesses the financial assets and liabilities assumed for appropriate classification and
designation in accordance with the contractual terms, economic conditions, the Group‟s operating or accounting policies and other pertinent conditions as at the acquisition date. This includes the separation of embedded derivatives in host contracts by the acquiree.
If the business combination is achieved in stages, the acquisition date fair value of the acquirer‟s previously held equity interest
in the acquiree is remeasured at fair value as at the acquisition date through profit or loss. Any contingent consideration to be transferred by the acquirer will be recognised at fair value at the acquisition date.
Subsequent changes to the fair value of the contingent consideration which is deemed to be an asset or liability will be recognised in accordance with AASB 139 either in profit or loss in other comprehensive income. If the contingent consideration is classified as equity, it shall not be remeasured.
Prior to 1 July 2009
Business combinations were accounted for using the purchase method. Transaction costs directly attributable to the acquisition formed part of the acquisition costs. The non-controlling interest (formerly known as minority interest) was measured at the proportionate share of the acquiree‟s identifiable assets.
Business combinations achieved in stages were accounted for in separate steps. Any additional interest in the acquiree
acquired did not affect previously recognised goodwill. The goodwill amounts calculated at each step acquisition were accumulated.
When the Group acquired a business, embedded derivatives separated from the host contract by the acquiree were not
reassessed on acquisition unless the business combination resulted in a change in the terms of the contract that significantly modified the cash flows that otherwise would have been required under the contract.
Contingent consideration was recognised if, and only if, the Group had a present obligation, the economic outflow was more
likely than not and a reliable estimate was determinable. Subsequent adjustments to the contingent consideration were adjusted against goodwill.
For
per
sona
l use
onl
y

KRESTA HOLDINGS LIMITED—ANNUAL REPORT
Notes to the Financial Statements continued FOR THE YEAR ENDED 30 JUNE 2010
25
2. SUMMARY OF SIGNIFICANT ACCOUNTING POLICIES continued f) Significant accounting judgements, estimates and assumptions
The preparation of the financial statements requires management to make judgements, estimates and assumptions that affect the reported amounts in the financial statements. In the process of applying the Group‟s accounting policies, management has made the following judgements, apart from those involving estimations, which have the most significant effect on the amounts recognised in the financial statements. (i) Significant accounting judgements
Related parties The Group determines whether the amounts carried as intercompany balances and / or the investment in controlled entities is recoverable at least on an annual basis. The carrying amount of the intercompany balances and / or investment is assessed against the net assets of the controlled entity to determine any impairment. Lease classification Where the Group enters into a lease arrangement the risks and rewards of ownership are assessed. Where they are deemed to pass to the Group the lease is classified as a finance lease. Where the risk and rewards of ownership are deemed to remain with the lessor, the lease is classified as an operating lease.
(ii) Significant accounting estimates and assumptions The carrying amounts of certain assets and liabilities are often determined based on estimates and assumptions of future events. The key estimates and assumptions that have a significant risk of causing a material adjustment to the carrying amounts of certain assets and liabilities within the next annual reporting period are:
Impairment of goodwill The Group determines whether goodwill is impaired at least on an annual basis. This requires an estimation of the recoverable amount of the cash generating units to which the goodwill is allocated. The assumptions used in this estimation of recoverable amount and the carrying amount of goodwill are discussed in note 12. Share based payment The Group measures the cost of equity-settled transactions with employees by reference to the fair value of the equity instruments at the date at which they are granted. The fair value is determined using a Binomial Option-Pricing model. Inventory net realisable value The Group accounts for inventory at the lower of cost or net realisable value. Net realisable value assessments necessitate management‟s best estimate as to the ability of individual inventory items to be sold above cost.
g) Revenue recognition – refer to note 3 Revenue is recognised and measured at the fair value of the consideration received or receivable to the extent that it is probable that the economic benefits will flow to the Group and the revenue can be measured reliably. The following specific recognition criteria must also be met before revenue is recognised. Sale of goods Revenue from sale of goods is recognised when the significant risks and rewards of ownership of the goods have passed to the buyer and the costs incurred or to be incurred in respect of the transaction can be measured reliably. Risks and rewards of ownership are considered passed to the buyer at the time when the goods become available for delivery under a binding sales agreement. Interest revenue Revenue is recognised as the interest accrues using the effective interest method. This is a method of calculating the amortised cost of a financial asset allocating the interest income over the relevant period using the effective interest rate, which is the rate that exactly discounts estimated future cash receipts through the expected life of the financial asset to the net carrying amount of the financial asset.
Dividends Revenue is recognised when the Group‟s right to receive the payment is established.
h) Government grants – refer to note 18
Government grants are recognised in the statement of financial position as a liability when the grant is received. When the grant relates to an expense item, it is recognised as income over the periods necessary to match the grant on a systematic basis to the costs that it is intended to compensate. When the grant relates to an asset, the fair value is credited to a deferred income account and is released to the statement of comprehensive income over the expected useful life of the relevant asset by equal annual instalments.
For
per
sona
l use
onl
y

KRESTA HOLDINGS LIMITED—ANNUAL REPORT
Notes to the Financial Statements continued FOR THE YEAR ENDED 30 JUNE 2010
26
2. SUMMARY OF SIGNIFICANT ACCOUNTING POLICIES continued
i) Leases – refer to note 15
The determination of whether an arrangement is or contains a lease is based on the substance of the arrangement and requires an assessment of whether the fulfilment of the arrangement is dependent on the use of a specific asset or assets and the arrangement conveys a right to use the asset. Group as a lessee Finance leases, which transfer to the Group substantially all the risks and benefits incidental to ownership of the leased item, are capitalised at the inception of the lease at the fair value of the leased asset or, if lower, at the present value of the minimum lease payments. Lease payments are apportioned between the finance charges and reduction of the lease liability so as to achieve a constant rate of interest on the remaining balance of the liability. Finance charges are recognised as an expense in profit or loss. Capitalised leased assets are depreciated over the shorter of the estimated useful life of the asset or the lease term if there is no reasonable certainty that the Group will obtain ownership by the end of the lease term.
Operating lease payments are recognised as an expense in the statement of comprehensive income on a straight-line basis over the lease term. Operating lease incentives are recognized as liability when received and subsequently reduced by allocating lease payments between rental expenses and reduction of the liability.
j) Cash and cash equivalents – refer note 7 Cash and cash equivalents in the statement of financial position comprise cash at bank and cash in hand.
For the purposes of the statement of cash flows, cash and cash equivalents consist of cash and cash equivalents as defined above, net of outstanding bank overdrafts. Bank overdrafts are included within interest-bearing loans and borrowings in current liabilities on the statement of financial position.
k) Trade and other receivables – refer to note 8
Trade receivables, which generally have 30-60 day terms, are recognised and carried at original invoice amount less an allowance for any uncollectible amounts. Collectability of trade receivables is reviewed on an ongoing basis. Debts that are known to be uncollectible are written off when identified. An impairment allowance is recognised when there is objective evidence that the Group will not be able to collect the debts. Failure to collect debts after debt collection procedures and enforcements are considered objective evidence of impairment. The amount of the impairment loss is the carrying amount of the impaired receivables.
l) Inventories – refer to note 9 Inventories including raw materials and finished goods are valued at the lower of cost and net realisable value. Costs incurred in bringing each product to its present location and condition are accounted for as follows: Raw materials – purchase cost on a first in first out basis; and
Finished goods – cost of direct materials, for manufactured finished goods labour and a proportion of manufacturing overheads based on normal operating capacity but excluding borrowing costs. Costs are assigned on the basis of weighted average costs. Net realisable value is the estimated selling price in the ordinary course of business, less estimated costs of completion and the estimated costs necessary to make the sale.
m) Derivative financial instruments – refer to note 27 The Group uses derivative financial instruments such as forward currency contracts and interest rate swaps to manage its risks associated with foreign currency and interest rate fluctuations. Such derivative financial instruments are initially recognised at fair value on the date on which a derivative contract is entered into and are subsequently remeasured to fair value. Derivatives are carried as assets when their fair value is positive and as liabilities when their fair value is negative. As hedge accounting is not applied, any gains or losses arising from changes in the fair value of derivatives are taken directly to profit or loss for the year. The fair value of forward currency contracts is calculated by reference to current forward exchange rates for contracts with similar maturity profiles. The forward currency contracts are usually no longer than 12 months. The fair values of interest rates swaps are determined using a standard pricing methodology with reference to the market rates and terms.
For
per
sona
l use
onl
y

KRESTA HOLDINGS LIMITED—ANNUAL REPORT
Notes to the Financial Statements continued FOR THE YEAR ENDED 30 JUNE 2010
27
2. SUMMARY OF SIGNIFICANT ACCOUNTING POLICIES continued n) Foreign currency translation
Functional and presentation currency Both the functional and presentation currency of Kresta Holdings Limited and its Australian subsidiaries is Australian dollars ($). The New Zealand subsidiary‟s functional currency is New Zealand Dollars which is translated to presentation currency (see below). Transactions & balances Transactions in foreign currencies are initially recorded in the functional currency at the exchange rates ruling at the date of transaction. Monetary assets and liabilities denominated in foreign currencies are retranslated at the rate of exchange ruling at the reporting date. Non-monetary items that are measured in terms of historical cost in a foreign currency are translated using the exchange rate as at the date of the initial transaction. Non-monetary items measured at fair value in a foreign currency are translated using the exchange rate at the date when the fair value was determined Translation of Group Companies functional currency to presentation currency The result of the New Zealand subsidiary is translated into Australian Dollars as at the date of each transaction. Assets and liabilities are translated at exchange rates prevailing at reporting date. Exchange variations resulting from the translation are recognised in other comprehensive income.
o) Income Tax – refer to note 4 Current tax assets and liabilities for the current and prior periods are measured at the amount expected to be recovered from or paid to the taxation authorities based on the current period‟s taxable income. The tax rates and tax laws used to compute the amount are those that are enacted or substantively enacted by the reporting date. Deferred income tax is provided on all temporary differences at the reporting date between the tax bases of assets and liabilities and their carrying amounts for financial reporting purposes.
Deferred income tax liabilities are recognised for all taxable temporary differences except:
when the deferred income tax liability arises from the initial recognition of goodwill or of an asset or liability in a transaction
that is not a business combination and, at the time of the transaction, affects neither the accounting profit nor taxable profit or loss; or
when the taxable temporary difference is associated with investments in subsidiaries, and the timing of the reversal of the temporary differences can be controlled and it is probable that the temporary differences will not reverse in the foreseeable future.
Deferred income tax assets are recognised for all deductible temporary differences, carry-forward of unused tax credits and unused tax losses, to the extent that it is probable that taxable profit will be available against which the deductible temporary differences and the carry-forward of unused tax credits and unused tax losses can be utilized, except: when the deferred income tax asset relating to the deductible temporary difference arises from the initial recognition of an
asset or liability in a transaction that is not a business combination and, at the time of the transaction, affects neither the accounting profit nor taxable profit or loss; or
when the deductible temporary difference is associated with investments in subsidiaries, in which case a deferred tax asset is
only recognised to the extent that it is probable that the temporary differences will reverse in the foreseeable future and taxable profit will be available against which the temporary differences can be utilised.
The carrying amount of deferred income tax assets is reviewed at each reporting date and reduced to the extent that it is no longer probable that sufficient taxable profit will be available to allow all or part of the deferred income tax asset to be utilised. Unrecognised deferred income tax assets are reassessed at each reporting date and are recognised to the extent that it has become probable that future taxable profit will allow the deferred tax assets to be recovered. Deferred income tax assets and liabilities are measured at the tax rates that are expected to apply to the year when the asset is realised or the liability is settled, based on tax rates (and tax laws) that have been enacted or substantively enacted at the reporting date.
Deferred tax assets and deferred tax liabilities are offset only if a legally enforceable right exists to set off current tax assets against current tax liabilities and the deferred tax assets and liabilities relate to the same taxable entity and the same taxation authority.
For
per
sona
l use
onl
y

KRESTA HOLDINGS LIMITED—ANNUAL REPORT
Notes to the Financial Statements continued FOR THE YEAR ENDED 30 JUNE 2010
28
2. SUMMARY OF SIGNIFICANT ACCOUNTING POLICIES continued p) Other taxes
Revenues, expenses and assets are recognised net of the amount of GST except:
where the GST incurred on a purchase of goods and services is not recoverable from the taxation authority, in which case the
GST is recognised as part of the cost of acquisition of the asset or as part of the expense item as applicable; and receivables and payables, which are stated with the amount of GST included. The net amount of GST recoverable from, or payable to, the taxation authority is included as part of receivables or payables in the balance sheet. Cash flows are included in the statement of cash flows on a gross basis and the GST component of cash flows arising from investing and financing activities, which is recoverable from, or payable to, the taxation authority is classified as operating cash flows. Commitments and contingencies are disclosed net of the amount of GST recoverable from, or payable to, the taxation authority.
q) Property, plant and equipment – refer to note 11
Plant and equipment is stated at historical cost less accumulated depreciation and any accumulated impairment losses. Such cost includes the cost of replacing parts that are eligible for capitalization when the cost of replacing the parts is incurred. Similarly, when each major inspection is performed, its cost is recognized in the carrying amount of the plant and equipment as a replacement only if it is eligible for capitalization. All other repairs and maintenance are recognized in profit or loss as incurred.
Land and buildings are measured at cost less accumulated depreciation on buildings and any accumulated impairment losses.
Depreciation is calculated on a straight-line basis over the estimated useful life of the asset as follows: Buildings - over 40 years Plant and equipment – over 5 to 15 years Leased equipment - the lease term
Derecognition An item of property, plant and equipment is derecognised upon disposal or when no future economic benefits are expected to arise from continued use of the asset. Any gain or loss arising on derecognition of the asset (calculated as the difference between the net disposal proceeds and the carrying amount of the item) is included in the statement of comprehensive income in the year the item is derecognised.
r) Goodwill – refer to note 12
Goodwill acquired in a business combination is initially measured at cost of the business combination being the excess of the consideration transferred over the fair value of the Group‟s net identifiable assets acquired and liabilities assumed. If this consideration transferred is lower than the fair value of net identifiable assets of the subsidiary acquired, the difference is recognized in profit or loss. After initial recognition, goodwill is measured at cost less any accumulated impairment losses.
Goodwill is reviewed for impairment, annually or more frequently if events or changes in circumstances indicate that the carrying value may be impaired.
For the purpose of impairment testing, goodwill acquired in a business combination is, from the acquisition date, allocated to each of the Group‟s cash-generating units, or groups of cash-generating units, that are expected to benefit from the synergies of the combination, irrespective of whether other assets or liabilities of the Group are assigned to those units or groups of units. Each unit or group of units to which the goodwill is allocated represents the lowest level within the entity at which the goodwill is monitored for internal management purposes, and is not larger than an operating segment determined in accordance with AASB 8, and includes:
Kresta Holdings Limited cash-generating unit; and
Curtain Wonderland Pty Ltd cash-generating unit Impairment is determined by assessing the recoverable amount of the cash-generating unit to which the goodwill relates. Where the recoverable amount of the cash-generating unit is less than the carrying amount, an impairment loss is recognised. Where goodwill forms part of a cash-generating unit and part of the operation within that unit is disposed of, the goodwill associated with the operation disposed of is included in the carrying amount of the operation when determining the gain or loss on disposal of the operation. Goodwill disposed of in this circumstance is measured on the basis of the relative values of the operation disposed of and the portion of the cash-generating unit retained. Impairment losses recognised for goodwill are not subsequently reversed.
For
per
sona
l use
onl
y

KRESTA HOLDINGS LIMITED—ANNUAL REPORT
Notes to the Financial Statements continued FOR THE YEAR ENDED 30 JUNE 2010
29
2. SUMMARY OF SIGNIFICANT ACCOUNTING POLICIES continued s) Intangibles – refer to note 12
Intangible assets acquired separately or in a business combination are initially measured at cost. The cost of an intangible asset acquired in a business combination is its fair value as at the date of acquisition. Following initial recognition, intangible assets are carried at cost less any accumulated amortisation and any accumulated impairment losses.
Intangible assets are tested for impairment where an indicator of impairment exists. Intangible assets with finite lives are amortised over the useful life and tested for impairment whenever there is an indication that the intangible asset may be impaired. The amortisation period and the amortisation method for an intangible asset with a finite useful life is reviewed at least at each financial year end. Changes in the expected useful life or the expected pattern of consumption of future economic benefits embodied in the asset are accounted for by changing the amortisation period or method, as appropriate, which is a change in accounting estimate. The amortisation expense on intangible assets with finite lives is recognised in profit or loss in the expense category consistent with the function of the intangible asset. Intangible assets with indefinite useful lives are tested for impairment annually either individually or at the cash-generating unit level consistent with the methodology for goodwill above. Such intangibles are not amortised. The useful life of an intangible asset with an indefinite useful life is reviewed each reporting period to determine whether indefinite life assessment continues to be supportable. If not, a change in the useful life assessment from indefinite to finite is accounted for as a change in an accounting estimate and is thus accounted for on a prospective basis.
A summary of policies applied to the Group‟s intangible assets is as follows:
Software
Useful life – 4 years
Amortisation method used – Amortisation over the period of expected future benefit on a straight line basis
Internally generated or acquired - Acquired
Impairment testing – When an indicator of impairment exists
Trademark
Useful life – indefinite
Amortisation method used – No amortisation
Internally generated or acquired - Acquired
Impairment testing – must be tested annually
The Group has determined that there is no foreseeable limit to the period over which the trademark is expected to generate net cash flows for the Group. Thus, the trademark has an indefinite useful live.
Gains or losses arising from derecognition of an intangible asset are measured as the difference between the net disposal proceeds and the carrying amount of the asset and are recognized in profit or loss when the asset is derecognized.
t) Impairment of non-financial assets other than goodwill
Non-financial assets other than goodwill and indefinite life intangibles are tested for impairment whenever events or changes in circumstances indicate that the carrying amount may not be recoverable.
Kresta Holdings Limited assesses at each reporting date whether there is an indication that an asset may be impaired. External factors such as changes in expected future processes, technology and economic conditions are also monitored to assess for indicators of impairment. If any indication of impairment exists, an estimate of the asset‟s recoverable amount is calculated. An impairment loss is recognised for the amount by which the asset‟s carrying amount exceeds its recoverable amount. Recoverable amount is the higher of an asset‟s fair value less costs to sell and value is use. For the purposes of assessing impairment, assets are grouped at the lowest levels for which there are separately identifiable cash inflows that are largely independent of the cash inflows from other assets or group of assets (cash-generating units). Non-financial assets other than goodwill that suffered impairment are tested for possible reversal of the impairment whenever events or changes in circumstances indicate that the impairment may have reversed.
u) Trade and other payables – refer to note 14
Trade payables and other payables are carried at amortised cost due to their short term nature they are not discounted. They represent liabilities for goods and services provided to the Group prior to the end of the financial year that are unpaid and arise when the Group becomes obliged to make future payments in respect of the purchase of these goods and services. The amounts are usually paid within 30- 60 days of recognition.
For
per
sona
l use
onl
y

KRESTA HOLDINGS LIMITED—ANNUAL REPORT
Notes to the Financial Statements continued FOR THE YEAR ENDED 30 JUNE 2010
30
2. SUMMARY OF SIGNIFICANT ACCOUNTING POLICIES continued
v) Provisions and employee benefits – refer to note 16
Provisions are recognized when the Group has a present obligation (legal or constructive) as a result of a past event, it is probable that an outflow of resources embodying economic benefits will be required to settle the obligation and a reliable estimate can be made of the amount of the obligation. Where the Group expects some or all of a provision to be reimbursed, for example under an insurance contract, the reimbursement is recognized as a separate asset but only when the reimbursement is virtually certain. The expense relating to any provision is presented in the statement of comprehensive income net of any reimbursement. Provisions are measured at the present value of management‟s best estimate of the expenditure required to settle the present obligation at the reporting date. The discount rate used to determine the present value reflects current market assumptions of the time value of money and the risks specific to the liability. The increase in the provision resulting from the passage of time is recognized in finance costs.
Employee leave benefits
(i) Wages, salaries and annual leave Liabilities for wages and salaries, including non-monetary benefits and annual leave expected to be settled within 12 months of the reporting date are recognised in respect of employees‟ services up to the reporting date. They are measured at the amounts expected to be paid when the liabilities are settled. Expenses for non-accumulating sick leave are recognised when the leave is taken and are measured at the rates paid or payable.
(ii) Long service leave The liability for long service leave is recognised and measured as the present value of expected future payments to be made in respect of services provided by employees up to the reporting date using the projected unit credit method. Consideration is given to expected future wage and salary levels, experience of employee departures and period of service. Expected future payments are discounted using market yields at the reporting date on national government bonds with terms to maturity and currencies that match, as closely as possible, the estimated future cash outflows.
w) Borrowing costs
Borrowing costs directly attributable to the acquisition, construction or production of a qualifying asset (i.e. an asset that necessarily takes a substantial period of time to get ready for its intended use or sale) are capitalized as part of the cost of that asset. All other borrowing costs are expensed in the period they occur. Borrowing costs consist of interest and other costs that an entity incurs in connection with the borrowing of funds.
x) Interest-bearing loans and borrowings – refer to note 15 All loans and borrowings are initially recognised at fair value of the consideration received, net of issue costs associated with the borrowing. After initial recognition, interest-bearing loans and borrowings are subsequently measured at amortised cost using the effective interest method.
y) Share based payment transactions – refer to note 13
Equity settled transactions
The Group provides benefits to directors and executives of the Group in the form of share-based payment transactions, whereby key management personnel render services in exchange for options („equity-settled transactions‟).
The current plan to provide these benefits is the Employee Share Option Plan (ESOP). The cost of these equity-settled transactions with employees is measured by reference to the fair value of the equity instruments at the date at which they are granted. The fair value is determined by using a binomial model.
In valuing equity-settled transactions, no account is taken of any performance conditions, other than conditions linked to the price of the shares of Kresta Holdings Limited („market conditions‟). The cost of equity-settled transactions is recognised, together with a corresponding increase in equity, over the period in which the performance and / or service conditions are fulfilled (the vesting period), ending on the date on which the relevant employees become fully entitled to the award (vesting date). At each subsequent reporting date until vesting, the cumulative charge to the statement of comprehensive income is the product of:
The grant date fair value of the award.
The current best estimate of the number of awards that will vest, taking into account such factors as the likelihood of employee turnover during the vesting period and the likelihood of non-market performance conditions being met.
The expired portion of the vesting period. No expense is recognised for awards that do not ultimately vest, except for awards where vesting is conditional upon a market condition.
For
per
sona
l use
onl
y

KRESTA HOLDINGS LIMITED—ANNUAL REPORT
Notes to the Financial Statements continued FOR THE YEAR ENDED 30 JUNE 2010
31
2. SUMMARY OF SIGNIFICANT ACCOUNTING POLICIES continued Where the terms of an equity-settled award are modified, as a minimum, an expense is recognised as if the terms had not been modified. In addition, an expense is recognised for any increase in the value of the transaction as a result of the modification, as measured at the date of modification. Where an equity-settled award is cancelled, it is treated as if it had vested on the date of cancellation, and any expense not yet recognised for the award is recognised immediately. However, if a new award is substituted for the cancelled award, and designated as a replacement award on the date that it is granted, the cancelled and new award are treated as if they were a modification of the original award, as described in the previous paragraph. The dilutive effect, if any, of outstanding options is reflected as additional share dilution in the computation of earnings per share.
z) Contributed equity – refer to note 17 Ordinary shares are classified as equity. Incremental costs directly attributable to the issue of new shares or options are shown in equity as a deduction, net of tax, from the proceeds.
aa) Operating segments - refer to note 26 An operating segment is a component of an entity that engages in business activities from which it may earn revenues and incur expenses (including revenues and expenses relating to transactions with other components of the same entity), whose operating results are regularly reviewed by the entity‟s chief operating decision maker to make decisions about resources to be allocated to the segment and assess its performance for which discrete financial information is available. This includes start up operations which are yet to earn revenues. Management will also consider other factors in determining operating segments such as the existence of a line manager and the level of segment information presented to the board of directors. Operating segments have been identified based on the information provided to the chief operating decision makers – being the executive management team. The Group aggregates two or more operating segments when they have similar economic characteristics, and the segments are similar in each of the following respects:
Nature of the products and services,
Nature of the production processes,
Type or class of customer for the products and services,
Methods used to distribute the products or provide the services, and if applicable
Nature of the regulatory environment.
Operating segments that meet the quantitative criteria as prescribed by AASB 8 are reported separately. However, an operating segment that does not meet the quantitative criteria is still reported separately where information about the segment would be useful to users of the financial statements. Information about other business activities and operating segments that are below the quantitative criteria are combined and disclosed in a separate category for “all other segments”.
bb) Earnings per share – refer to note 5
Basic earnings per share is calculated as net profit attributable to members of the parent, adjusted to exclude any costs of servicing equity (other than dividends) and preference share dividends, divided by the weighted average number of ordinary shares, adjusted for any bonus element. Diluted earnings per share is calculated as net profit attributable to members of the parent, adjusted for: Costs of servicing equity (other than dividends) and preference share dividends; The after tax effect of dividends and interest associated with dilutive potential ordinary shares that have been recognised as
expenses; and Other non-discretionary changes in revenues or expenses during the period that would result from the dilution of potential
ordinary shares; divided by the weighted average number of ordinary shares and dilutive potential ordinary shares, adjusted for any bonus element.
cc) Investments and other financial assets
Investments and financial assets in the scope of AASB 139 Financial Instruments: Recognition and Measurement are categorized as either financial assets at fair value through profit or loss or loans and receivables. The classification depends on the purpose for which the investments were acquired. Designation is re-evaluated at each reporting date, but there are restrictions on reclassifying to other categories. When financial assets are recognized initially, they are measured at fair value, plus, in the case of assets not at fair value through profit or loss, directly attributable transaction costs.
For
per
sona
l use
onl
y

KRESTA HOLDINGS LIMITED—ANNUAL REPORT
Notes to the Financial Statements continued FOR THE YEAR ENDED 30 JUNE 2010
32
2. SUMMARY OF SIGNIFICANT ACCOUNTING POLICIES continued Recognition and derecognition All regular way purchases and sales of financial assets are recognized on the trade date i.e., the date that the Group commits to purchase the asset. Regular way purchases or sales are purchases or sales of financial assets under contracts that require delivery of the assets within the period established generally by regulation or convention in the market place. Financial assets are derecognized when the right to receive cash flows from the financial assets have expired or when the entity transfers substantially all the risks and rewards of the financial assets. If the entity neither retains nor transfers substantially all of the risks and rewards, it derecognizes the asset if it has transferred control of the assets.
Subsequent measurement (i) Financial assets at fair value through profit or loss Financial assets classified as held for trading are included in the category “financial assets at fair value through profit or loss”. Financial assets are classified as held for trading if they are acquired for the purpose of selling in the near term with the intention of making a profit. Derivatives are also classified as held for trading unless they are designated as effective hedging instruments. Gains or losses on financial assets held for trading are recognized in profit of loss and the related assets are classified as current assets in the statement of financial position.
(ii) Loans and receivables
Loans and receivables including loan notes are non-derivative financial assets with fixed or determinable payments that are not quoted in an active market. Such assets are carried at amortised cost using the effective interest method. Gains and losses are recognized in profit or loss when the loans and receivables are derecognized or impaired. These are included in current assets, except for those with maturities greater than 12 months after balance date, which are classified as non-current.
For
per
sona
l use
onl
y

KRESTA HOLDINGS LIMITED—ANNUAL REPORT
Notes to the Financial Statements continued FOR THE YEAR ENDED 30 JUNE 2010
33
3. REVENUES AND EXPENSES 2010 2009 $'000 $'000
Revenues and Expenses from Continuing Operations
(a) Other income
Government grants 524 371
Net gain from disposal of property, plant & equipment 8 -
Net unrealised gain from derivatives 41 -
Other income 451 577
1,024 948
(b) Employee benefits expense
Wages and salaries 16,689 15,471
Superannuation expense 1,916 2,628
Employee share-based payments - 2
Consultant commissions 8,519 8,132
Long service leave expense 513 131
Other employee benefits expense 1,245 1,328
28,882 27,692
(c) Depreciation and amortisation expense
Depreciation 2,477 2,299
Amortisation of IT software 44 56
2,521 2,355
(d) Other expenses
Advertising 10,173 10,163
Property rent and lease payments 7,008 6,878
Property outgoings 2,700 2,351
Communication expenses 2,154 2,245
Banking and transaction expenses 1,258 985
Impairment allowance – loans and receivables 7 17
Net loss from disposal of property, plant & equipment - 107
Other expenses 2,100 4,264
25,400 27,010
(e) Finance costs
Finance charges payable under finance leases and hire purchase contracts 212 217
Other borrowing costs 762 845
Total Finance costs 974 1,062
(f) Cost of inventories recognised as an expense 60,527 50,855 (g) Write-down of inventory to net realisable value included within the cost of inventory
recognised as an expense 7,061 -
For
per
sona
l use
onl
y

KRESTA HOLDINGS LIMITED—ANNUAL REPORT
Notes to the Financial Statements continued FOR THE YEAR ENDED 30 JUNE 2010
34
4. INCOME TAX 2010 2009 $'000 $'000
The major components of income tax expense are:
Income Statement
Current income tax
Current income tax charge 3,386 1,808
Adjustments in respect of current income tax of previous years (32) (15)
Deferred income tax
Relating to origination and reversal of temporary differences (2,130) (184)
Income tax expense reported in the statement of comprehensive income 1,224 1,609
Amounts charged or credited directly to equity
Current income tax related to items charged or credited directly to equity
Transaction costs on issue of shares - 1
Deferred income tax related to items charged or credited directly to equity - -
Income tax expense reported in equity - 1
Numerical reconciliation between aggregate tax expense recognised in the statement of comprehensive income and tax expense calculated per the statutory income tax rate
A reconciliation between tax expense and the product of accounting profit before income tax multiplied by the Group‟s applicable income tax rate is as follows:
Accounting profit before income tax 3,921 5,267
At the Group‟s statutory income tax rate of 30% 1,176 1,580
Adjustments in respect of current income tax of previous years (32) (15)
Expenditure not allowable for income tax purposes 18 8
Kresta Blinds International Pty Ltd profit 62 35
Share based payments (equity settled) - 1
Income tax (benefit)/expense 1,224 1,609
For
per
sona
l use
onl
y

KRESTA HOLDINGS LIMITED—ANNUAL REPORT
Notes to the Financial Statements continued FOR THE YEAR ENDED 30 JUNE 2010
35
Statement of financial position Income statement
4. INCOME TAX continued 2010 2009 2010 2009 $'000 $'000 $'000 $'000
Recognised deferred tax assets and liabilities
Deferred income tax at 30 June relates to the following:
Deferred tax assets
Allowance for doubtful debts 11 6 (5) 20
Inventory 2,262 151 (2,112) 41
Accruals 92 208 198 (60)
Other creditors 95 196 20 (42)
Provision for FBT 28 12 (12) 2
Employee entitlements 1,520 1,327 (165) (81)
Property, plant and equipment 32 13 - (8)
4,040 1,913 (2,076) (128)
Deferred tax liabilities
Prepayment 1 3 (2) (1)
Property, plant and equipment 81 107 (26) (54)
Capitalised borrowings 3 4 (26) (1)
85 114 (54) (56)
Net deferred tax assets 3,955 1,799
Deferred tax income/(expense) (2,130) (184)
The Group does not have any tax losses and unrecognised temporary differences.
5. EARNINGS PER SHARE The following reflects the income and share data used in the basic and diluted earnings per share computations:
2010 2009
$‟000 $‟000
Earnings used in calculating earnings per share
Net profit attributable to ordinary equity holders of Kresta Holdings Limited from continuing operations 2,697 3,658
2010 2009
Weighted average number of shares $‟000 $‟000
Weighted average number of ordinary shares for basic earnings per share 143,164 136,610
Weighted average number of ordinary shares adjusted for the effect of dilution 143,164 136,610
There have been no other transactions involving ordinary shares or potential ordinary shares between the reporting date and the date of completion of these financial statements. The potential ordinary shares on issue at reporting date is Nil (2009:6,000,000).
For
per
sona
l use
onl
y

KRESTA HOLDINGS LIMITED—ANNUAL REPORT
Notes to the Financial Statements continued FOR THE YEAR ENDED 30 JUNE 2010
36
6. DIVIDENDS PAID AND PROPOSED 2010 2009 $'000 $'000
(a) Recognised amounts
Declared and paid during the year
Dividends on ordinary shares:
Final franked dividend for 2009:1.00 cent (2008: 1.00 cent) 1,432 1,331
Interim franked dividend for 2010: 2.00 cents (2009: Nil) 2,863 -
4,295 1,331
(b) Unrecognised amounts
Dividends on ordinary shares:
Final franked dividend for 2010: 1.50 cents (2009: 1.00 cent) 2,162 1,432
(c) Franking credit balance
The amount of franking credits available for the subsequent financial year are:
- franking account balance as at the end of the financial year at 30% (2009: 30%) 2,204
- franking credits that will arise from the payment of income tax payable as at the end of the financial year 1,924
4,128
The amount of franking credits available for future reporting periods:
- impact on the franking account of dividends proposed or declared before the financial report was
authorised for issue but not recognised as a distribution to equity holders during the period. (927)
3,201
(d) Tax rates
The tax rate at which paid dividends have been franked is 30% (2009: 30%).
Dividends proposed will be franked at the rate of 30% (2009: 30%).
For
per
sona
l use
onl
y

KRESTA HOLDINGS LIMITED—ANNUAL REPORT
Notes to the Financial Statements continued FOR THE YEAR ENDED 30 JUNE 2010
37
7. CASH AND CASH EQUIVALENTS 2010 2009 $'000 $'000
Cash at bank and in hand 7,861 7,511
Bank overdraft - (1,801)
Total cash and cash equivalents 7,861 5,710
Cash at bank earns interest at floating rates based on daily bank deposits rates. The carrying amounts of cash and cash equivalents represent fair value. Refer to note 15 for bank facilities.
Reconciliation of net profit after tax to net cash flows from operations
Net profit 2,697 3,658
Adjustments for:
Depreciation 2,477 2,299
Amortisation 44 56
Foreign currency translation (reserve) (77) (38)
Employee share based payments - 2
Net loss/(gain) on disposal of property, plant and equipment (8) 107
Fair value change in derivatives (512) 431
Changes in assets and liabilities
(Increase)/decrease in trade and other receivables (157) (4)
(Increase)/decrease in inventories 9,000 2,509
(Increase)/decrease in deferred tax assets (2,157) (184)
(Increase)/decrease in prepayments 182 97
Increase/(decrease) in trade and other payables (1,885) 318
Increase/(decrease) in government grants (49) 86
Increase/(decrease) in tax receivables/payable 1,382 (706)
Increase/(decrease) in provisions 103 193
Net cash (used in) / from operating activities 11,040 8,824
For
per
sona
l use
onl
y

KRESTA HOLDINGS LIMITED—ANNUAL REPORT
Notes to the Financial Statements continued FOR THE YEAR ENDED 30 JUNE 2010
38
8. TRADE AND OTHER RECEIVABLES (CURRENT)
2010 2009
$'000 $'000
Trade receivables 2,820 2,692
Allowance for impairment loss (i) (37) (22)
2,783 2,670
Short term deposits (ii) 215 225
Other receivables (iii) 614 567
3,612 3,462
(i)
Allowance for impairment loss
Trade receivables are non-interest bearing and are generally on 30-60 day terms. An allowance for doubtful debts is made when there is objective evidence that an individual trade receivable is impaired. An impairment allowance account of $37,000 (2009: $22,000) has been recognised by the Group at year-end. No individual amount within the impairment allowance is material.
Movements in the provision for impairment loss were as follows: CONSOLIDATED
2010 2009
$'000 $'000
At 1 July 22 86
Charge for the year 64 17
Amounts written off (included in other expense item) (49) (81)
At 30 June 2010 37 22
At 30 June, the ageing analysis of trade receivables is as follows:
Total 0-30 days
31 – 60 days
61 – 90 days
+91 days
+91 days
$‟000 $‟000 $‟000 PDNI* $‟000
PDNI* $‟000
CI** $‟000
2010 Consolidated 2,820 2,296 201 120 166 37
2009 Consolidated 2,692 2,189 256 92 133 22
* Past due not impaired (PDNI)
** Considered impaired (CI)
Receivables past due but not considered impaired are: $286,000 (2009: $225,000). Payment terms on these amounts have not been re-negotiated. Each operating unit has been in direct contact with the relevant debtor and is satisfied that payment will be received in full. Other balances within trade and other receivables do not contain impaired assets and are not past due. It is expected that these other balances will be received when due.
(ii) Deposits are in respect of security deposits for premises leased.
(iii) Other receivables are non-interest bearing and have repayment terms between 30 and 90 days.
(iv) Fair value and credit risk Due to the short term nature of these receivables, their carrying value is assumed to approximate their fair value.
The maximum exposure to credit risk is the fair value of receivables. Collateral is not held as security, nor is it the Group‟s policy to transfer (on-sell) receivables to special purpose entities.
(v) Foreign exchange and interest rate risk
Detail regarding foreign exchange and interest rate risk exposure is disclosed in note 19.
For
per
sona
l use
onl
y

KRESTA HOLDINGS LIMITED—ANNUAL REPORT
Notes to the Financial Statements continued FOR THE YEAR ENDED 30 JUNE 2010
39
9. INVENTORIES 2010 2009 $'000 $'000
Raw materials (at net realisable value) 5,449 13,543
Finished goods (at net realisable value) 7,022 7,625
Total inventories at lower of cost and net realisable value 12,471 21,168
10. PARENT ENTITY INFORMATION
2010 2009
Information relating to Kresta Holdings Limited (parent entity): $‟000 $‟000
Current assets 3,014 3,514
Total assets 16,973 16,706
Current liabilities 7,231 3,416
Total liabilities 7,280 7,519
Issued capital 11,961 11,676
Retained earnings (2,316) (2,537)
Reserves 48 48
Total shareholder‟s equity 9,693 9,187
Profit or loss of the parent entity 4,516 2,688
Total comprehensive income of the parent entity 4,516 2,689
Tax consolidation legislation Kresta Holdings Limited and its wholly owned Australian subsidiaries have formed a tax consolidated group as of 1 July 2002. The head entity, Kresta Holdings Limited and the controlled entities in the tax consolidated group continue to account for their own current and deferred tax amounts. The Group has applied the group allocation approach in determining the appropriate amount of current taxes and deferred taxes to allocate to members of the tax consolidated group. In addition to its own current and deferred tax amounts, Kresta Holdings Limited also recognise the current tax liabilities (or assets) and the deferred tax assets arising from unused tax losses and unused tax credits assumed from controlled entities in the tax consolidated group. Assets or liabilities arising under the tax funding agreements with the tax consolidated entities are recognised as amounts receivable from or payable to other entities in the Group. Details of the tax funding agreement are disclosed in note 4. A tax funding arrangement is in place to reimburse the parent entity for any liabilities of the subsidiaries it assumes and conversely, for the parent entity to reimburse the subsidiaries for any recognised tax losses it acquires.
Tax consolidation Members of the tax consolidated group and the tax sharing arrangement Kresta Holdings Limited and its 100% owned Australian subsidiaries formed a tax consolidated group with effect from 1 July 2002. Kresta Holdings Limited is the head entity of the tax consolidated group. Members of the group have entered into a tax sharing agreement in order to allocate income tax expense to the wholly owned subsidiaries on a systematic basis. The agreement provides for the allocation of income tax liabilities between the entities should the head entity default on its tax payment obligations. At balance date, the possibility of default is remote.
For
per
sona
l use
onl
y

KRESTA HOLDINGS LIMITED—ANNUAL REPORT
Notes to the Financial Statements continued FOR THE YEAR ENDED 30 JUNE 2010
40
10. PARENT ENTITY INFORMATION continued
Measurement method adopted under UIG 1052 Tax Consolidation Accounting The head entity and controlled entities in the tax consolidated group continue to account for their own current and deferred tax amounts. The Group has applied the group allocation approach in determining the appropriate amount of current taxes and deferred taxes to allocate to members of the tax consolidated group. The current and deferred tax amounts are measured in a systematic manner that is consistent with the broad principles in AASB 112 Income Taxes. The nature of the tax funding agreement is discussed further below. In addition to its own current and deferred tax amounts, the head entity also recognised current tax liabilities (or assets) and the deferred tax assets arising from unused tax losses and unused tax credits assumed from controlled entities in the tax consolidated group. Nature of the tax funding agreement Members of the group have entered into a tax funding agreement. Under the funding agreement the allocation of tax within the group is based on a group allocation. The tax funding agreement requires payments to/from the head entity to be recognised via an inter-entity receivable (payable) which is at call. The allocation of taxes under the tax funding agreement is recognised as an increase or decrease in the subsidiaries‟ intercompany accounts with the tax consolidated group head company, Kresta Holdings Limited. The amounts receivable or payable under the tax funding agreement are due upon receipt of the funding advice from the head entity, which is issued as soon as practical after the end of each financial year. Event after balance date Subsequent to the balance date, Kresta Holdings Limited (parent entity) received $8,000,000 dividends from the subsidiaries. Remuneration commitments Commitments (within one year) for the payment of salaries and other remuneration under long-term employment contracts in existence at the reporting date but not recognised as liabilities payable for the Kresta Holdings Limited (parent entity) was $1,206,000 (2009: 932,000).
For
per
sona
l use
onl
y

KRESTA HOLDINGS LIMITED—ANNUAL REPORT
Notes to the Financial Statements continued FOR THE YEAR ENDED 30 JUNE 2010
41
11. PROPERTY, PLANT AND EQUIPMENT Freehold
Land and Plant and
Buildings Equipment Total $'000 $'000 $‟000
Year ended 30 June 2010
At 1 July 2009
Net of accumulated depreciation and impairment 9,456 8,674 18,130
Additions 80 1,209 1,289
Disposals - (58) (58)
Acquisition of business - 167 167
Depreciation charge for the year (279) (2,198) (2,477)
Foreign exchange - 1 1
At 30 June 2010 Net of accumulated depreciation and impairment 9,257 7,795 17,052
At 1 July 2009
Cost 10,806 29,053 39,859
Accumulated depreciation and impairment (1,350) (20,379) (21,729)
Net carrying amount 9,456 8,674 18,130
At 30 June 2010
Cost 10,886 30,371 41,257
Accumulated depreciation and impairment (1,629) (22,576) (24,205)
Net carrying amount 9,257 7,795 17,052
Freehold
Land and Plant and
Buildings Equipment Total
$‟000 $‟000 $‟000
Year ended 30 June 2009
At 1 July 2008
Net of accumulated depreciation and impairment 6,756 8,818 15,574
Additions 2,885 2,126 5,011
Disposals - (157) (157)
Depreciation charge for the year (185) (2,114) (2,299)
Foreign exchange - 1 1
At 30 June 2009 Net of accumulated depreciation and impairment 9,456 8,674 18,130
At 1 July 2008
Cost 7,921 27,083 35,004
Accumulated depreciation and impairment (1,165) (18,265) (19,430)
Net carrying amount 6,756 8,818 15,574
At 30 June 2009
Cost 10,806 29,053 39,859
Accumulated depreciation and impairment (1,350) (20,379) (21,729)
Net carrying amount 9,456 8,674 18,130
For
per
sona
l use
onl
y

KRESTA HOLDINGS LIMITED—ANNUAL REPORT
Notes to the Financial Statements continued FOR THE YEAR ENDED 30 JUNE 2010
42
11. PROPERTY, PLANT AND EQUIPMENT continued
The carrying value of plant and equipment held under finance leases and hire purchase contracts at 30 June 2010 is $698,957 (2009: $917,026). There were no additions during the year (2009: $344,624) of plant and equipment held under finance leases and hire purchase contracts. Leased assets and assets under hire purchase contracts are pledged as security for the related finance lease and hire purchase liabilities. Land and buildings with a carrying amount of $9,257,000 (2009: $9,456,000) are subject to a first charge over available finance facilities (see Note 15). Plant and equipment with a carrying amount of $7,096,000 (2009: $7,757,000) is pledged as securities for current and non-current liabilities as disclosed in Note 15. Market Appraisal and Valuation of freehold land and freehold buildings The Group engages Burgess Rawson (WA) Pty Ltd, an independent Licensed Valuer to determine the fair value of its freehold land and buildings. Fair value is the amount for which the assets could be exchanged between a knowledgeable willing buyer and a knowledgeable seller in an arm‟s length transaction as at the valuation date. Fair value is determined by direct reference to recent market transactions on arm‟s length terms for land and buildings comparable in size and location to those held by the Group, and to market based yields for comparable properties. The market appraisal and valuation was conducted in February 2010 and the result is as follows: Book value of land and buildings $9.25 million Burgess Rawson valuation $18.25 million Difference $9 million
There is no change in accounting policy and the fair value has not been reflected in the accounts.
12. INTANGIBLE ASSETS AND GOODWILL IT Software
Trade Mark Goodwill Total
$'000 $‟000 $'000 $‟000
Year ended 30 June 2010
At 1 July 2009
net of accumulated amortisation and impairment 19
- 1,420 1,439
Acquisition of investment (note 23) - 1,089 - 1,089
Additions 196 - - 196
Amortisation (44) - - (44)
At 30 June 2010 net of accumulated amortisation and impairment 171
1,089 1,420 2,680
At 1 July 2009
Cost (gross carrying amount) 227 - 1,420 1,647
Accumulated amortisation and impairment (208) - - (208)
Net carrying amount 19 - 1,420 1,439
At 30 June 2010
Cost (gross carrying amount) 423 1,089 1,420 2,932
Accumulated amortisation and impairment (252) - - (252)
Net carrying amount 171 1,089 1,420 2,680
For
per
sona
l use
onl
y
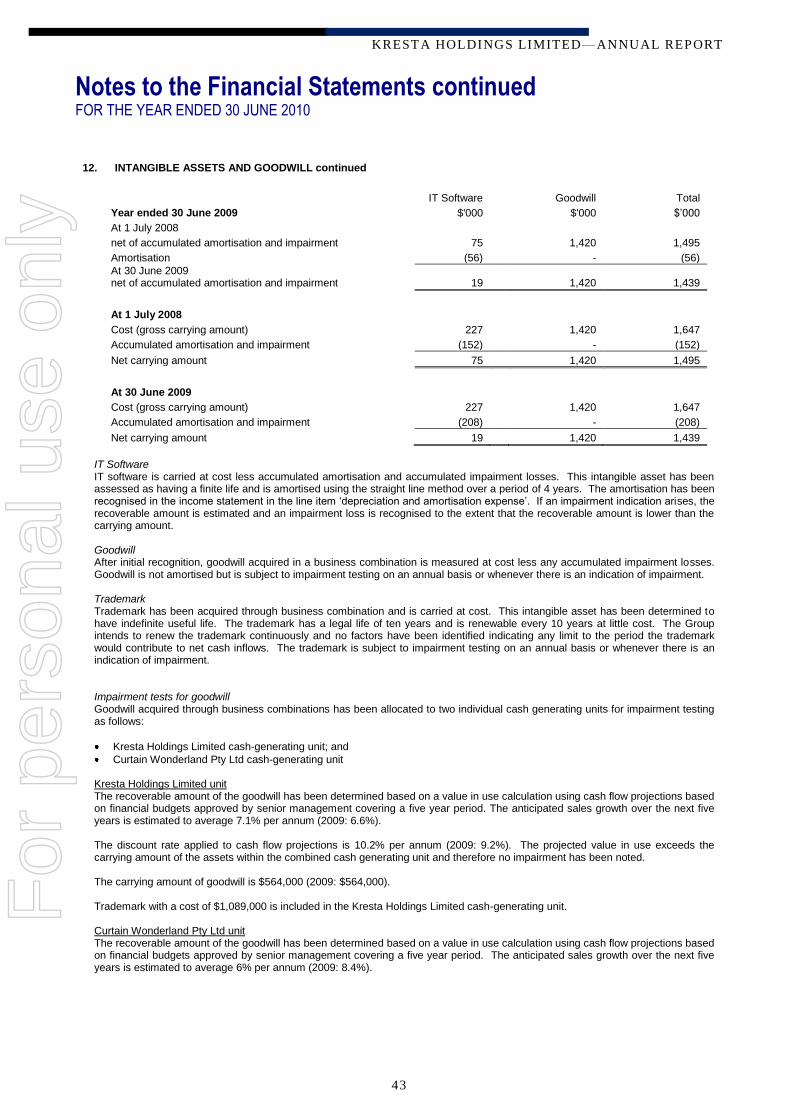
KRESTA HOLDINGS LIMITED—ANNUAL REPORT
Notes to the Financial Statements continued FOR THE YEAR ENDED 30 JUNE 2010
43
12. INTANGIBLE ASSETS AND GOODWILL continued
IT Software Goodwill Total
Year ended 30 June 2009 $'000 $'000 $‟000
At 1 July 2008
net of accumulated amortisation and impairment 75 1,420 1,495
Amortisation (56) - (56)
At 30 June 2009 net of accumulated amortisation and impairment 19
1,420 1,439
At 1 July 2008
Cost (gross carrying amount) 227 1,420 1,647
Accumulated amortisation and impairment (152) - (152)
Net carrying amount 75 1,420 1,495
At 30 June 2009
Cost (gross carrying amount) 227 1,420 1,647
Accumulated amortisation and impairment (208) - (208)
Net carrying amount 19 1,420 1,439
IT Software IT software is carried at cost less accumulated amortisation and accumulated impairment losses. This intangible asset has been assessed as having a finite life and is amortised using the straight line method over a period of 4 years. The amortisation has been recognised in the income statement in the line item „depreciation and amortisation expense‟. If an impairment indication arises, the recoverable amount is estimated and an impairment loss is recognised to the extent that the recoverable amount is lower than the carrying amount. Goodwill After initial recognition, goodwill acquired in a business combination is measured at cost less any accumulated impairment losses. Goodwill is not amortised but is subject to impairment testing on an annual basis or whenever there is an indication of impairment. Trademark Trademark has been acquired through business combination and is carried at cost. This intangible asset has been determined to have indefinite useful life. The trademark has a legal life of ten years and is renewable every 10 years at little cost. The Group intends to renew the trademark continuously and no factors have been identified indicating any limit to the period the trademark would contribute to net cash inflows. The trademark is subject to impairment testing on an annual basis or whenever there is an indication of impairment.
Impairment tests for goodwill Goodwill acquired through business combinations has been allocated to two individual cash generating units for impairment testing as follows:
Kresta Holdings Limited cash-generating unit; and
Curtain Wonderland Pty Ltd cash-generating unit
Kresta Holdings Limited unit The recoverable amount of the goodwill has been determined based on a value in use calculation using cash flow projections based on financial budgets approved by senior management covering a five year period. The anticipated sales growth over the next five years is estimated to average 7.1% per annum (2009: 6.6%).
The discount rate applied to cash flow projections is 10.2% per annum (2009: 9.2%). The projected value in use exceeds the carrying amount of the assets within the combined cash generating unit and therefore no impairment has been noted. The carrying amount of goodwill is $564,000 (2009: $564,000). Trademark with a cost of $1,089,000 is included in the Kresta Holdings Limited cash-generating unit.
Curtain Wonderland Pty Ltd unit The recoverable amount of the goodwill has been determined based on a value in use calculation using cash flow projections based on financial budgets approved by senior management covering a five year period. The anticipated sales growth over the next five years is estimated to average 6% per annum (2009: 8.4%).
For
per
sona
l use
onl
y
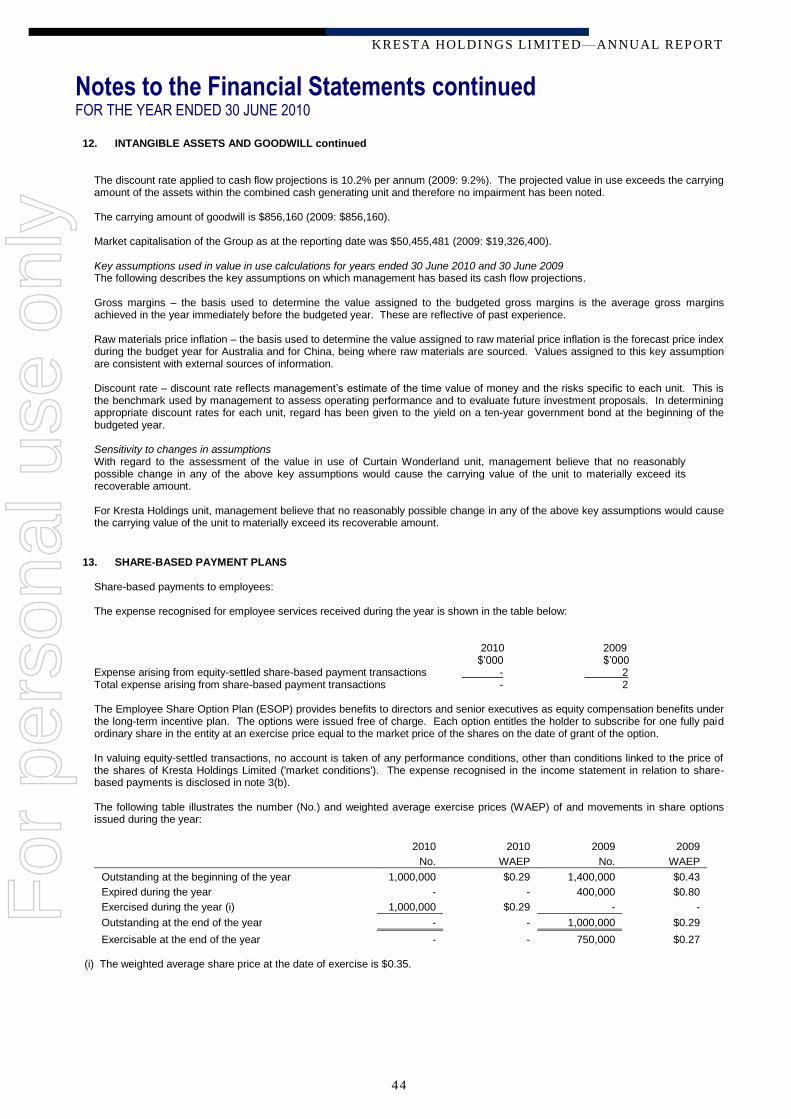
KRESTA HOLDINGS LIMITED—ANNUAL REPORT
Notes to the Financial Statements continued FOR THE YEAR ENDED 30 JUNE 2010
44
12. INTANGIBLE ASSETS AND GOODWILL continued The discount rate applied to cash flow projections is 10.2% per annum (2009: 9.2%). The projected value in use exceeds the carrying amount of the assets within the combined cash generating unit and therefore no impairment has been noted. The carrying amount of goodwill is $856,160 (2009: $856,160). Market capitalisation of the Group as at the reporting date was $50,455,481 (2009: $19,326,400). Key assumptions used in value in use calculations for years ended 30 June 2010 and 30 June 2009 The following describes the key assumptions on which management has based its cash flow projections. Gross margins – the basis used to determine the value assigned to the budgeted gross margins is the average gross margins achieved in the year immediately before the budgeted year. These are reflective of past experience. Raw materials price inflation – the basis used to determine the value assigned to raw material price inflation is the forecast price index during the budget year for Australia and for China, being where raw materials are sourced. Values assigned to this key assumption are consistent with external sources of information. Discount rate – discount rate reflects management‟s estimate of the time value of money and the risks specific to each unit. This is the benchmark used by management to assess operating performance and to evaluate future investment proposals. In determining appropriate discount rates for each unit, regard has been given to the yield on a ten-year government bond at the beginning of the budgeted year.
Sensitivity to changes in assumptions With regard to the assessment of the value in use of Curtain Wonderland unit, management believe that no reasonably possible change in any of the above key assumptions would cause the carrying value of the unit to materially exceed its recoverable amount. For Kresta Holdings unit, management believe that no reasonably possible change in any of the above key assumptions would cause the carrying value of the unit to materially exceed its recoverable amount.
13. SHARE-BASED PAYMENT PLANS
Share-based payments to employees: The expense recognised for employee services received during the year is shown in the table below:
2010 2009 $‟000 $‟000 Expense arising from equity-settled share-based payment transactions - 2 Total expense arising from share-based payment transactions - 2 The Employee Share Option Plan (ESOP) provides benefits to directors and senior executives as equity compensation benefits under the long-term incentive plan. The options were issued free of charge. Each option entitles the holder to subscribe for one fully paid ordinary share in the entity at an exercise price equal to the market price of the shares on the date of grant of the option. In valuing equity-settled transactions, no account is taken of any performance conditions, other than conditions linked to the price of the shares of Kresta Holdings Limited ('market conditions'). The expense recognised in the income statement in relation to share-based payments is disclosed in note 3(b).
The following table illustrates the number (No.) and weighted average exercise prices (WAEP) of and movements in share options issued during the year:
2010 2010 2009 2009
No. WAEP No. WAEP
Outstanding at the beginning of the year 1,000,000 $0.29 1,400,000 $0.43
Expired during the year - - 400,000 $0.80
Exercised during the year (i) 1,000,000 $0.29 - -
Outstanding at the end of the year - - 1,000,000 $0.29
Exercisable at the end of the year - - 750,000 $0.27 (i) The weighted average share price at the date of exercise is $0.35.
For
per
sona
l use
onl
y

KRESTA HOLDINGS LIMITED—ANNUAL REPORT
Notes to the Financial Statements continued FOR THE YEAR ENDED 30 JUNE 2010
45
14. TRADE AND OTHER PAYABLES (CURRENT) 2010 2009 $'000 $'000
Trade payables (i) 2,542 4,216
Other payables (ii) 4,180 4,852
Goods and services tax 886 939
7,608 10,007
(i) Trade payables are non-interest bearing and are normally settled on 30-day terms.
(ii) Other payables are non-trade payables, are non-interest bearing and are normally settled on 30-day terms.
(iii) Fair value Due to the short term nature of these payables, their carrying value is assumed to approximate their fair value.
(iv) Interest rate, foreign exchange and liquidity risk Information regarding interest rate, foreign exchange and liquidity risk exposure is set out in note 19.
CONSOLIDATED
15. INTEREST-BEARING LOANS AND BORROWINGS 2010 2009 $'000 $'000
Current
Obligations under finance leases and hire purchase contracts (note 20) 152 334
Bank overdraft - 1,801
Other loans:
- finance loan 49 48
- business bill facility 10,014 1,435
10,215 3,618
Non-current
Obligations under finance leases and hire purchase contracts (note 20) 268 421
Other loans:
- business bill facility - 1,350
- business bill facility - 2,136
- business bill facility - 4,000
- business bill facility - 2,527
268 10,434
Fair value disclosures Details of the fair value of the Group's interest bearing liabilities are set out in note 19. Finance Leases
Finance leases have an average lease term of 4 years with the option to purchase the asset at the completion of the lease term for the asset's market value. The average discount rate implicit in the leases is 7.00% per annum (2009: 4.51% per annum). Lease liabilities are secured by a charge over the leased assets.
Hire Purchase
Hire purchase leases have an average lease term of 3 years. The average discount rate implicit in the leases is 7.16% per annum (2009: 7.41% per annum). Hire purchase liabilities are secured by a charge over the assets under hire purchase.
Bank Overdraft
The consolidated entity has a multi-option facility of $2 million available from Commonwealth Bank of Australia Limited. Commonwealth Bank of Australia Limited has a fixed and floating charge over the assets of Kresta Holdings Limited and its related entities.
For
per
sona
l use
onl
y

KRESTA HOLDINGS LIMITED—ANNUAL REPORT
Notes to the Financial Statements continued FOR THE YEAR ENDED 30 JUNE 2010
46
15. INTEREST-BEARING LOANS AND BORROWINGS continued
Business Bill Facility The business bill facility is made up of 4 separate bills. Due to a debt covenant breach as a result of the write-down of inventory, the facilities have been classified as current liabilities. Notwithstanding this classification, the Directors consider that the breach will be rectified and the original repayment terms reinstated. In the absence of a debt covenant breach: The first facility is repayable quarterly with final instalments due in September 2014. The second bill is repayable quarterly with final instalments due in July 2012. The third bill is interest only until June 2012. The fourth bill is repayable quarterly with final instalments due in March 2011. Interest for these bills is recognised at an average rate of 7.21% per annum (2009: 7.30% per annum). The bills are secured by first mortgage over the freehold land and buildings of the Group.
2010 2009 $'000 $'000
Financing facilities available
At reporting date, the following financing facilities had been negotiated and were available.
Total facilities
- bank overdraft net of guarantee 3,376 4,258
- hire purchase & finance lease 420 755
- business bill facility 10,014 11,448
13,810 16,461
Facilities used at reporting date:
- bank overdraft net of guarantee - 1,801
- hire purchases & finance lease 420 755
- business bill facility 10,014 11,448
10,434 14,004
Facilities unused at reporting date:
- bank overdraft 3,376 2,457
- business bill facility - -
3,376 2,457
Total facilities 13,810 16,461
Facilities used at reporting date 10,434 14,004
Facilities unused at reporting date 3,376 2,457
For
per
sona
l use
onl
y

KRESTA HOLDINGS LIMITED—ANNUAL REPORT
Notes to the Financial Statements continued FOR THE YEAR ENDED 30 JUNE 2010
47
15. INTEREST-BEARING LOANS AND BORROWINGS continued Notes
2010 2009 Assets pledged as security $‟000 $‟000
The carrying amount of assets pledged as security for current and non-current interest liabilities are:
Current
Floating charge
Cash and cash equivalents 7 7,861 7,511
Receivables 8 3,612 3,462
Inventories 9 18,271 21,168
Total current assets pledged as security 29,744 32,141
Non-current
First mortgage
Freehold land and buildings 11 9,257 9,456
Hire purchase & finance lease
Property, plant and equipment 11 699 917
Floating Charge
Property, plant and equipment 11 7,096 7,757
Total non-current assets pledged as security 17,052 18,130
Total assets pledged as security 46,796 50,271
16. PROVISIONS Employee benefits Make good Total $'000 $'000 $'000
CONSOLIDATED
At 1 July 2009 4,560 163 4,723
Arising during the year 1,577 - 1,577
Utilised (972) (5) (977)
At 30 June 2010 5,165 158 5,323
Current 2010 4,645 - 4,645
Non-current 2010 520 158 678
5,165 158 5,323
Current 2009 4,120 - 4,120
Non-current 2009 440 163 603
4,560 163 4,723
Make good provision
Curtain Wonderland Pty Ltd is required to restore the leased premises of its retail stores to their original condition at the end of the respective lease terms. A provision has been recognised for the present value of the estimated expenditure required to remove any leasehold improvements. These costs have been capitalised as part of the cost of leasehold improvements and are amortised over the shorter of the term of the lease or the useful life of the assets.
For
per
sona
l use
onl
y

KRESTA HOLDINGS LIMITED—ANNUAL REPORT
Notes to the Financial Statements continued FOR THE YEAR ENDED 30 JUNE 2010
48
17. CONTRIBUTED EQUITY AND RESERVES 2010 2009 $'000 $'000
(a) Ordinary shares fully paid 11,961 11,676
Ordinary shares have the right to receive dividends as declared and, in the event of winding up the company, to participate in the proceeds from the sale of all surplus assets in proportion to the number of and amounts paid up on shares held. Ordinary shares entitle their holder to one vote, either in person or by proxy, at a meeting of the Company.
Movement in ordinary shares on issue 2010 2009
No. of shares $‟000 No. of shares $‟000
Balance as at 1 July 143,158,518 11,676 133,158,518 10,679
Income tax on item taken directly to equity - - - 1
Shares issued during the year - - 10,000,000 1,000
Transaction costs – share issued - - - (4)
Exercise of options (i) 1,000,000 285 - -
Balance as at 30 June 144,158,518 11,961 143,158,518 11,676
(i) 1,000,000 options were issued in 2005 per the share based payment option scheme. See note 13.
Share Options
The Company has share based payment option schemes under which options to subscribe for the Company's shares have been granted to certain executives and other employees (refer note 13). These options carry no rights to dividends and no voting rights.
Capital Management
The Group‟s objective when managing capital is to safeguard the ability to continue as a going concern as well as to maintain optimal returns to shareholders and benefits for other stakeholders. Management also aims to maintain a capital structure that ensures the lowest cost of capital available to the entity. The Group is not subject to any externally imposed capital requirements.
The Group regularly reviews the capital structure and seeks to take advantage of available opportunities to improve outcomes for the Group and its shareholders.
The Group monitors capital on the basis of the gearing ratio. This ratio is calculated as net debt divided by total capital. Net debt is calculated as total interest-bearing loans and borrowings less cash and cash equivalents. Total capital is calculated as total equity as shown in the balance sheet plus net debt.
Management has no current plans to issue further shares on the market. The gearing ratio at 30 June 2010 and 2009 was as follows:
2010 2009
$'000 $'000
Total borrowings * 10,483 14,052
Less cash and cash equivalents (7,861) (7,511)
Net debt 2,622 6,541
Total equity 22,744 24,134
Total capital 25,366 30,675
Gearing Ratio 10% 21% * Includes interest bearing loans and borrowings.
For
per
sona
l use
onl
y

KRESTA HOLDINGS LIMITED—ANNUAL REPORT
Notes to the Financial Statements continued FOR THE YEAR ENDED 30 JUNE 2010
49
17. CONTRIBUTED EQUITY AND RESERVES continued
2010 2009 $'000 $'000
(b) Retained Earnings
Movements in retained earnings:
Balance as at 1 July 12,678 10,351
Net profit/(loss) for the year 2,697 3,658
Dividends (4,295) (1,331)
Balance at 30 June 11,080 12,678
Share-based
payment
Foreign currency
translation Total
$'000 $'000 $'000
(c) Reserves At 1 July 2009 48 (268) (220)
Foreign currency translation differences - (77) (77)
Share based payment - - -
Balance at 30 June 2010 48 (345) (297)
Nature and purpose of reserves Share based payment reserve
This reserve is used to record the value of equity benefits provided to suppliers, employees and directors as part of their remuneration. Refer to note 13 for further details of these plans.
Foreign currency translation reserve
The foreign currency translation reserve is used to record exchange differences arising from the translation of the financial statements of foreign subsidiaries.
18. GOVERNMENT GRANTS
2010 2009 $'000 $'000
At 1 July 2009 257 171
Received during the year 475 457
Recognised as income (524) (371)
At 30 June 2010 208 257
Current 49 53
Non-current 159 204
Total government grants deferred 208 257
The accounting policies adopted and the description of government grants received by the Group, including the conditions attached to the grants, have been disclosed in note 2 (h).
For
per
sona
l use
onl
y

KRESTA HOLDINGS LIMITED—ANNUAL REPORT
Notes to the Financial Statements continued FOR THE YEAR ENDED 30 JUNE 2010
50
19. FINANCIAL RISK MANAGEMENT OBJECTIVES AND POLICIES
The Group‟s principal financial instruments, other than derivatives, comprise of bank loans and overdrafts, finance leases and hire purchase contracts, and cash and short term deposits. The main purpose of these financial instruments is to ensure liquidity for the Group‟s operations. The Group has various other financial assets and liabilities such as trade receivables and trade payables, which arise directly from its operations. The Group also enters into derivatives transactions in the form of forward currency and interest rate swap contracts. The purpose is to manage the currency and interest rate risks arising from the Group‟s operations and its sources of finance. The main risks arising from the Group‟s financial instruments are interest rate risk, foreign currency risk, credit risk and liquidity risk. Senior management, in conjunction with the Board, reviews and agrees policies for managing each of these risks and they are summarised below.
Risk Exposures and Responses Interest rate risk The Group‟s exposure to the risk of changes in market interest rates relates primarily to the Group‟s long term debt obligations with a floating interest rate. At balance date, the Group had the following mix of financial assets and liabilities exposed to Australian variable interest rate risk:
2010 2009
$'000 $'000
Financial Assets Cash and cash equivalents 7,861 7,511
7,861 7,511
Financial Liabilities Bank overdraft - (1,801) Business bill facility (2,136) (3,085)
(2,136) (4,886)
Net exposure 5,725 2,625
The Group‟s policy is to manage its finance costs using a mix of fixed and variable rate debt and to maintain at least 65% of its borrowings at fixed rates of interest. The Group may enter into interest rate swaps to manage the ratio of fixed rate debt to floating rate debt. As at 30 June 2010, approximately 79% of the Group‟s borrowings are at a fixed rate of interest (2009: 73%). The business bill facility is made up of 4 separate bills. The first bill $4,000,000 (2009: $4,000,000) is interest only until June 2012 (fixed rate @ 8.1%). The second bill $1,350,000 (2009: $1,650,000) is repayable quarterly with final instalments due in September 2014 (fixed rate @ 5.99%). The third bill $2,135,807 (2009: $3,085,000) is repayable quarterly with final instalments due in July 2012 (variable rate). The fourth bill $2,527,354 (2009: $2,713,000) is repayable quarterly with final instalments due in March 2011 (fixed rate @ 8.55%).
Interest on financial instruments classified as floating rate is repriced at intervals of less than one year. Interest on financial instruments classified as fixed rate is fixed until maturity of the instrument. The Group regularly analyses its interest rate exposure. Within this analysis consideration is given to potential renewals of existing positions, alternative financing and the mix of fixed and variable interest rates. Interest rate swap contracts outlined in note 27 with a notional value of $3,625,872 is exposed to fair value movements if interest rates change.
For
per
sona
l use
onl
y

KRESTA HOLDINGS LIMITED—ANNUAL REPORT
Notes to the Financial Statements continued FOR THE YEAR ENDED 30 JUNE 2010
51
19. FINANCIAL RISK MANAGEMENT OBJECTIVES AND POLICIES continued
Risk Exposures and Responses continued
Interest rate risk continued
The following sensitivity analysis is based on the interest rate risk exposures in existence at the balance sheet date:
Post Tax Profit Higher/(Lower)
Judgements of reasonably possible movements: 2010 2009
$'000 $'000
+ 0.5% (50 basis points) 20 10 - 0.5% (50 basis points) (20) (10)
The 0.5% sensitivity is based on reasonably possible changes, over a financial year, using the observed range of actual historical rates and management‟s judgement of future trends. The analysis was performed on the same basis for 2009.
The movements in profit are due to movements in interest costs from variable rate debt and cash balances.
Foreign currency risk
The Group also has transactional currency exposures. Such exposure arises from sales or purchases by an operating unit in currencies other than the unit‟s functional currency.
Less than 5% (2009: 5%) of the Group‟s sales are denominated in currencies other than the functional currency of the operating unit making the sale. Approximately 70% (2009: 62%) of the Group‟s inventory purchases are denominated in currencies other than the functional currency of the operating unit making the purchase.
The Group uses forward currency contracts to manage foreign currency exposures. It is the Group‟s policy not to enter into forward currency contracts until a firm commitment is in place.
At 30 June 2010, the Group had the following exposure to US$ foreign currency that is not designated in cash flow hedges:
2010 2009
$'000 $'000
Financial Assets and Derivatives Forward currency contracts – Notional value 2,113 3,353
2,113 3,353
Financial Liabilities Trade and other payables (451) (154)
(451) (154)
Net exposure 1,662 3,199
For
per
sona
l use
onl
y

KRESTA HOLDINGS LIMITED—ANNUAL REPORT
Notes to the Financial Statements continued FOR THE YEAR ENDED 30 JUNE 2010
52
19. FINANCIAL RISK MANAGEMENT OBJECTIVES AND POLICIES continued Risk Exposures and Responses continued Foreign currency risk continued
The following sensitivity is based on the foreign currency risk exposures in existence at the balance sheet date. As at 30 June 2010, had the Australian Dollar moved, with all other variables held constant, post tax profit and equity would have been affected as illustrated in the table below.
Post Tax Profit Higher/(Lower)
Judgements of reasonably possible movements: 2010 2009
$'000 $'000
AUD/USD + 10% (2009: +10%) (52) (224) AUD/USD – 10% (2009: -5%) 193 112
The sensitivity rates are based on reasonably possible changes, over a financial year, using the observed range of actual historical rates and management‟s judgement of future trends. The analysis was performed on the same basis for 2009.
Management believe the balance date risk exposures are representative of the risk exposure inherent in the financial instruments.
Credit risk
The Group trades only with recognised, credit worthy third parties, and as such collateral is not requested nor is it the Group‟s policy to securitise its trade and other receivables.
It is the Group‟s policy that all customers who wish to trade on credit terms are subject to credit verification procedures.
Receivable balances are monitored on an on-going basis with the result that the Group‟s exposure to bad debts is managed.
The maximum exposure to credit risk is represented by the carrying amount, net of any provisions of doubtful debts of financial assets of the Group, which have been recognised on the balance sheet.
With respect to credit risk arising from other financial assets of the Group, which comprise cash and cash equivalents and Certain derivative instruments, the Group‟s exposure to credit risk arises from the default of the counter party, with a maximum exposure equal to the carrying amount of these instruments.
At balance date, there are no significant concentrations of credit risk within the Group.
Liquidity risk
The Group‟s objective is to maintain a balance between continuity of funding and flexibility through the use of bank overdrafts, bill facilities, finance leases and hire purchase contracts.
The risk monitored from the values shown in the table below, reflects a balanced view of cash inflows and outflows. Leasing obligations, trade payables and other financial liabilities mainly originate from the financing of assets used in our ongoing operations such as property, plant, equipment and investments in working capital. These assets are considered in the Group‟s overall liquidity risk.
For
per
sona
l use
onl
y

KRESTA HOLDINGS LIMITED—ANNUAL REPORT
Notes to the Financial Statements continued FOR THE YEAR ENDED 30 JUNE 2010
53
19. FINANCIAL RISK MANAGEMENT OBJECTIVES AND POLICIES continued
Risk Exposures and Responses continued
< 6
months 6-12
months 1-2
years > 2
years Total
Year ended 30 June 2010 $‟000 $‟000 $‟000 $‟000 $‟000 Financial assets Cash and cash equivalents 7,861 - - - 7,861
Trade and other receivables 3,612 - - - 3,612
Derivatives 83 - - * 83
11,556 - - - 11,556
Financial liabilities
Trade and other payables 7,608 - - - 7,608
Business bill facility (i) 11,053 - - - 11,053
Hire purchase and finance lease liability 87 87 252 30 456
Derivatives 42 - - - 42
Other loans 49 - - - 49
18,839 87 252 30 19,208
Net maturity (7,283) (87) (252) (30) (7,652)
(i)
Due to a debt covenant breach as a result of the write-down of inventory, the facilities have been classified as current liabilities. Notwithstanding this classification, the Directors consider that the breach will be rectified and the original repayment terms reinstated.
< 6
months 6-12
months 1-2
years > 2
years Total
Year ended 30 June 2009 $‟000 $‟000 $‟000 $‟000 $‟000 Financial assets Cash and cash equivalents 7,511 - - - 7,511
Trade and other receivables 3,462 - - - 3,462
10,973 - - - 10,973
Financial liabilities
Trade and other payables 10,007 - - - 10,007
Bank overdraft 1,801 - - - 1,801
Business bill facility 1,117 1,097 4,363 6,698 13,275
Hire purchase and finance lease liability 194 183 187 269 833
Derivatives 471 - - - 471
Other loans 48 - - - 48
13,638 1,280 4,550 6,967 26,435
Net maturity (2,665) (1,280) (4,550) (6,967) (15,462)
For
per
sona
l use
onl
y

KRESTA HOLDINGS LIMITED—ANNUAL REPORT
Notes to the Financial Statements continued FOR THE YEAR ENDED 30 JUNE 2010
54
19. FINANCIAL RISK MANAGEMENT OBJECTIVES AND POLICIES continued
Risk Exposures and Responses continued
Fair values
The Group uses various methods in estimating the fair value of a financial instrument. The methods comprise:
Level 1 – the fair value is calculated using quoted prices in active markets;
Level 2 – the fair value is estimated using inputs other than quoted prices included in Level 1 that are observable for the asset or liability; and
Level 3 – the fair value is estimated using inputs for the asset or liability that are not based on observable market data. The fair values of financial instruments and the methods used to estimate their fair values are as follows:
2010
2009
Quote
Market Price (Level 1)
Valuation technique – market observable inputs (Level 2)
Valuation technique – non market observable inputs (Level 3)
Total Quoted market price (Level 1)
Valuation technique – market observable inputs (Level 2)
Valuation technique – non market observable inputs (Level 3)
Total
$‟000 $‟000 $‟000 $‟000 $‟000 $‟000 $‟000 $‟000
Financial assets
Derivative instruments
- Foreign exchange contracts - 83 - 83 - - - -
Financial liabilities
Derivative instruments
- Foreign exchange contracts - - - - - 471 - 471
- Interest rate swaps - 42 - 42 - - - -
For financial instruments not quoted in active markets, the Group uses valuation techniques such as present value techniques, comparison to similar instruments for which market observable prices exist and other relevant models used by market participants. These valuation techniques use both observable ad unobservable market inputs. Financial instruments that use valuation techniques with only observable market inputs, that are not significant to the overall valuation, include forward currency and interest rate swap contracts. Fair values of other financial assets and liabilities approximate their carrying values.
Transfer between categories
There were no transfers between Level 1 and Level 2 during the year.
For
per
sona
l use
onl
y

KRESTA HOLDINGS LIMITED—ANNUAL REPORT
Notes to the Financial Statements continued FOR THE YEAR ENDED 30 JUNE 2010
55
20. COMMITMENTS
Operating lease commitments
The Group has entered into commercial leases on buildings. These leases have an average life of between 3-7 years. There are no restrictions placed upon the lessee by entering into these leases. Approximately 89 properties are being leased throughout Australia and New Zealand.
Future minimum rentals payable under non-cancellable operating leases as at 30 June are as follows:
2010 2009 $'000 $'000
Within one year 6,671 6,313
After one year but not more than five years 14,354 12,567
More than five years 754 1,253
Total minimum lease payments 21,779 20,133
Finance lease and hire purchase commitments
The Group has finance leases and hire purchase contracts for various items of plant and machinery, motor vehicles and IT hardware and software as disclosed in note 11. These leases have terms of renewal. Renewals are at the option of the specific entity that holds the lease.
Future minimum lease payments under finance leases and hire purchase contracts together with the present value of the net minimum lease payments are as follows:
2010 2009
Minimum lease
payments Minimum lease
payments
$‟000 $‟000
Within one year 174 377
After one year but not more than five years 282 456
Total minimum lease payments 456 833
Less amounts representing finance charges (36) (78)
Present value of minimum lease payments 420 755
The weighted average interest rate impact in the leases for the Group is 7.16% per annum (2009: 7.13%)
For
per
sona
l use
onl
y

KRESTA HOLDINGS LIMITED—ANNUAL REPORT
Notes to the Financial Statements continued FOR THE YEAR ENDED 30 JUNE 2010
56
20. COMMITMENTS continued
Remuneration commitments
2010 2009 $'000 $'000
Commitments for the payment of salaries and other remuneration under long-term employment contracts in existence at the reporting date but not recognised as liabilities payable.
Within one year 1,206 932
1,206 932
Amounts disclosed as remuneration commitments include commitments arising from the service contracts of executives referred to in note 22 that are not recognised as liabilities and are not included in the executives‟ remuneration.
Capital commitments
The Company has committed to purchase software called “Solatech” tailored especially for the window covering business. The total estimated project cost including both hardware and software is $1,498,000. As at 30 June 2010, $491,000 has been spent on the project. The project is expected to complete in December 2010.
21. RELATED PARTY DISCLOSURES Ultimate Parent Kresta Holdings Limited is the ultimate parent company. Subsidiaries
The financial statements include the financial statements of Kresta Holdings Limited and the subsidiaries listed in the following table:
COUNTRY OF % EQUITY INTEREST INVESTMENT ($‟000) NAME INCORPORATION 2010 2009 2010 2009
Finmar Pty Ltd Australia 100% 100% 1,752 1,752
Kresta Blinds (Holdings) Pty Ltd Australia 100% 100% 20,154 20,154
Kresta Blinds Ltd Australia 100% 100% - -
Kresta Blinds International Pty Ltd Australia 100% 100% - -
Kedena Holdings Pty Ltd Australia 100% 100% - -
Sharatan Pty Ltd Australia 100% 100% - -
Blind Wholesalers, Distributors and Manufacturers Pty Ltd Australia 100% 100% - -
Mardo Australia Pty Ltd Australia 100% 100% 2,405 2,405
Twighlight Sun Pty Ltd Australia 100% 100% - -
Mardo International Pty Ltd Australia 100% 100% - -
Sandelle Pty Ltd Australia 100% 100% 393 393
24,704 24,704
Curtain Wonderland Pty Ltd (control is via Sandelle Pty Ltd) Australia 100% 100% 1,290 1,290
25,994 25,994
There were no transactions with other related parties.
For
per
sona
l use
onl
y

KRESTA HOLDINGS LIMITED—ANNUAL REPORT
Notes to the Financial Statements continued FOR THE YEAR ENDED 30 JUNE 2010
57
21. RELATED PARTY DISCLOSURES continued (a) Entities subject to class order relief
Pursuant to Class Order 98/1418, relief has been granted to these controlled entities of Kresta Holdings Limited from the Corporations Act requirements for preparation, audit and lodgement of their financial reports.
As a condition of the Class Order, the above companies (the Closed Group) entered into a Deed of Cross Guarantee on 22 February 2010. The effect of the Deed is that Kresta Holdings Limited has guaranteed to pay any deficiency in the event of winding up of either controlled entity or if they do not meet their obligations under the terms of the overdrafts, loans, leases or other liabilities subject to the Guarantee. The controlled entities have also given a similar guarantee in the event that Kresta Holdings Limited is wound up or it does not meet its obligations under the terms of overdrafts, loans, leases or other liabilities subject to the Guarantee.
The statement of financial position and income statement for the closed group is not materially different to the Group‟s statement of financial position and income statement.
22 KEY MANAGEMENT PERSONNEL
(a) Compensation of Key Management Personnel 2010 2009 $ $
Short-term employee benefits 1,388,968 1,286,691 Post-employment benefits 107,407 96,368 Share-based payment - 2,488
1,496,375 1,385,547
(b) Option holdings of key management personnel and directors
Balance at Net Balance at Vested at 30 June 2010 Beginning Granted as Options Change End of Not 30 June
2010 Of Period Remuneration exercised Other Period Total Exercisable Exercisable
1 July 2009
30 June
2010
Executives T Tan 1,000,000 - 1,000,000 - - 1,000,000 - 1,000,000
Total 1,000,000 - 1,000,000 - - 1,000,000 - 1,000,000
For
per
sona
l use
onl
y
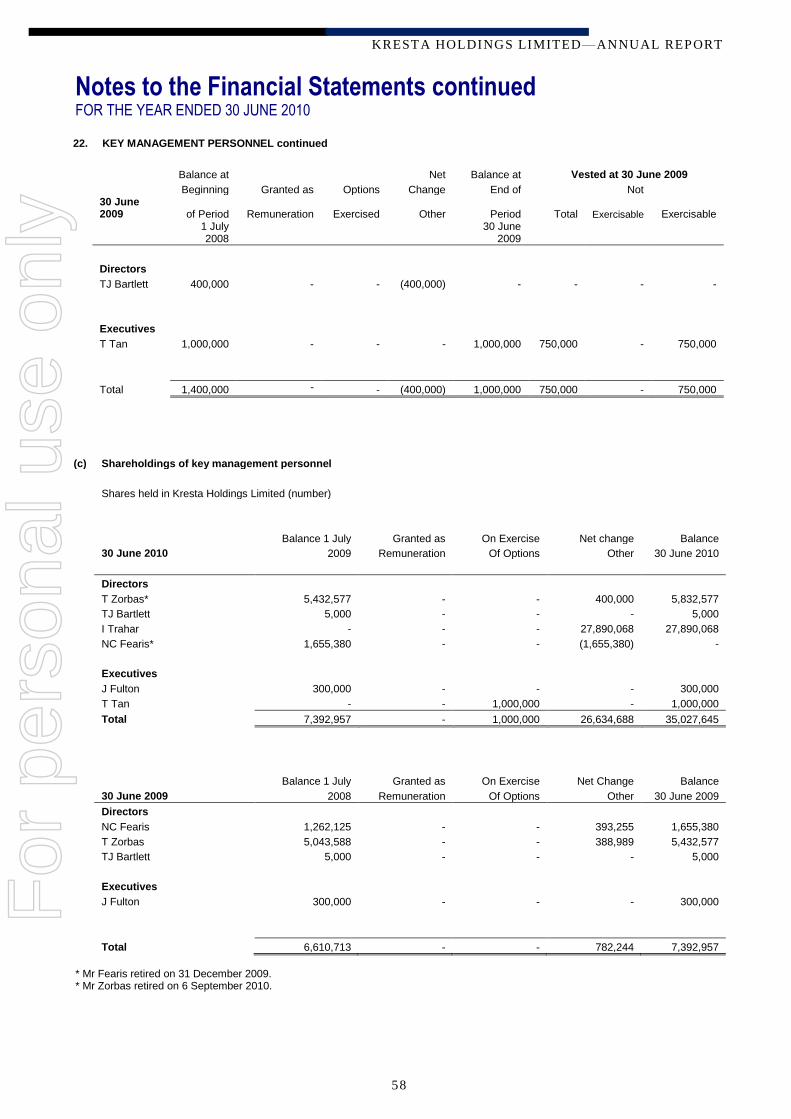
KRESTA HOLDINGS LIMITED—ANNUAL REPORT
Notes to the Financial Statements continued FOR THE YEAR ENDED 30 JUNE 2010
58
22. KEY MANAGEMENT PERSONNEL continued
(c) Shareholdings of key management personnel
Shares held in Kresta Holdings Limited (number) Balance 1 July Granted as On Exercise Net change Balance 30 June 2010 2009 Remuneration Of Options Other 30 June 2010
Directors T Zorbas* 5,432,577 - - 400,000 5,832,577 TJ Bartlett 5,000 - - - 5,000 I Trahar - - - 27,890,068 27,890,068 NC Fearis* 1,655,380 - - (1,655,380) - Executives J Fulton 300,000 - - - 300,000 T Tan - - 1,000,000 - 1,000,000
Total 7,392,957 - 1,000,000 26,634,688 35,027,645
Balance 1 July Granted as On Exercise Net Change Balance 30 June 2009 2008 Remuneration Of Options Other 30 June 2009
Directors NC Fearis 1,262,125 - - 393,255 1,655,380 T Zorbas 5,043,588 - - 388,989 5,432,577 TJ Bartlett 5,000 - - - 5,000 Executives J Fulton 300,000 - - - 300,000
Total 6,610,713 - - 782,244 7,392,957
* Mr Fearis retired on 31 December 2009. * Mr Zorbas retired on 6 September 2010.
Balance at Net Balance at Vested at 30 June 2009
Beginning Granted as Options Change End of Not 30 June 2009 of Period Remuneration Exercised Other Period Total Exercisable Exercisable
1 July 2008
30 June 2009
Directors
TJ Bartlett 400,000 - - (400,000) - - - -
Executives
T Tan 1,000,000 - - - 1,000,000 750,000 - 750,000
Total 1,400,000 - - (400,000) 1,000,000 750,000 - 750,000
For
per
sona
l use
onl
y

KRESTA HOLDINGS LIMITED—ANNUAL REPORT
Notes to the Financial Statements continued FOR THE YEAR ENDED 30 JUNE 2010
59
23. BUSINESS COMBINATION
On 4 January 2010, Kresta Group acquired the Ace of Shades business based in Victoria. The business specializes in external blinds and awnings and has been a well regarded and profitable supplier in Melbourne for the past 17 years.
The total consideration transferred was $1,687,700.
The purchase of the Ace of Shades business will provide Kresta with an immediate profitable entry point into the Victorian market for outdoor products and will allow Kresta to expand this service throughout Australia and New Zealand and to complement its existing range of indoor products.
The Group has provisionally recognized the fair values of the identifiable net assets of Ace of Shades business based upon the best
information available as of the reporting date. Provisional business combination accounting is as follows:
Fair value at acquisition date
$‟000
Carrying Value
$‟000
Plant and equipment 167 167
Inventories 301 301
Prepayments 123 123
Accounts receivable 212 212
Trademark 1,089 1,089
1,892 1,892
Customer deposits 137 137
Provisions 68 68
205 205
Fair value of identifiable net assets 1,687
Acquisition-date-fair-value of consideration transferred:
Cash paid 1,687
1,687
Direct costs relating to the acquisition
- legal fees recognised in the income statement 3
The cash outflow on acquisition is as follows:
Cash paid 1,687
Net cash outflow 1,687
The income statement includes sales revenues and net profit for the year ended 30 June 2010 of $1,428,316 and $7,391 respectively, as a result of the acquisition of Ace of Shades business. Had the acquisition of Ace of Shades occurred at the beginning of the reporting period, the income statement would have included sales revenue and profit of $2,900,000 and $100,000 respectively. Included in the business acquired were receivables with a gross contractual and fair value of $212,000 resulting from trade sales with customers. All of these amounts have been collected in full and converted to cash consistent with customer terms in March 2010. The trademark acquired at the business combination relates to the line of products produced by the Ace of Shades business for 17 years. Under the terms of acquisition agreement, the former owner of Ace of Shades agreed to provide consulting services for a term of 12 months from the completion date.
For
per
sona
l use
onl
y

KRESTA HOLDINGS LIMITED—ANNUAL REPORT
Notes to the Financial Statements continued FOR THE YEAR ENDED 30 JUNE 2010
60
24. EVENTS AFTER THE BALANCE SHEET DATE
On 19 August 2010, the directors of Kresta Holdings Limited declared a final dividend on ordinary shares in respect of the 2010 financial year. The total amount of the dividend is $2,162,378 which represents a fully franked dividend of 1.5 cents per share.
25. AUDITOR’S REMUNERATION
2010 2009 $ $
The auditor of Kresta Holdings Limited is Ernst & Young.
Amounts received or due and receivable by Ernst & Young (Australia) for:
an audit or review of the financial report of the entity and any other entity in
the consolidated group 100,000 123,600
other services in relation to the entity and any other entity in the consolidated group
- Special audits required for government grants 5,923 5,408 - Special audits required for sales certificates 1,200 - - Assurance related 77,137 -
184,260 129,008
26. OPERATING SEGMENTS The Group has identified its operating segment based on the management reports that are reviewed and used by the
executive management team (chief operating decisions makers) in assessing performance and in determining the allocation of resources Management has identified a single operating segment, which is manufacture and sales of window coverings. The performance of the operating segment is evaluated based on profit before tax and net finance costs (profit before tax and interest) and is measured in accordance with the Group‟s accounting policies. The Group‟s financing requirements, finance income, finance costs and taxes are managed on a group basis.
Geographical Areas
The Group has revenues from external customers attributed to:
Australia (the Group‟s country of domicile) and
New Zealand
30 June 2010 $‟000
30 June 2009 $‟000
Revenues (Australia) 119,546 113,904 Revenues (New Zealand) 3,084 3,095
122,630 116,999
Non-current assets (Australia) 19,670 19,481 Non-current assets (New Zealand) 62 88
19,732 19,569
For
per
sona
l use
onl
y

KRESTA HOLDINGS LIMITED—ANNUAL REPORT
Notes to the Financial Statements continued FOR THE YEAR ENDED 30 JUNE 2010
61
26. OPERATING SEGMENTS continued
Non current assets include tangible and intangible assets, but exclude financial instruments and deferred tax assets. Revenue is attributed to geographic location based on the location of the customers.
Major customers The Group‟s customers consist of over six thousand individual customers to which it provides products and services. There is no one external customer that generates 10% or more of the Group‟s revenues.
27. DERIVATIVE FINANCIAL INSTRUMENTS
2010 2009 $‟000 $‟000
Current assets
Foreign currency contracts – held for trading 83 -
Current Liabilities
Interest rate swap contracts – held for trading 42 -
Foreign currency contracts - held for trading - 471
42 471
(i) Forward currency contracts – held for trading
The Group has entered into forward exchange contracts which are economic hedges but do not satisfy the requirements for hedge accounting.
Notional Amounts Average Exchange Rate $AUD 2010 2009 $‟000 $‟000 2010 2009
Buy US$/Sell Australian $ Buy US$ Maturity 1- 6 months – consolidated 2,113 3,353 0.87 0.70
These contracts are fair valued by comparing the contracted rate to the market rates for contracts with the same period to
maturity. All movements in fair value are recognised in profit or loss in the period they occur. The net fair value gain on foreign currency derivatives during the year was $83,000 for the Group (2009: net loss $431,000).
For
per
sona
l use
onl
y

KRESTA HOLDINGS LIMITED—ANNUAL REPORT
Notes to the Financial Statements continued FOR THE YEAR ENDED 30 JUNE 2010
62
27. DERIVATIVE FINANCIAL INSTRUMENTS continued (ii) Interest rate swaps – held for trading
The Group has entered into interest rate swap contracts which are economic hedges but do not satisfy the requirements for hedge accounting. Two interest bearing loans of the Group currently have a fixed rate of 8.55% and 5.99% respectively, which will revert to variable rate in 2010 and 2011 respectively. In order to protect against rising interest rates the Group has entered into interest swap contracts under which it has fixed the interest rate of these two interest bearing loans at 5.55% and 5.71% respectively with an extended term of three years.
At 30 June 2010, the notional principal amounts and period of expiry of the interest rate swap contracts are as follows:
$AUD
2010 2009
$‟000 $‟000
1-2 years 1,200 -
2-3 years 2,425 -
3,625 -
These contracts are fair valued by comparing the contracted fixed rate to the variable rates as at 30 June. All movements in fair value are recognised in profit or loss in the period they occur. The net fair value loss on interest rate swap derivatives during the year was $42,332 for the Group.
For
per
sona
l use
onl
y

KRESTA HOLDINGS LIMITED—ANNUAL REPORT
Director’s Declaration
63
In accordance with a resolution of the directors of Kresta Holdings Limited, I state that:
In the opinion of the directors:
(a) the financial statements and notes of the consolidated entity are in accordance with the Corporations Act 2001, including:
giving a true and fair view of the consolidated entity‟s financial position as at 30 June 2010 and of its performance for the year ended on that date; and
complying with Australian Accounting Standards (including the Australian Accounting Interpretations) and the Corporations Regulations 2001;
(b) the financial statements and notes also comply with International Financial Reporting Standards as disclosed in note 2 (b);
(c) there are reasonable grounds to believe that the consolidated entity will be able to pay its debts as and when they become due and payable;
(d) this declaration has been made after receiving the declarations required to be made to the directors in accordance with section 295A of the Corporations Act 2001 for the financial year ended 30 June 2010; and
(e) as at the date of this declaration, there are reasonable grounds to believe that the members of the Closed Group identified in note 21 will be able to meet any obligations or liabilities to which they are or may become subject, by virtue of the Deed of Cross Guarantee.
On behalf of the Board
I Trahar
Chairman
30 September 2010
For
per
sona
l use
onl
y

KRESTA HOLDINGS LIMITED—ANNUAL REPORT
Independent Auditor’s Report
64
For
per
sona
l use
onl
y

KRESTA HOLDINGS LIMITED—ANNUAL REPORT
Independent Auditor’s Report
65
For
per
sona
l use
onl
y

KRESTA HOLDINGS LIMITED—ANNUAL REPORT
ASX Additional Information
66
Additional information required by the Australian Securities Exchange and not shown elsewhere in this report is as follows. The information is current as at 22 September 2010.
(a) Distribution of equity securities The number of shareholders, by size of holding, in each class of share are:
Ordinary shares
Number of
holders
Number of shares
1 – 1,000 199 114,516
1,001 – 5,000 427 1,244,129
5,001 – 10,000 299 2,518,632
10,001 – 100,000 561 19,735,465
100,001
and over 116 120,545,776
1,602 144,158,518
The number of shareholders holding less than a marketable parcel of shares are: 243 167,536
(b) Twenty largest shareholders
The names of the twenty largest holders of quoted shares are:
Listed ordinary shares
Number of shares
Percentage of ordinary
shares
1 AVATAR INDUSTRIES PTY LTD 27,859,023 19.33
2 COGENT NOMINEES PTY LIMITED 25,795,442 17.89
3 MR SI CHUAN CHEOU 13,163,107 9.13
4 RBC DEXIA INVESTOR SERVICES AUSTRALIA NOMINEES PTY LTD 8,309,399 5.76
5 MR CHENG CHIA CHEN 2,314,215 1.61
6 MS SHIRLEY ANN FRY MR DONALD ERIC FRY 2,260,000 1.57
7 MRS LIU SHU-JEN CHEN 1,982,600 1.38
8 PENDOMER INVESTMENTS PTY LTD 1,655,380 1.15
9 MS YEN JU CHEN 1,616,292 1.12
10 JASFORCE PTY LTD 1,500,000 1.04
11 LPO INVESTMENTS PTY LTD 1,500,000 1.04
12 MR ERIC ROYDS 1,116,970 .77
13 MR ROBERT KEITH YORSTON 1,075,000 .75
14 MR JOHN WILLIAM FRANCIES MOLLY + MRS SHARON MAREE MOLLY 1,026,000 .71
15 DANEHILL HOLDINGS PTY LTD 1,003,000 .70
16 MR DAVID JOHN LE CORNU + MRS BETTY LORRAINE LE CORNU 1,000,000 .69
17 MRS SHARI MAREE TAN 1,000,000 .69
18 GREENFIELD COMPANY LIMITED 948,324 .66
19 EQUITAS NOMINEES PTY LTD 822,617 .57
20 MR ANDREW MICHAEL HARCOURT 810,000 .56
Total 96,757,369 67.12
For
per
sona
l use
onl
y

KRESTA HOLDINGS LIMITED—ANNUAL REPORT
ASX Additional Information
67
(c) Substantial shareholders
The names of substantial shareholders who have notified the Company in accordance with section 671B of the Corporations Act 2001 are:
Number of shares
Avatar Industries Pty Ltd 27,890,068
Hunter Hall Investment Management Limited 24,129,739
Perpetual Limited 8,844,409
(d) Voting rights
All ordinary shares carry one vote per share without restriction.
For
per
sona
l use
onl
y