Embed Size (px)
Citation preview
3. Using SPSS for t-tests and ANOVA
Karl B Christensenhttp://biostat.ku.dk/~kach/SPSS
Karl B Christensenhttp://biostat.ku.dk/~kach/SPSS 3. Using SPSS for t-tests and ANOVA

Comparing two samples
Two groups: data x11, . . . , x1n1 and x21, . . . , x2n2Theoretical distributions N(µ1, σ
21) and N(µ2, σ
22)
Empirical mean and variance (x1, s21 ) and (x2, s
22 )
Significant difference between x1 and x2?
Are µ1 and µ2 different?
Null hypothesis H0 : µ1 = µ2
Karl B Christensenhttp://biostat.ku.dk/~kach/SPSS 3. Using SPSS for t-tests and ANOVA

Comparing two samples
Theoretical distributions N(µ1, σ21) and N(µ2, σ
22)
Karl B Christensenhttp://biostat.ku.dk/~kach/SPSS 3. Using SPSS for t-tests and ANOVA

Comparing two samples
Empirical mean and variance (x1, s21 ) and (x2, s
22 )
Karl B Christensenhttp://biostat.ku.dk/~kach/SPSS 3. Using SPSS for t-tests and ANOVA

Two-sample t-test
Standard error of mean SEM = s/√n.
Standard error of difference of means
SEDM =√SEM2
1 + SEM22 .
T-test statistic
t =x2 − x1SEDM
measures disagreement between data and H0
If H0 is true, then the distribution of t is symmetric around 0
reject if prob. of observing a more extreme value p < 5%.Karl B Christensenhttp://biostat.ku.dk/~kach/SPSS 3. Using SPSS for t-tests and ANOVA

Equal variances?
Assume σ21 = σ22 before testing µ1 = µ2?
σ21 = σ22 Natural assumption under the H0 (distributions are equal).Nice theory.
σ21 6= σ22 Looks specifically for difference in means. Approximativetheory.
Test for equal variances: Compute test statistic (Note: 2-sided test)
F = s21/s22
F-distribution with (f1, f2) degrees of freedom, where f1 = n1 − 1and f2 = n2 − 1
Karl B Christensenhttp://biostat.ku.dk/~kach/SPSS 3. Using SPSS for t-tests and ANOVA

RCT data
The data set
http://biostat.ku.dk/~kach/SPSS/RCT.sps7bdat
http://biostat.ku.dk/~kach/SPSS/RCT.txt
http://biostat.ku.dk/~kach/SPSS/RCT.xlsx
contains data from an RCT where a physical exercise interventionin cancer patients was evaluated. Consider the variables
ID id number
VO2 Aerobic capacity (VO2max)
group Intervention/control group assignment
time Time (1: baseline data 3: after intervention)
:
:
Karl B Christensenhttp://biostat.ku.dk/~kach/SPSS 3. Using SPSS for t-tests and ANOVA

t-test in SPSS
Karl B Christensenhttp://biostat.ku.dk/~kach/SPSS 3. Using SPSS for t-tests and ANOVA

t-test in SPSS
We want to compare aerobic capacity (VO2max) in the two groupsat follow-up
GET FILE=’P:\small.sav ’.
SELECT IF (time =3).
EXECUTE.
T-TEST GROUPS=group(’A’ ’B’)
/MISSING=ANALYSIS
/VARIABLES=VO2
/CRITERIA=CI (.95).
The output has three parts:
(i) Group Statistics showing the mean, the standard error,and the standard error of the mean. Confidence limits are alsoincluded.
(ii) T-tests showing two t-tests (one that assumes equalvariances and one that doesn’t).
(iii) test for Equality of Variances showing a test of equalvariances.
Karl B Christensenhttp://biostat.ku.dk/~kach/SPSS 3. Using SPSS for t-tests and ANOVA

Output (i)
Group Statistics
group N Mean Std. Deviation Std. Error Mean
Aerobic capacity (VO2) A
B
31 2,37 ,596 ,107
29 1,51 ,432 ,080
Page 1
Karl B Christensenhttp://biostat.ku.dk/~kach/SPSS 3. Using SPSS for t-tests and ANOVA
Output (ii)+(iii)
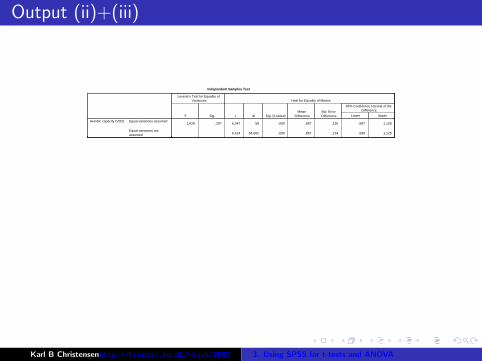
Independent Samples Test
Levene's Test for Equality of Variances t-test for Equality of Means
F Sig. t df Sig. (2-tailed)Mean
DifferenceStd. Error Difference
95% Confidence Interval of the Difference
Lower Upper
Aerobic capacity (VO2) Equal variances assumed
Equal variances not assumed
1,628 ,207 6,347 58 ,000 ,857 ,135 ,587 1,128
6,414 54,682 ,000 ,857 ,134 ,590 1,125
Page 1
Karl B Christensenhttp://biostat.ku.dk/~kach/SPSS 3. Using SPSS for t-tests and ANOVA
Output (ii)+(iii)
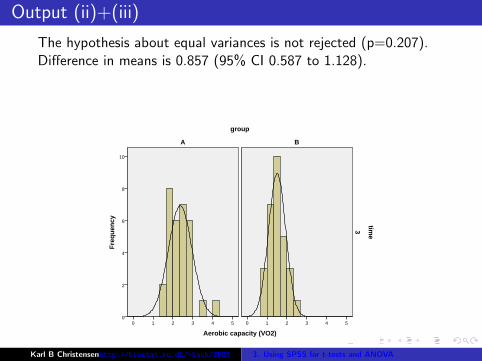
The hypothesis about equal variances is not rejected (p=0.207).Difference in means is 0.857 (95% CI 0.587 to 1.128).
Aerobic capacity (VO2)
543210
Fre
qu
ency
10
8
6
4
2
0543210
group
BA
time
3
Page 1
Karl B Christensenhttp://biostat.ku.dk/~kach/SPSS 3. Using SPSS for t-tests and ANOVA

Exercise: t-test
1 Use graphical methods to evaluate if the distribution ofVO2max is skewed.
2 Compare the log(VO2max)-level at follow-up in the twogroups using a t-test
3 Quantify the difference. Remember confidence intervals
4 Can we interpret this difference on the original scale ?
Karl B Christensenhttp://biostat.ku.dk/~kach/SPSS 3. Using SPSS for t-tests and ANOVA
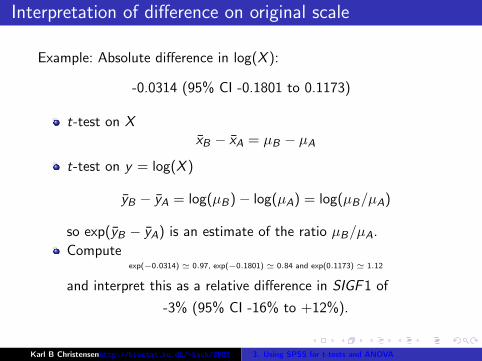
Interpretation of difference on original scale
Example: Absolute difference in log(X ):
-0.0314 (95% CI -0.1801 to 0.1173)
t-test on XxB − xA = µB − µA
t-test on y = log(X )
yB − yA = log(µB)− log(µA) = log(µB/µA)
so exp(yB − yA) is an estimate of the ratio µB/µA.
Computeexp(−0.0314) ' 0.97, exp(−0.1801) ' 0.84 and exp(0.1173) ' 1.12
and interpret this as a relative difference in SIGF1 of
-3% (95% CI -16% to +12%).
Karl B Christensenhttp://biostat.ku.dk/~kach/SPSS 3. Using SPSS for t-tests and ANOVA

Beyond the t-test
The t-test compares two groups based on an assumption ofnormality, but what if data are not normally distributed or ifwe want to compare three or more groups?
The t-test is robust - because means tend to be normallydistributed, sometimes transformation (x 7→
√x or log(x))
can help. Otherwise nonparametric methods.
Compare more than three groups using analysis of variance(ANOVA).
Karl B Christensenhttp://biostat.ku.dk/~kach/SPSS 3. Using SPSS for t-tests and ANOVA

One-way ANOVA
Comparing more than two groups
x1, x2, . . . , xk s1, s2, . . . , sk
Joint test for any differences between the groups.
Why not just pairwise t-tests?
Mass significance (type I error)Loss of overview
The fewer tests, the better.
Karl B Christensenhttp://biostat.ku.dk/~kach/SPSS 3. Using SPSS for t-tests and ANOVA

Notation in ANOVA model
xij observation no. j in group no. i , e.g. x35 the 5th observation ingroup 3. Model
Xij = µi + εij εij ∼ N(0, σ2)
The null hypothesis (no differences between groups)
µ1 = µ2 = ... = µk
Karl B Christensenhttp://biostat.ku.dk/~kach/SPSS 3. Using SPSS for t-tests and ANOVA

Variation within groups and variation between groups
Main idea behind analysis of variance (ANOVA): If thevariation between group means is large compared to thevariation within groups, it is a sign that the null hypothesis iswrong.
The model (grouping) explains part of the variation
Variation︷ ︸︸ ︷between gr. within gr.
Karl B Christensenhttp://biostat.ku.dk/~kach/SPSS 3. Using SPSS for t-tests and ANOVA

Sums of squares
Let xi denote the mean for group i and let x. denote the total(grand) meanVariation Within groups:
SSDW =∑
i
∑j(xij − xi )
2
Variation Between groups:
SSDB =∑
i
∑j(xi − x.)
2
Can be mathematically proven that
SSDB + SSDW = SSDtotal =∑
i
∑j(xij − x.)
2
Karl B Christensenhttp://biostat.ku.dk/~kach/SPSS 3. Using SPSS for t-tests and ANOVA

Var. between groups large compared to var. within groups
Small variation within groups
..
..........
..
....
-
A B C
Large variation within groups
..
..
.
.
.
..
.
..
.
.
.
.
..
-
A B C
high ’between’ variation high ’within’ variationsmall ’within’ variation small ’between’ variationF is large F is smallH0 is rejected H0 is not rejected
Karl B Christensenhttp://biostat.ku.dk/~kach/SPSS 3. Using SPSS for t-tests and ANOVA

F-test for identical group means
Reject the hypothesis if the variation between groups is largecompared to the variation within groups.
F = [SSDB/(k − 1)]/[SSDW /(N − k)]
If null hypothesis is true we know distribution of F
Reject hypothesis that group means are identical if F too large.Karl B Christensenhttp://biostat.ku.dk/~kach/SPSS 3. Using SPSS for t-tests and ANOVA

One-way ANOVA in SPSS
Data set juul2.sav. Compare boys in different Tanner stage withrespect to their log SIGF1
1 Generate a new data set
2 Select (sexnr=1, age<20)
3 model: What is described by what? (sigf1 by tanner)
4 SPSS knows that tanner is a grouping
Karl B Christensenhttp://biostat.ku.dk/~kach/SPSS 3. Using SPSS for t-tests and ANOVA

ANOVA
Point-and-click
syntax
GET FILE=’P:\juul2.sav ’.
ONEWAY sigf1 BY tanner
/PLOT MEANS
/MISSING ANALYSIS.
Karl B Christensenhttp://biostat.ku.dk/~kach/SPSS 3. Using SPSS for t-tests and ANOVA

ANOVA
ANOVA
sigf1sigf1sigf1
Sum of Squares df Mean Square F Sig.
Between Groups
Within Groups
Total
12696216,59 4 3174054,147 228,353 ,000
10939116,28 787 13899,767
23635332,86 791
sigf1sigf1
tanner
54321
Mea
n o
f si
gf1
600
500
400
300
200
Page 1
Karl B Christensenhttp://biostat.ku.dk/~kach/SPSS 3. Using SPSS for t-tests and ANOVA

ANOVA using UNIANOVA
Karl B Christensenhttp://biostat.ku.dk/~kach/SPSS 3. Using SPSS for t-tests and ANOVA

ANOVA exercise
Look at ANOVA in the Juul data. Try
UNIANOVA sigf1 BY tanner
/CONTRAST(tanner )= Simple
/METHOD=SSTYPE (3)
/INTERCEPT=INCLUDE
/CRITERIA=ALPHA (0.05)
/DESIGN=tanner.
This yields contrasts. Try to interpret these. If you have time dothe analysis on the log-transformed SIGF1.
Karl B Christensenhttp://biostat.ku.dk/~kach/SPSS 3. Using SPSS for t-tests and ANOVA

Mann-Whitney test, Wilcoxon test, Kruskal-Wallis test
Nonparametric statistics: ’t-test’ (Mann-Whitney test, Wilcoxontest) or ’ANOVA’ (Kruskal-Wallis test) on ranks
3, 9, 17, 504, 7, 8.7, 200
Data
−→ 1, 5, 6, 72, 3, 4, 8
Rank
Distribution is (in principle) known under null hypothesis. Doesnot depend on data following a normal distribution. Other“scores” than ranks can also be used
Karl B Christensenhttp://biostat.ku.dk/~kach/SPSS 3. Using SPSS for t-tests and ANOVA

Non parametric tests in SPSS
Use
or
NPAR TESTS
/K-W=sigf1 BY tanner (1 5)
/STATISTICS QUARTILES
/MISSING ANALYSIS.
Karl B Christensenhttp://biostat.ku.dk/~kach/SPSS 3. Using SPSS for t-tests and ANOVA

Non parametric tests in SPSS
NPar Tests
Descriptive Statistics
N
Percentiles
25th 50th (Median) 75th
sigf1
tanner
1018 202,00 313,50 463,25
1099 1,00 2,00 5,00
Kruskal-Wallis Test
Ranks
tanner N Mean Rank
sigf1 1
2
3
4
5
Total
311 186,77
70 398,32
45 557,81
58 609,28
308 544,22
792
Test Statisticsa,b
sigf1
Chi-Square
df
Asymp. Sig.
462,346
4
,000
Kruskal Wallis Testa.
Grouping Variable: tannerb.
Page 1
Karl B Christensenhttp://biostat.ku.dk/~kach/SPSS 3. Using SPSS for t-tests and ANOVA

More non parametric tests. Sign test
Paired data where patients rate two drugs A and B
Mi =
{1, if Ai > Bi
0, if Bi < Ai
for i = 1, . . . , 20. Under the null hypothesis
H0 : P(Ai > Bi ) =1
2
the test statistic M =∑20
i=1Mi is binomially distributed
Karl B Christensenhttp://biostat.ku.dk/~kach/SPSS 3. Using SPSS for t-tests and ANOVA

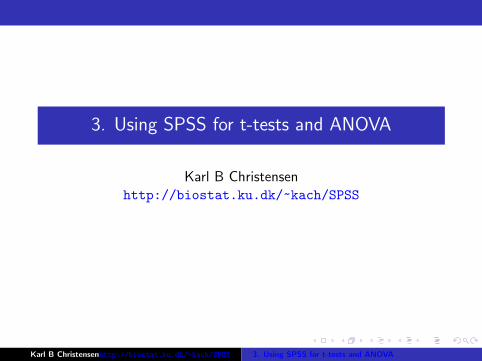
More non parametric tests. Sign test
Karl B Christensenhttp://biostat.ku.dk/~kach/SPSS 3. Using SPSS for t-tests and ANOVA

More non parametric tests
Friedmans test.
Jonckheere-Terpstra test
Karl B Christensenhttp://biostat.ku.dk/~kach/SPSS 3. Using SPSS for t-tests and ANOVA

Exercise: RCT data
1 Compare baseline aerobic capacity across the two groupsusing histograms, boxplots and descriptive statistics.
2 Test the null hypothesis that baseline aerobic capacity doesnot differ across the two groups. Use t-test, t-test onlog-transformed VO2max and non parametric statistics.
3 Discuss how change scores
(VO2max after intervention) - (baseline VO2max)
could be evaluated.
Karl B Christensenhttp://biostat.ku.dk/~kach/SPSS 3. Using SPSS for t-tests and ANOVA