Embed Size (px)
Citation preview

Update on HIV Testing
[A Very Fast]

Message
There are numbers of tests
They should be used in combination (strategies)
Combinations must be consistent

Laboratory Tests diagnosis of infection
acute, recent, established or late stage disease
prognostic markers monitoring of ARV therapies
immunological and virological markers
toxicities diagnosis of opportunistic
infections drug resistance testing
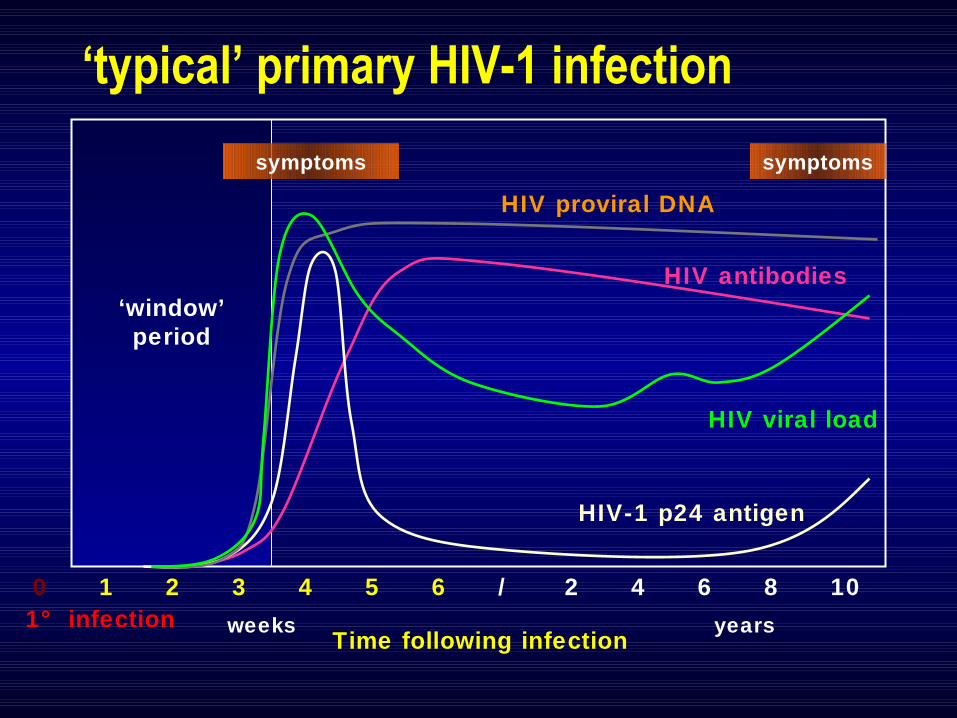
‘typical’ primary HIV-1 infection
symptoms
HIV-1 p24 antigen
0 1 2 3 4 5 6 / 2 4 6 8 10
weeks years
HIV antibodies
Time following infection
HIV viral load
HIV proviral DNA
symptoms
‘window’period
1° infection

DIAGNOSIS
Virus Detection & Quantification
Antibody
Antigen
Detection
RNAmodified Ag
Viral Culture, phenotyping
CD4+
ARV Resistance – genotypingARV Sensitivity
HIV Assays: Methodologies FOR THE DIAGNOSIS (DETECTION) & MANAGEMENT OF HIV
EIASimple, rapid
tests Immunoblots
Incident assays
MANAGEMENT
DNA(RNA)

DNA PCRDNA PCRRNA PCRRNA PCR
p24 Agp24 Ag3rd gen ELISA1st gen ELISA
Detuned ELISA1wk 2wk 3wk 2mo 6mo 1yr 2yr 3yr +8yr
gp160gp120
p68p55p53
gp41-45
p40
p34
p24
p18
p12
gp160gp120
p68p55p53
gp41-45
p40
p34
p24
p18
p12
gp160gp120
p68p55p53
gp41-45
p40
p34
p24
p18
p12
early recent / established advanced
Spectrum Spectrum of anti-HIV of anti-HIV
testing testing

HIV Testing -Direct Detection of Virus HIV p24 antigen– serology
- In isolation or Ab/Ag Combo test - Diagnosis of primary infection viraemia
Virus culture / isolation Nucleic acid detection - (NAT)
Clinical uses Proviral DNA vs. plasma RNA(viral load)
resolution of inconclusive serology / neonatal subtyping drug resistance monitoring

Principle of Immunoassays
SOLID PHASESOLID PHASESOLID PHASESOLID PHASE
ANTIGEN
SAMPLE ANTIBODY
ANTI-HUMAN IMMUNOGLOBULIN WITH DETECTOR

Available Assays
EIAs including rapid, simple particle agglutination, dot/blotWestern blotAntigen & Ab/Ag Incidence assays
Direct Virus Detection


Particle Agglutination

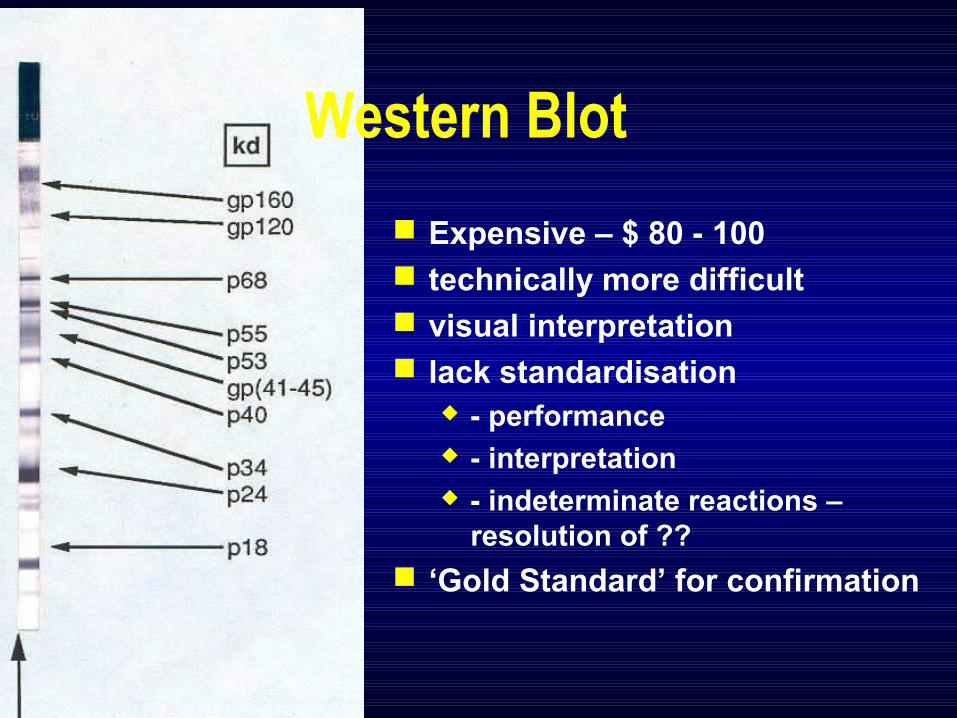
Western Blot
Expensive – $ 80 - 100 technically more difficult visual interpretation lack standardisation
- performance - interpretation - indeterminate reactions –
resolution of ??
‘Gold Standard’ for confirmation
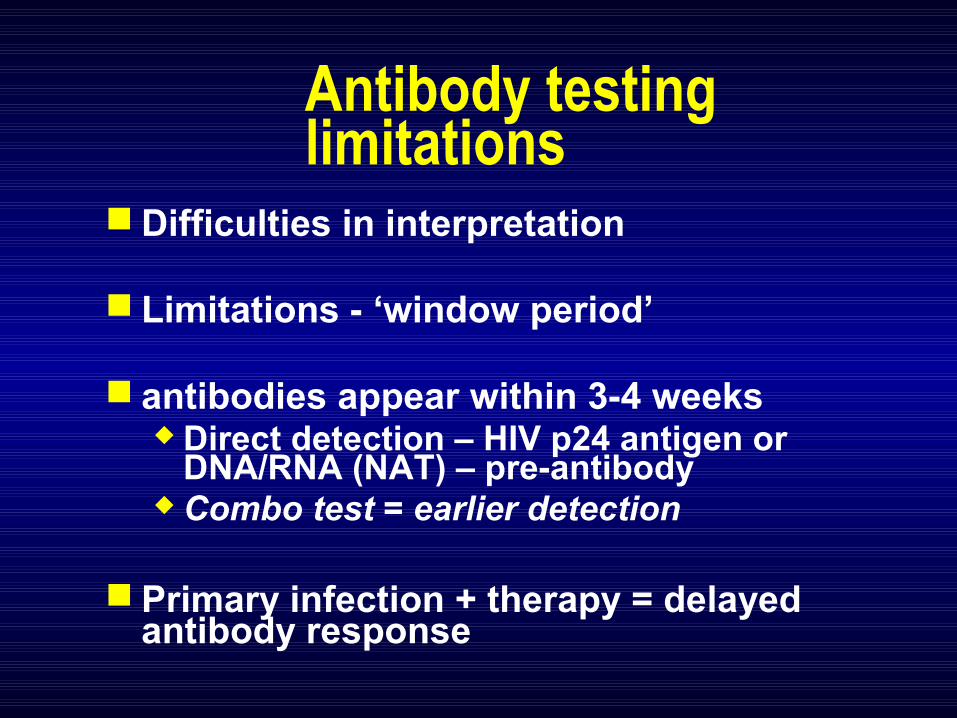
Antibody testing limitations
Difficulties in interpretation
Limitations - ‘window period’
antibodies appear within 3-4 weeks Direct detection – HIV p24 antigen or
DNA/RNA (NAT) – pre-antibody Combo test = earlier detection
Primary infection + therapy = delayed antibody response
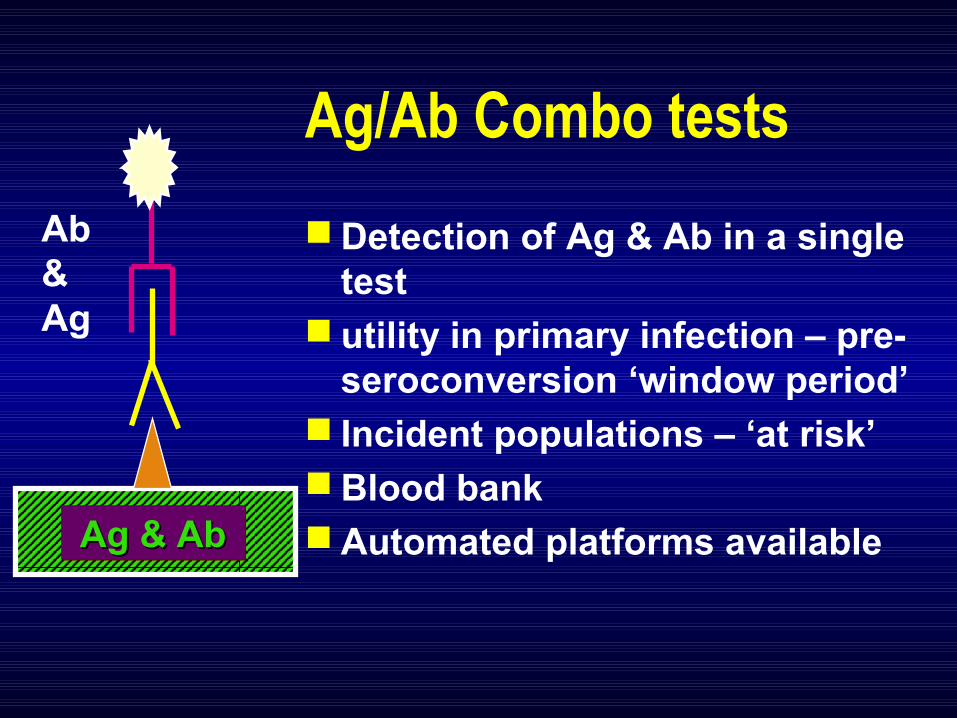
Ag/Ab Combo tests
Detection of Ag & Ab in a single test
utility in primary infection – pre-seroconversion ‘window period’
Incident populations – ‘at risk’ Blood bank Automated platforms availableAg & AbAg & AbAg & AbAg & Ab
Ab & Ag

Issues with Combo Assays Testing strategies False reactivity rates Confirmation strategies Replacement of other assays
(especially in the USA) Cost Legal issues

Conclusions HIV-1/2 Ag/Ab combo assays perform well
Differences in limit of detection of Ag (140 - <25 pg/mL)
May shorten window period by 3-5 days PHI detection without indication
Issues associated with introduction Strategies and confirmatory algorithms
ARV therapy effects seroconversion events

What about simple assays?

HIV Determine test
Detect HIV-1 & HIV-2 Cannot differentiate Procedural control – anti Hu IgG Whole blood or serum/plasma Widely available No additional reagents required Room temperature storage 15 minutes to result
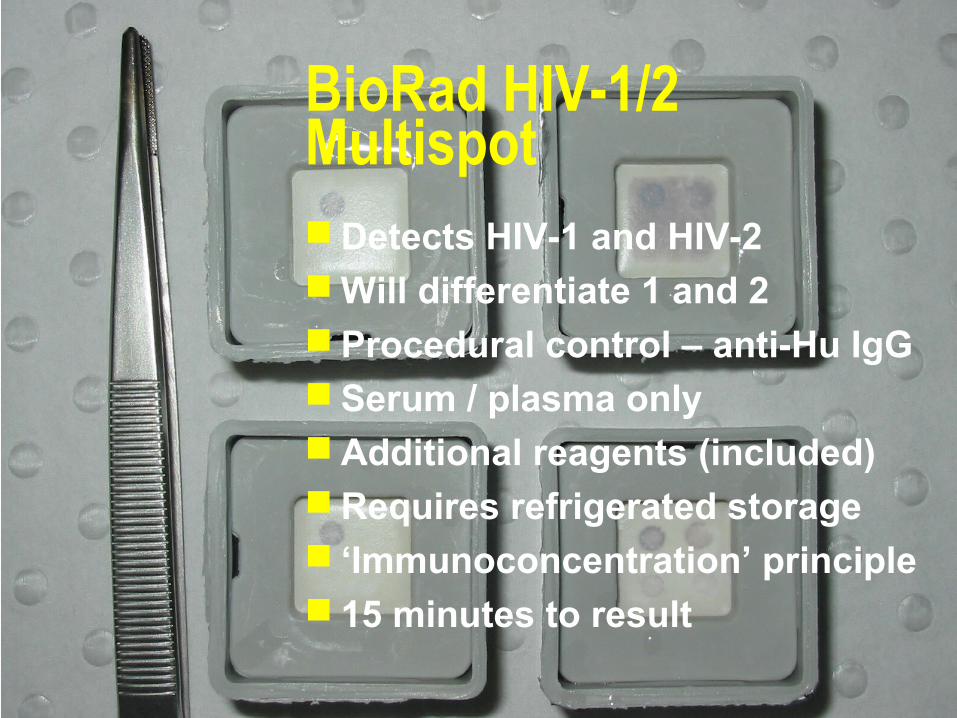
BioRad HIV-1/2 Multispot Detects HIV-1 and HIV-2 Will differentiate 1 and 2 Procedural control – anti-Hu IgG Serum / plasma only Additional reagents (included) Requires refrigerated storage ‘Immunoconcentration’ principle 15 minutes to result


WHO Recommended Strategies
Strategy I Test all samples with one EIA Strategy II Strategy I with all reactives
retested in a more specific test with different principle and/or antigen.
Strategy III Strategy II with reactives tested in a third test differing from the first two tests.

WHO Recommended Testing Strategies
Transfusion safety
Surveillance
� Diagnosis� Risk factors� No risk factors
Strategy I
>10% I <10% II
� Strategy II� >10% II� <10% III
Testing Strategies
AIM: To develop the logic used in establishing the use of HIV tests (testing strategies)

Objectives of Testing Strategies To achieve the correct diagnosis in the most
efficient manner To maintain consistency in testing To know the predictive value of the testing
process To develop baseline data for assessing
changes To deliver useful results

Aims in Developing HIV Testing Strategies
To arrive at the correct sero-diagnosisTo arrive at the correct sero-diagnosis To minimise total testing; thus costTo minimise total testing; thus cost Minimise samples classed as indeterminate Minimise samples classed as indeterminate
or dual reactorsor dual reactors Detect HIV-1 negative but HIV-2 positiveDetect HIV-1 negative but HIV-2 positive Follow likely seroconverters (HIV-1 or -2)Follow likely seroconverters (HIV-1 or -2)

Screening Assays
Are used to detect antibody-- specific or nonspecific
Are designed to handle large numbers of samples with rapid throughput
Must be high performance
Should include a full range of HIV antigens
Ab + Ag AbAg

Ab +AgAb +AgAb +AgAb +Ag AbAgAbAg
Ab +AgAb +AgAb +AgAb +Ag
Ab +AgAb +Ag
Ab +AgAb +AgAb +AgAb +AgAb +AgAb +Ag
AbAgAbAg
AbAgAbAg
AbAgAbAg
AbAgAbAgAbAgAbAgAbAgAbAgAbAgAbAg

Serological Testing Strategy
NEG SCREENING TEST, highly sensitiveSCREENING TEST, highly sensitive
POSSUPPLEMENTAL TEST, SUPPLEMENTAL TEST, highly sensitive & higher highly sensitive & higher
specificity specificity
ADDITIONALADDITIONALTESTSTESTS
REACTIVE
NEGNEG
POS
IND
NEG
IND

POINT OF REPORTING
NEGHIV1/2
SCREEN
POS HIV-1 WB
ADDITIONALTESTS
REACTIVE
NEG
NEG
INDPOS
IND
HIV Testing StrategySCREENIN
G
SUPPLEMENTAL
Supplemental Assays
Range of assays that further define
sero-status
High Performance (higher specificity)

The Use of Screening Assays
Define samples as negative for a given analyte
Enable high throughput

Assay Selection depends on:
laboratory infrastructure access to reference laboratory desired characteristics of the test equipment performance time shelf life and stability of reagents price technical skills of personnel support (technical, kit supply, etc)

Predictive Values
Positive Predictive ValuesPositive Predictive Values::The likelihood of a sample identified as a The likelihood of a sample identified as a reactive by a test being truly POSITIVE for reactive by a test being truly POSITIVE for the analyte used as the basis of the test.the analyte used as the basis of the test.
PPV =True Positives
True Positives + False ReactivesX 100%

Predictive Values
Negative Predictive ValuesNegative Predictive Values::
The likelihood that a sample identified as a non-The likelihood that a sample identified as a non-reactive by a test is truly NEGATIVE for the reactive by a test is truly NEGATIVE for the analyte used as the basis of the test.analyte used as the basis of the test.
NPV =True Negatives
True Negatives + False Negatives
X 100%

Negative Predictive ValueNon-reactive test, prevalence 2%
99.17 99.38 99.59 99.79 99.90 99.96 99.9899.17 99.38 99.59 99.79 99.90 99.96 99.98
99.17 99.38 99.59 99.79 99.90 99.96 99.9899.17 99.38 99.59 99.79 99.90 99.96 99.98
99.17 99.38 99.59 99.79 99.90 99.96 99.9899.17 99.38 99.59 99.79 99.90 99.96 99.98
Sp
eci
fic
ity
Sensitivity
60
70
90
60 70 80 90 95 98 99 %

Positive Predictive ValueReactive test, prevalence 2%
4.95 4.954.95 4.95
6.49 6.496.49 6.49
9.43 9.43 9.439.43 9.43 9.43
17.24 17.24 17.24 17.24 17.24 17.24 17.24 17.24 17.24 17.24 17.24 17.24 17.24 17.24
29.41 29.41 29.41 29.41 29.41 29.41 29.4129.41 29.41 29.41 29.41 29.41 29.41 29.41
51.02 51.02 51.02 51.02 51.02 51.02 51.02 51.02 51.02 51.02 51.02 51.02 51.02 51.02
67.57 67.57 67.57 67.57 67.57 67.57 67.57 67.57 67.57 67.57 67.57 67.57
67.5767.57
Sensitivity
Sp
ecif
icit
y
60
70
80
90
95
98
99
60 70 80 90 95 98 99 %

Cut-off valueCut-off value
XX
1 1
Fre
qu
ency
Fre
qu
ency
3SD2SD
1SD
2 2 3 3
Cross reactivity

Positive Predictive ValueAssays used separately
Assay 1Sens 99.0%Spec 99.5%
PPV
28.4%
80.2%
98.0%
Assay 2Sens 99.0%Spec 99.9%
PPV
66.4%
95.3%
99.6%
Prevalence
0.2%
2.0%
20.0%

Positive Predictive ValueAssays used sequentially
Assay 1Sens 99.0%Spec 99.5%
PPV
28.4%
80.2%
98.0%
Assay 2Sens 99.0%Spec 99.9%
PPV
99.75%
99.97%
99.99%
Prevalence
0.2%
2.0%
20.0%

Assay 1 Assay 2 Assays 1+2Assay 1 Assay 2 Assays 1+2
PPV vs Prevalence
(in sequence)
Sensitivity 99.0% 99.0% Specificity 99.5% 99.9%
Prevalence
0.2%
2.0%
20.0%
28.4%
80.2%
66.4% 99.75%
98.0%
80.2% 99.97%
99.6% 99.99%
PPV PPV PPV

Why Follow a Strategy?

The Importance of Maintaining a Strategy
Consistency of laboratory records Consistency of results Clarity of results to doctors Maintaining data base to assess
performances Avoiding common false reactivity Avoiding technical errors Reducing costs

WHO Recommended Strategies
Strategy I Test all samples with one EIA Strategy II Strategy I with all reactives
retested in a more specific test with different principle and/or antigen.
Strategy III Strategy II with reactives tested in a third test differing from the first two tests.

WHO Recommended Testing Strategies
Transfusion safety
Surveillance
� Diagnosis� Risk factors� No risk factors
Strategy I
>10% I <10% II
� Strategy II� >10% II� <10% III

WHO GuidelinesOther possibilities strategy for confirmation
combination of affordable & simple assays different test principles different antigen preparations
two or three ELISAs or rapid tests diagnosis confirmed by second sample detection of virus (PCR) antigen detection (limited lab.facilities) Always use a QC sample

Cost of HIV Testing
comparative costs (AUD$) ELISA (Ab only) - $2 per test
EIA (Ab/Ag combo) - $3.50
rapid test - $10-20 per test
Western blot $80 - 100
p24 antigen $30
PCR - qualitative $80 - 100
PCR - quantitative (viral load) $90 – 150*
DNA sequencing (resistance) $400 – 700

Summary of Testing Strategies
-Screening test x1
Screening test x2
Supplemental test
Other tests
NEG
R
- NEG-
- NEG+
POS
Eliminates laboratory
error
RR or R-
Message
There are numbers of tests
They should be used in combination (strategies)
Combinations must be consistent