Embed Size (px)
Citation preview

1
3
S T I B N I T E G O L D P R O J EC TI DA H O, U S A
MARCH 2017MAX.TSXMDRPF.OTCQX

2F O R WA R D LO O K I N G S TAT E M E N T SStatements contained in this presentation that are not historical facts are "forward-looking information" or "forward-looking statements" (collectively, "Forward-Looking Information") within the meaning ofapplicable Canadian securities legislation and the United States Private Securities Litigation Reform Act of 1995. Forward-Looking Information includes, but is not limited to, disclosure regarding possibleevents, conditions or financial performance that is based on assumptions about future economic conditions and courses of action; and the plans for completion of the Offerings, expected use of proceedsand business objectives. In certain cases, Forward-Looking Information can be identified by the use of words and phrases such as "anticipates", "expects", "understanding", "has agreed to" or variations ofsuch words and phrases or statements that certain actions, events or results "would", "occur" or "be achieved". Although Midas Gold has attempted to identify important factors that could affect Midas Goldand may cause actual actions, events or results to differ materially from those described in Forward-Looking Information, there may be other factors that cause actions, events or results not to be asanticipated, estimated or intended, including, without limitation, the risks and uncertainties related to the Offerings not being completed in the event that the conditions precedent thereto are not satisfied;uncertainties related to raising sufficient financing in a timely manner and on acceptable terms. There can be no assurance that Forward-Looking Information will prove to be accurate, as actual results andfuture events could differ materially from those anticipated in such statements. Accordingly, readers should not place undue reliance on Forward-Looking Information. Except as required by law, Midas Golddoes not assume any obligation to release publicly any revisions to Forward-Looking Information contained in this news release to reflect events or circumstances after the date hereof or to reflect theoccurrence of unanticipated events.Forward-Looking Information involves known and unknown risks, uncertainties and other factors which may cause the actual results, performance or achievements of the Corporation to be materiallydifferent from any future results, performance or achievements expressed or implied by the Forward-Looking Information. Such risks and other factors include, among others, the industry-wide risks andproject-specific risks identified in the PFS and summarized above; risks related to the availability of financing on commercially reasonable terms and the expected use of proceeds; operations and contractualobligations; changes in exploration programs based upon results of exploration; changes in estimated mineral reserves or mineral resources; future prices of metals; availability of third party contractors;availability of equipment; failure of equipment to operate as anticipated; accidents, effects of weather and other natural phenomena and other risks associated with the mineral exploration industry;environmental risks, including environmental matters under US federal and Idaho rules and regulations; impact of environmental remediation requirements and the terms of existing and potential consentdecrees on the Corporation‘s planned exploration and development activities on the Stibnite Gold Project; certainty of mineral title; community relations; delays in obtaining governmental approvals orfinancing; fluctuations in mineral prices; the Corporation‘s dependence on one mineral project; the nature of mineral exploration and mining and the uncertain commercial viability of certain mineraldeposits; the Corporation‘s lack of operating revenues; governmental regulations and the ability to obtain necessary licences and permits; risks related to mineral properties being subject to priorunregistered agreements, transfers or claims and other defects in title; currency fluctuations; changes in environmental laws and regulations and changes in the application of standards pursuant to existinglaws and regulations which may increase costs of doing business and restrict operations; risks related to dependence on key personnel; and estimates used in financial statements proving to be incorrect; aswell as those factors discussed in the Corporation's public disclosure record. Although the Corporation has attempted to identify important factors that could affect the Corporation and may cause actualactions, events or results to differ materially from those described in Forward-Looking Information, there may be other factors that cause actions, events or results not to be as anticipated, estimated orintended. There can be no assurance that Forward-Looking Information will prove to be accurate, as actual results and future events could differ materially from those anticipated in such statements.Accordingly, readers should not place undue reliance on Forward-Looking Information. Except as required by law, the Corporation does not assume any obligation to release publicly any revisions toForward-Looking Information contained in this presentation to reflect events or circumstances after the date hereof or to reflect the occurrence of unanticipated events.
Cautionary NoteThe presentation has been prepared by Midas Gold management and does not represent a recommendation to buy or sell these securities. Investors should always consult their investment advisors priorto making any investment decisions.All references to “dollars” or “$” shall mean United States dollars unless otherwise specified. Exchange rates and share prices used, where appropriate, are based on the spot prices as of Feb. 19th, 2016.
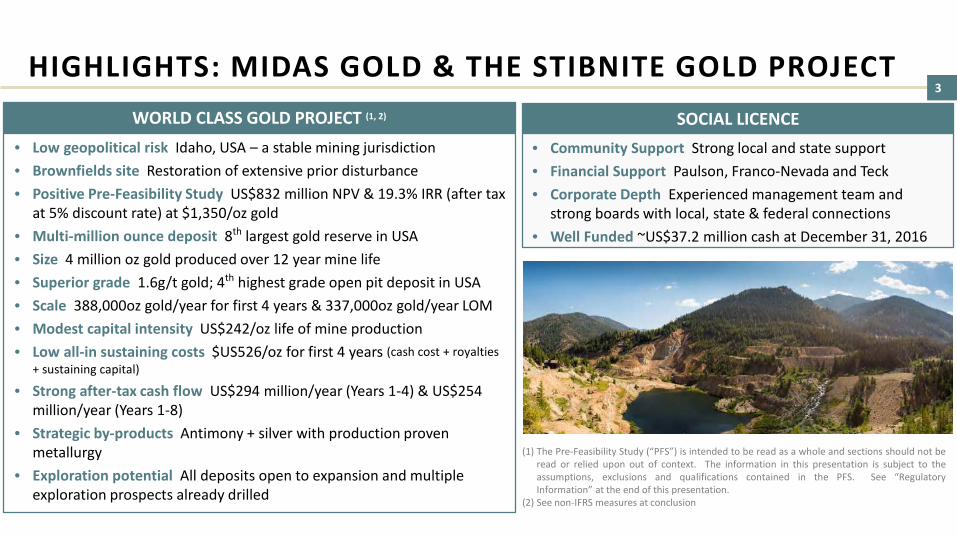
3HIGHLIGHTS: MIDAS GOLD & THE STIBNITE GOLD PROJECT
WORLD CLASS GOLD PROJECT (1, 2)
• Low geopolitical risk Idaho, USA – a stable mining jurisdiction• Brownfields site Restoration of extensive prior disturbance• Positive Pre-Feasibility Study US$832 million NPV & 19.3% IRR (after tax
at 5% discount rate) at $1,350/oz gold• Multi-million ounce deposit 8th largest gold reserve in USA• Size 4 million oz gold produced over 12 year mine life• Superior grade 1.6g/t gold; 4th highest grade open pit deposit in USA• Scale 388,000oz gold/year for first 4 years & 337,000oz gold/year LOM• Modest capital intensity US$242/oz life of mine production• Low all-in sustaining costs $US526/oz for first 4 years (cash cost + royalties
+ sustaining capital)
• Strong after-tax cash flow US$294 million/year (Years 1-4) & US$254 million/year (Years 1-8)
• Strategic by-products Antimony + silver with production proven metallurgy
• Exploration potential All deposits open to expansion and multiple exploration prospects already drilled
SOCIAL LICENCE• Community Support Strong local and state support• Financial Support Paulson, Franco-Nevada and Teck• Corporate Depth Experienced management team and
strong boards with local, state & federal connections• Well Funded ~US$37.2 million cash at December 31, 2016
(1) The Pre-Feasibility Study (“PFS”) is intended to be read as a whole and sections should not beread or relied upon out of context. The information in this presentation is subject to theassumptions, exclusions and qualifications contained in the PFS. See “RegulatoryInformation” at the end of this presentation.
(2) See non-IFRS measures at conclusion
4
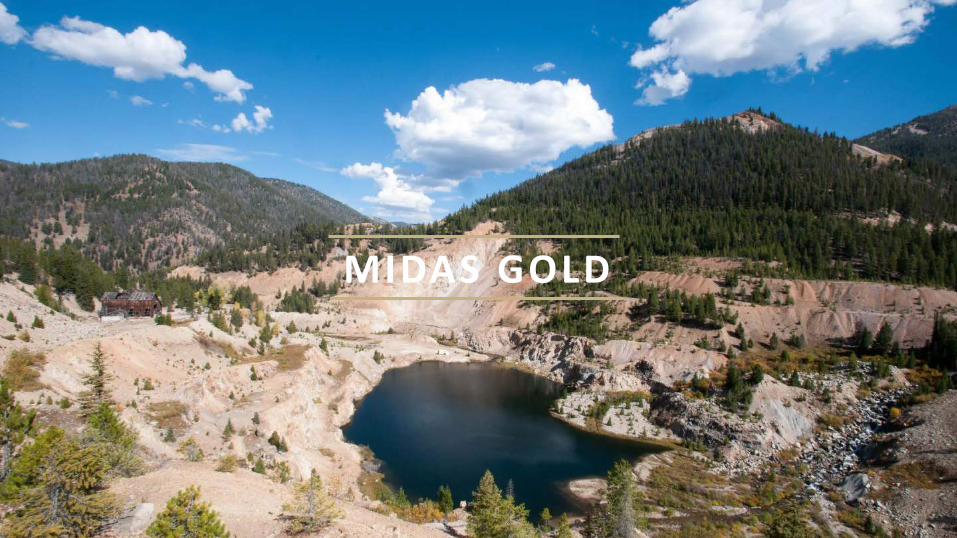
MIDAS GOLD

5M I DA S G O L D
• IPO in 2011 with sole focus on advancing the Stibnite Gold Project, Idaho, USA• ~US$137m spent on the Project since 2009
• ~99,450m of drilling by Midas Gold• ~136,400m of drilling pre-Midas Gold• PFS completed• 3+ years of environmental baseline data collected
• 180 million shares issued• Major shareholders include:
• EuroPac• Franklin• Gabelli
• Franco Nevada purchased a 1.7% NSR in 2013• Teck purchased 9.9% in 2013• Paulson backstopped C$55 million financing in March 2016• Experienced management team and strong boards with local connections
• M&G• Sun Valley• VanEck
• Teck Corp.• Vista Gold
23%
22%
12%3%
40%
Shareholders
Institutional
High Net Worth Individuals
Teck and Vista
Directors and Management
Retail and Other
6M I DA S G O L D
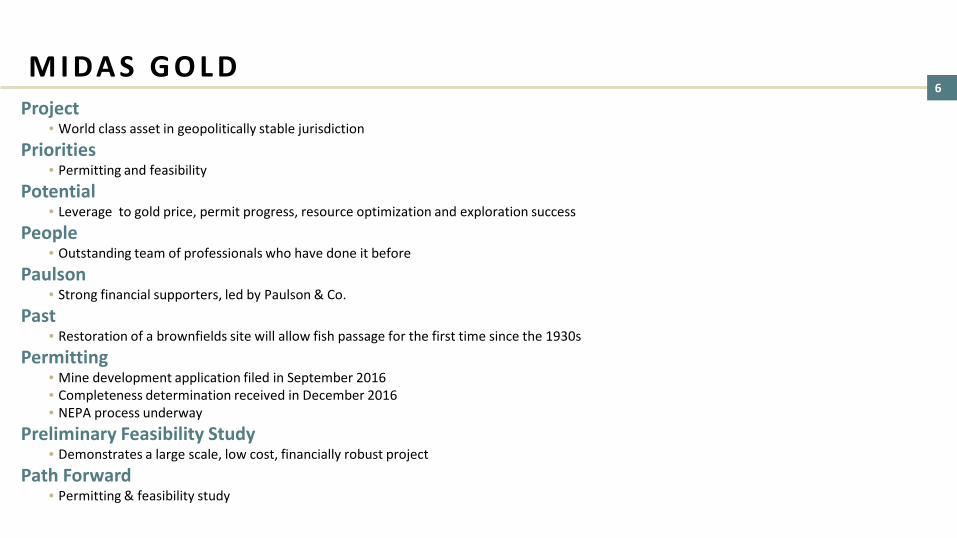
Project• World class asset in geopolitically stable jurisdiction
Priorities• Permitting and feasibility
Potential• Leverage to gold price, permit progress, resource optimization and exploration success
People• Outstanding team of professionals who have done it before
Paulson• Strong financial supporters, led by Paulson & Co.
Past • Restoration of a brownfields site will allow fish passage for the first time since the 1930s
Permitting• Mine development application filed in September 2016• Completeness determination received in December 2016• NEPA process underway
Preliminary Feasibility Study• Demonstrates a large scale, low cost, financially robust project
Path Forward• Permitting & feasibility study

7
PROJECT

8
Maplecroft identifies and monitors the key issues affecting the investment climates of 197 countries. The Atlas analyses yearly trends relating to dynamic risks, which reflect change over a short period of time, including governance, political violence, the macroeconomic environment, and included this year for the first time, resource nationalism. It also includes structural risks which reflect change over a longer timeframe, including economic diversification, resource security, infrastructure quality, the resilience of society to challenges, and the risk of complicity in human rights violations committed by regimes and business partners.
Stibnite Gold ProjectMidas Gold Au-Sb
Thompson Creek MineThompson Creek Mining
Molybdenum
Phosphate DistrictAgrium, Monsanto, Simplot, Stonegate
Sunshine MineSunshine Silver Mines
Silver
Lucky Friday MineHecla Mining Company
Silver-Lead-Zinc
Idaho Cobalt ProjectFormation Metals
Copper-Cobalt
Coeur d’Alene
Cascade
BOISE
IDAHO
Low geopolitical risk in a high risk world
McCall
(1) Fraser Institute Survey
Stibnite Gold Project
©Maplecroft
A mining friendly State Well defined permitting process Strong community support Low geopolitical risk
I DA H O : T H E R I G H T P L A C E8

9
On average, RBC calculates an IRR of 12% to buy and build a project vs. 5% to buy an existing single asset producer
Source: ThomsonOne, Company Reports, RBC Capital Markets estimates
Detour
Alacer
Asanko
Guyana
Roxgold
TMAC
Torex
Continental
Dalradian
Integra
Midas
Pretium
Sabina
AlmadenDacian
Goldquest
IDM
INV
Luna
Pure Gold
Atlantic
Belo SunVictoria
0%
5%
10%
15%
20%
- 100 200 300 400 500 600 700
Afte
r-ta
x IR
R in
cl. 4
0% ta
keov
er p
rem
ium
Annual Gold Production
Pre-production: 12%
Producing: 5%
- pre production asset- producing asset
Estimated IRRs at $1,300/oz gold for potential takeout candidates – including a 40% takeover premium to current market value
S T I B N I T E G O L D P R O J EC T - P R O D U C T I O N S C A L E
Higher Production
High
er R
etur
n
(000s oz)
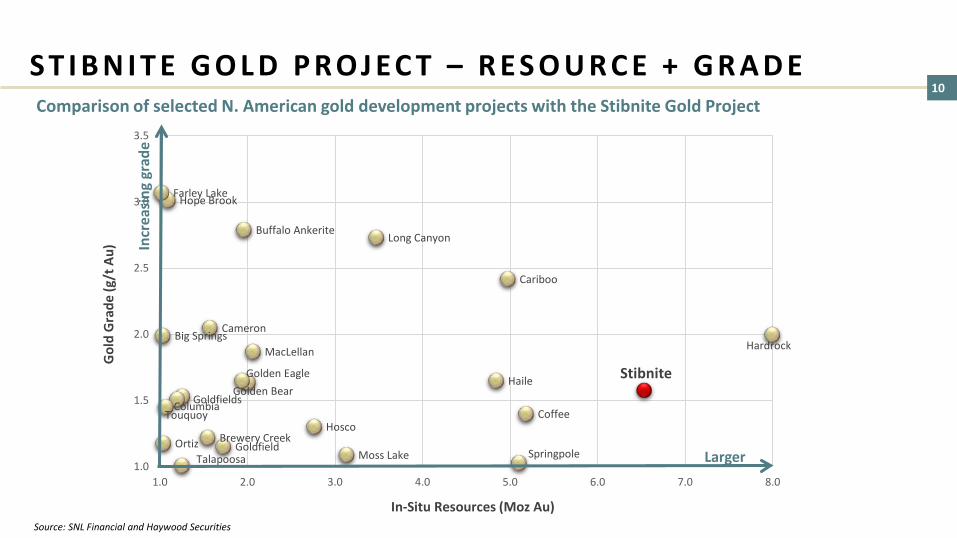
10S T I B N I T E G O L D P R O J EC T – R E S O U R C E + G R A D EComparison of selected N. American gold development projects with the Stibnite Gold Project
Gol
d G
rade
(g/t
Au)
In-Situ Resources (Moz Au)Source: SNL Financial and Haywood Securities
Hardrock
Stibnite
Coffee
Springpole
Cariboo
Haile
Long Canyon
Moss Lake
Hosco
MacLellan
Golden Bear
Buffalo Ankerite
Golden Eagle
Goldfield
Cameron
Brewery Creek
Goldfields
Talapoosa
Columbia
Hope Brook
Touquoy
Ortiz
Big Springs
Farley Lake
1.0
1.5
2.0
2.5
3.0
3.5
1.0 2.0 3.0 4.0 5.0 6.0 7.0 8.0
Larger
Incr
easi
ng g
rade

11
Cortez
Canadian Malartic
Detour Lake Round Mountain
Musselwhite
Hemlo
Bald Mountain
Young-Davidson
Marigold
Casa Berardi
Kettle River-Buckhorn
Kensington
Mesquite
Goldex
Westwood
Golden Sunlight
Wharf
Black Fox
Seabee
Holt
Stibnite
0
1
2
3
4
5
6
7
8
9
10
400 500 600 700 800 900 1,000
Gra
de (g
/t A
u)
Cash Cost (US$/oz Au)
STIBNITE GOLD PROJECT vs OTHER LARGE-SCALE GOLD MINESComparison of Stibnite gold project expectations (grade, cash cost and output) with selected large-scale gold mines
Source: SNL Financial and Haywood Securities
Higher Cash Costs
High
er G
rade

12
0.20
0.70
1.20
1.70
2.20
Barrick Newmont Goldcorp Kinross Eldorado IAMGOLD Yamana New Gold
g/t G
old
2008 2009 2010 2011 2012 2013 2014 2015
Yellow Pine*
Hangar Flats*
West End*
* Stibnite Gold numbers are mineral reserve grades from the 2014 PFSSource: Bank of America Merrill Lynch – North America Precious Metals Weekly and public company disclosure
S T I B N I T E G O L D P R O J EC T – S U P E R I O R G R A D Evs. MAJOR GOLD PRODUCER RESERVES

13
PRIORITIES
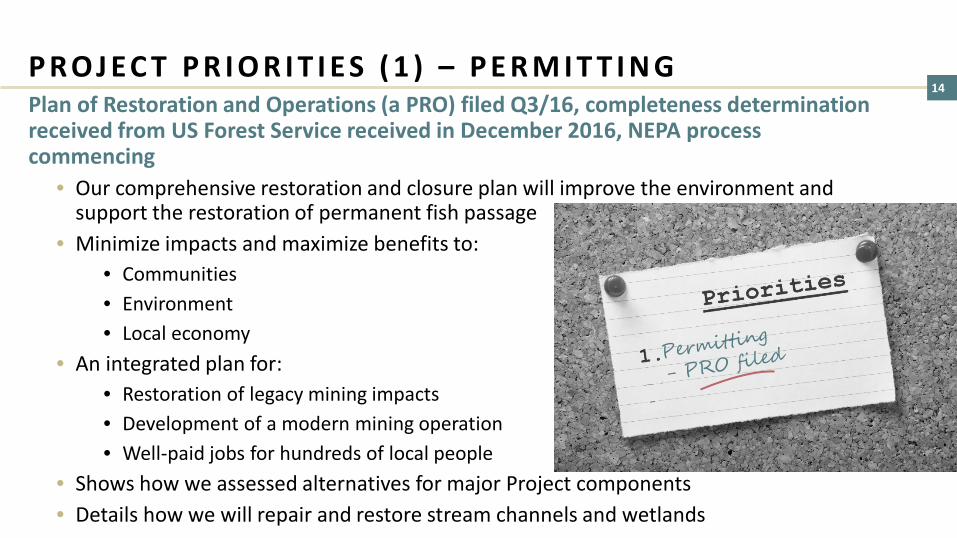
14P R O J EC T P R I O R I T I E S ( 1 ) – P E R M I T T I N GPlan of Restoration and Operations (a PRO) filed Q3/16, completeness determination received from US Forest Service received in December 2016, NEPA process commencing
• Our comprehensive restoration and closure plan will improve the environment and support the restoration of permanent fish passage
• Minimize impacts and maximize benefits to:• Communities• Environment• Local economy
• An integrated plan for:• Restoration of legacy mining impacts• Development of a modern mining operation • Well-paid jobs for hundreds of local people
• Shows how we assessed alternatives for major Project components• Details how we will repair and restore stream channels and wetlands

15P R O J EC T P R I O R I T I E S ( 2 ) – F E A S I B I L I T Y W O R KMetallurgy
• Enhance & optimize already robust PFS outcomes• Grind size• Flotation mass pull• Reagent dosages• Recoveries
• Provide FS level confidence results• Pilot scale POX plant program
• Support FS-level engineering
Resource Optimization• Better define and increase early year, shallow, high grade mineralization• Convert in-pit inferred resources to indicated• Convert near-pit inferred resources to indicated• Replace historical data to increase confidence level

16
POTENTIAL

17
$0
$200
$400
$600
$800
$1,000
$1,200
$1,400
$0.00$0.50$1.00$1.50$2.00$2.50$3.00$3.50$4.00
US$1,200/oz Au US$1,350/oz Au US$1,500/oz Au Net
Ass
et V
alue
(US$
Mill
ions
)
NAV
PS (U
S$)
Net Asset Value NAVPS
Substantial NPV & Leverage To
Gold Price
NAV Sensitivities (US$)US$1,200/oz Au(1) US$1,350/oz Au(2) US$1,500/oz Au(3)
Project NPV5% $513M $832M $1,129M
Cash on Hand $42M $42M $42M
Net Asset Value $555M $874M $1,171M
NAVPS(4) $1.75 $2.75 $3.69
(1) PFS Case A: $1,200/oz Au, $20/oz Ag, $4.00/lb Sb, after-tax
(2) PFS Case B (Base Case): $1,350/oz Au, $22.50/oz Ag, $4.50/lb Sb, after-tax
(3) PFS Case C: $1,500/oz Au, $25/oz Ag, $5.00/lb Sb, after-tax
(4) Assumes debentures converted to common shares
P O T E N T I A L U P S I D E – L E V E R A G E TO G O L D P R I C E
Source: Midas Gold December 2014 PFS
$0
$500
$1,000
$1,500
$2,000
$2,500
$3,000
$3,500
$1,200 $1,350 $1,500 $1,650
Proj
ect N
PV (U
S$ m
illio
ns)
Gold Price ($/oz)
5% After-Tax
0% After-Tax
0% Pre Tax
Enterprise Value~US $125m
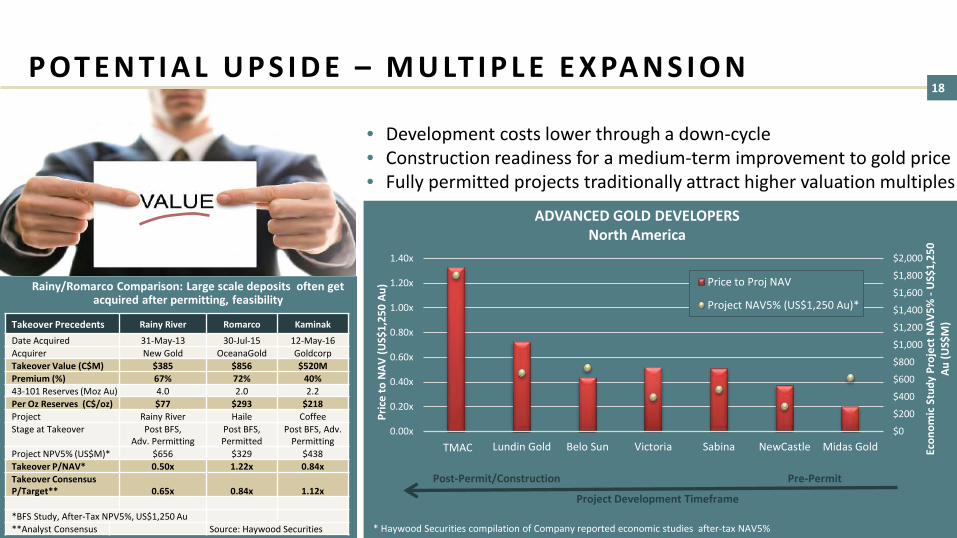
18P OT E N T I A L U P S I D E – M U LT I P L E E X PA N S I O N
• Development costs lower through a down-cycle• Construction readiness for a medium-term improvement to gold price• Fully permitted projects traditionally attract higher valuation multiples
Rainy/Romarco Comparison: Large scale deposits often get acquired after permitting, feasibility
Takeover Precedents Rainy River Romarco Kaminak
Date Acquired 31-May-13 30-Jul-15 12-May-16Acquirer New Gold OceanaGold GoldcorpTakeover Value (C$M) $385 $856 $520MPremium (%) 67% 72% 40%43-101 Reserves (Moz Au) 4.0 2.0 2.2Per Oz Reserves (C$/oz) $77 $293 $218Project Rainy River Haile CoffeeStage at Takeover Post BFS,
Adv. PermittingPost BFS, Permitted
Post BFS, Adv. Permitting
Project NPV5% (US$M)* $656 $329 $438Takeover P/NAV* 0.50x 1.22x 0.84xTakeover Consensus P/Target** 0.65x 0.84x 1.12x
*BFS Study, After-Tax NPV5%, US$1,250 Au**Analyst Consensus Source: Haywood Securities * Haywood Securities compilation of Company reported economic studies after-tax NAV5%
Project Development Timeframe
Pre-PermitPost-Permit/Construction
$0
$200
$400
$600
$800
$1,000
$1,200
$1,400
$1,600
$1,800
$2,000
0.00x
0.20x
0.40x
0.60x
0.80x
1.00x
1.20x
1.40x
Pretium Lundin Gold Belo Sun Victoria Sabina NewCastle Midas Gold Econ
omic
Stu
dy P
roje
ct N
AV5%
-U
S$1,
250
Au (U
S$M
)
Pric
e to
NAV
(US$
1,25
0 Au
) Price to Proj NAV
Project NAV5% (US$1,250 Au)*
ADVANCED GOLD DEVELOPERSNorth America
TMAC
19
$1,482
$832
-$74-$387
-$120
-$63-$6
$0
$200
$400
$600
$800
$1,000
$1,200
$1,400
$1,600
PEANPV
Change inOpex
Change inPayable Metal
Change inMetal Prices
Addition ofRoyalty
Change inCapex
PFSNPV
Proj
ect N
PV a
t 5%
Dis
coun
t Rat
e ($
mill
ions
)
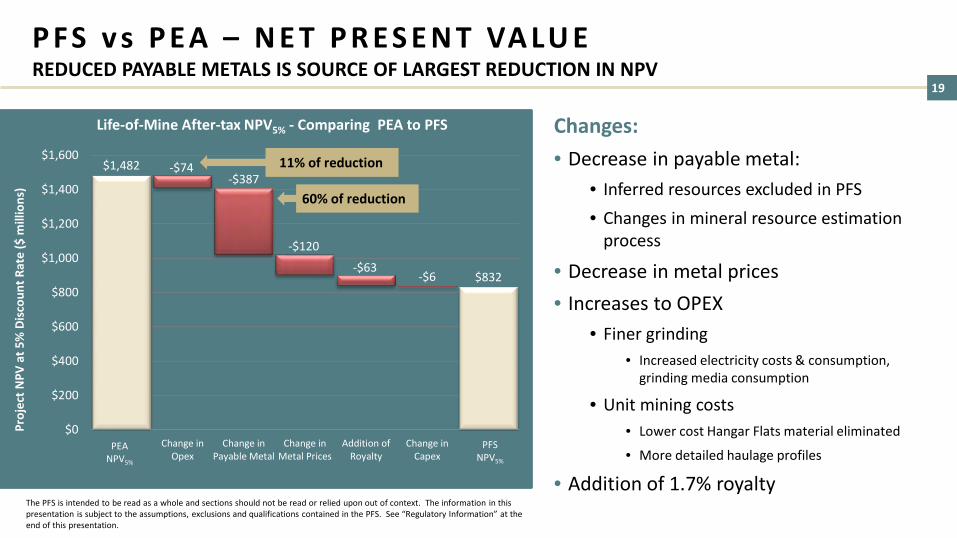
Life-of-Mine After-tax NPV5% - Comparing PEA to PFS Changes: • Decrease in payable metal:
• Inferred resources excluded in PFS• Changes in mineral resource estimation
process
• Decrease in metal prices• Increases to OPEX
• Finer grinding• Increased electricity costs & consumption,
grinding media consumption
• Unit mining costs• Lower cost Hangar Flats material eliminated
• More detailed haulage profiles
• Addition of 1.7% royaltyThe PFS is intended to be read as a whole and sections should not be read or relied upon out of context. The information in this presentation is subject to the assumptions, exclusions and qualifications contained in the PFS. See “Regulatory Information” at the end of this presentation.
PEANPV5%
PFSNPV5%
60% of reduction
11% of reduction
P FS v s P E A – N E T P R E S E N T VA LU EREDUCED PAYABLE METALS IS SOURCE OF LARGEST REDUCTION IN NPV
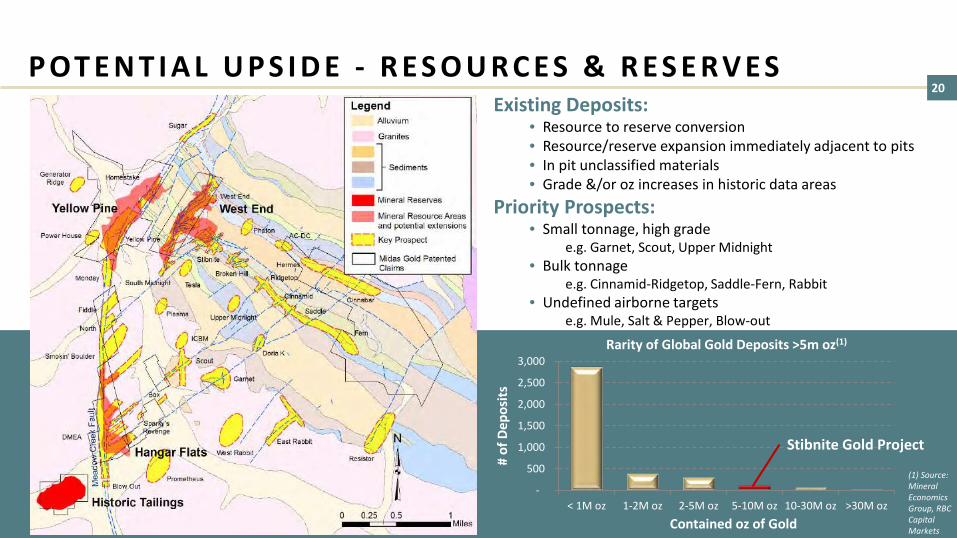
20Existing Deposits:
• Resource to reserve conversion• Resource/reserve expansion immediately adjacent to pits• In pit unclassified materials• Grade &/or oz increases in historic data areas
Priority Prospects:• Small tonnage, high grade
e.g. Garnet, Scout, Upper Midnight• Bulk tonnage
e.g. Cinnamid-Ridgetop, Saddle-Fern, Rabbit• Undefined airborne targets
e.g. Mule, Salt & Pepper, Blow-out
-
500
1,000
1,500
2,000
2,500
3,000
< 1M oz 1-2M oz 2-5M oz 5-10M oz 10-30M oz >30M oz#
of D
epos
itsContained oz of Gold
Stibnite Gold Project
(1) Source: Mineral Economics Group, RBC Capital Markets
Rarity of Global Gold Deposits >5m oz(1)
P OT E N T I A L U P S I D E - R E S O U R C E S & R E S E R V E S

21
The PFS is intended to be read as a whole and sections should not be read or relied upon out of context. The information in this presentation is subject to the assumptions, exclusions and qualifications contained in the PFS. See “Regulatory Information” at the end of this presentation.
INSIDE THE PFS RESERVE PITS AROUND THE PFS RESERVE PITS THROUGH RESOURCE CONVERSION
• Converting some or all of 346k oz Au @ 1.1 g/t Au in inferred mineral resources* to mineral reserves, also reducing strip ratio
• 50-100k oz Au in partially drilled waste dumps currently treated as waste rock**
• 50-100k oz Au + 30-50M lbs Sb through more detailed drilling of higher grade core of Yellow Pine, where historic data restricted or excluded**
• 889k oz Au @ 1.7g/t Au in indicated mineral resources between reserve pit and resource pit
• 714k oz Au @ 1.5 g/t Au in inferred mineral resources* between reserve pit and resource pit
POTENTIAL UPSIDE: IN- & NEXT-TO-PIT RESERVE ADDITIONS
* See slide 51 for disclaimer regarding Inferred Mineral Resources** See slide 51 for disclaimer regarding geologic exploration potential

22CURRENT DRILL PROGRAM - HIGHLIGHTS
Inferred to Indicated – 2-3x Expected grade
Resource De-risking - Replacing historic data
Inferred to Indicated + Resource additions
MGI16-411: 35.2m @ 3.1g/t Au (incl. 18.3m @ 5.0 g/t Au)*MGI16-412: 22.9m @ 4.7g/t Au & 0.15% Sb*
* See news release dated Nov.21/16 for full details
MGI16-414: 200.3m @ 2.2g/t Au, 3.2g/t Ag & 0.13% Sb(incl. 6.1m @ 3.6 g/t Au & 1.75% Sb)*
MGI-17-421: 217m @ 3.2g/t Au, 6.1g/t Ag & 0.3% Sb(incl. 21m @ 5.7g/t Au, 26.7g/t Ag & 1.3% Sb)**
* See news release dated Nov.30/16 for full details** See news release dated Feb. 23/17 for full details
MGI16-415: 42.7m @ 3.1g/t Au, 10.7g/t Ag & 0.49% Sb*MGI16-417: 122.5m @ 2.2g/t Au, 8.0g/t Ag & 0.46% Sb*
* See news release dated Jan. 23/17 for full details
23
The PFS is intended to be read as a whole and sections should not be read or relied upon out of context. The information in this presentation is subject to the assumptions, exclusions and qualifications contained in the PFS. See “Regulatory Information” at the end of this presentation.
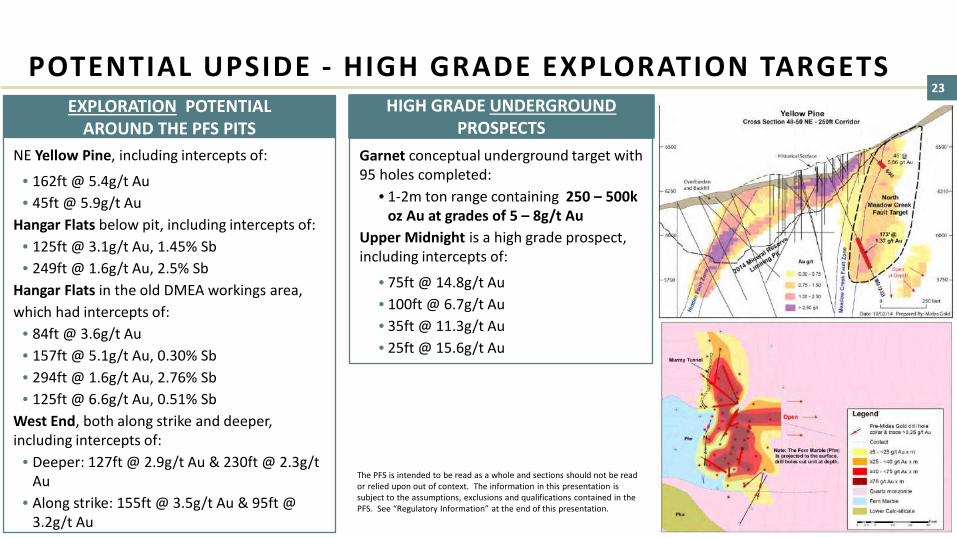
POTENTIAL UPSIDE - HIGH GRADE EXPLORATION TARGETSEXPLORATION POTENTIAL
AROUND THE PFS PITSHIGH GRADE UNDERGROUND
PROSPECTSNE Yellow Pine, including intercepts of:
• 162ft @ 5.4g/t Au• 45ft @ 5.9g/t Au
Hangar Flats below pit, including intercepts of:• 125ft @ 3.1g/t Au, 1.45% Sb• 249ft @ 1.6g/t Au, 2.5% Sb
Hangar Flats in the old DMEA workings area,which had intercepts of:
• 84ft @ 3.6g/t Au• 157ft @ 5.1g/t Au, 0.30% Sb• 294ft @ 1.6g/t Au, 2.76% Sb• 125ft @ 6.6g/t Au, 0.51% Sb
West End, both along strike and deeper, including intercepts of:
• Deeper: 127ft @ 2.9g/t Au & 230ft @ 2.3g/t Au
• Along strike: 155ft @ 3.5g/t Au & 95ft @ 3.2g/t Au
Garnet conceptual underground target with 95 holes completed:
• 1-2m ton range containing 250 – 500k oz Au at grades of 5 – 8g/t Au
Upper Midnight is a high grade prospect, including intercepts of:
• 75ft @ 14.8g/t Au• 100ft @ 6.7g/t Au• 35ft @ 11.3g/t Au• 25ft @ 15.6g/t Au
24
PEOPLE

25
Don Bailey Chair & Director
Peter Nixon Chair & DirectorEx-Goepel, director of Dundee Precious Metals, ex-Miramar
Victor FloresDirector
Stephen Quin Director / CEO
Marcelo KimDirector
Donald Young Director
Partner, Paulson & Co.
Ex-Capstone, Mining Sherwood Copper, Miramar Mining &
Northern Orion
Partner, Paulson & Co
Ex-KPMG, Placer Dome, director of Dundee Precious
Metals
Keith Allred Director
Michael BogertDirector
Attorney, Parsons, Behle & Latimer, former counselor to US Interior Secretary, former
regional admin. of the US EPA Region 10 office
Partner at Cicero Group, 2010
Democratic candidate for Governor of Idaho
Ken Brunk Director
Ronn Julian Director
Scotty Davenport Director
Frank Eld Director
Served four terms on McCall City Council, two
as mayor, resident of McCall, ID
Former Valley County Commissioner (two terms), resident of
Rosebury, ID
Founding member of Valley County Economic
Development Council, business owner in Valley
County, resident of McCall, ID
Three decades with the US Forest Service,
resident of Cascade, ID
Ex-CEO Midway Gold, ex-Romarco, ex-
Newmont, experienced mine builder & operator
Bob BarnesDirector/COO
COO Midas Gold, Ex-VP Ops Capstone, ex-Pan American,
Goldcorp
Midas Gold Corp. Board
Midas Gold Idaho, Inc. Board
(Idaho operating subsidiary)
B OA R D S O F D I R EC TO R S : PROVEN TRACK RECORD, LOCAL INTERESTS
Laurel SayerDirector / CEOFormer E.D. of Idaho
Coalition of Land Trusts, ex-director of natural resource
issues & policy for Idaho congressional delegation

26
Stephen Quin President & CEOMidas Gold Corp.
Bob Barnes Director & COOMidas Gold Idaho
Darren Morgans CFO
Anne Labelle VP Legal & Sustainability
John Meyer VP Development
Richard Moses Field Operations Manager
Chris Dail Exploration Manager
Rocky Chase VP Environment
& Permitting
Liz MongerIR Manager
& Corp. Secretary
Ex-COO Capstone Mining, ex-CEO
Sherwood Copper, EVP Miramar Mining
Ex-VP Ops Capstone Mining, ex-Pan
American, Goldcorp
Ex-Terrane, Placer Dome, MIM and PWC
Ex-Capstone Mining, Sherwood Copper,
Miramar Mining
Ex-Livengood, Pebble, Donlin Creek, Bakyrchik,
Pipeline
Ex-Cominco, Asarco, Kennecott, Piedmont,
USFS
Ex-Barrick, Hecla, Stibnite district experience
Ex-Rainy River and Rubicon Minerals
Ex-Kinross, Aurelian, Barrick, Syncrude
E X P E R I E N C E D M A N A G E M E N T:WE’VE DONE IT BEFORE!
Laurel Sayer President & CEOMidas Gold Idaho
Former Executive Director of Idaho Coalition of Land Trusts, ex-director of natural resource
issues & policy for Idaho congressional delegation
Kyle FendEnvironmental Superintendent
Alan HaslamDirector of Permitting
Mckinsey LyonDirector, Public Affairs
Former Director of Mining for Agrium, recently led NEPA permitting
of Rasmussen Valley Mine, Idaho
Former Partner Gallatin Public Affairs, consultant for
Monsanto and Agrium on NEPA permitting
Ex-Freeport-McMoRan, Cameco, North Wind

27
PAULSON
28PAULSON - STRATEGIC INVESTMENT IN MIDAS GOLD• C$55.2 million investment backstopped by
Paulson – March 2016– Current shareholders participated for C$20.7
million – Paulson took up balance (C$34.5 million)
• 0.05% coupon, senior unsecured convertible debenture
• 7-year term, redeemable after 4 years• Funds the permitting process and
feasibility for the Stibnite Gold Project• Funding certainty for 3+ year period• Adds cornerstone committed gold investor
with strong balance sheet
“We are excited to be investing in one of North America’s largest, highest quality gold development projects. With funding certainty, the team at Midas Gold will be able to continue to advance the Stibnite Gold Project. Following shareholder approval, we look
forward to working with Midas Gold to see this project through the regulatory process, and into site restoration and development.”-Victor Flores, Partner, Paulson & Co.
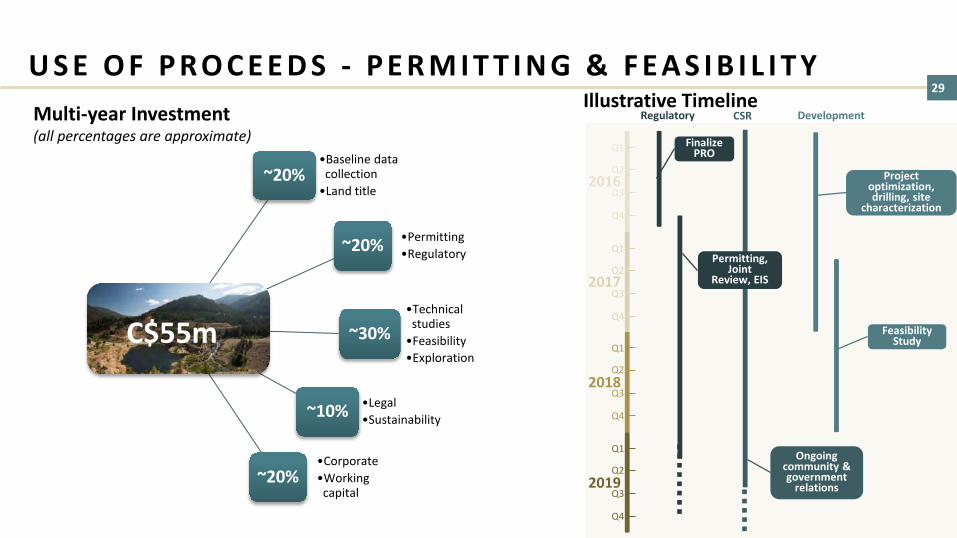
29U S E O F P R O C E E D S - P E R M I T T I N G & F E A S I B I L I T Y
~20%•Baseline data
collection•Land title
~20% •Permitting•Regulatory
~30%•Technical
studies•Feasibility•Exploration
~10% •Legal•Sustainability
~20%•Corporate•Working
capital
C$55m
Multi-year Investment(all percentages are approximate)
Illustrative Timeline
2019
2018
2017
2016
Q1
Q2
Q3
Q4
Q1
Q2
Q3
Q4
Q1
Q2
Q3
Q4
Q1
Q2
Q3
Q4
Regulatory CSR Development
Feasibility Study
Project optimization, drilling, site
characterization
Finalize PRO
Permitting, Joint
Review, EIS
Ongoing community & government
relations

30
PAST

31S T I B N I T E , I DA H O : A R I C H H I S TO RY O F M I N I N G

32
Example:
Fish Passage blocked since 1938
Midas Gold would:Restore fish passage
S T I B N I T E ’ S L EG A C Y BROWNFIELDS SITE & RESTORATION OPPORTUNITY
33
The PFS is intended to be read as a whole and sections should not be read or relied upon out of context. The information in this presentation is subject to the assumptions, exclusions and qualifications contained in the PFS. See “Regulatory Information” at the end of this presentation.
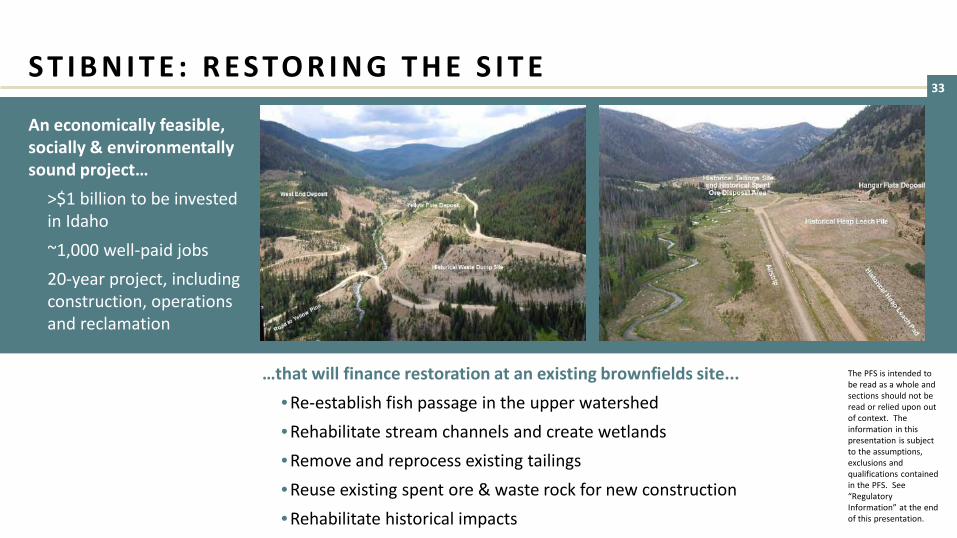
S T I B N I T E : R E S TO R I N G T H E S I T E
An economically feasible, socially & environmentally sound project…• >$1 billion to be invested
in Idaho• ~1,000 well-paid jobs • 20-year project, including
construction, operations and reclamation
…that will finance restoration at an existing brownfields site...• Re-establish fish passage in the upper watershed• Rehabilitate stream channels and create wetlands• Remove and reprocess existing tailings• Reuse existing spent ore & waste rock for new construction• Rehabilitate historical impacts

34
PERMITTING

35T H E P E R M I T T I N G P R O C E S S – M I N E P L A N R E V I E W
The US Forest Service generally follows a five-step process for reviewing mine plans:
Reviewing the completeness of the
proposed plan
NEPA analysis of potential impacts to the environment, human health, cultural and
historical resources
Approval of Mine Plan
Establish a Reclamation
Bond
Authorizing Mine
Operations

36T H E P E R M I T T I N G P R O C E S S - N E PA
Publish Final ROD
Notice of Availability (NOA) for
Draft EIS In Federal Register
EIS Project Initiation &
Public Scoping
PrepareDraft EIS
Respond to Comments on Draft EIS & Prepare
Final EIS & Draft RODAncillary Permits
RODDependent
PermitsPublic
Objection Period &
Objection Resolution
Draft EIS Comment
Period
NOA For Final EIS &
Draft ROD In Federal Register
Pre-work & Planning
Alternatives & Environmental
Analysis
Submittal of PRO
ProjectApproved
Administrative Approval
Engineering & Design
37
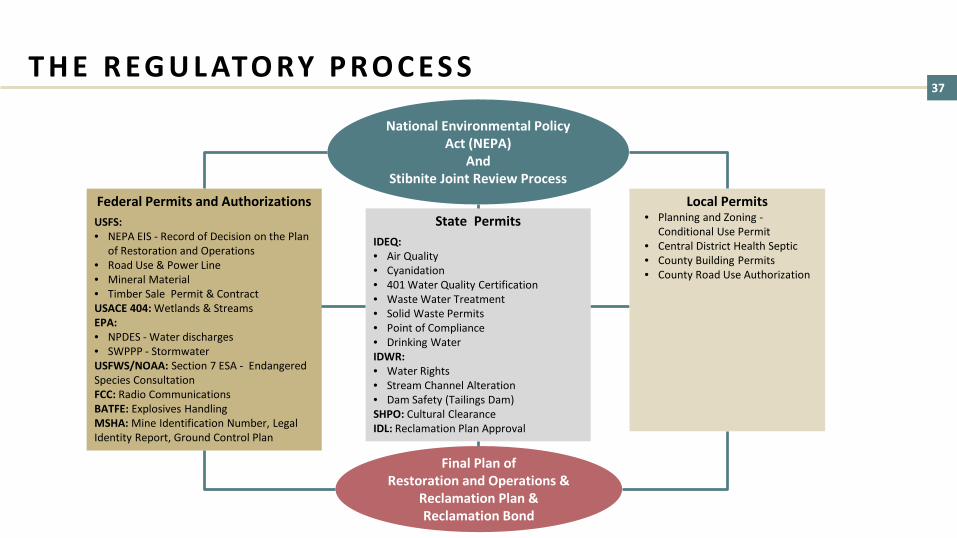
National Environmental Policy Act (NEPA)
AndStibnite Joint Review Process
Federal Permits and AuthorizationsUSFS:• NEPA EIS - Record of Decision on the Plan
of Restoration and Operations • Road Use & Power Line• Mineral Material• Timber Sale Permit & Contract USACE 404: Wetlands & StreamsEPA: • NPDES - Water discharges• SWPPP - StormwaterUSFWS/NOAA: Section 7 ESA - Endangered Species ConsultationFCC: Radio CommunicationsBATFE: Explosives Handling MSHA: Mine Identification Number, Legal Identity Report, Ground Control Plan
State PermitsIDEQ:• Air Quality• Cyanidation• 401 Water Quality Certification• Waste Water Treatment• Solid Waste Permits• Point of Compliance• Drinking WaterIDWR:• Water Rights• Stream Channel Alteration• Dam Safety (Tailings Dam)SHPO: Cultural ClearanceIDL: Reclamation Plan Approval
Local Permits• Planning and Zoning -
Conditional Use Permit• Central District Health Septic • County Building Permits• County Road Use Authorization
Final Plan of Restoration and Operations &
Reclamation Plan & Reclamation Bond
T H E R EG U L ATO RY P R O C E S S
38
PRE-FEASIBILITY STUDY

39
Indicated Inferred
2.8 Moz1.93 g/t Au
0.4 Moz1.31 g/t Au
Indicated Inferred
1.1 Moz1.60 g/t Au
0.4 Moz1.52 g/t Au
Indicated Inferred
0.3 Moz1.15 g/t Au
1.5 Moz1.30 g/t Au
Yellow Pine Hangar Flats West End
* See table and disclaimers at back of the presentation and Company news release dated September 10, 2014 and December 15, 2014 for full details on the resource and reserve estimates.
ProbableReserves:2.5 Moz
1.97 g/t Au
Probable Reserves:0.7 Moz1.53 g/t
Au
Probable Reserves:1.3 Moz
1.22 g/t Au
Plus reserves of 102,000 oz at a grade of 1.17 g/t gold in historic tailings
Totals for all deposits: PROBABLE RESERVES 4.6 Moz included in INDICATED 5.5Moz and INFERRED 1.1 Moz RESOURCE
W O R L D C L A S S M I N E R A L R E S O U R C E S A N D R E S E R V E S * (September 10, 2014 / December 15, 2014; “M” = millions)

40
* The PFS is intended to be read as a whole and sections should not be read or relied upon out of context. The information in this presentation is subject to the assumptions, exclusions and qualifications contained in the PFS. See “Regulatory Information” at the end of this presentation.
In this presentation, “M” = million, “k” = thousands, all amounts in US$, “LOM “ = Life-of-mine
14.0
8.356.0
99.9
Years 1-4
LOM
Antimony Production (millions lbs)Average Annual Production Total Production
22.0%
19.3%
IRR
pre-tax
after-tax
$1,093M
$832M
NPV5% (US$)
pre-tax
after-tax
= $242/oz produced
$483 $568
$1,350
Cash Costs vs. Gold Price (US$/oz) (2)
Years 1-4 LOM
$970 $1,125
Capital Costs (US$ millions)
Initial LOM
388
3371,551
4,040
Years 1-4
LOM
Gold Production (000s oz)Average Annual Production Total Production
Cash Costs
AISC$506 AISC
$616
P O S I T I V E P R E L I M I N A RY F E A S I B I L I T Y S T U DY (PFS) *December 2014 (at $1,350 gold)

41 - 500 1,000 1,500 2,000
Newmont NevadaBarric Cortez
Barrick GoldstrikeStibnite Gold (Yrs 1-4)*
Round MountainFort Knox
Stibnite Gold (Life-of-mine)*Pogo
Cripple CreekLeeville
Bingham CanyonTurquoise Ridge
- 10,000 20,000 30,000 40,000
Donlin GoldHycroft
Newmont NevadaTurquoise Ridge JV
Barrick CortezLivengood
Barrick GoldstrikeCripple Creek & Victor
GoldrushCarlin Underground
ConverseBald MountainStibnite Gold*
MesquiteTwin Creeks
Spring ValleyFort Knox
Sleeper
0 10,000 20,000 30,000
Newmont NevadaBarrick Cortez
Barrick GoldstrikeHycroft
Turquoise Ridge JVPogo
Cripple Creek and VictorStibnite Gold*
MarigoldFort Knox
Bald MountainMesquite
Round MountainJerritt Canyon
Kensington
0.00 0.50 1.00 1.50 2.00 2.50
Mineral RidgeCortez
Golden SunlightStibnite Gold*
Ruby HillNevada Operations
WharfCripple Creek and Victor
Buckskin RawhideBorealis
BriggsRound Mountain
Bald MountainMesquite
Florida CanyonMarigold
Fort KnoxHycroft
Source: USGS data for 2012 excluding mines/projects that are primarily copper or silver
4th largest years 1-4
6th largest LOM 8th largest
13th largest
4th highest grade
Largest US Gold Mines2012 Production000s oz Gold
Largest US Gold Mine Reserves000s oz Gold
Largest US Gold Resources (Measured + Indicated)000s oz Gold
Highest Grade US Open Pit Gold Mines g/t
Barrick Cortez
* Stibnite Gold PFS, December 2014
* Based on the Stibnite Gold 2014 Pre-Feasibility Study
ONE OF THE LARGEST, BEST GRADE GOLD PROJECTS IN THE USA
42
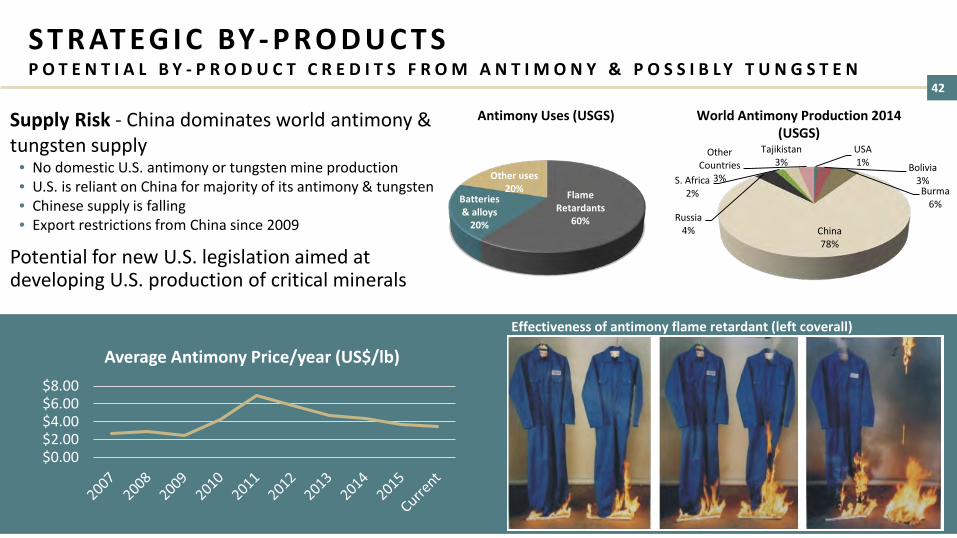
Flame Retardants
60%
Batteries & alloys
20%
Other uses20%
Antimony Uses (USGS)Supply Risk - China dominates world antimony & tungsten supply
• No domestic U.S. antimony or tungsten mine production• U.S. is reliant on China for majority of its antimony & tungsten• Chinese supply is falling• Export restrictions from China since 2009
Potential for new U.S. legislation aimed at developing U.S. production of critical minerals
World Antimony Production 2014 (USGS)
Effectiveness of antimony flame retardant (left coverall)
USA1% Bolivia
3%Burma
6%
China78%
Russia4%
S. Africa2%
Tajikistan3%
Other Countries
3%
S T R AT EG I C BY - P R O D U C T SP O T E N T I A L B Y - P R O D U C T C R E D I T S F R O M A N T I M O N Y & P O S S I B L Y T U N G S T E N
$0.00$2.00$4.00$6.00$8.00
Average Antimony Price/year (US$/lb)

43
PATH FORWARD

44PAT H F O R WA R D
Regulatory process underwayPFS completedPost-PFS optimization completedEnvironmental baseline data collected to support an EISProject extensively discussed with local communities and stakeholdersPlan of Restoration and Operations for mine development filed Completeness determination received, NEPA process commencedManagement team in place
Feasibility work underwayMetallurgical optimization test workResource optimization drilling
Financing provides multi-year certaintyCan complete the processSupport of well-funded strategic investors

45
ADDITIONAL INFORMATION
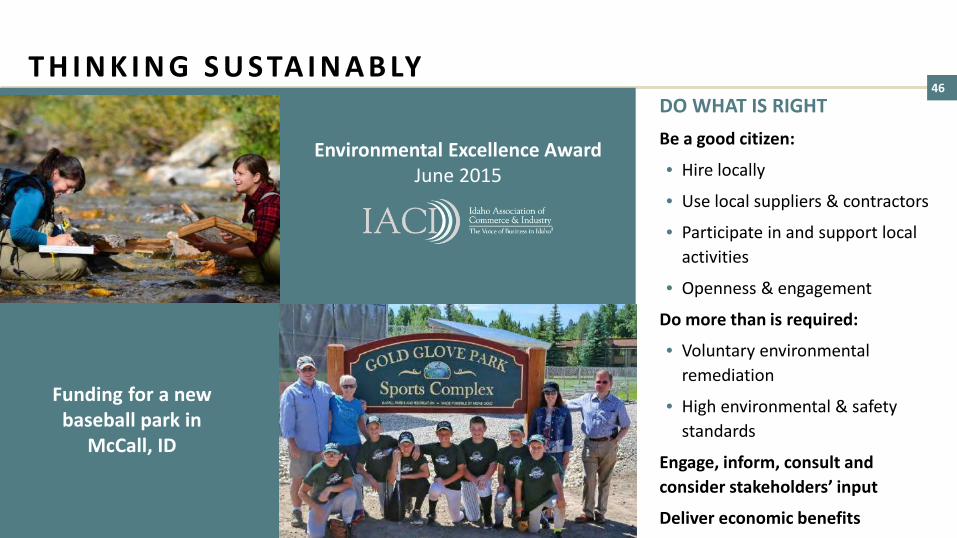
46DO WHAT IS RIGHTBe a good citizen:
• Hire locally
• Use local suppliers & contractors
• Participate in and support local activities
• Openness & engagement
Do more than is required:
• Voluntary environmental remediation
• High environmental & safety standards
Engage, inform, consult and consider stakeholders’ input
Deliver economic benefits
Funding for a new baseball park in
McCall, ID
Environmental Excellence Award June 2015
T H I N K I N G S U S TA I N A B LY

47R E S TO R AT I O N O P P O R T U N I T Y
Actively explored & mined (gold, antimony, tungsten) for ~100 years• Several open pits, haul roads, tailings, waste dumps, mill site, smelter site,
town sites, hydro dam, heap leach pads, spent heap leach ore stockpiles, etc. contributing to sediment run-off and degraded water quality
• Extensive forest fire damage contributing to erosion and sediment run-off• Fish passage cut off since 1938
PFS integrates remediation & reclamation of legacy impacts, and mostly completed early in mine life• Reprocess historic tailings, re-use waste rock and spent heap leach ore• Remediate failed hydro dam, mill site, smelter site, etc.• Restore fish passage during construction and permanent channel later in mine
life• Develop wetlands, restore historically impacted waterways, enhance fish
habitat
It is our goal to protect the environment, repair legacy impacts, and restore the site to a naturally sustainable ecosystem.
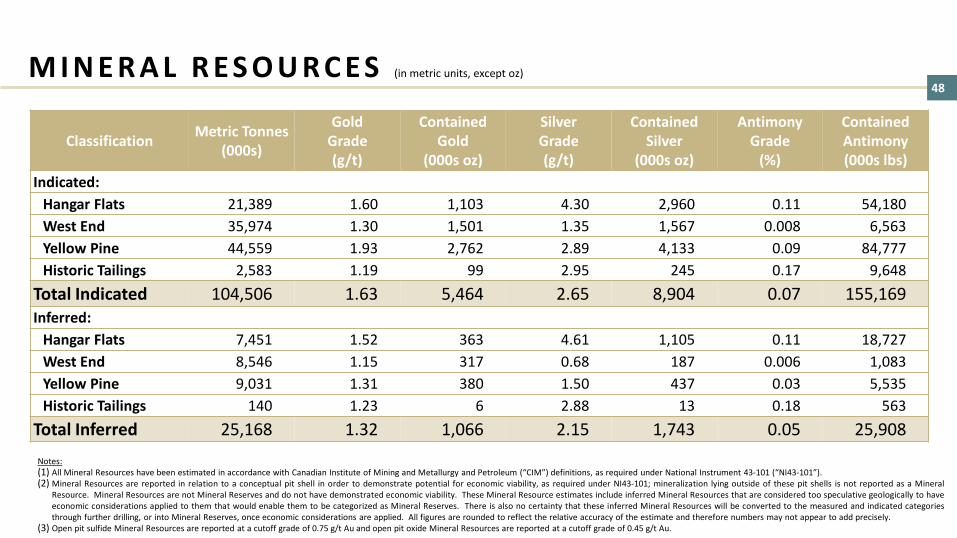
48M I N E R A L R E S O U R C E S (in metric units, except oz)
Classification Metric Tonnes(000s)
GoldGrade(g/t)
ContainedGold
(000s oz)
SilverGrade(g/t)
ContainedSilver
(000s oz)
Antimony Grade
(%)
ContainedAntimony(000s lbs)
Indicated:Hangar Flats 21,389 1.60 1,103 4.30 2,960 0.11 54,180West End 35,974 1.30 1,501 1.35 1,567 0.008 6,563Yellow Pine 44,559 1.93 2,762 2.89 4,133 0.09 84,777Historic Tailings 2,583 1.19 99 2.95 245 0.17 9,648
Total Indicated 104,506 1.63 5,464 2.65 8,904 0.07 155,169Inferred:
Hangar Flats 7,451 1.52 363 4.61 1,105 0.11 18,727West End 8,546 1.15 317 0.68 187 0.006 1,083Yellow Pine 9,031 1.31 380 1.50 437 0.03 5,535Historic Tailings 140 1.23 6 2.88 13 0.18 563
Total Inferred 25,168 1.32 1,066 2.15 1,743 0.05 25,908Notes:(1) All Mineral Resources have been estimated in accordance with Canadian Institute of Mining and Metallurgy and Petroleum (“CIM”) definitions, as required under National Instrument 43-101 (“NI43-101”).(2) Mineral Resources are reported in relation to a conceptual pit shell in order to demonstrate potential for economic viability, as required under NI43-101; mineralization lying outside of these pit shells is not reported as a Mineral
Resource. Mineral Resources are not Mineral Reserves and do not have demonstrated economic viability. These Mineral Resource estimates include inferred Mineral Resources that are considered too speculative geologically to haveeconomic considerations applied to them that would enable them to be categorized as Mineral Reserves. There is also no certainty that these inferred Mineral Resources will be converted to the measured and indicated categoriesthrough further drilling, or into Mineral Reserves, once economic considerations are applied. All figures are rounded to reflect the relative accuracy of the estimate and therefore numbers may not appear to add precisely.
(3) Open pit sulfide Mineral Resources are reported at a cutoff grade of 0.75 g/t Au and open pit oxide Mineral Resources are reported at a cutoff grade of 0.45 g/t Au.

49
Deposit TonnageAverage Contained Grade Total Contained Metal
Gold Antimony Silver Gold Antimony Silver
Imperial Units (000s tons) (oz/ton) (%) (oz/ton) (000s oz) (000s lbs) (000s oz)
Yellow Pine 43,985 0.057 0.098 0.090 2,521 86,376 3,973
Hangar Flats 15,430 0.045 0.132 0.086 690 40,757 1,327
West End 35,650 0.035 0.000 0.040 1,265 - 1,410
Historic Tailings 3,001 0.034 0.165 0.084 102 9,903 252
Total Probable Mineral Reserve 98,066 0.047 0.070 0.071 4,579 137,037 6,962
Notes:(1) All Mineral Reserves have been estimated in accordance with Canadian Institute of Mining and Metallurgy and Petroleum (“CIM”) definitions, as required under National Instrument 43-101 (“NI43-101”).(2) Metal prices used for Mineral Reserves: $1350/oz Au, $22.50/oz Ag, $4.50/lb Sb.(3) Block MUST be economic based on gold value only in order to be included as ore in Mineral Reserve.(4) Numbers may not add exactly due to rounding.
The PFS is intended to be read as a whole and sections should not be read or relied upon out of context. The information in this presentation is subject to the assumptions, exclusions and qualifications contained in the PFS. See “Regulatory Information” at the end of this presentation.
M I N E R A L R E S E R V E S (in imperial units)
50
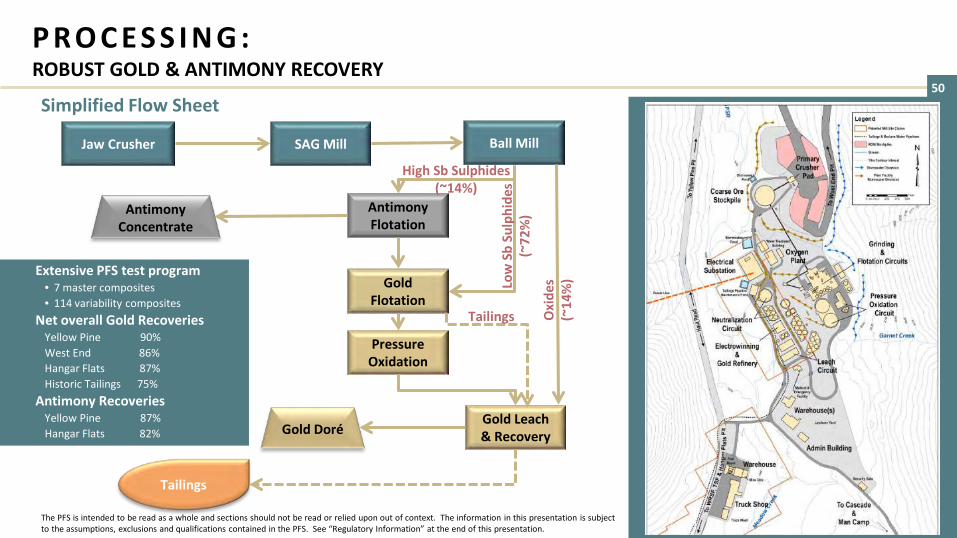
Extensive PFS test program• 7 master composites• 114 variability composites
Net overall Gold RecoveriesYellow Pine 90%West End 86%Hangar Flats 87%Historic Tailings 75%
Antimony RecoveriesYellow Pine 87%Hangar Flats 82%
Jaw Crusher SAG Mill Ball Mill
Antimony Flotation
Gold Flotation
Pressure Oxidation
Gold Leach& Recovery
Antimony Concentrate
Gold Doré
Oxi
des
(~14
%)
High Sb Sulphides (~14%)
TailingsLo
w S
b Su
lphi
des
(~72
%)
Simplified Flow Sheet
The PFS is intended to be read as a whole and sections should not be read or relied upon out of context. The information in this presentation is subject to the assumptions, exclusions and qualifications contained in the PFS. See “Regulatory Information” at the end of this presentation.
Tailings
P R O C E S S I N G : ROBUST GOLD & ANTIMONY RECOVERY

51
-$1,600
-$1,200
-$800
-$400
$0
$400
$800
$1,200
$1,600
-$600
-$450
-$300
-$150
$0
$150
$300
$450
$600
-3 -2 -1 1 2 3 4 5 6 7 8 9 10 11 12 13 14 15
Cum
ulat
ive
Afte
r Tax
Cas
h Fl
ow ($
mill
ions
)
Afte
r Tax
Cas
h Fl
ow ($
mill
ions
)
Year of Operation
Undiscounted Cash Flow
Undiscounted Cumulative Cash Flow
Key Points:• $1.5 billion in cash flow (after tax)
• $294 million/year Years 1-4• $254 million/year Years 1-8
• Payback in 3.4 years (after tax)
The PFS is intended to be read as a whole and sections should not be read or relied upon out of context. The information in this presentation is subject to the assumptions, exclusions and qualifications contained in the PFS. See “Regulatory Information” at the end of this presentation.
A F T E R TA X C A S H F LO W ( B A S E C A S E )

52
0
100
200
300
400
500
600
1 2 3 4 5 6 7 8 9 10 11 12
Num
ber o
f Dire
ct E
mpl
oyee
s
Year of Operation
Direct Employment Estimates - Operations
Mine Operations Mine GeneralMine Maintenance ProcessGeneral & Admin.
Key points:
• $28,000/year avg. salary in Idaho• $72,500/year avg. mining salary in Idaho• 3 year construction period:
• ~700 jobs created in Idaho- ~400 direct jobs
- >300 indirect jobs
• 12 year operating life:• ~1,000 jobs created in Idaho
- ~500 direct jobs
- ~500 indirect jobs
• Aggregate annual payroll:• $48 million/year - Construction
• $56 million/year - OperationsThe PFS is intended to be read as a whole and sections should not be read or relied upon out of context. The information in this presentation is subject to the assumptions, exclusions and qualifications contained in the PFS. See “Regulatory Information” at the end of this presentation.
E M P LOY M E N TSUBSTANTIAL DIRECT & INDIRECT IMPACT

53
Key points:
• Significant contribution to the local, state and federal economies:
• 15 year construction and operating life
• Taxes paid by Midas Gold over project life:• $329 million federal tax
• $86 million state & local tax
• Indirect & induced taxes paid by others• >$300 million federal, state & local
• 15-year total taxes:• $506 million federal tax
• $218 million state & local tax
The PFS is intended to be read as a whole and sections should not be read or relied upon out of context. The information in this presentation is subject to the assumptions, exclusions and qualifications contained in the PFS. See “Regulatory Information” at the end of this presentation.
$-
$10
$20
$30
$40
$50
$60
$70
$80
$90
-3 -2 -1 1 2 3 4 5 6 7 8 9 10 11 12
Loca
l, St
ate
and
Fede
ral T
axes
($ m
illio
n)
YearOther federal, state and local taxes resulting from Midas Gold's activitiesMidas Gold federal taxesMidas Gold state and local taxes
TA X PAY M E N T S ( B A S E C A S E )SIGNIFICANT CONTRIBUTIONS

54
The PFS is intended to be read as a whole and sections should not be read or relied upon out of context. The information in this presentation is subject to the assumptions, exclusions and qualifications contained in the PFS. See “Regulatory Information” at the end of this presentation.
P R I N C I PA L O P P O R T U N I T I E SLARGEST POTENTIAL IMPACT LIKELY TO COME FROM MORE PAYABLE METAL
MINING PROCESSING CAPITAL INCREASE RESERVESAT GOOD GRADES
• Optimizing scheduling, sequencing and stockpiling
• In pit resource to reserve conversion
• Optimize pit slopes to reduce stripping
• Optimize grind size/recovery
• Secondary processing of antimony concentrates
• Third party funding of offsite infrastructure
• Reduced construction schedule
• In pits• Beside pits• In new, higher grade,
underground deposits

55
Changes:• Reductions in mining related costs
• Smaller Hangar Flats pit reduces waste rock and additional equipment requirements
• Leasing major mining equipment
• Contingency reduced• Refined project estimates
• Increases in process plant CAPEX• Related to design changes
• Increased onsite & offsite infrastructure• Power line and access road
• Increased closure costs• Improved quantification of requirements
$1,182
$31$97 $19 $1,125-$176 -$28
0
200
400
600
800
1,000
1,200
1,400
LOM PEACAPEX
Mining Processingand Utilities
Infrastructure Owner CostsMitigation
and Closure
Contigency LOM PFSCAPEX
Life
-of-M
ine
CAPE
X ($
mill
ions
)
Life-of-Mine CAPEX - Comparing PEA to PFS
The PFS is intended to be read as a whole and sections should not be read or relied upon out of context. The information in this presentation is subject to the assumptions, exclusions and qualifications contained in the PFS. See “Regulatory Information” at the end of this presentation.
Contingency
P FS v s P E A – L I F E - O F - M I N E C A P I TA L C O S T SLOWER MINING CAPEX MORE THAN OFFSETS OTHER CHANGES

56
$19.06 $1.30$1.91
$1.82 $0.94$24.40
- $0.63
$0
$3
$6
$9
$12
$15
$18
$21
$24
$27
PEA TotalCash Costs
By-ProductRevenue
Mining &Stockpiling
Processing General &Administration
Royalty PFS TotalCash Costs
Life
-of-M
ine
OPE
X ($
/t)
Changes:• Operating costs have increased 28%
• Reduction in by-product credits• Leasing costs for mining equipment• More detailed mine planning• Finer grinding• Addition of 1.7% royalty• Reduced G&A
• Modest impact on NPV5%
Life-of-Mine OPEX - Comparing PEA to PFS
The PFS is intended to be read as a whole and sections should not be read or relied upon out of context. The information in this presentation is subject to the assumptions, exclusions and qualifications contained in the PFS. See “Regulatory Information” at the end of this presentation.
34% of increase
36% of increase
P FS v s P E A – L I F E - O F - M I N E O P E R AT I N G C O S T SHIGHER UNIT MINING COSTS AND FINER GRINDING ARE MAIN SOURCES OF INCREASED COSTS

57T H E P E R M I T T I N G P R O C E S S – M I N E P L A N R E V I E W
Gold
Clay
Stone
Uranium
From 2010 through 2014, 68 mine plans were approved by the BLM and US Forest Service.
State # approved plans # acres
Arizona 4 52
Alaska 6 105
California 2 180
Colorado 3 32
Idaho 8 674
Montana 3 15
Nevada 11 16,600
New Mexico 2 38
Oregon 4 242
Utah 8 674
Washington 1 17
Wyoming 21 17,920
2320
12
7 6
0-12months
12-24months
24-36months
36-48months
48months +
Time Frames for Approving 68 Mine Plans
Mine Plan Approval by Commodity Type
The average timeframe for mine plan approval:2 years
Source: US Government Accountability Office Report (Jan. 2016)
58
REGULATORY INFORMATION
59
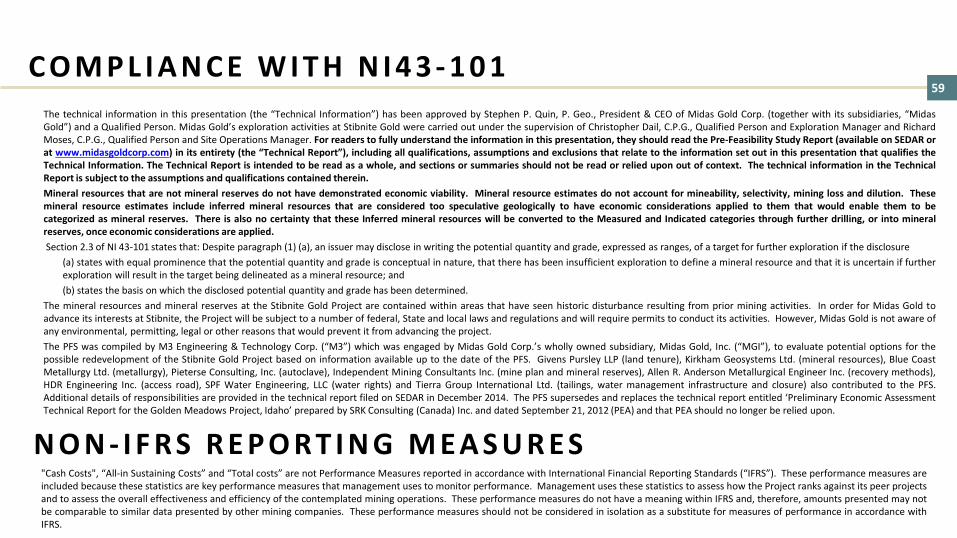
The technical information in this presentation (the “Technical Information”) has been approved by Stephen P. Quin, P. Geo., President & CEO of Midas Gold Corp. (together with its subsidiaries, “MidasGold”) and a Qualified Person. Midas Gold’s exploration activities at Stibnite Gold were carried out under the supervision of Christopher Dail, C.P.G., Qualified Person and Exploration Manager and RichardMoses, C.P.G., Qualified Person and Site Operations Manager. For readers to fully understand the information in this presentation, they should read the Pre-Feasibility Study Report (available on SEDAR orat www.midasgoldcorp.com) in its entirety (the “Technical Report”), including all qualifications, assumptions and exclusions that relate to the information set out in this presentation that qualifies theTechnical Information. The Technical Report is intended to be read as a whole, and sections or summaries should not be read or relied upon out of context. The technical information in the TechnicalReport is subject to the assumptions and qualifications contained therein.Mineral resources that are not mineral reserves do not have demonstrated economic viability. Mineral resource estimates do not account for mineability, selectivity, mining loss and dilution. Thesemineral resource estimates include inferred mineral resources that are considered too speculative geologically to have economic considerations applied to them that would enable them to becategorized as mineral reserves. There is also no certainty that these Inferred mineral resources will be converted to the Measured and Indicated categories through further drilling, or into mineralreserves, once economic considerations are applied.Section 2.3 of NI 43-101 states that: Despite paragraph (1) (a), an issuer may disclose in writing the potential quantity and grade, expressed as ranges, of a target for further exploration if the disclosure
(a) states with equal prominence that the potential quantity and grade is conceptual in nature, that there has been insufficient exploration to define a mineral resource and that it is uncertain if furtherexploration will result in the target being delineated as a mineral resource; and(b) states the basis on which the disclosed potential quantity and grade has been determined.
The mineral resources and mineral reserves at the Stibnite Gold Project are contained within areas that have seen historic disturbance resulting from prior mining activities. In order for Midas Gold toadvance its interests at Stibnite, the Project will be subject to a number of federal, State and local laws and regulations and will require permits to conduct its activities. However, Midas Gold is not aware ofany environmental, permitting, legal or other reasons that would prevent it from advancing the project.The PFS was compiled by M3 Engineering & Technology Corp. (“M3”) which was engaged by Midas Gold Corp.’s wholly owned subsidiary, Midas Gold, Inc. (“MGI”), to evaluate potential options for thepossible redevelopment of the Stibnite Gold Project based on information available up to the date of the PFS. Givens Pursley LLP (land tenure), Kirkham Geosystems Ltd. (mineral resources), Blue CoastMetallurgy Ltd. (metallurgy), Pieterse Consulting, Inc. (autoclave), Independent Mining Consultants Inc. (mine plan and mineral reserves), Allen R. Anderson Metallurgical Engineer Inc. (recovery methods),HDR Engineering Inc. (access road), SPF Water Engineering, LLC (water rights) and Tierra Group International Ltd. (tailings, water management infrastructure and closure) also contributed to the PFS.Additional details of responsibilities are provided in the technical report filed on SEDAR in December 2014. The PFS supersedes and replaces the technical report entitled ‘Preliminary Economic AssessmentTechnical Report for the Golden Meadows Project, Idaho’ prepared by SRK Consulting (Canada) Inc. and dated September 21, 2012 (PEA) and that PEA should no longer be relied upon.
"Cash Costs", “All-in Sustaining Costs” and “Total costs” are not Performance Measures reported in accordance with International Financial Reporting Standards (“IFRS”). These performance measures areincluded because these statistics are key performance measures that management uses to monitor performance. Management uses these statistics to assess how the Project ranks against its peer projectsand to assess the overall effectiveness and efficiency of the contemplated mining operations. These performance measures do not have a meaning within IFRS and, therefore, amounts presented may notbe comparable to similar data presented by other mining companies. These performance measures should not be considered in isolation as a substitute for measures of performance in accordance withIFRS.
N O N - I F R S R E P O R T I N G M E A S U R E S
C O M P L I A N C E W I T H N I 4 3 - 1 0 1
60
F O R M O R E I N F O R M AT I O N:T E L : 7 7 8 . 7 2 4 . 4 7 0 0F A X : 6 0 4 . 5 5 8 . 4 7 0 0E - M A I L : I N F O @ M I D A S G O L D C O R P . C O MS U I T E 8 9 0 – 9 9 9 W E S T H A S T I N G S S T R E E TV A N C O U V E R , B C C A N A D A V 6 C 2 W 2
W W W . M I D A S G O L D C O R P . C O M