Embed Size (px)
Citation preview

PSY 336 - Receptors 1
Vision - Stimulus and Receptor
The stimulus for the visual system is visible light - electromagnetic radiation with a wavelength of 400 to 700 nm (nanometers). Different wavelengths are perceived as different colors.
Light is reflected by objects. It is this reflected light that is focused by the cornea and lens onto the retina. The light on the retina is absorbed by visual pigment in the receptor cells (rods and cones). This starts a chemical process that results in electrical activity in the receptor.
There are two types of receptors plus four other types of nerve cells in the eye.
August 22, 2012

Vis
ible
Lig
ht
PSY 336 - Receptors 2 August 22, 2012

PSY 336 - Receptors 3
The Eye
The diagram below shows the major structures of the eye.
Retina
Optic Nerve
Fovea
Lens
Cornea
Iris
Pupil
August 22, 2012

PSY 336 - Receptors 4
The Retina
In this diagram, the two type of receptors (rods and cones) are shown along with the bipolar, ganglion, horizontal and amacrine cells.
August 22, 2012

PSY 336 - Receptors 5
Optic Nerve and Visual Pathway
The left half of each retina ends up on the left side of the brain. The right half to the right side. The optic nerve projects to the superior colliculus and the lateral geniculate nucleus, which projects to visual cortex.
August 22, 2012

PSY 336 - Receptors 6
Visual Cortex From the visual cortex, connections follow two routes. The Dorsal Pathways project to the parietal lobe. The Ventral Pathways project to the temporal lobe.
Temporal Lobe
Parietal Lobe
Occipital Lobe Primary Visual Cortex
Dorsal Pathway
Ventral Pathway
August 22, 2012

PSY 336 - Receptors 7
First Step - Focusing Light
The cornea and the lens, together, bend light rays entering the eye to focus the light on the retina (on the receptors).
The eye must adjust for:
1. Distance. The lens is able to adjust in thickness (via muscles). To focus on far objects, the muscles relax. To focus on near objects, the muscles tighten and cause the lens to become thicker. This bends the light more, focusing it on the retina. See the next diagram.
2. Light intensity. This is done by enlarging or contracting the pupil (has a small effect) and by adaptation (a chemical process) in the retina.
August 22, 2012

PSY 336 - Receptors 8
Focus
Far object - Eye relaxed
Near object - Eye relaxed
With the lens relaxed, the light from the object is not bent enough to focus on the retina
August 22, 2012

PSY 336 - Receptors 9
Focus (cont)
Near object – Lens “tensed”
Accommodation – Muscles tense the lens and make it thicker. The lens bends light more and the close object is now focused on the retina.
August 22, 2012

PSY 336 - Receptors 10
Receptors - Types and Distribution
There are about 120 million rods and 6 million cones in the retina. Most cones and all rods are in the visual periphery. The fovea (the area that an image falls on when you look at it) has only cones. This central 2 degrees of the retina has about 50,000 cones.
There are three types of cones. Each is sensitive to a different range of wavelengths. The cones are responsible for color vision.
There is one type of rod. Vision by the rods is monochromatic (black to grey to white).
The accompanying graphs show the distribution of rods and cones in the retina. August 22, 2012

August 22, 2012 PSY 336 - Receptors 11

August 22, 2012 PSY 336 - Receptors 12
The blind spot has no receptors. All of the ganglion cell axons leave the eye at this location forming the optic nerve.

PSY 336 - Receptors 13
Transduction Transduction is the process of converting light into neural (chemical, electrical) activity. Each receptor has a molecule called visual pigment that consists of retinal and opsin. When light is absorbed by the visual pigment, the shape of the retinal changes. This change in shape triggers chemical activity that leads to electrical activity in the cell.
Receptor cells have a graded output. The more light absorbed, the greater their output.
Once visual pigment absorbs light, it breaks apart and must be regenerated (re-assembled).
August 22, 2012

PSY 336 - Receptors 14
Transduction - 2
The primary means by which the eye adapts to light intensity is the breakdown (bleaching) and regeneration of visual pigment.
In the dark, there is little light. This causes little visual pigment to break down so plenty is available to absorb more light while the bleached pigment regenerates. This maintains a high level of sensitivity (dark adaptation).
In bright light, much of the pigment bleaches out. As it is regenerated, it bleaches out again. This limits the electrical activity in the receptors (light adaptation), but allows you to see in bright light.
August 22, 2012

PSY 336 - Receptors 15
Transduction - 3
Finally, it takes more light to stimulate the cones, less to stimulate the rods. Humans have, in essence, two receptor systems. A low light level (night vision) rod system and a high light level (daylight) cone system.
August 22, 2012

PSY 336 - Receptors 16
Dark Adaptation Graph
Time in dark (minutes)
10 20
Thre
shol
d
high
low
0 30
August 22, 2012

PSY 336 - Receptors 17
Light and Dark Adaptation
We can measure the rate of regeneration of visual pigment. The rate of cone dark adaptation matches the rate at which cone visual pigment is regenerated. The rate of rod dark adaptation matches the rate at which rod visual pigment regenerates.
August 22, 2012

PSY 336 - Receptors 18
Spectral sensitivity
We can also measure the sensitivity of the receptors to different wavelengths of light. This is spectral sensitivity. The graph below shows the sensitivity of the rods.
400 700 500 600 Wavelength
low
high
sens
itivi
ty
August 22, 2012
PSY 336 - Receptors 19
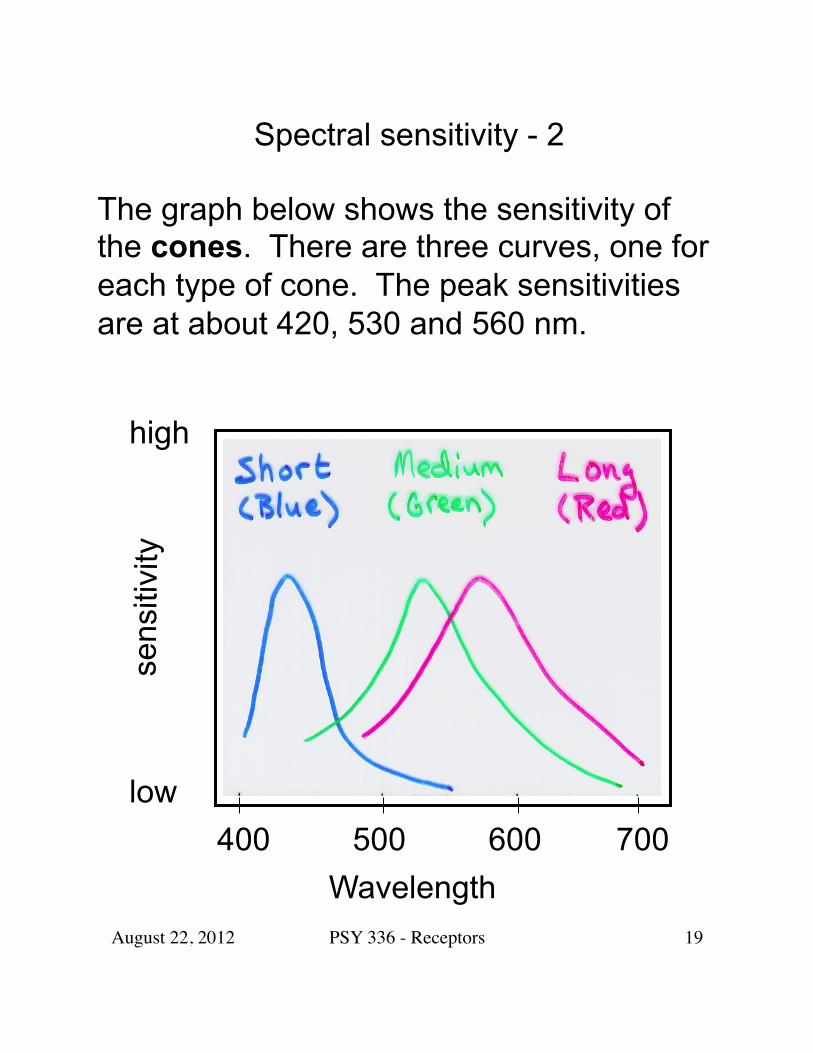
Spectral sensitivity - 2
The graph below shows the sensitivity of the cones. There are three curves, one for each type of cone. The peak sensitivities are at about 420, 530 and 560 nm.
400 700 500 600 Wavelength
low
high
sens
itivi
ty
August 22, 2012

PSY 336 - Receptors 20
Neural Information Processing in the Retina
In describing the coding of visual information by cells in the retina, it will help to draw possible neural wiring diagrams. These symbols will be used:
Receptor cell
Cell Body
Nerve Fiber
Inhibitory Synapse
Excitatory Synapse
August 22, 2012

PSY 336 - Receptors 21
A linear circuit
1 2 3 4 5 6 7
B
0
2
4
6
4 3-5 2-6 1-7Receptors Stimulated
August 22, 2012

PSY 336 - Receptors 22
A convergence circuit
1 2 3 4 5 6 7
B
0
2
4
6
4 3-5 2-6 1-7Receptors Stimulated
August 22, 2012

PSY 336 - Receptors 23
A center-surround circuit
1 2 3 4 5 6 7
B
0
2
4
6
4 3-5 2-6 1-7Receptors Stimulated
lateral inhibition
August 22, 2012

PSY 336 - Receptors 24
Circuit Comparison
The linear circuit passes the excitation of individual receptors to individual following cells. Thus, this circuit can distinguish between two adjacent points of light.
The convergence circuit sums the excitation across the 7 receptors. Thus, a weak light spread across the receptors yields a strong response. This circuit can NOT distinguish which receptor was stimulated.
The center-surround circuit gives a maximal response to a spot of light. It sums excitation in the center but subtracts excitation from the surround.
August 22, 2012

PSY 336 - Receptors 25
Ganglion Cells
There are 120 million rods and 6 million cones that converge to 1 million ganglion cells in each retina.
In the fovea, the convergence is 1 to 1.
For cones outside the fovea, the convergence averages about 7 to 1.
For rods, the convergence averages over 120 to 1.
We can determine some of the nature of the neural wiring in the retina by recording the electrical activity in individual ganglion cell axons.
August 22, 2012

PSY 336 - Receptors 26
Ganglion Cell Receptive Fields
First, note that for every point on the screen in front of our animal subject, there is a corresponding point on the retina.
On the screen in the next figure, we show different locations where we can project a small spot of light. In the lower graph, the firing pattern for the ganglion cell where our electrode has been placed is shown.
In the small area marked B, if a light is shown, the cell responds with a burst of firing. In the area around B, marked C, the cell does not fire while the light is on, but does respond with a burst of firing when the light is turned off.
Any where else we shine the light (A) produces no change in the ganglion cell activity.
August 22, 2012

PSY 336 - Receptors 27
Ganglion Cell Figure 1
C B +
- - - -
- A
A
A
B
C
On Off
August 22, 2012

PSY 336 - Receptors 28
Ganglion Cell (cont)
The receptive field of this cell appears to be a center-surround type. The diagram below summarizes this field.
++ ++
++
+
- --
--
-- --
In the next figure, the response of the ganglion cell to different size spots of light is shown.
August 22, 2012

PSY 336 - Receptors 29
Ganglion Cell Figure 2
On
On On
On
August 22, 2012

PSY 336 - Receptors 30
Ganglion Cell – (cont)
The activity in the ganglion cell shows a center-surround receptive field. The next figure shows a possible wiring diagram. The Horizontal cells have been left out for simplicity.
August 22, 2012

PSY 336 - Receptors 31
Ganglion Cell Circuit
+ Center - Surround - Surround
lateral inhibition
August 22, 2012

PSY 336 - Receptors 32
Effects of Convergence
If a large number of receptors converge on a single ganglion cell, then the circuit acts like an amplifier. Even if the receptors are only weakly stimulated, their outputs will be summed by the ganglion cell. This allows the circuit to detect weak (dim) light.
The convergence from rods to ganglion cell is 50 to 100 times that of the cones. This is part of why the rods are more sensitive then the cones.
August 22, 2012

PSY 336 - Receptors 33
Rod and Cone Convergence
2 2
Here each receptor receives light that produces a +2 output. The ganglion cells require a +8 input to fire. The rod convergence produces a ganglion cell output. The lack of convergence in the cones produces no ganglion cell output.
Response No Response
August 22, 2012

PSY 336 - Receptors 34
Acuity
Acuity is the ability to see detail. Human acuity is best for images falling on the fovea and gets worse with increasing eccentricity from the fovea.
Acuity is tested with standard characters of a standard size at a standard distance.
August 22, 2012

PSY 336 - Receptors 35
Rod and Cone Acuity
The two points of light fall on different rod receptors, but since they are wired to the same ganglion cell, the circuit registers this as 1 spot of light.
The two spots fall on different cones, which trigger different ganglion cells. The unstimulated cell between indicates that there are 2 spots of light.
August 22, 2012

PSY 336 - Receptors 36
Acuity and Convergence Summary
Convergence - The rods have greater convergence. This amplifies light, making the rods more sensitive. Acuity - The cones, particularly those in the fovea, have little convergence. This makes them better able to distinguish distinct elements of the display (detail or acuity).
August 22, 2012

PSY 336 - Receptors 37
Brightness
In addition to threshold, we can examine the influence of neural wiring in the retina on the perception of brightness and lightness.
First, a demonstration of simultaneous contrast.
August 22, 2012

PSY 336 - Receptors 38
Brightness – (cont)
The small square on the light grey background looks darker than the small square on the dark grey background. However, the two small squares are identical, so why do they look different?
The light background sends lateral inhibition to the ganglion cells receiving input from the small square. This reduces the output for these ganglion cells, causing the small square on the left to look darker.
The dark background sends little lateral inhibition to the small square on the right, so the ganglion cells here have a higher (relative) output.
August 22, 2012

PSY 336 - Receptors 39
Brightness – (cont)
Mach Bands are another example of an illusion that may be explained by lateral inhibition. Here, light and dark bands occur at the edges of uniform grey bands.
The bands are the result of different amounts of inhibition from adjacent light and dark areas. These bands demonstrate an essential property of the center-surround receptive field: it enhances contrast.
August 22, 2012

PSY 336 - Receptors 40
Mach Bands
A B C D
distance
high
low
A B
C D
inte
nsity
high
low
AB
C D
light
ness
distance
August 22, 2012

PSY 336 - Receptors 41
Mach Bands - 2
A B C D
100
-10 -10
80
output
100
-10 -10
100
-10 -2
20
-10 -2
20
-2 -2
20
-2 -2
80 88 8 16 16
August 22, 2012

PSY 336 - Receptors 42
Other Lightness Illusions
Some illusions can not be explained by lateral inhibition and the neural wiring of the retina. They involve depth, and occur at a cortical level. (e.g. See White’s illusion at end of Chapter 3 in text.)
August 22, 2012