Embed Size (px)
Citation preview

C H A P T E R 3
Production and Classificationof Speech Sounds
3.1 IntroductionA simplified view of speech production is given in Figure 3.1, where the speech organs are dividedinto three main groups: the lungs, larynx, and vocal tract. The lungs act as a power supply andprovide airflow to the larynx stage of the speech production mechanism. The larynx modulatesairflow from the lungs and provides either a periodic puff-like or a noisy airflow source to thethird organ group, the vocal tract. The vocal tract consists of oral, nasal, and pharynx cavities,giving the modulated airflow its “color” by spectrally shaping the source. Sound sources canalso be generated by constrictions and boundaries, not shown in Figure 3.1, that are made withinthe vocal tract itself, yielding in addition to noisy and periodic sources, an impulsive airflowsource. We have here idealized the sources in the sense that the anatomy and physiology of thespeech production mechanism does not generate a perfect periodic, impulsive, or noise source.1
Following the spectral coloring of the source by the vocal tract, the variation of air pressure atthe lips results in a traveling sound wave that the listener perceives as speech.
There are then three general categories of the source for speech sounds: periodic, noisy,and impulsive, although combinations of these sources are often present. Examples of speechsounds generated with each of these source categories are seen in the word “shop,” where the“sh,” “o,” and “p” are generated from a noisy, periodic, and impulsive source, respectively. Thereader should speak the word “shop” slowly and determine where each sound source is occurring,i.e., at the larynx or at a constriction within the vocal tract.
1 This idealization also assumes a flat (white) noise spectrum. Noise and its white subclass are definedformally in a stochastic signal framework in Chapter 5.
55

Nas
alC
avity
Voc
alT
ract
Lar
ynx
Lun
gs
Ora
lC
avity
Peri
odic
Puf
fs
Pow
erSu
pply
Phar
ynx
Mod
ulat
or
t
t
Noi
se
t
Impu
lse
t
Tra
velin
g So
und
“o”
“p”
“sh”
Sour
ce:
Noi
syPe
riod
icIm
puls
ive
Fig
ure
3.1
Sim
ple
view
ofsp
eech
prod
uctio
n.T
heso
und
sour
ces
are
idea
lized
aspe
riod
ic,i
mpu
lsiv
e,or
(whi
te)
nois
ean
dca
noc
cur
inth
ela
rynx
orvo
calt
ract
.
56

3.2 Anatomy and Physiology of Speech Production 57
Such distinguishable speech sounds are determined not only by the source, but by differentvocal tract configurations, and how these shapes combine with periodic, noisy, and impulsivesources. These more refined speech sound classes are referred to as phonemes, the study ofwhich is called phonemics. A specific phoneme class provides a certain meaning in a word,but within a phoneme class, as we will see in a moment, there exist many sound variations thatprovide the same meaning. The study of these sound variations is called phonetics. Phonemes,the basic building blocks of a language, are concatenated, more or less, as discrete elementsinto words, according to certain phonemic and grammatical rules. This chapter provides aqualitative description of the speech production mechanism and the resulting variety of phoneticsound patterns, and, to a lesser extent, how these sound patterns differ among different speakers.Implications for the design of digital signal processing algorithms will be illustrated. In Chapter4, we refine this qualitative description with more quantitative mathematical models.
In Section 3.2, we first describe the anatomy and physiology of the different organ groupsand show how these organ groups result in source inputs and vocal tract configurations thatcontribute generally to making different speech sounds. Time- and frequency-domain propertiesof the source and its spectral shaping by the vocal tract are illustrated, and these result in a numberof important definitions, such as the pitch and harmonics of a periodic source and the formantsof the vocal tract. In this section, we also elaborate on sound categorization based on sourceonly: periodic, noisy, and impulsive sound sources. In Section 3.3, we deviate and develop thespectrogram, which is a means to illustrate the spectral evolution of a sound; in Chapter 7, thespectrogram will be studied more formally. Having four tools in hand—the time-waveform,spectrogram, source classification, and vocal tract configurations—we then embark in Section3.4 on the study of phonetics. In Section 3.5, we take a wider temporal view of the speechwaveform, i.e., across phonetic boundaries of individual speech sounds, and study the prosodicsof speech, which is the rhythm (timing of the phonemes) and intonation (changing pitch of thesource) over phrases and sentences. In Section 3.6, we give a flavor for the perceptual aspectof phonetics, i.e., how the auditory system might perceive a speech sound, and how variousproperties of sound production are important in the distinguishing of different speech phonemes.We will see in later chapters how characteristics of speech production, used as perceptual cues,can drive the development and selection of signal processing algorithms.
3.2 Anatomy and Physiology of Speech Production
Figure 3.2 shows a more realistic view of the anatomy of speech production than was shown inFigure 3.1. We now look in detail at this anatomy, as well as at the associated physiology andits importance in speech production.
3.2.1 Lungs
One purpose of the lungs is the inhalation and exhalation of air. When we inhale, we enlarge thechest cavity by expanding the rib cage surrounding the lungs and by lowering the diaphragm thatsits at the bottom of the lungs and separates the lungs from the abdomen; this action lowers theair pressure in the lungs, thus causing air to rush in through the vocal tract and down the trachea

58 Production and Classification of Speech Sounds Chap. 3
Palate
Nasal Cavity
Vocal Tract
Larynx
Lungs
Tongue
False Vocal Cords
True Vocal Cords
Trachea
Rib Cage
Diaphragm
Oral cavity
Velum
Pharynx
Epiglottis
Esophagus
Abdomen
Lips
Figure 3.2 Cross-sectional view of the anatomy of speech production.
into the lungs. The trachea, sometimes referred to as the “windpipe,” is about a 12-cm-longand 1.5–2-cm-diameter pipe which goes from the lungs to the epiglottis. The epiglottis is asmall mass, or “switch,” which, during swallowing and eating, deflects food away from enteringthe trachea. When we eat, the epiglottis falls, allowing food to pass through a tube called theesophagus and into the stomach. When we exhale, we reduce the volume of the chest cavity bycontracting the muscles in the rib cage, thus increasing the lung air pressure. This increase inpressure then causes air to flow through the trachea into the larynx. In breathing, we rhythmicallyinhale to take in oxygen, and exhale to release carbon dioxide.
During speaking, on the other hand, we take in short spurts of air and release them steadilyby controlling the muscles around the rib cage. We override our rhythmic breathing by makingthe duration of exhaling roughly equal to the length of a sentence or phrase. During this timedexhalation, the lung air pressure is maintained at approximately a constant level, slightly aboveatmospheric pressure, by steady slow contraction of the rib cage, although the air pressure variesaround this level due to the time-varying properties of the larynx and vocal tract.
3.2.2 Larynx
The larynx is a complicated system of cartilages, muscles, and ligaments2 whose primarypurpose, in the context of speech production, is to control the vocal cords or vocal
2 Some definitions useful throughout this chapter are: (1) muscles are tissue that contract when stimulated;(2) cartilage is rigid, yet elastic bony tissue, but not as hard as bone, helping to support organs in place; (3)ligaments are tough bands of tissue that connect bones to bones and also support organs in place.

3.2 Anatomy and Physiology of Speech Production 59
folds3[10]. The vocal folds are two masses of flesh, ligament, and muscle, which stretch betweenthe front and back of the larynx, as illustrated in Figure 3.3. The folds are about 15 mm longin men and 13 mm long in women. The glottis is the slit-like orifice between the two folds.The folds are fixed at the front of the larynx where they are attached to the stationary thyroidcartilage. The thyroid cartilage is located at the front (or Adam’s apple) and sides of the larynx.The folds are free to move at the back and sides of the larynx; they are attached to the twoarytenoid cartilages that move in a sliding motion at the back of the larynx along with the cricoidcartilage. The size of the glottis is controlled in part by the arytenoid cartilages, and in part bymuscles within the folds. Another important property of the vocal folds, in addition to the sizeof the glottis, is their tension. The tension is controlled primarily by muscle within the folds,as well as the cartilage around the folds. The vocal folds, as well as the epiglottis, close duringeating, thus providing a second protection mechanism. The false vocal folds, above the vocalfolds (Figure 3.2), provide a third protection. They also extend from the Adam’s apple to thearytenoids. They can be closed and they can vibrate, but they are likely open during speechproduction [4]. We see then that a triple barrier is provided across the windpipe through theaction of the epiglottis, the false vocal folds, and the true vocal folds. All three are closed duringswallowing and wide open during breathing.
There are three primary states of the vocal folds: breathing, voiced, and unvoiced. Inthe breathing state, the arytenoid cartilages are held outward (Figure 3.3b), maintaining a wideglottis, and the muscles within the vocal folds are relaxed. In this state, the air from the lungs flowsfreely through the glottis with negligible hindrance by the vocal folds. In speech production,on the other hand, an obstruction of airflow is provided by the folds. In the voicing state, as,for example, during a vowel, the arytenoid cartilages move toward one another (Figure 3.3a).The vocal folds tense up and are brought close together. This partial closing of the glottis andincreased fold tension cause self-sustained oscillations of the folds. We can describe how thisoscillation comes about in three steps [10] (Figure 3.4a).
Front
ThyroidCartilage
ArytenoidCartilage
CricoidCartilage
(a) (b)
VocalFolds
GlottalSlit
Figure 3.3 Sketches of downward-looking view of the human larynx: (a) voicing; (b)breathing.
SOURCE: K.N. Stevens, Acoustic Phonetics, The MIT Press [33]. ©1998, Massachusetts
Institute of Technology. Used by permission.
3 The more accurate term is “vocal folds,” since the masses are actually not cords. The term “vocal cords”originated with an early erroneous anatomical study [30]. Although we use the term “vocal folds” more often,we apply the two terms interchangeably throughout the text.

60 Production and Classification of Speech Sounds Chap. 3
LookingDownward
Step 1 Step 2
Vocal Folds
Step 3
Step 1 Step 2 Step 3
Step 4 Step 5 Step 6
(a)
(b)
Figure 3.4 Bernoulli’s Principle in the glottis: (a) basic horizontal open/closevoicing cycle; (b) refinement of (a) with vertical vocal fold motion. Vertical linesrepresent airflow in the direction of the arrows.
Suppose the vocal folds begin in a loose and open state. The contraction of the lungsfirst results in air flowing through the glottis. According to a fluid dynamic property calledBernoulli’s Principle, as the airflow velocity (i.e., the velocity of air particles) increases, localpressure in the region at the glottis decreases. At the same time, tension in the vocal foldsincreases. This increase in tension of the folds, together with the decrease in pressure at theglottis, causes the vocal folds to close shut abruptly. Air pressure then builds behind the vocalfolds as the lungs continue to contract, forcing the folds to open. The entire process then repeatsand the result is periodic “puffs” of air that enter the vocal tract.
Thus far, we have illustrated the vocal folds as vibrating horizontally, perpendicular tothe tracheal wall. The vocal fold movement, however, is generally not so simple. For example,both horizontal and vertical movement of the folds may occur simultaneously, as illustrated inFigure 3.4b. During the time when the glottis is open, because the lower parts of the fleshyfolds are more flexible than the upper parts, there is a time delay between the closing of thetwo regions, as seen in Steps 1–3 of Figure 3.4b. Additional vertical movement then occursbecause there is also a time delay between the opening of the two regions. When the air pressurebelow the glottis increases during the time when the glottis closes, the lower region of the foldsis first pushed up, followed by the upper region, as seen in Steps 4–6. Such complexity hasled to a nonlinear two-mass model [11] (Figure 3.5), as well as more elaborate nonlinear multi-component models describing various modes of vibration along the folds themselves [39]. Themassesmk , nonlinear spring constants sk , and damping constants τk in such mechanical modelscorrespond, respectively, to the masses, tensions, and resistances within the vocal folds and thesurrounding cartilage.
According to our description of the airflow velocity in the glottis, if we were to measure theairflow velocity at the glottis as a function of time, we would obtain a waveform approximately

3.2 Anatomy and Physiology of Speech Production 61
Vocal TractTrachea
VocalCords
s2s1
m1
m1
m2
m2
τ2τ1
s2s1 τ2τ1
Figure 3.5 Two-mass mechanical model of Flanagan and Ishizaka with massesm1 and m2 , resistances τ1 and τ2 , and spring constants s1 and s2 .
SOURCE: J.L. Flanagan and K. Ishizaka, “Computer Model to Characterize the Air
Volume Displaced by the Vibrating Vocal Cords” [11]. ©1978, Acoustical Society
of America. Used by permission.
similar to that illustrated in Figure 3.6 that roughly follows the time-varying area of the glottis.Typically, with the folds in a closed position, the flow begins slowly, builds up to a maximum,and then quickly decreases to zero when the vocal folds abruptly shut. The time interval duringwhich the vocal folds are closed, and no flow occurs, is referred to as the glottal closed phase;the time interval over which there is nonzero flow and up to the maximum of the airflow velocityis referred to as the glottal open phase, and the time interval from the airflow maximum to thetime of glottal closure is referred to as the return phase. The specific flow shape can changewith the speaker, the speaking style, and the specific speech sound. In some cases, the folds donot even close completely, so that a closed phase does not exist. For simplicity throughout thistext, we will often refer to the glottal airflow velocity as simply the glottal flow.
The time duration of one glottal cycle is referred to as the pitch period and the reciprocalof the pitch period is the corresponding pitch, also referred to as the fundamental frequency.The term “pitch” might lead to some confusion because the term is often used to describe thesubjectively perceived “height” of a complex musical sound even when no single fundamentalfrequency exists. In this text, however, we use the term in the above strict sense, i.e., pitch issynonomous with fundamental frequency. In conversational speech, during vowel sounds, we

62 Production and Classification of Speech Sounds Chap. 3
Open Phase Return PhaseClosedPhase
Pitch Period
1000
0.5
1.5
1
2
15 20Time (ms)
25 30
Am
plitu
de
Figure 3.6 Illustration of periodic glottal airflow velocity.
might see typically one to four pitch periods over the duration of the sound, although, as we willsee in the discussion of prosodics, the number of pitch periods changes with numerous factorssuch as stress and speaking rate. The rate at which the vocal folds oscillate through a closed,open, and return cycle is influenced by many factors. These include vocal fold muscle tension(as the tension increases, so does the pitch), the vocal fold mass (as the mass increases, thepitch decreases because the folds are more sluggish), and the air pressure behind the glottis inthe lungs and trachea, which might increase in a stressed sound or in a more excited state ofspeaking (as the pressure below the glottis increases, so does the pitch). The pitch range is about60 Hz to 400 Hz. Typically, males have lower pitch than females because their vocal folds arelonger and more massive.
A simple mathematical model of the glottal flow is given by the convolution of a periodicimpulse train with the glottal flow over one cycle. The following example shows glottal flowwaveforms with different shapes and pitch periods, as well as how the simple convolutionalmodel lends insight into the spectral nature of the glottal airflow.
EXAMPLE 3.1 Consider a glottal flow waveform model of the form
u[n] = g[n] ∗ p[n] (3.1)
where g[n] is the glottal flow waveform over a single cycle and p[n] = ∑∞k=−∞ δ[n − kP ] is
an impulse train with spacing P. Because the waveform is infinitely long, we extract a segment bymultiplying x[n] by a short sequence called an analysis window or simply a window. The window,denoted by w[n, τ ], is centered at time τ , as illustrated in Figure 3.7, and the resulting waveformsegment is written as
u[n, τ ] = w[n, τ ](g[n] ∗ p[n]).
Using the Multiplication and Convolution Theorems of Chapter 2, we obtain in the frequency domain
U(ω, τ) = 1
PW(ω, τ) ©∗
[ ∞∑k=−∞
G(ω)δ(ω − ωk)
]

3.2 Anatomy and Physiology of Speech Production 63
~ ~~ ~
~ ~~ ~
~ ~~ ~
(b)
(c)
(a)
w[n, τ]
g[n]
U(ω, τ) U(ω, τ)
U(ω, τ)
W(ω – ωk)
ωk ω
u[n] u[n]
u[n]
τ n
n
n
n
G(ω)
0 0
0
ω1 ω1
ω1 ω2
ω2 ω3ω2 ωπ ωπ
ωπ
Figure 3.7 Illustration of periodic glottal flow in Example 3.1: (a) typical glottal flow and its spectrum;(b) same as (a) with lower pitch; and (c) same as (a) with “softer” or more “relaxed” glottal flow.
= 1
P
∞∑k=−∞
G(ωk)W(ω − ωk, τ )
where W(ω, τ) is the Fourier transform of w[n, τ ], where G(ω) is the Fourier transform of g[n],where ωk = 2π
Pk , and where 2π
Pis the fundamental frequency or pitch. As illustrated in Figure
3.7, the Fourier transform of the window sequence is characterized by a narrow main lobe centeredat ω = 0 with lower surrounding sidelobes. The window is typically selected to trade off the widthof the mainlobe and attenuation of the sidelobes. Figure 3.7 illustrates how the Fourier transformmagnitude of the waveform segment changes with pitch and with characteristics of the glottal flow.As the pitch period decreases, the spacing between the frequencies ωk = 2π
Pk , which are referred to
as the harmonics of the glottal waveform, increases, as can be seen by comparing Figures 3.7a and3.7b. The first harmonic is also the fundamental frequency, and the other harmonics occur at integer

64 Production and Classification of Speech Sounds Chap. 3
multiples of the fundamental frequency. Located at each harmonic is a translated window Fouriertransform W(ω− ωk) weighted by G(ωk); as the pitch changes, the harmonics can be thought of assliding under G(ω). As the glottal flow over a cycle becomes more smooth, i.e., a gradual rather thanan abrupt closing, then the “spectral shaping” by G(ω) of the harmonically-spaced window Fouriertransforms becomes more lowpass, as seen by comparing Figures 3.7a and 3.7c. We can see, based onthese sliding and spectral shaping properties, why the magnitude of the spectral shaping function, inthis case |G(ω)|, is sometimes referred to as a spectral envelope of the harmonics.
We saw in the previous example that the Fourier transform of the periodic glottal waveformis characterized by harmonics. Typically, the spectral envelope of the harmonics, governedby the glottal flow over one cycle, has, on the average, a −12 dB/octave rolloff, although thischanges with the specific nature of the airflow and the speaker characteristics. With more forcefulspeaking, for example, the glottal closure may be more abrupt (e.g., Figure 3.7a, b) with perhapsan average −9 dB/octave slope being more typical [29]. In more “relaxed” voicing, the vocalfolds do not close as abruptly, and the glottal waveform has more rounded corners (e.g., Figure3.7c), with an average −15 dB/octave rolloff, typically. Exercise 3.18 explores some specificcases. The model in Example 3.1 is ideal in the sense that, even for sustained voicing—i.e., avowel uttered by a speaker trying to hold steady pitch and vocal tract shape—a fixed pitch periodis almost never maintained in time but can randomly vary over successive periods, a characteristicreferred to as pitch “jitter.” In addition, the amplitude of the airflow velocity within a glottalcycle may differ across consecutive pitch periods, even in a sustained vowel, a characteristiccalled amplitude “shimmer.” These variations are due, perhaps, to time-varying characteristicsof the vocal tract and vocal folds. Pitch jitter and shimmer, however, have also been speculatedto be due to nonlinear behavior in the speech anatomy whereby successive cyclic variations mayalternate on each glottal cycle [38] or may appear random while being the result of an underlyingdeterministic (chaotic) system [15]. The jitter and shimmer over successive pitch periods helpgive the vowel its naturalness, in contrast to a monotone pitch and fixed amplitude that can resultin a machine-like sound. In addition to naturalness, however, the extent and form of jitter andshimmer can contribute to voice character. A high degree of jitter, for example, results in avoice with a hoarse quality which can be characteristic of a particular speaker or can be createdunder specific speaking conditions such as with stress or fear. The time- and frequency-domainproperties of this condition are further studied in Exercise 3.2.
We have described two states of the vocal folds: breathing and voicing. The last state ofthe vocal folds is unvoicing. This state is similar to the breathing state in there being no vocal foldvibration. In the unvoiced state, however, the folds are closer together and more tense than in thebreathing state, thus allowing for turbulence to be generated at the folds themselves. Turbulenceat the vocal folds is called aspiration. Aspiration occurs in normal speech as with “h” in theword “he.” Such sounds are sometimes called “whispered” sounds because turbulence is alsocreated at the vocal folds when we whisper. Whispering is not simply a reduction in volume,because when we whisper the vocal folds do not oscillate. In certain voice types, aspirationoccurs normally simultaneously with voicing, resulting in the breathy voice, by maintainingpart of the vocal folds nearly fixed and somewhat open to produce turbulence and part of thevocal folds in oscillation. Nevertheless, aspiration occurs to some extent in all speakers and theamount of aspiration may serve as a distinguishing feature. The physiological change, then, in

3.2 Anatomy and Physiology of Speech Production 65
creating the breathy voice is distinctly different from that of the hoarse voice which, as we sawearlier, is associated with pitch jitter. Figure 3.8 shows a comparison of vocal fold configurationsfor aspiration (whispering), voicing, and aspirated voicing.
There are also other forms of vocal fold movement that do not fall clearly into any ofthe three states of breathing, voicing, or unvoicing. We point out these different voice typesbecause, as we will see, they can pose particularly large challenges in speech signal processingand, contrary to being “idiosyncratic,” they occur quite often. One such state of the vocal foldsis the creaky voice where the vocal folds are very tense, with only a short portion of the foldsin oscillation, resulting in a harsh-sounding voice with a high and irregular pitch. (Look aheadto Figure 10.15b.) In vocal fry, on the other hand, the folds are massy and relaxed with anabnormally low and irregular pitch [27],[40], which is characterized by secondary glottal pulsesclose to and overlapping the primary glottal pulse within the open phase, as illustrated in Figure3.9a. We use the term “glottal pulse” loosely in this chapter to mean a glottal airflow velocitywaveform over a single glottal cycle. In vocal fry, the true vocal folds may couple with the falsevocal folds, producing the secondary glottal pulses. Vocal fry occurs even in the normal voiceat the end of a phrase or word where the muscles of the larynx relax and the lung pressure isdecreasing. Another atypical voice type is the diplophonic voice where again secondary glottalpulses occur between the primary pulses but within the closed phase, away from the primarypulse [18], as illustrated in Figure 3.9b. Diplophonia often occurs as extra flaps in low-pitchspeakers and, as with vocal fry, in normal voices at the end of a phrase or word.4 An exampleof a low-pitch diplophonic voice is provided later, in Figure 3.16. In the diplophonic and vocalfry voice types, a simple model in discrete time for the occurrence of a secondary glottal pulseis given by the modified glottal flow waveform g[n] = g[n] + αg[n− no], where g[n] is theprimary glottal pulse, where no is the spacing5between the primary and secondary glottal pulses,and α is an attenuation factor on the secondary pulse. We assume here the same shape of the
(a) (b) (c)
Figure 3.8 Sketches of various vocal fold configurations: (a) aspiration (whispering), (b) voicing, and(c) aspirated voicing. Arrows indicate vocal fold vibration, while ragged lines indicate turbulence.
4 Pitch period doubling also often occurs at the end of a phrase or word where the vocal cords are relaxed.In Figure 3.13, the “o” in “to” shows this phenomenon.
5 We assume that the spacing in continuous time is to = noT (with T being the sampling interval) so thatin discrete time the spacing is represented by the integer no .

66 Production and Classification of Speech Sounds Chap. 3
2
1.5
0.5
00 10 15 20
Time (ms)
(a)
25 30
1
2
1.5
0.5
00 10 15 20
Time (ms)
(b)
25 30
1
Am
plitu
deA
mpl
itude
Figure 3.9 Illustration of secondary-pulse glottal flow: (a) vocal fry; (b) diplophonia.
secondary and primary glottal pulses, but generally they may differ. The presence of αg[n−no]introduces zeros into the z-transform of the glottal waveform (Exercise 3.3). Other abnormalvoice types include the falsetto voice where there occurs extreme swings in vocal fold tensionand relaxation allowing for abnormally large pitch fluctuations. Some speakers, especially inthe singing voice, may regularly induce a rapid pitch modulation, referred to as pitch vibrato,over a smaller range to give the utterance more flavor or musicality. We will see examples ofsome of these voice types throughout the text.
3.2.3 Vocal Tract
The vocal tract is comprised of the oral cavity from the larynx to the lips and the nasal passagethat is coupled to the oral tract by way of the velum. The oral tract takes on many differentlengths and cross-sections by moving the tongue, teeth, lips, and jaw and has an average lengthof 17 cm in a typical adult male and shorter for females, and a spatially-varying cross section ofup to 20 cm2. If we were to listen to the pressure wave at the output of the vocal folds duringvoicing, we would hear simply a time-varying buzz-like sound which is not very interesting.One purpose of the vocal tract is to spectrally “color” the source, which is important for makingperceptually distinct speech sounds. A second purpose is to generate new sources for soundproduction.

3.2 Anatomy and Physiology of Speech Production 67
Spectral Shaping — Under certain conditions, the relation between a glottal airflow velocityinput and vocal tract airflow velocity output can be approximated by a linear filter with reso-nances, much like resonances of organ pipes and wind instruments. The resonance frequenciesof the vocal tract are, in a speech science context, called formant frequencies or simply formants.The word “formant” also refers to the entire spectral contribution of a resonance so we oftenuse the phrases “formant bandwidth” and “formant amplitude” (at the formant frequency). For-mants change with different vocal tract configurations. With different vowels, for example, thejaw, teeth, lips, and tongue, are generally in different positions. Panel (a) of Figure 3.10 showsthe tongue hump high in the front and back of the palate (upper wall of mouth), each positioncorresponding to different resonant cavities and thus different vowels.
The peaks of the spectrum of the vocal tract response correspond approximately to itsformants. More specifically, when the vocal tract is modeled as a time-invariant all-pole linearsystem then, as we will see in Chapter 4, a pole at zo = roe
jωo corresponds approximately toa vocal tract formant. The frequency of the formant is at ω = ωo and the bandwidth of theformant is determined by the distance of the pole from the unit circle (ro ). Because the poles ofa real sequence typically occur in complex conjugate pairs (except for the case of a pole fallingon the real axis), only the positive frequencies are used in defining the formant frequencies, andthe formant bandwidth is computed over positive frequencies using, for example, the definitionsof bandwidth in Chapter 2. Under the linear time-invariant all-pole assumption, each vocal tractshape is characterized by a collection of formants. Because the vocal tract is assumed stable withpoles inside the unit circle, the vocal tract transfer function can be expressed either in productor partial fraction expansion form:
H(z) = A∏Nik=1(1 − ckz−1)(1 − c∗kz−1)
=Ni∑k=1
A
(1 − ckz−1)(1 − c∗kz−1)(3.2)
(b) (c)(a)
Vowel Plosive Fricative
Figure 3.10 Illustration of changing vocal tract shapes for (a) vowels (having aperiodic source), (b) plosives (having an impulsive source), and (c) fricatives (havinga noise source).

68 Production and Classification of Speech Sounds Chap. 3
where (1 − ckz−1) and (1 − c∗kz
−1) are complex conjugate poles inside the unit circle with|ck| < 1. The formants of the vocal tract are numbered from the low to high formants accordingto their location; the first formant is denoted by F1 , the second formant by F2 , and so on upto the highest formant. Generally, the frequencies of the formants decrease as the vocal tractlength increases; as a consequence, a male speaker tends to have lower formants than a female,and a female has lower formants than a child. Under a vocal tract linearity and time-invarianceassumption, and when the sound source occurs at the glottis, the speech waveform, i.e., theairflow velocity at the vocal tract output, can be expressed as the convolution of the glottal flowinput and vocal tract impulse response, as illustrated in the following example:
EXAMPLE 3.2 Consider a periodic glottal flow source of the form
u[n] = g[n] ∗ p[n]
where g[n] is the airflow over one glottal cycle and p[n] is the unit sample train with spacing P .When the sequence u[n] is passed through a linear time-invariant vocal tract with impulse responseh[n], the vocal tract output is given by
x[n] = h[n] ∗ (g[n] ∗ p[n]).
A window centered at time τ , w[n, τ ], is applied to the vocal tract output to obtain the speech segment
x[n, τ ] = w[n, τ ]h[n] ∗ (g[n] ∗ p[n]).
Using the Multiplication and Convolution Theorems of Chapter 2, we obtain in the frequency domainthe Fourier transform of the speech segment
X(ω, τ) = 1
PW(ω, τ) ©∗
[H(ω)G(ω)
∞∑k=−∞
δ(ω − ωk)
]
= 1
P
∞∑k=−∞
H(ωk)G(ωk)W(ω − ωk, τ )
where W(ω, τ) is the Fourier transform of w[n, τ ], where ωk = 2πPk , and where 2π
Pis the funda-
mental frequency or pitch. Figure 3.11 illustrates that the spectral shaping of the window transformsat the harmonics ω1 , ω2 , . . . ωN is determined by the spectral envelope |H(ω)G(ω)| consistingof a glottal and vocal tract contribution, unlike in Example 3.1, where only the glottal contributionoccurred. The peaks in the spectral envelope correspond to vocal-tract formant frequencies, F1 , F2 ,. . . FM . The general upward or downward slope of the spectral envelope, sometimes called the spec-tral tilt, is influenced by the nature of the glottal flow waveform over a cycle, e.g., a gradual or abruptclosing, and by the manner in which formant tails add. We also see in Figure 3.11 that the formantlocations are not always clear from the short-time Fourier transform magnitude |X(ω, τ)| because ofsparse sampling of the spectral envelope |H(ω)G(ω)| by the source harmonics, especially for highpitch.

3.2 Anatomy and Physiology of Speech Production 69
~ ~~ ~
H(ω) G(ω)
ω1 ω2 π ωFNF2F1
X(ω, τ)A
mpl
itude
Figure 3.11 Illustration of relation of glottal source harmonics ω1 , ω2 , . . . ωN , vocaltract formants F1 , F2 , . . . FM , and the spectral envelope |H(ω)G(ω)|.
This example illustrates the important difference between a formant, or resonance, frequencyand a harmonic frequency. A formant corresponds to the vocal tract poles, while the harmonicsarise from the periodicity of the glottal source. The spectrum of the vocal tract, for a perfectlyperiodic source, is, in essence, sampled at the harmonic frequencies; with this idealized perfectperiodicity, there is spectral information only at the harmonics. In the development of signalprocessing algorithms that require formants, this sparcity of spectral information can perhaps bea detriment to formant estimation. In some situations, on the other hand, the spectral samplingat harmonics can be exploited to enhance perception of a sound, as in the singing voice.
EXAMPLE 3.3 A soprano singer often sings a tone whose first harmonic (fundamental fre-quency ω1) is much higher than the first formant frequency (F1) of the vowel being sung [37]. Asshown in Figure 3.12, when the nulls of the vocal tract spectrum are sampled at the harmonics, theresulting sound is weak, especially in the face of competing instrumentals. To enhance the sound,the singer creates a vocal tract configuration with a widened jaw which increases the first formantfrequency (Exercise 3.4), and can match the frequency of the first harmonic, thus generating a loudersound6 [37] (Figure 3.12). In training, the singer is asked to “Hear the next tone within yourself beforeyou start to sing it” because a widening of the jaw requires some articulatory anticipation [37].
We have seen that the nasal and oral components of the vocal tract are coupled by the velum.When the vocal tract velum is lowered, introducing an opening into the nasal passage, and theoral tract is shut off by the tongue or lips, sound propagates through the nasal passage and outthrough the nose. The resulting nasal sounds, e.g., “m” as in “meet,” have a spectrum thatis dominated by low-frequency formants of the large volume of the nasal cavity. Because thenasal cavity, unlike the oral tract, is essentially constant, characteristics of nasal sounds may
6 A singer will also lower his/her larynx in such a way as to introduce a new high-frequency formantbetween 2500–3000 Hz, a frequency region where the background instrumental is low, to help further enhancethe sound [37].

70 Production and Classification of Speech Sounds Chap. 3
Frequency
Frequency
Am
plitu
de
First Formant
First Formant
Fundamental
Fundamental
Am
plitu
de
Figure 3.12 Illustration of formant movement to enhance the singing voice of asoprano: (a) first harmonic higher than first formant frequency; (b) first formant matchedto first harmonic frequency.
SOURCE: J. Sundberg, “The Acoustics of the Singing Voice” [37]. ©1977, Laszlo Kubinyi
and Gabor Kiss. Used by permission.
be particularly useful in speaker identifiability. The velum can be lowered even when the oraltract is open. When this coupling occurs, we obtain a nasalized vowel. One effect of the nasalpassage is that the formant bandwidths of the oral tract become broader because of loss of energythrough the nasal passage. A second effect is the introduction of anti-resonances, i.e., zeros, inthe vocal tract transfer function due to the absorption of energy at the resonances of the nasalpassage [29].
The previous discussion has assumed a linear time-invariant vocal tract. Formants, how-ever, are time-varying because the vocal tract changes in time. Although the vocal tract isalmost time-invariant for steady-state sounds, as with a sustained vowel, in normal conversa-tional speech the vocal tract is continuously and significantly changing. This time-variation willinfluence signal analysis techniques. We will return to this speech production characteristic inthe discussion of transitional speech sounds.
Source Generation — We have seen that different vocal tract shapes correspond to differentresonant cavities; different vocal tract shapes can also result in different sound sources. Thepanel (b) of Figure 3.10 shows a complete closure of the tract, the tongue pressing against thepalate, required in making an impulsive sound source. There is a build-up of pressure behindthe closure and then an abrupt release of pressure. Panel (c) shows another sound source created

3.2 Anatomy and Physiology of Speech Production 71
with the tongue close to the palate, but not completely impeded, for the generation of turbulenceand thus a noise source. As with a periodic glottal sound source, a spectral shaping similar to thatdescribed in Example 3.2 also occurs for either type of input, i.e., an impulsive or noise source;this spectral shaping is performed by a resonant vocal tract cavity whose formants change withdifferent vocal tract configurations, such as those illustrated in panels (b) and (c) of Figure 3.10.There is not, however, harmonic structure in the impulsive or noise source spectrum, but ratherthe source spectrum is shaped at all frequencies by |H(ω)|. Keep in mind that we have idealizedthe impulsive and noise sources to have flat spectra; in practice, these sources will themselveshave a non-flat spectral shape.
There is yet one other source type that is generated within the vocal tract, but is lessunderstood than noisy and impulsive sources occurring at oral tract constrictions. This sourcearises from the interaction of vortices with vocal tract boundaries such as the false vocal folds,teeth, or occlusions in the oral tract [1],[38]. The reader may have intuition about the natureof a vortex; for the moment, let’s think of a vortex in the oral tract as a tiny rotational airflow.For voiced speech, the vortices move possibly as a train from the glottis to the lips along theoral tract and are predicted to initiate from the air jet emanating from the glottis during vocalfold vibration [1],[38]. Vortices can also arise during fricative sounds with resulting sourcesdistributed along the oral tract [19]. There is evidence that sources due to vortices influence thetemporal and spectral, and perhaps perceptual, characteristics of speech sounds [1],[19],[38].We delay further discussion of these vortical sound sources until Chapter 11.
3.2.4 Categorization of Sound by Source
There are various ways to categorize speech sounds. For example, we can categorize speechsounds based on different sources to the vocal tract; we have seen that different sources are due tothe vocal fold state, but are also formed at various constrictions in the oral tract. Speech soundsgenerated with a periodic glottal source are termed voiced; likewise, sounds not so generated arecalled unvoiced. There are a variety of unvoiced sounds, including those created with a noisesource at an oral tract constriction. Because the noise of such sounds comes from the frictionof the moving air against the constriction, these sounds are sometimes referred to as fricatives(Figure 3.10c). An example of frication is in the sound “th” in the word “thin” where turbulenceis generated between the tongue and the upper teeth. The reader should hold the “th” sound andfeel the turbulence. A second unvoiced sound class is plosives created with an impulsive sourcewithin the oral tract (Figure 3.10b). An example of a plosive is the “t” in the word “top.” Thelocation of the closed or partial constriction corresponds to different plosive or fricative sounds,respectively. We noted earlier that a barrier can also be made at the vocal folds by partiallyclosing the vocal folds, but without oscillation, as in the sound “h” in “he.” These are whisperedunvoiced speech sounds. These voiced and unvoiced sound categories, however, do not relateexclusively to the source state because a combination of these states can also be made wherebyvocal fold vibration occurs simultaneously with impulsive or noisy sources. For example, with“z” in the word “zebra,” the vocal folds are vibrating and, at the same time, noise is created at avocal tract constriction behind the teeth against the palate. Such sounds are referred to as voicedfricatives in contrast to unvoiced fricatives where the vocal folds do not vibrate simultaneouslywith frication. There also exist voiced plosives as counterparts to unvoiced plosives as with the“b” in the word “boat.” Examples of some of these sound classes are shown in Figure 3.13 inthe sentence, “Which tea party did Baker go to?”

72 Production and Classification of Speech Sounds Chap. 3
Am
plitu
de
Time (s)
“i” “b” “a” “o”“sh” “t”1
0−1
0.00 0.40 0.80 1.20 1.60(a)
Voiced “i” Unvoiced Fricative “sh”1
0−1
0.05 0.10 0.15 0.20 0.25 0.30 0.35(b)
Voiced “a”Voiced Plosive “b”1
0−1
1.12 1.16 1.20 1.24 1.28(c)
Voiced “o”Unvoiced Plosive “t”1
0−1
1.72 1.76 1.80 1.84 1.88 1.92(d)
Figure 3.13 Examples of voiced, fricative, and plosive sounds in the sentence, “Which tea party didBaker go to?”: (a) speech waveform; (b)–(d) magnified voiced, fricative, and plosive sounds from (a).(Note the “sh” is a component of an affricate to be studied in Section 3.4.6.)
This loose classification provides a stepping stone to Section 3.4 where distinctive featuresof these sound classes will be further studied and where we will combine this source catego-rization with different vocal tract configurations to form the more complete classification ofelements of a language.
3.3 Spectrographic Analysis of SpeechWe have seen that a speech waveform consists of a sequence of different events. This time-variation corresponds to highly fluctuating spectral characteristics over time. For example, inthe word “to,” the plosive “t” is characterized by high-frequency energy corresponding to a vocal

3.3 Spectrographic Analysis of Speech 73
tract configured as a short cavity at the front of the oral tract. The “t” is followed by the vowel“o,” which is characterized by low-frequency energy corresponding to a vocal tract configuredas a long cavity along the oral tract. We will show quantitatively in Chapter 4 how such spectralenergy shifts occur with different cavity lengths and cross sections. A single Fourier transformof the entire acoustic signal of the word “to” cannot capture this time-varying frequency content.In contrast, the short-time Fourier transform (STFT) consists of a separate Fourier transform ofpieces of the waveform under a sliding window. We have already introduced this sliding windowin Examples 3.1 and 3.2 and denoted it byw[n, τ ], where τ is the position of the window center.The window is typically tapered at its end (Figure 3.14) to avoid unnatural discontinuities in thespeech segment and distortion in its underlying spectrum. The Hamming window, for example,is given by the sequence w[n, τ ] = 0.54 − 0.4 cos[ 2π(n−τ)
Nw−1 ] for 0 ≤ n ≤ Nw − 1 and zerootherwise, with Nw as the window duration. As we mentioned earlier, the window is typicallyselected to trade off the width of its mainlobe and attenuation of its sidelobes. The effect ofspecific window shapes will be further discussed in Chapter 7. In practice, the window does notnecessarily move one sample at a time, but rather moves at some frame interval consistent withthe temporal structure one wants to reveal.
The Fourier transform of the windowed speech waveform, i.e., the STFT, is given by
X(ω, τ) =∞∑
n=−∞x[n, τ ] exp[−jωn] (3.3)
where
x[n, τ ] = w[n, τ ]x[n]
represents the windowed speech segments as a function of the window center at time τ . Thespectrogram is a graphical display of the magnitude of the time-varying spectral characteristicsand is given by
S(ω, τ) = |X(ω, τ)|2
which can be thought of as a two-dimensional (2-D) “energy density,” i.e., a generalizationof the one-dimensional (1-D) energy density associated with the Fourier transform, describingthe relative energy content in frequency at different time locations, i.e., in the neighborhoodof (ω, τ), as we move, for example, from plosive to voiced to fricative sounds. We will havemore to say about S(ω, τ) as a 2-D energy density in following chapters.7 We could plotS(ω, τ) for each window position τ to represent the spectral time variations, but we wouldsoon run out of space. A more compact time-frequency display of the spectrogram places thespectral magnitude measurements vertically in a three-dimensional mesh or two-dimensionallywith intensity coming out of the page. This later display is illustrated in Figure 3.14 wherethe Fourier transform magnitudes of the segments x[n, τ ] are shown laid out on the 2-D time-frequency grid. The figure also indicates two kinds of spectrograms: narrowband, which givesgood spectral resolution, e.g., a good view of the frequency content of sinewaves with closely
7 The notion of S(ω, τ) as a 2-D energy density follows from the relation∑∞n=−∞ |x[n]|2 = 1
2π∫ π−π
∑∞τ=−∞ |S(ω, τ)|2dω that holds under certain conditions on the window w[n, τ ].

74 Production and Classification of Speech Sounds Chap. 3
x[n]
n
n
n
n
n
τ1 τ2
τ1 τ2
w[n, τ]
w[n, τ]
x[n, τ1] = w[n, τ1] x[n]
X(ω, τ1)
X(ω, τ1)x[n]
X(ω, τ1)
π
π
ω
π ω
π
π
ω
ω
ωHorizontalStriations
Blur Together
Vertical Striations
(a)
(b)
Figure 3.14 Formation of (a) the narrowband and (b) the wideband spectrograms.

3.3 Spectrographic Analysis of Speech 75
spaced frequencies, and wideband, which gives good temporal resolution, e.g., a good viewof the temporal content of impulses closely spaced in time.8 We introduce the two classes ofspectrograms using speech sounds with a voiced source as an example.
For voiced speech, we have approximated the speech waveform as the output of a lin-ear time-invariant system with impulse response h[n] and with a glottal flow input givenby the convolution of the glottal flow over one cycle, g[n], with the impulse train p[n] =∑∞k=−∞ δ[n− kP ]. This results in the windowed speech waveform expressed as
x[n, τ ] = w[n, τ ](p[n] ∗ g[n]) ∗ h[n]= w[n, τ ](p[n] ∗ h[n])
where we have written the glottal waveform over a cycle and vocal tract impulse response aslumped into h[n] = g[n] ∗h[n]. Using the result of Example 3.2, the spectrogram of x[n] cantherefore be expressed as
S(ω, τ) = 1
P 2|
∞∑k=−∞
H (ωk)W(ω − ωk, τ )|2 (3.4)
where
H (ω) = H(ω)G(ω)
and where ωk = 2πPk and 2π
Pis the fundamental frequency.
Narrowband Spectrogram — The difference between the narrowband and wideband spectro-gram is the length of the window w[n, τ ]. For the narrowband spectrogram, we use a “long”window with a duration of typically at least two pitch periods. Under the condition that themain lobes of shifted window Fourier transforms are non-overlapping and that correspondingtransform sidelobes are negligible, Equation (3.4) leads to the approximation
S(ω, τ) ≈ 1
P 2
∞∑k=−∞
|H (ωk)|2|W(ω − ωk, τ )|2. (3.5)
This approximation is left as an exercise (Exercise 3.8). We see then that using a long windowgives a short-time Fourier transform of voiced speech that consists of a set of narrow “harmoniclines,” whose width is determined by the Fourier transform of the window, which are shapedby the magnitude of the product of the glottal flow Fourier transform and vocal tract transferfunction. The narrowband spectrogram gives good frequency resolution because the harmoniclines are “resolved”; these harmonic lines are seen as horizontal striations in the time-frequencyplane of the spectrogram. The long window, however, covers several pitch periods and thusis unable to reveal fine periodicity changes over time; it also smears closely spaced temporal
8 More precise definitions of temporal and spectral resolution are given later in the text. For our purposehere an intuition for the concepts is sufficient.

76 Production and Classification of Speech Sounds Chap. 3
events and thus gives poor time resolution, as with a plosive that is closely spaced to a succeedingvoiced sound.
Wideband Spectrogram — For the wideband spectrogram, we choose a “short” window with aduration of less than a single pitch period (Figure 3.14); shortening the window widens its Fouriertransform (recall the uncertainty principle). The wide Fourier transform of the window, whentranslated to harmonics, will overlap and add with its neighboring window transforms and smearout the harmonic line structure, roughly tracing out the spectral envelope |H (ω)| due to the vocaltract and glottal flow contributions. In an alternative temporal perspective, since the windowlength is less than a pitch period, as the window slides in time it “sees” essentially pieces of theperiodically occurring sequence h[n] (assuming tails of previous responses have died away).For the steady-state voiced sound, we can therefore express the wideband spectrogram (very)roughly (Exercise 3.9 asks the reader to complete the argument) as
S(ω, τ) ≈ β|H (ω)|2E[τ ] (3.6)
where β is a constant scale factor and where E[n] is the energy in the waveform under thesliding window, i.e., E[τ ] = ∑∞
n=−∞ |x[n, τ ]|2 , that rises and falls as the window slidesacross the waveform. In this case, where the window w[n, τ ] is short, and less than a pitchperiod, the spectrogram shows the formants of the vocal tract in frequency, but also givesvertical striations in time every pitch period, rather than the harmonic horizontal striations as inthe narrowband spectrogram. These vertical striations arise because the short window is slidingthrough fluctuating energy regions of the speech waveform.
In our description of the narrowband and wideband spectrograms, we have used theexample of voiced speech. Similar reasoning can be made for fricative and plosive sounds.With regard to fricatives, the squared STFT magnitude of noise sounds is often referred to asthe periodogram, which is characterized by random wiggles around the underlying function|H (ω)|2 . The periodogram is developed formally in a stochastic process framework later inthe text. For plosives, the spectrogram reveals the general spectral structure of the sound as thewindow w[n, τ ] slides across the signal. For these sound classes, both the narrowband andwideband spectrograms show greater intensity at formants of the vocal tract; neither, however,typically shows horizontal or vertical pitch-related striations because periodicity is not presentexcept when the vocal folds are vibrating simultaneously with these noise or impulsive sounds.With plosive sounds, the wideband spectrogram is often preferred because it gives better temporalresolution of the sound’s components, especially when the plosive is closely surrounded byvowels.
Figure 3.15 compares the narrowband (20-ms Hamming window) and wideband (4-msHamming window) spectrograms for a particular utterance. The spectrograms were computedwith a 512-point FFT. For the narrowband spectrogram, the 20-ms Hamming window wasshifted at a 5-ms frame interval, and for the wideband spectrogram, the 4-ms Hamming windowwas shifted at a 1-ms frame interval. Both spectrograms reveal the speech spectral envelope|H (ω)| = |H(ω)G(ω)| consisting of the vocal tract formant and glottal contributions. No-tice, however, the distinctive horizontal and vertical striations in the narrowband and widebandspectrograms, respectively. Observe, however, that occasionally the vertical striations are barelyvisible in the wideband spectrogram when the pitch is very high. Observe also a difference in

3.4 Categorization of Speech Sounds 77
Time (s)
Freq
uenc
y (H
z)
0
1000
2000
3000
4000
5000
0.2 0.4 0.6 0.8 1.0 1.2 1.4 1.6 1.8
Freq
uenc
y (H
z)
0
1000
2000
3000
4000
5000
0.2 0.4 0.6 0.8 1.0 1.2 1.4 1.6 1.8
Am
plitu
de 10
−1
0.2 0.4 0.6 0.8 1.0 1.2 1.4 1.6 1.8
(a)
(b)
(c)
Figure 3.15 Comparison of measured spectrograms for the utterance, “Which tea party did Baker goto?”: (a) speech waveform; (b) wideband spectrogram; (c) narrowband spectrogram.
time and frequency resolution between the two spectrograms; for example, the short-time spec-trum of the short-duration speech sound “t” in the words “tea” and “to,” across time, is blurryin the narrowband spectrogram while sharp in the wideband spectrogram. Figure 3.16 gives asimilar comparison for an utterance that transitions from normal voicing into diplophonic voic-ing as the pitch becomes very low. In this case, the pitch is so low that horizontal striations arebarely visible in the narrowband spectrogram, in spite of an increased window length of 40-msto improve resolution of harmonic lines. In the wideband spectrogram, one clearly sees verticalstriations corresponding to both the primary glottal pulses and secondary diplophonic pulses.
3.4 Categorization of Speech SoundsIn Section 3.2, we described the anatomy of speech production, the vocal folds and vocal tractbeing the two primary components, and described the mechanism of speech production, i.e.,how we generate sounds with our speech anatomy and physiology. We saw that a sound sourcecan be created with either the vocal folds or with a constriction in the vocal tract, and, based on

78 Production and Classification of Speech Sounds Chap. 3
Time (s)
0
Am
plitu
de 10
−1
3.5 3.6 3.7 3.8 3.9 4.0 4.1 4.2 4.3 4.4
5000
Freq
uenc
y (H
z) 4000
3000
2000
1000
3.5 3.6 3.7 3.8 3.9 4.0 4.1 4.2 4.3 4.4
5000
Freq
uenc
y (H
z) 4000
3000
2000
1000
03.5 3.6 3.7 3.8 3.9 4.0 4.1 4.2 4.3
(a)
(b)
(c)
Figure 3.16 Comparison of measured spectrograms for the utterance “Jazz hour” that has a transitioninto diplophonia: (a) speech waveform; (b) wideband spectrogram; (c) narrowband spectrogram.
the various sound sources, we proposed a general categorization of speech sounds. Section 3.3then deviated from the flow of this chapter to describe spectrographic analysis for the study oftime-varying spectral characteristics of speech. We are now in a position to study and classifyspeech sounds from the following different perspectives:
1. The nature of the source: periodic, noisy, or impulsive, and combinations of the three;
2. The shape of the vocal tract. The shape is described primarily with respect to the placeof the tongue hump along the oral tract and the degree of the constriction of the hump,sometimes referred to as the place and manner-of-articulation, respectively. The shapeof the vocal tract is also determined by possible connection to the nasal passage by wayof the velum;
3. The time-domain waveform which gives the pressure change with time at the lips output;
4. The time-varying spectral characteristics revealed through the spectrogram.

3.4 Categorization of Speech Sounds 79
With these four speech descriptors, we embark on a brief study of the classification of speechsounds. We focus on the English language, but from time to time discuss characteristics of otherlanguages.
3.4.1 Elements of a Language
A fundamental distinctive unit of a language is the phoneme; the phoneme is distinctive in thesense that it is a speech sound class that differentiates words of a language [29]. For example,the words “cat,” “bat,” and “hat” consist of three speech sounds, the first of which gives eachword its distinctive meaning, being from different phoneme classes. We saw earlier, and wewill discuss further below, that many sounds provide this distinctive meaning, and such soundsrepresent a particular phoneme. To emphasize the distinction between the concept of a phonemeand sounds that convey a phoneme, the speech scientist uses the term phone to mean a particularinstantiation of a phoneme. As we discussed in this chapter’s introduction, this distinction isalso seen in the different studies of phonemics and phonetics.
Different languages contain different phoneme sets. Syllables contain one or morephonemes, while words are formed with one or more syllables, concatenated to form phrasesand sentences. Linguistics is the study of the arrangement of speech sounds, i.e., phonemes andthe larger speech units built from phonemes, according to the rules of a language. Phonemes candiffer across languages, but certain properties of the grammatical rules combining phonemesand larger units of a language may be common and instinctual [30]. There are various ways tostudy speech sounds that make up phoneme classes; the use of the above first two descriptors inthis study is sometimes referred to as articulatory phonetics, while using the last two is referredto as acoustic phonetics. One broad phoneme classification for English is in terms of vowels,consonants, diphthongs, affricates, and semi-vowels. Figure 3.17 shows this classification, alongwith various subgroups, where each phoneme symbol is written within slashes according to boththe International Phonetic Alphabet and an orthographic (alphabetic spelling) representation.An insightful history of the various phoneme symbol representations is described in [6]. In theremainder of this text, we use the orthographic symbols.
Phonemes arise from a combination of vocal fold and vocal tract articulatory features.Articulatory features, corresponding to the first two descriptors above, include the vocal foldstate, i.e., whether the vocal folds are vibrating or open; the tongue position and height, i.e.,whether it is in the front, central, or back along the palate and whether its constriction is partialor complete; and the velum state, i.e., whether a sound is nasal or not. It has been hypothesizedthat the first step in the production of a phone is to conceive in the brain the set of articulatoryfeatures that correspond to a phoneme. A particular set of speech muscles is responsible for“activating” each feature with certain relative timing. It is these features that we may store inour brain for the representation of a phoneme. In English, the combinations of features aresuch to give 40 phonemes, while in other languages the features can yield a smaller—e.g., 11 inPolynesian, or a larger, e.g., 141 in the “click” language of Khosian9—phoneme set [30]. Therules of a language string together its phonemes in a particular order; for example, in Italian,
9 A click used in the Khosian language is made by the lips and tongue body and with air drawn into theoral tract. The positions of the lips and tongue are features of the language that combine with other features,such as whether the vocal folds are vibrating or not, to form the Khosian phoneme set.
80 Production and Classification of Speech Sounds Chap. 3
Front Center
Vowels Semi-Vowels Consonants
Whispers
h (h)
PHONEMES
Plosives
Back Liguids
Nasalsm (m)n (n) (G)n
Fricatives
Voicedv (v) (D)z (z) (Z)
Unvoicedf (f)θ (T)s (s)∫ (S)
Voicedb (b)d (d)g (g)
Unvoicedp (p)t (t)k (k)
Affricatest∫ (tS)d (J)
Diphthongs I (Y)
U (W) I (O)ju (JU)
Glidesi (i)I (I)e (e)
ae (@)ε (E)
(R)Λ (A)
(a) (c)o (o)U (U)u (u)
r (r) ( )
w (w)y (y)c
c
lla
aa
ε
∂
Figure 3.17 Phonemes in American English [6],[32]. Orthographic symbols are given in parenthesesto the left of the International Phonetic Alphabet symbols.
consonants are not normally allowed at the end of words. The ordering of the phonemes is alsodetermined in part by the underlying articulatory features of the phones; for example, vibrationof the vocal folds or a particular vocal tract shape can constrain or influence the followingsound.
A phoneme is not strictly defined by the precise adjustment of articulators; for example,the tongue hump forming a 0.1-mm constriction with the palate, 3 cm along the oral tract, willlikely correspond to the same phoneme when these specifications are changed by a few percent.The articulatory properties are influenced by adjacent phonemes, rate and emphasis in speaking,and the time-varying nature of the articulators. The variants of sounds, or phones, that conveythe same phoneme are called the allophones of the phoneme [29]. Consider, for example, thewords “butter,” “but,” and “to,” where the /t/ in each word is somewhat different with respect toarticulation, being influenced by its position within the word. Therefore, although the allophonesof a phoneme do have consistent articulatory features, the fine details of these features vary indifferent conditions. In this sense, then, the concept of a phoneme as a distinctive unit of alanguage is abstract.

3.4 Categorization of Speech Sounds 81
In speech production, the articulatory features ultimately lead to the speech waveformand its acoustic temporal and spectral features, corresponding to the above third and fourthdescriptors, such as the time delay of a plosive before a voiced sound and vocal tract formants.In the motor theory of perception [3], such acoustic properties are measured by the auditorysystem and ultimately are mapped in the brain to the set of articulatory features that define thephoneme, i.e., in perceiving the phoneme the listener reconstructs the set of articulatory featuresfor that phoneme. Later in this chapter, we return to this paradigm, as well as to a different viewwhere articulatory features are not the end perceptual representation. We now begin a short studyof the classification of speech sounds, using both articulatory and acoustic characterizations. Foreach phoneme class, we describe source and system (vocal tract) articulators, and the resultingspectral and waveform characteristics that give a phoneme its distinction.
3.4.2 Vowels
The largest phoneme group is that of vowels. Vowels contain three subgroups defined by thetongue hump being along the front, central, or back part of the palate.
Source: The source is quasi-periodic puffs of airflow through the vocal folds vibrating at acertain fundamental frequency. We use the term “quasi” because perfect periodicity is neverachieved; henceforth, the term “periodic” will be used in this sense. A simple model of thesource waveform and spectrum and its modification by the vocal tract was given in Examples3.1 and 3.2. In English, the pitch of the periodic source does not distinguish phonemes as insome languages such as Chinese.
System: Each vowel phoneme corresponds to a different vocal tract configuration. The vocaltract shape is a function of the tongue, the jaw, the lips, and the velum which is closed in non-nasalized vowels, i.e., the nasal passage is not coupled to the oral tract. In addition to their degreeof openness, the lips can contribute to the vocal tract configuration by being rounded, whichcan increase the effective vocal tract length. Recite the phoneme /u/ in the word “boot” and youwill feel the lips become rounded and protruded. The tongue, which is the primary determinantof vocal tract shape, has three general places of articulation: front, center, or back of the oralcavity. The degree of constriction by the tongue is another shape determinant. A comparativeexample is given with the vowel /a/ as in “father” and with the vowel /i/ as in “eve” [32]. Forthe vowel /a/ the vocal tract is open at the front, the tongue is raised at the back, and there is alow degree of constriction by the tongue against the palate. For the vowel /i/ the vocal tract isopen at the back, the tongue is raised at the front, and there is a high degree of constriction ofthe tongue against the palate. These examples are included in Figure 3.18, which illustrates thevocal tract profiles for all English vowels in terms of tongue position and degree of constriction[31]. Keep in mind that Figure 3.18 shows the oral cavity and does not include the pharynx, theregion just above the glottis, which can also influence formant locations. X-ray studies of thecomplete vocal tract for different phonemes are found in the early work of Fant [8], as well asin more recent magnetic resonance imaging studies [35].
Spectrogram: The particular shape of the vocal tract determines its resonances. Qualitativerules based on physical principles have been developed by Stevens [33] for mapping changesin vocal tract shape to formant movement. Perturbations in cross-section at various points ofa uniform reference tube (approximately modeling the vowel /A/), by narrowing of the front,

82 Production and Classification of Speech Sounds Chap. 3
i (eve) I (it) e (hate) E (met)
@ (at) a (father) c (all) o (obey)
U (foot) u (boot) A (up) R (bird)
Figure 3.18 Vocal tract profiles for vowels in American English. The two horizontal lines denotevoicing.
SOURCE: R.K. Potter, G.A. Kopp, and H.G. Kopp, Visible Speech [31]. ©1966, Dover Publications, Inc.
Used by permission.
central, or back of the oral cavity by the tongue and jaws, are mapped to certain changes informant location. In Chapter 4, we will study quantitatively the relation between vocal tractshape and formants using a concatenated acoustic tube model. The wideband spectrograms andspectral slices of the narrowband spectrograms of the two vowels /a/ and /i/ are shown in Figure3.19. The first formant of /a/ is dominant and falls at roughly 800 Hz, while the second and thirdweaker formants are at roughly 1200 Hz and 2300 Hz, respectively. For the vowel /i/, the firstformant is at about 400 Hz and the second and third formants are at about 2000 Hz and 3000 Hz,respectively, with the third being greater in amplitude than its counterpart in /a/. The widebandspectrograms in these and following examples are obtained with a 4-ms window and a 1-msframe interval. The narrowband spectral slices are obtained with a 20-ms and 30-ms windowfor the /a/ and /i/, respectively, and a 5-ms frame interval.
Waveform: Certain vowel properties seen in the spectrogram are also seen in the speech wave-form within a pitch period. As illustrated in Figure 3.19, for the vowel /a/ the dominant first

3.4 Categorization of Speech Sounds 83
Frequency (Hz) Frequency (Hz)
(a) (b)
Am
plitu
de 1
0
−10.62 0.64 0.66 0.68
10
−10.94 0.96 0.98 1.00 1.02
Freq
uenc
y (H
z)
Time (s)
4000
2000
00.62 0.64 0.66 0.68
Time (s)
4000
2000
00.94 0.96 0.98 1.00
Am
plitu
de (
dB)
100
80
60
40
20
0
F1 F3F2
0 1000 2000 3000 4000
100
80
60
40
20
0
F1F2 F3
0 1000 2000 3000 4000
Figure 3.19 Waveform, wideband spectrogram, and spectral slice of narrowband spectrogramfor two vowels: (a) /i/ as in “eve”; (b) /a/ as in “father.” The first three formants F1 , F2 , and F3
are marked on the spectral slices.
formant gives a low-frequency damped oscillation while the second and third weaker formantsgive no visible high-frequency energy. In contrast, for the vowel /i/, the first formant gives a verylow-frequency damped oscillation and the third strong formant gives a visible high-frequencyoscillation superimposed on the low-frequency formant.
In spite of the specific properties of different vowels, there is much variability of vowelcharacteristics among speakers. We noted earlier that articulatory differences in speakers isone cause for allophonic variations. The place and degree of constriction of the tongue humpand cross-section and length of the vocal tract, and therefore the vocal tract formants, willvary with the speaker. Peterson and Barney [28],[32] measured the first (F1) and second (F2)formants from a spectrogram for a large range of speakers. Vowels deemed to be “perceptuallyequivalent” were used. A plot of F1 and F2 on a 2-D grid reveals approximate elliptical clusterscorresponding to the different vowels and shows a large range of variation in F1 and F2 foreach vowel group. This variability presents a challenge to speech recognition algorithms that

84 Production and Classification of Speech Sounds Chap. 3
rely on invariance of vowel spectral properties across speaker, but aids in speaker recognitionwhere spectral variability with speaker is required.
3.4.3 Nasals
The second large phoneme grouping is that of consonants. The consonants contain a number ofsubgroups: nasals, fricatives, plosives, whispers, and affricates. We begin with the nasals sincethey are closest to the vowels.
Source: As with vowels, the source is quasi-periodic airflow puffs from the vibrating vocalfolds.
System: The velum is lowered and the air flows mainly through the nasal cavity, the oral tractbeing constricted; thus sound is radiated at the nostrils. The nasal consonants are distinguishedby the place along the oral tract at which the tongue makes a constriction (Figure 3.20). The twonasals that we compare are /m/ as in “mo” and /n/ as “no.” For /m/, the oral tract constrictionoccurs at the lips and for /n/ the constriction is with the tongue to the gum ridge.
Spectrogram: The spectrum of a nasal is dominated by the low resonance of the large volumeof the nasal cavity. The resonances of the nasal cavity have a large bandwidth because viscouslosses are high as air flows along its complexly configured surface, quickly damping its impulseresponse. The closed oral cavity acts as a side branch with its own resonances that change withthe place of constriction of the tongue; these resonances absorb acoustic energy and thus areanti-resonances (zeros) of the vocal tract. The anti-resonances of the oral tract tend to lie beyondthe low-frequency resonances of the nasal tract; a result of this is that for nasals there is littlehigh-frequency energy passed by the vocal tract transfer function. For the /m/ in Figure 3.21b,there is a low F1 at about 250 Hz with little energy above this frequency. A similar pattern isseen for the /n/ in Figure 3.21a. Observe that at the release of the constriction of the nasal thereis an abrupt change in the spectrogram when the sound is radiated from the mouth. The formanttransitions that follow the release are quite different for the nasals /m/ and /n/; these transitions,which reflect the manner in which the oral cavity transitions into its steady vowel position, arean important perceptually distinguishing characteristic of the two nasals [33].
m (me) n (no) G (sing)
Figure 3.20 Vocal tract configurations for nasal consonants. Oraltract constrictions occur at the lips for /m/, with the tongue tip to thegum ridge for /n/, and with the tongue body against the palate near thevelum for /ng/. Horizontal lines denote voicing.
SOURCE: R.K. Potter, G.A. Kopp, and H.G. Kopp, Visible Speech [31].
©1966, Dover Publications, Inc. Used by permission.

3.4 Categorization of Speech Sounds 85
Time (s) Time (s)
(a) (b)
Am
plitu
de 1
0−1
2.2 2.4 2.6
1
0−1
7.4 7.6 7.8 8.0Fr
eque
ncy
(Hz)
0
2000
4000
2.2 2.4 2.60
2000
4000
7.4 7.6 7.8 8.0
Figure 3.21 Wideband spectrograms of nasal consonants (a) /n/ in “no” and (b) /m/ in“mo.”
Waveform: The waveforms for both the /m/ and /n/ are dominated by the low, wide-bandwidthF1 formant; within each glottal cycle, there is seen a rapidly damped oscillation. Other reso-nances are not high enough in energy to be seen.
A phenomenon we referred to earlier as nasalization of vowels is related to the generationof nasals in that the velum is partially open. The nasal cavity couples with the oral cavityand introduces anti-resonances (zeros) into the vocal tract system function. The open nasalcavity acts as a side chamber that introduces the anti-resonances by absorbing energy at certainfrequencies, thus serving the same role as the oral tract for a nasal consonant. There is alsosome broadening of the bandwidth of the resonances of the oral cavity due to the oral-nasal tractcoupling. In vowel nasalization, the speech sound is primarily due to the sound at the lips andnot the sound at the nose output, which is very weak. Vowels adjacent to nasal consonants tendto be nasalized. Certain speakers characteristically nasalize their vowels by keeping their velumpartially open. In English, unlike some languages such as French, Polish, and Portuguese, vowelnasalization is not used to differentiate phonemes [30].
3.4.4 Fricatives
Fricative consonants are specified in two classes: voiced and unvoiced fricatives.
Source: In unvoiced fricatives, the vocal folds are relaxed and not vibrating. Noise is generatedby turbulent airflow at some point of constriction along the oral tract, a constriction that isnarrower than with vowels. The degree of the constriction somewhat colors the spectral characterof the noise source, although this is a secondary effect, the vocal tract spectral coloring beingprimary.

86 Production and Classification of Speech Sounds Chap. 3
System: The location of the constriction by the tongue at the back, center, or front of the oraltract, as well as at the teeth or lips, influences which fricative sound is produced. The constrictionseparates the oral tract into front and back cavities with the sound radiated from the front cavity.Although the front cavity dominates the spectral shaping of the sound, the back cavity introducesanti-resonances in the transfer function, absorbing energy at approximately its own resonances.Because the front cavity is shorter than the full oral cavity and because anti-resonances of theback cavity tend to be lower in frequency than the resonances of the front cavity, the resultingtransfer function consists primarily of high-frequency resonances which change with the locationof the constriction.
Voiced fricatives have a similar noise source and system characteristic to unvoiced frica-tives; for voiced fricatives, however, the vocal folds often vibrate simultaneously with noisegeneration at the constriction and a periodicity of the noisy airflow is seen. Recite the voicedfricative /z/, as in “zebra,” and you will feel the vocal folds vibrating while noise is generated.Generally, fricatives occur in voiced/unvoiced pairs. We compare the unvoiced fricative /f/ as in“for” and the matching voiced fricative /v/ as in “vote.” In /f/, the vocal folds are not vibratingand the constriction occurs by the teeth against the lips. In contrast, for /v/ the vocal folds arevibrating and again the constriction is formed by the teeth against the lips (Figure 3.22).
When the vocal folds vibrate in a voiced fricative, the periodic airflow from the glottispasses through the back oral cavity to the constriction. At the constriction, frication takesplace only when the airflow velocity of the periodic puffs is “high enough.” According to fluiddynamical principles, the airflow velocity must exceed a constant called the Reynolds number,which is a function of the density and viscosity of the air medium as well as the geometry ofthe constriction [20]. This implies that frication is approximately synchronized with airflowvelocity. The glottal waveform shape therefore can be thought of as modulating a noise source.This leads to a simplified model of voiced frication given in the following example:
EXAMPLE 3.4 A voiced fricative is generated with both a periodic and noise source. Theperiodic glottal flow component can be expressed as
u[n] = g[n] ∗ p[n]
where g[n] is the glottal flow over one cycle and p[n] is an impulse train with pitch period P. In asimplified model of a voiced fricative, the periodic signal component u[n] is passed through a lineartime-invariant vocal tract with impulse response h[n]. The output at the lips due to the periodic glottalsource is given by
xg[n] = h[n] ∗ (g[n] ∗ p[n]).
In the model of the noise source component of the voiced fricative, the vocal tract is constricted alongthe oral tract and air flows through the constriction, resulting in a turbulent airflow velocity source atthe constriction that we denote by q[n]. In this simplified model, the glottal flow u[n] modulates thisnoise function q[n] (assumed white noise). The modulated noise then excites the front oral cavity thathas impulse response hf [n]. The output flow at the lips due to the noise source is expressed as
xq [n] = hf [n] ∗ (q[n]u[n]).

3.4 Categorization of Speech Sounds 87
f (for) T (thin) s (see)
S (she) h (he) v (vote)
D (then) z (zoo) Z (azure)
Figure 3.22 Vocal tract configurations for pairs of voiced and unvoiced fricatives.Horizontal lines denote voicing and dots denote aspiration.
SOURCE: R.K. Potter, G.A. Kopp, and H.G. Kopp, Visible Speech [31]. ©1966, Dover
Publications, Inc. Used by permission.
We assume in our simple model that the results of the two airflow sources add, so that the completeoutput of the lips is given by
x[n] = xg[n] + xq [n]
= h[n] ∗ u[n] + hf [n] ∗ (q[n]u[n]).
The spectral characteristics of x[n] are studied in Exercise 3.10.
In this simple model, we have ignored that the modulating function u[n] is modified by theoral cavity and that the noise response xq [n] can be influenced by the back cavity. We have also notaccounted for sources from nonlinear effects other than the modulation process, one possibility beingdistributed sources due to traveling vortices.

88 Production and Classification of Speech Sounds Chap. 3
In voiced fricatives, however, voicing does not always occur simultaneously with noise genera-tion. Simultaneous voicing may occur only early on or not at all during the frication. A voicedfricative can also be distinguished from its unvoiced counterpart by a shorter duration of frica-tion prior to the onset of voicing in a following vowel. The timing of the onset of voicing afterfrication thus provides a cue in the distinction of these sounds. The formant transitions fromthe frication into the following vowel also serve to distinguish between voiced and unvoicedfricative counterparts; for voiced fricatives, the voicing occurs sooner into the transition, thusaccentuating the transition relative to the weaker noise excitation of its unvoiced counterpartduring the initial part of the transition.10 Generally then, there are multiple cues that help inthese distinctions.
Spectrogram: Unvoiced fricatives are characterized by a “noisy” spectrum while voiced frica-tives often show both noise and harmonics. The spectral nature of the sound is determined bythe location of the tongue constriction. For example, with an /S/ the frication occurs at thepalate, and with an /f/ at the lips. The /S/ has a highpass spectrum corresponding to a shortupper oral cavity. For the /f/ there is little front cavity, so its spectrum is almost flat with amild upward trend. A comparison of the unvoiced fricative /f/ with the voiced fricative /v/ isgiven in Figure 3.23. The noise component of each fricative has a wide spectrum focused inthe high-frequency region (1000–5000 Hz). The voiced fricative, however, is characterized bythe additional harmonic structure due to the oscillating vocal folds, as revealed in the spectralslices as well as the spectrograms of Figure 3.23. The influence of the surrounding vowels onthe formant transitions to and from the fricatives can also be seen in the spectrograms.
Waveform: For the unvoiced/voiced fricative pair, the waveform of the unvoiced fricativecontains noise, while that of the voiced fricative contains noise superimposed on periodicityduring the fricative region, as seen in Figure 3.23.
Whisper: Although the whisper is a consonant similar in formation to the unvoiced fricative,we place the whisper in its own consonantal class. We saw earlier that with a whisper the glottisis open and there is no vocal fold vibration. Turbulent flow is produced, however, at the glottis,rather than at a vocal tract constriction. The spectral characteristics of the whisper depend onthe size of the glottis, which influences the spectrum of the noise source, and the resonant cavityat the onset of the vowel. An example is /h/, the sole whisper in English, as in “he.” Otherwhispers exist outside the English language.
3.4.5 PlosivesAs with fricatives, plosives are both unvoiced and voiced.
Source and System: With unvoiced plosives, a “burst” is generated at the release of the buildupof pressure behind a total constriction in the oral tract. We have idealized this burst as animpulsive source, although in practice there is a time spread and turbulent component to thissource. The constriction can occur at the front, center, or back of the oral tract (Figure 3.24).There is no vibration of the folds. The sequence of events is: (1) complete closure of the oral tractand buildup of air pressure behind closure; during this time of closure, no sound is radiated fromthe lips; (2) release of air pressure and generation of turbulence over a very short-time duration,
10 Within an unvoiced/voiced consonant pair, the formant transitions are similar but differ in their excitation.Across consonant pairs, on the other hand, differences in formant transitions from a consonant to a followingvowel help in the distinction of consonants.

3.4 Categorization of Speech Sounds 89
Frequency (Hz)Frequency (Hz)
(a) (b)
0.84 0.86 0.88 0.90 0.92
0
1
−1Am
plitu
de
0.36 0.38 0.40 0.42 0.44
0
1
−1
Voice Bar
Am
plitu
de (
dB)
Harmonics
0 1000 2000 3000
100806040200
0 1000 2000 3000
100806040200
Freq
uenc
y (H
z)
0.36 0.38 0.40 0.42 0.44
4000
2000
0
Time (s)
0.84 0.86 0.88 0.90 0.92
4000
2000
0
Time (s)
Figure 3.23 Waveform, wideband spectrogram, and narrowband spectral slice of voiced andunvoiced fricative pair: (a) /v/ as in “vote”; (b) /f/ as in “for.” Spectral slices taken in fricativeregions over a 20-ms window.
i.e., the burst (“impulsive”) source, which excites the oral cavity in front of the constriction; (3)generation of aspiration due to turbulence at the open vocal folds (before onset of vibration) asair rushes through the open oral cavity after the burst; and (4) onset of the following vowel about40–50 ms after the burst. The voiced onset time is the difference between the time of the burstand the onset of voicing in the following vowel. The length of the voice onset time and the placeof constriction vary with the plosive consonant.
With voiced plosives, as with unvoiced plosives, there is a buildup of pressure behind anoral tract constriction, but the vocal folds can also vibrate. When this vibration occurs, althoughthe oral tract is closed, we hear a low-frequency vibration due to its propagation through thewalls of the throat. This activity is referred to as a “voice bar.”11 After the release of the burst,unlike the unvoiced plosive, there is little or no aspiration, and the vocal folds continue to vibrate
11 Voice bars are exploited by other species besides humans. Male frogs emit a mating call by forcing airfrom their lungs through vocal folds into the mouth and nostrils. During this maneuver the mouth and nostrilsare closed tightly and a thin wall sac at the base of the mouth is blown up like a balloon. The vibrating vocalfolds propagate sound to the sac, which radiates the mating call into the external air [26].

90 Production and Classification of Speech Sounds Chap. 3
p (pay) t (to) k (key)
b (be) d (day) g (go)
Figure 3.24 Vocal tract configurations for unvoiced and voiced plosivepairs. Horizontal lines denote voicing.
SOURCE: R.K. Potter, G.A. Kopp, and H.G. Kopp, Visible Speech [31].
©1966, Dover Publications, Inc. Used by permission.
into the following vowel; there is much shorter delay between the burst and the voicing of thevowel onset. Figure 3.25 compares an abstraction of the unvoiced plosive and a voiced plosivewith the presence of a voice bar. In Figure 3.26, we compare an actual voiced/unvoiced plosivepair: /g/ as in “go” and /k/ as in “baker.” The phoneme /k/ is unvoiced with a constriction at thevelum; the phoneme /g/ is characterized by the same constriction, but with vibrating folds.
Vocal fold vibration, and thus a voice bar, does not always occur during the burst of a voicedplosive, and therefore is not the only distinguishing feature between the two sound classes. Thelength of the voice onset time can also provide the distinction. Perceptual experiments indicatethat if the release of the burst and onset of voicing are within 20 ms of each other, the consonantis considered voiced; otherwise, it is judged as unvoiced. The muscles controlling the vocal foldpositions and tension are very precisely activated in time to generate the different voice onsettimes [10]. The formant transitions from the onset of the burst into the following vowel also helpin distinguishing between voiced and unvoiced plosive counterparts; as with voiced fricatives,the voicing in voiced plosives occurs sooner into the transition, thus accentuating the transitionrelative to the weaker aspiration excitation of its unvoiced counterpart.
Spectrogram and Waveform: For the unvoiced plosive /k/, we observe (Figure 3.26) in boththe waveform and the spectrogram a gap of near silence, followed by an abrupt burst, and thenaspiration noise. The spectrogram at the time of the burst is governed by the shape of the oralcavity in front of the constriction (which is excited by the burst) and the spectral character ofthe burst itself. The aspiration then acts as an excitation to the vocal tract as it transitions fromits constricted state. Finally, when the vocal folds vibrate, the resulting periodic puffs excite thevocal tract as it enters into its steady vowel state. The formant trajectories through aspiration andinto voicing reflect this changing vocal tract shape. For the counterpart voiced plosive /g/, a low-frequency voice bar is seen in the spectrogram prior to the burst. Observe also that the voice onset

3.4 Categorization of Speech Sounds 91
VOT
VOT
Unvoiced Plosive
Voiced Plosive
Voice Bar
SilenceBurst
Burst
Aspiration Voicing
Voicing
t
t(a)
(b)
Figure 3.25 A schematic representation of (a) unvoiced and (b) voiced plosives. Thevoiced onset time is denoted by VOT.
(a) (b)
Freq
uenc
y (H
z)
Time (s)
4000
2000
02.00 2.05 2.10
Time (s)
4000
2000
00.80
Am
plitu
de Burst
Voice Bar
1
0
−12.00 2.05 2.10
Burst
Aspiration
10
−10.80 0.85
0.85
Frequency (Hz)Frequency (Hz)
Am
plitu
de (
dB)
Harmonics10080604020
0 1000 2000 3000
10080604020
0 1000 2000 3000
Figure 3.26 Waveform, wideband spectrogram, and narrowband spectral slice ofvoiced and unvoiced plosive pair: (a) /g/ as in “go”; (b) /k/ as in “key.” Spectral slicesare taken in burst regions over a 40-ms window in (a) and a 25-ms window in (b).

92 Production and Classification of Speech Sounds Chap. 3
time is negligible for the /g/ in contrast to that for the /k/. Given a negligible aspiration stage,the formant trajectories sometimes appear more visible, being excited throughout by voicing.As with voiced fricatives, vocal fold vibration need not be present for a plosive to be “voiced”;the voice onset time and formant transitions can be sufficient to make the distinction.
In the following example, we explore a time-varying linear system model for the voicedplosive.
EXAMPLE 3.5 We have seen that a voiced plosive is generated with a burst source and can alsohave present a periodic source throughout the burst and into the following vowel. Assuming the burstoccurs at time n = 0, we idealize the burst source as an impulse δ[n]. The glottal flow velocity modelfor the periodic source component is given by
u[n] = g[n] ∗ p[n]
where g[n] is the glottal flow over one cycle and p[n] is an impulse train with spacing P. Assumethat the vocal tract is linear but time-varying, due to the changing vocal tract shape during its transitionfrom the burst to a following steady vowel. The vocal tract output cannot, therefore, be obtained bythe convolutional operator. Rather, the vocal tract output can be expressed using the time-varyingimpulse response concept introduced in Chapter 2. In our simple model, the periodic glottal flowexcites a time-varying vocal tract, with impulse response denoted by h[n,m], while the burst excitesa time-varying front cavity beyond a constriction, denoted by hf [n,m]. The sequences h[n,m] andhf [n,m], as we described in Chapter 2, represent time-varying impulse responses at time n to a unitsample applied m samples earlier at time n−m. We can then write the output with a generalizationof the convolution operator as
x[n] =∞∑
m=−∞h[n,m]u[n − m] +
∞∑m=−∞
hf [n,m]δ[n − m]
where we assume the two outputs can be linearly combined. In this model, we have not accountedfor aspiration that might occur before the onset of voicing, as well as other effects described in Exam-ple 3.4.
3.4.6 Transitional Speech Sounds
A number of the phone examples we have presented thus far were illustrated as “stationary,”such as the sounds for the phonemes /a/ and /i/ in Figure 3.19, in the sense that their underlyingarticulators hold an almost fixed configuration and the resulting formants appear nearly constant.We also illustrated the movement of one phone to the next with articulators transiting from oneconfiguration to another, for example, as manifested in the spectral change in going from the/g/ to /o/ in “go” of Figure 3.26. Such speech sounds are “nonstationary” and in some casesthe rapid transition across two articulatory states defines the sound. This time-varying nature ofarticulators is more the norm than the exception. The articulators are almost always in transitionbetween states, often never reaching a desired state in typically spoken speech. Nonstationarity isfurther imparted through a phenomenon known as coarticulation, which involves the anticipation

3.4 Categorization of Speech Sounds 93
of the following sound, sometimes many phones in the future, and therefore a blending of thearticulatory states. Such nonstationarity poses interesting challenges to speech signal processingalgorithms that typically assume (and often require) stationarity over intervals of 10–20 ms.
Phonemes Defined by Transition — Diphthongs: Diphthongs have a vowel-like nature withvibrating vocal folds. Diphthongs, however, cannot be generated with the vocal tract in a steadyconfiguration; they are produced by varying in time the vocal tract smoothly between two vowelconfigurations and are characterized by a movement from one vowel target to another. The termtarget, as implied, refers to seeking a particular vocal tract configuration for a phoneme, but notnecessarily achieving that configuration. Four diphthongs in the American English language are:/Y/ as in “hide,” /W/ as in “out,” /O/ as in “boy,” and /JU/ as in “new.” As an example, Figure3.27 shows the spectrogram of the diphthong /O/ in “boy,” where we see a rapid movement ofthe formants (especially F2) as the vocal tract changes from its configuration for the /u/ to thatfor the /i/ vowel sound. Such formant transitions characterize the diphthong.
Semi-Vowels: This class is also vowel-like in nature with vibrating folds. There are twocategories of semi-vowels: glides (/w/ as in “we” and /y/ as in “you”) and liquids (/r/ as in “read”and /l/ as in “let”). The glides are dynamic and transitional and often occur before a vowel orare surrounded by vowels, passing from a preceding vowel and moving toward the followingvowel, thus in this latter case being similar to diphthongs. Glides differ from diphthongs in twoways. In glides, the constriction of the oral tract is greater during the transition and the speedof the oral tract movement is faster than for diphthongs. These articulations result in weaker,but faster formant transitions [29]. An example is /w/ in the phrase “away.” At the onset ofthe /w/, the tongue hump is high and the lips are highly constricted. The formants of the /w/“glide” rapidly from the preceding /a/ to the following /e/. The liquids /l/ and /r/ are similarto the glides in being voiced, in the speed of movement, and in the degree of oral constriction.The liquids differ from the glides in the formation of the constriction by the tongue; the tongue
Time (s)
Freq
uenc
y (H
z)
5000
4000
3000
2000
1000
05.5 5.6 5.7 5.8 5.9 6
Figure 3.27 Narrowband spectrogram example for the diphthong /O/ in “boy.”

94 Production and Classification of Speech Sounds Chap. 3
is shaped in such a way as to form side branches, different from all other oral tract formationsthus far [33]. The presence of these side branches can introduce anti-resonances. With /l/the tongue tip is pressed against the palate, and is shaped to form two openings, one on eachside of the contact point with air passing on each side. For the liquid /r/, two different tongueformations are known to exist, one with a tongue tip raised at the palate as shown in Figure 3.28and creating a space under it, and the other with the tongue tip lowered and the tongue humpbunched near the palate forming a side branch to the primary oral cavity [7],[33].12 In addition,the liquids are typically characterized by an effective constriction of the pharynx, quite unusualfor American English consonants; magnetic resonance image vocal tract profiles have shownsuch constrictions [7],[24]. The formant transitions differ for all four semi-vowels; nevertheless,these transitions are smooth except for the liquid /l/, whose spectral evolution is discontinuousbecause the tongue tip holds and releases its contact with the palate.
Affricates: This sound is a counterpart of diphthongs, consisting of consonant plosive-fricativecombinations, rapidly transiting from plosives to fricatives. The articulation of affricates issimilar to that of fricatives. The difference is that for affricates, the fricative is preceded by acomplete constriction of the oral cavity, formed at the same place as for the plosive. An exampleis the /tS/ in the word “chew,” which is the plosive /t/ followed by the fricative /S/. The voicedcounterpart to /tS/ is the affricate /J/ as in “just,” which is the voiced plosive /d/ followed by thevoiced fricative /Z/.
Coarticulation — Although our vocal fold/vocal tract muscles are programmed to seek a targetstate or shape, often the target is never reached. Our speech anatomy cannot move to a desiredposition instantaneously and thus past positions influence the present. Furthermore, to makeanatomical movement easy and graceful, the brain anticipates the future, and so the articulators atany time instant are influenced by where they have been and where they are going. Coarticulationrefers to the influence of the articulation of one sound on the articulation of another sound in thesame utterance and can occur on different temporal levels. In “local” coarticulation, articulationof a phoneme is influenced by its adjacent neighbors or by neighbors close in time. Consider,
w (we) y (you) r (read) l (left)
Figure 3.28 Configurations of glides and liquids. Horizontal lines denotevoicing.
SOURCE: R.K. Potter, G.A. Kopp, and H.G. Kopp, Visible Speech [31]. ©1966,
Dover Publications, Inc. Used by permission.
12 It is interesting that these two very different vocal tract formations can result in similar acoustic charac-teristics [13]. We discuss this observation further in Section 3.6.2.

3.5 Prosody: The Melody of Speech 95
for example, the words “horse” and “horseshoe.” In the two cases, the /s/ is spoken differently,the /s/ in “horseshoe” anticipating the /S/. (Here we see two allophones of the phoneme /s/.)Another example of local coarticulation is in the fricative /s/ anticipating the following phomemein the word “sweep.” Here /w/ influences the formant near 3500 Hz in /s/ to move downwardby about 500 Hz, in contrast to the same formant /s/ in “seep” [29]. This occurs because theextending and narrowing of the lips in forming /w/ lowers the resonances of the mouth cavityin front of the frication of /s/. This configuration of the lips occurs during the /s/ frication in“sweep,” thus influencing its spectral structure. On the other hand, during the frication of the /s/in “seep,” the lips are more open. There also exists “global” coarticulation, where the articulatorsare influenced by phonemes that occur some time in the future beyond the succeeding or nearbyphonemes; this can be even further generalized to a higher level where entire phrase structuresare anticipated. Each phoneme then contains parts of other surrounding phonemes, giving eachsound an added redundancy which may aid in effective communication.13
The anticipation of phonemes, words, and phrase groups may be tied closely to the durationof exhalation from the lungs. That is, words, phrases, and sentences are formed into breathgroups. There is evidence that consonant and vowel durations are shortened or lengtheneddepending on the length of the exhalation, and this duration change requires anticipation ofwhat is to come; if early events were not timed in anticipation of later events, then the laterevents would have to be compressed in time and spoken too rapidly to be audible. For example,the number of pitch periods for each vowel in an utterance may be set so that no vowel in theutterance is too short. The short-term memory theory of the programming of vocal fold/tractmuscles hypothesizes that the human can store a limited set of instructions for muscle movement[30]; as new instructions enter the storage buffer, old instructions leave, compressing as manyinstructions as possible without sacrificing the integrity of the sound.
3.5 Prosody: The Melody of SpeechLong-time variations, i.e., changes extending over more than one phoneme, in pitch (intonation),amplitude (loudness), and timing (articulation rate or rhythm) follow what are referred to as therules of prosody of a language. These rules are followed to convey different meaning, stress,and emotion. For example, the average pitch contour of a declarative statement tends to increaseat the onset of an utterance, decline slowly, then make a rapid drop at the end of the utterance.For a question, on the other hand, the pitch contour increases over time relative to that of thesame statement made in declarative form. In addition, a speaker also adds his/her own speaker-dependent prosodic refinements such as a characteristic articulation rate and pitch fluctuation.
Consider changes made in the production mechanism and prosody during the stress ofa speech sound. The subglottal pressure, i.e., the pressure just below the glottis, during anormally spoken utterance is typically about constant, but falling near the termination of the
13 Short pieces of a phrase can sometimes be replaced by another sound without a change in intelligibilityby the listener as, for example, when replacing certain short speech segments by noise. This result may reflectphonological redundancy by the speaker, but also expectation by the listener. It is also interesting to note that,in addition to temporal redundancy, there is evidence of frequency redundancy in that certain spectral bands canbe eliminated with little effect on intelligibility of a sound [22].

96 Production and Classification of Speech Sounds Chap. 3
utterance where there is also often a corresponding decline in pitch. We can impart, however,variations on this average subglottal pressure. When adding stress to a speech sound, we increasepressure within the lungs. The resulting increased subglottal pressure causes an increase inpitch and loudness. This increased pressure will also cause a more abrupt glottal closure byaccentuating the Bernoulli effect on airflow through the glottis. A more abrupt closure of theglottis, as seen in Example 3.1, corresponds to more energy in high frequencies of the glottalspectrum, and thus a “harder” voice quality which can also characterize a stressed sound. Anincrease in pitch is also imparted due to an increase in vocal fold tension. A rise in subglottalpressure and in vocal fold tension is also responsible for a rising pitch over the duration of aquestion. We can impart these variations globally, as in going from a soft to a shouting voice inargument, or more locally in time to stress or change intonation on a particular syllable, word,or phrase.
EXAMPLE 3.6 Figure 3.29 shows a comparison of the utterance, “Please do this today,” whichin the first case is spoken normally, while in the second case, the word “today” is stressed. The pitch,spectral content, and loudness are all seen to be generally higher in the stressed case for the word“today” (Exercise 3.13). The reader should speak the utterance in the two voice styles. Feel your lungscontract during the stressing of the word “today.” The increase in lung contraction causes an increasein subglottal pressure. Another change in stressing a sound is its increase in duration as seen in thewaveforms and spectrograms of the word “today” in Figure 3.29. Although the speaker planned tostress only the word “today,” the entire sentence is longer, likely due to the anticipation of stressing thelast word of the sentence. Stressing a sound is generally accompanied by an increase in the durationof vowels and consonants. For a vowel, the number of pitch periods increases, as we can see in Figure3.29. For consonants, the time of frication or time prior to closure of a constriction, thus building upgreater pressure, will increase. For example, for the /t/ of the stressed word “today,” the precedingsilence gap is longer and the burst louder than in its normally spoken counterpart.
We saw in Example 3.6 that an increase in duration is also characteristic of a stressed sound. Onetheory proposed by Lieberman [21] suggests that subglottal pressure, vocal fold tension, andphoneme duration are set within a time period reference which is the duration of an exhalation.We earlier called the collection of word and phrase groups within a single exhalation a breathgroup, and saw that the duration of a breath group affects the coarticulation of phonemes.Lieberman’s hypothesis states that, in addition, the durational and timing patterns of phonemesare also determined by their degree of stress within the breath group. The muscles of the larynxthat control vocal fold tension and the muscles around the lungs that control subglottal pressureare timed in their contraction relative to the breath group duration and the sounds marked forstress and pitch intonation within the breath group.
We have seen thus far two factors affecting the duration of vowels and consonants: coar-ticulation and stress within a breath group. There are other factors as well. Vowels are typicallylonger than consonants. One hypothesis for this difference is that vowels, in addition to relay-ing intelligibility of the message, by being typically longer carry prosodic components such asrhythm and intonation, while consonants, by being shorter, carry more of the information load.
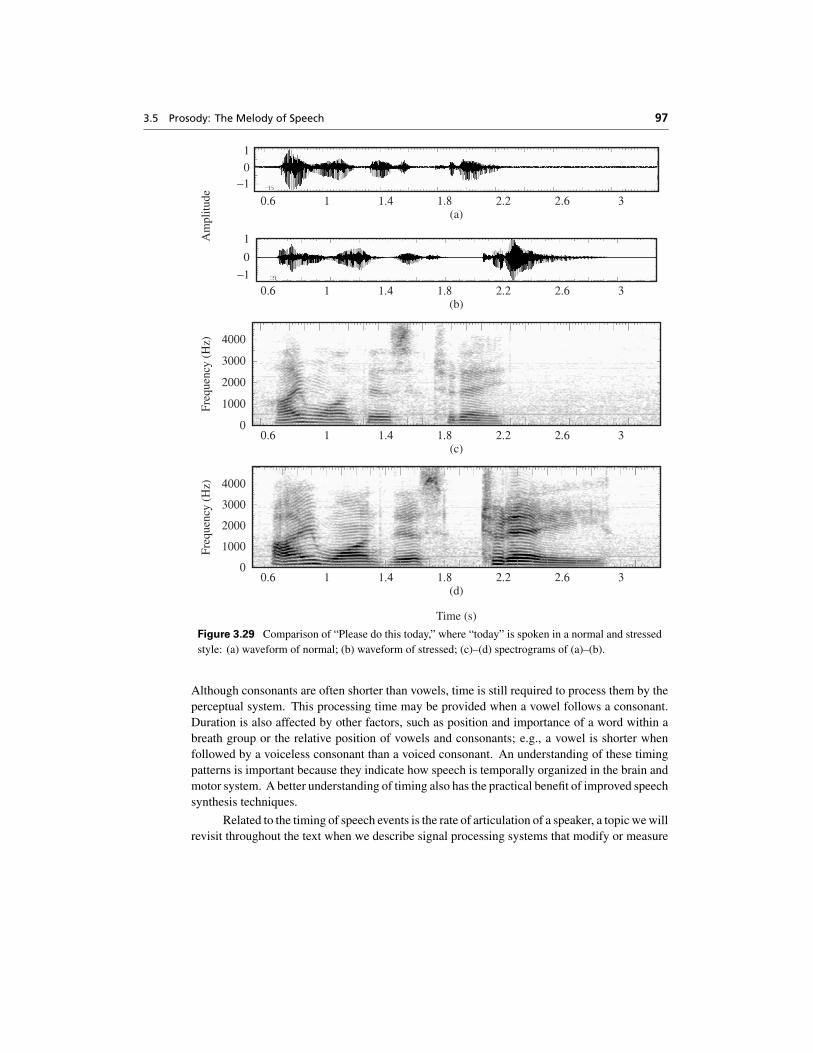
3.5 Prosody: The Melody of Speech 97
Time (s)
Freq
uenc
y (H
z)Fr
eque
ncy
(Hz)
Am
plitu
de
1
0−1
0.6 1 1.4 1.8 2.2 2.6 3(a)
1
0
−10.6 1 1.4 1.8 2.2 2.6 3
(b)
0.6 1 1.4 1.8 2.2 2.6 3
4000
2000
3000
1000
0
(c)
0.6 1 1.4 1.8 2.2 2.6 3
4000
2000
3000
1000
0
(d)
Figure 3.29 Comparison of “Please do this today,” where “today” is spoken in a normal and stressedstyle: (a) waveform of normal; (b) waveform of stressed; (c)–(d) spectrograms of (a)–(b).
Although consonants are often shorter than vowels, time is still required to process them by theperceptual system. This processing time may be provided when a vowel follows a consonant.Duration is also affected by other factors, such as position and importance of a word within abreath group or the relative position of vowels and consonants; e.g., a vowel is shorter whenfollowed by a voiceless consonant than a voiced consonant. An understanding of these timingpatterns is important because they indicate how speech is temporally organized in the brain andmotor system. A better understanding of timing also has the practical benefit of improved speechsynthesis techniques.
Related to the timing of speech events is the rate of articulation of a speaker, a topic we willrevisit throughout the text when we describe signal processing systems that modify or measure

98 Production and Classification of Speech Sounds Chap. 3
articulation rate for a variety of applications. Changing articulation rate compresses or expandssound events in time. Pickett [29] has done some extensive studies on the degree of change invowels and consonants in speaking at a faster or slower rate. Figure 3.30 illustrates spectrograms
Anticipation of Downstream Articulations
Anticipation of Downstream Articulations
VerySlowRate
2.9 s/s
SlowRate
3.1 s/s
NormalFormal
Style4.5 s/s
Conver-sational
Style5.0 s/s
FastRate
5.6 s/s
VeryFastRate
6.7 s/s
Figure 3.30 Spectrograms of utterance “anticipation of downstream articulators” at differentrates of articulation (slow to fast) by Pickett [29]. Articulation rates are estimated in syllablesper second (s/s). The lines drawn between successive spectrograms are synchronized with thesame points within the utterance and show the extent of compression across different articulationrates.
SOURCE: J.M. Pickett, The Sounds of Speech Communication [29]. ©1980. Reprinted by permission
of Allyn and Bacon.

3.6 Speech Perception 99
of a successively time-compressed utterance spoken at different rates. The top spectrogram is ofthe utterance spoken deliberately slowly, the third spectrogram corresponds to the normal rate ofspeech, and the last to the fastest rate of speech. We would expect the consonants to be typicallytime-compressed less than the vowels because of greater limits to consonant compressibility.Plosive consonants require complete vocal tract closure and certain timing relations between theburst and onset of voicing, while fricative consonants require a suitable vocal tract constrictionand also durational constraints. Pickett looked at the effect of articulation rate change on shortand long vowels, and plosive and fricative consonants. Going from the slowest to the fastest rate,both vowels and consonants were compressed by about 33%, more or less independently of theclass. On the other hand, in going from normal to the fastest rate, the vowels were compressedby 50% and the consonants by 26%. In this change, the short vowels were compressed by 64%and the long vowels by 43%, while the plosive consonants were compressed by 36% and thefricative consonants by 26%.
3.6 Speech PerceptionIn this section, we first briefly describe the acoustic properties of speech sounds that are essentialfor phoneme discrimination by the auditory system, i.e., the acoustic aspects of the speech soundthat act as perceptual cues. Our motivation is the goal of preserving such properties in speechsignal processing.14 We then take a glimpse at perceptual models of how the discriminatoryfeatures may be measured and processed by the listener.
3.6.1 Acoustic CuesWe are interested in acoustic components of a speech sound used by the listener to correctlyperceive the underlying phoneme. In previous sections, we touched upon a number of theseacoustic cues. Here we review and elaborate on these cues and give some additional insights.We look first at vowels and then at consonants.
Vowels — Formant frequencies have been determined to be a primary factor in identifying avowel. We have already seen that the listening experiments of Peterson and Barney approxi-mately map the first two formants (F1 and F2) to vowel identification. Higher formants alsohave a role in vowel identity [29]. As we will see in Chapter 4, because formant frequenciesscale with tract length, we would expect the listener to normalize formant location in doingphoneme recognition. In fact, there is evidence that such normalization is performed makingrelative formant spacings essential features in vowel identification [36]. Another factor in vowelperception is nasalization, which is cued primarily by the bandwidth increase of the first for-mant (F1) and the introduction of zeros [16]. As we pointed out earlier, however, unlike otherlanguages, vowel nasalization is not used in the American English language to aid in phonemediscrimination.
Consonants — Consonant identification depends on a number of factors including the formantsof the consonant, formant transitions into the formants of the following vowel, the voicing (orunvoicing) of the vocal folds during or near the consonant production, and the relative timing
14 We are also interested in acoustic properties that convey speaker recognizability, some of which weredescribed throughout this chapter.

100 Production and Classification of Speech Sounds Chap. 3
of the consonant and the onset of the following vowel. Consider the plosive voiced consonants:/b/, /d/, and /g/ and their unvoiced counterparts /p/, /t/, and /k/. Each plosive consonant ischaracterized by a spectrum determined by the vocal tract configuration in front of the closure,referred to as the formant locus, and by formant transitions that represent the movement from thelocus spectrum to the spectrum of the following vowel configuration [33]. Generally, perceptionof consonants depends upon the formant locus and formant transitions. Consider, for example,discrimination between /b/ and /d/ followed by the vowel /a/ as in “ba” and “da.” Two perceptualcues in this case are: (1) F1 of the formant locus is lower in /b/ than in /d/ and (2) F2 transitionsare upward from /b/ to the following vowel and downward from /d/ to the following vowel[33]. As with plosive consonants, with fricative consonants both the speech spectrum during thefrication noise and the transition into the following vowel are perceptual cues for identification.
We noted in a previous section that the time between the initial burst and the vowel onset,i.e., the voice onset time, is an important cue in discriminating voiced versus unvoiced plosiveconsonants. Consider, for example, a comparison between /t/ and /d/. If /d/ is extracted in theword “do” and the delay between the /d/ and /o/ continuously increased, then the “do” will beperceived as “to” when the voice onset time exceeds about 25 ms [33]. For both plosive andfricative consonants, we also noted previously that the presence (or lack) of voicing also servesas a perceptual cue in the discrimination of voiced versus unvoiced consonants, although itspresence is not necessary in this discrimination.
In addition to the direction of the formant transition, another important perceptual cue isthe rate of the transition. For example, it is possible to transform the perception of a plosiveconsonant into a semi-vowel by decreasing the formant transition rate between the plosive burstand the following vowel. Consider, for instance, the phoneme /b/ in the word “be.” The formanttransition duration between the /b/ and the following vowel /i/ is about 10 ms. As the transitionduration increases beyond about 30 ms the word “be” is transformed into the word “we,” i.e.,the plosive consonant /b/ is perceived as the semi-vowel /w/, which is characterized by a slowerformant transition rate (Exercise 3.19).
3.6.2 Models of Speech Perception
In the previous section, we described some acoustic attributes of speech sounds that allowtheir perceptual discrimination. We are now interested in the physiological correlates of theseattributes, i.e., the mechanism in the brain that detects the acoustic features ultimately leadingto the meaning of the message. One paradigm is the high-level motor theory model of speechperception which states that acoustic features map back to articulatory features. For example,formants of a vowel are detected (or estimated) and then unconsciously interpreted as the placeof articulation used in the vowel production [3]. Other examples are spectral harmonicity, orlack thereof, corresponding to a voiced or unvoiced source, and the burst or frication noisecorresponding to a complete or partial closure of the oral cavity. In essence, according to themotor theory, we create in our brains a picture of the basic (discrete) articulatory movementsresponsible for the acoustic feature.15 We should keep in mind, however, that there exist other
15 Stevens [34] has proposed that acoustic features tend to be insensitive to small changes in articulatoryconfigurations so that we do not need precise adjustment of these configurations; e.g., a small change in the placeof a constriction of a consonant produces little difference in the corresponding formant pattern. In this paradigm,even vowels formed in continuous movement of the vocal tract have this “quantal” nature.

3.7 Summary 101
developing theories of speech perception. For example, the observation of large articulatoryvariability in the phoneme /r/, using magnetic resonance imaging, suggests that speakers andlisteners rely on an acoustic representation in production and perception of speech, rather than anarticulatory representation [13]. Similar acoustic features for the phoneme /r/ can be generatedwith very different vocal tract shapes involving different tongue positions and constrictions, aswe described in Section 4.6. Such large articulatory variability can depend on phonetic contextand has been observed in other phonemes as well.
In the motor theory of perception, prior to making an articulatory mapping, we detect(or estimate) the acoustic features that serve as perceptual cues. There is evidence that featuredetection is carried out by the auditory system in the ear and auditory centers of the brain[5],[29]. Experiments have been carried out to study the possibility of special auditory detectorsfor the perception of formant energy, bursts, voice onset times, formant transitions, and thepresence (or lack) of voicing. Different features were found to correspond to different neuralcell firing patterns in the early and higher level auditory centers. There are two primary neuralcell firing characteristics used in feature detection: increase in the firing rate with a suddenchange in energy (within specific frequency bands) and the synchronizing of a firing patternto frequency. With plosive consonants, for example, some cells in the higher auditory levels,called onset cells, appear to fire at both the burst release and the vowel onset and thus maydirectly encode voice onset time in their response pattern. There is also evidence that in thedetection of plosive consonants, detectors may exist that are tuned to sense the burst and theformant transition into the following vowel. With vowels, formant energy can be identifiedin two ways. First, there is an increase in the firing rate of nerve fibers tuned to specificfrequencies and, second, nerve fibers synchronize with the formant frequency (firing at thepeaks in each cycle of these frequencies), a characteristic known as phase synchrony. Similarneural firing mechanisms are hypothesized to exist for identifying the pitch associated withharmonic spectra.
In the design of speech analysis and synthesis systems, we will need to consider howchanges in the temporal and spectral properties of a speech waveform affect its perception. Forexample, changes in the short-time Fourier transform phase characteristics of speech may affectthe phase synchrony of frequency components in firing patterns of auditory nerves. We willaddress such issues in Chapter 8 and other places throughout the text.
3.7 SummaryThis chapter described qualitatively the main functions of the speech production mechanismand the associated anatomy. Articulatory and acoustic descriptors of speech sounds were givenand, based on these features, the study of phonemics and phonetics was introduced. Someimplications of sound production and perception mechanisms for signal processing algorithmswere discussed. For example, the source mechanism can result in a variety of voice types, suchas the hoarse, breathy, or diplophonic voice, that can influence speech analysis and synthesisstrategies. Glottal secondary pulses that occur in the diplophonic voice, for instance, have in partmotivated multi-pulse speech analysis/synthesis, and aspiration that occurs in the breathy voicehas in part motivated residual-based speech analysis/synthesis, both of which we will study inChapter 12.

102 Production and Classification of Speech Sounds Chap. 3
It was emphasized that fine structure and transitory characteristics of both the source andsystem, such as formant transitions, voice onset time, and degree and timing of consonantalaspiration, are aspects of a sound that are important for its perceptual identity, and thus must beconsidered in the development of signal processing algorithms. These features were shown toform the smallest elements of a language, being combined to form its phonemes, and hypotheseswere presented that the auditory system is predisposed to these kinds of particular acoustic andarticulatory features. The property of coarticulation, which is the influence of the articulationof one sound on the articulation of other sounds in the same utterance, and the importanceof prosodics were also briefly discussed. In the next chapter, we develop a more quantitativedescription of the acoustics of speech production, showing how the heuristics of this chapter areapproximately supported with mathematical models. We also will predict other acoustic effectsnot seen by a qualitative treatment.
EXERCISES
3.1 Consider the following two-pole model for the glottal pulse:
G(z) = 1
(1 − αz−1)(1 − βz−1)(3.7)
with α and β both real, positive, and less than one, and where the region of convergence includesthe unit circle. In the time domain, g[n] can be expressed as the convolution of two decayingexponentials:
g[n] = (αnu[n]) ∗ (βnu[n]). (3.8)
(a) Sketch g[n] and |G(ω)|. Assume α and β are close to unity, say, about 0.95. Why areEquations (3.7) and (3.8) a reasonable model for the spectral magnitude, but not for the shapeof the glottal pulse?
(b) Explain why an improved model for the glottal pulse is given by
g[n] = g[−n].
Derive the z-transform of g[n]. Where are the poles of g[n] in relation to those of g[n]?
(c) Consider the periodic glottal flow waveform u[n] = g[n] ∗ ∑∞k=−∞ δ[n − kP ] where P
is the pitch period. Assuming the glottal pulse is two convolved decaying exponentials as inpart (b), sketch the Fourier transform magnitude of the windowed glottal flow waveform u[n]for a rectangular window with length equal to N and also 2N. Which window length wouldbe used in the calculation of a narrowband spectrogram of the glottal flow waveform?
3.2 Suppose we ask a speaker to hold a vowel steady. Ideally, the speaker would give a perfectly periodicwaveform with constant pitch and loudness. In practice, however, these characteristics change intime for a “steady-state” vowel. Such small alternating deviations can result in hoarseness in a voice.In this exercise, you explore the consequences of small changes in pitch and loudness on the speechspectrum.
Exercises 103
(a) Suppose that the pitch period of the speaker is steady except for a small deviation of ε thatalternates in sign every pitch period (Figure 3.31a). Show that the glottal pulse train (assumeno shaping) can be expressed as
p[n] =∞∑
k=−∞δ[n − (2k)P ] +
∞∑k=−∞
δ[n + ε − (2k + 1)P ].
Then derive the following expression:
|P(ω)|2 = 2(1 + cos[(ε − P)ω])
[ ∞∑k=−∞
2π
2Pδ(ω − k
2π
2P)
]2
where P(ω) is the Fourier transform of p[n]. Plot |P(ω)|2 for ε = 0, for 0 < ε P,and for ε = P. What is the effect of pitch jitter on the short-time speech spectrum? Sketchthe effect and assume a short-time rectangular window of length Nw = 3P. Argue whythe presence of pitch jitter may lead to the appearance of “false resonances” in the speechspectrum. In determining the effect of pitch jitter on the short-time spectrum, use MATLAB,if helpful.
(b) Suppose now that the amplitude of the ideal glottal pulses is constant except for a smallalternating deviation of /, as illustrated in Figure 3.31b. Derive the following expression for|P(ω)|2 :
|P(ω)|2 = 2(1 + /2)
[1 + (1 − /2)
(1 + /2)cos(Pω)
] [ ∞∑k=−∞
2π
2Pδ(ω − k
2π
2P)
]2
.
P + ∋ P + ∋ P + ∋P – ∋ P – ∋ P – ∋
n
n
0
1 – ∆ 1 – ∆ 1 – ∆ 1 – ∆1 + ∆ 1 + ∆
1
1 + ∆
–3P 3P–2P 2P–P P0
(a)
(b)
Figure 3.31 Illustration of (a) pitch and (b) amplitude jitter.

104 Production and Classification of Speech Sounds Chap. 3
Plot |P(ω)|2 for / = 0, 0 < / 1, and / = 1. Under the same short-time assumptionsas in part (a), argue why the presence of amplitude jitter may lead to the appearance of “falseresonances” in the speech spectrum.
3.3 Consider a vocal fold oscillation in a vocal fry or diplophonic state, where a secondary glottal flowpulse occurs within a glottal cycle. We model this condition over one pitch period as
g[n] = g[n] + αg[n − no]
where no is the time delay between the primary and secondary pulses. The resulting periodic glottalflow waveform is given by u[n] = ∑∞
k=−∞ g[n− kP ], where P is the pitch period.
(a) Determine the Fourier transform of g[n] in terms of the Fourier transform of g[n]. With thisresult, write the Fourier transform of the periodic glottal flow waveform u[n], i.e., U(ω).
(b) Suppose, in a diplophonic state, that no = P/2, where P is the glottal pitch period. Describehow the presence of g[n − no] affects, at the harmonic frequencies, the squared magnitudeof the Fourier transform U(ω) derived in part (a), i.e., of the Fourier transform of the glottalflow waveform u[n] = ∑∞
k=−∞ g[n− kP ]. Describe the effect as α changes from 0 to 1.
(c) Repeat part (b) with no = 3P/4 corresponding to a vocal fry state where the secondaryglottal pulse is close to the primary pulse.
3.4 Argue qualitatively why the first formant frequency of the singing voice is raised when a singer openshis/her jaw wide.
3.5 Referring to the phoneme symbols in Figure 3.17, do a complete phonemic transcription of thefollowing sentences:
(a) May we all learn a yellow lion roar.
(b) She sells sea shells by the sea shore.
(c) The next man ate an azure estimate.
(d) Thieves who rob friends deserve jail.
Whenever you feel that more than one phoneme might occur, indicate which ones.
3.6 There are a variety of ways of classifying speech sounds into distinctive sounds (i.e., phonemes).These methods fall under the study of articulatory phonetics and acoustic phonetics.
(a) List the procedures used for distinguishing speech sounds in both areas of study.
(b) Describe the articulatory and acoustic differences and similarities between the voiced fricative/z/, as in “azure,” and the unvoiced fricative /S/, as in “she.”
3.7 In this exercise you work with the speech waveform given in Figure 3.13.
(a) Perform a phonetic transcription of the sentence illustrated in Figure 3.13. Place phoneticsymbols next to each phoneme.
(b) Assume that the utterance is plotted for 2 seconds and the sampling rate is 10000 samples persecond. Also assume that spoken English can be represented in terms of 40 phonemes, andsentences are formed by simple concatenation of these phonemes. Estimate the informationrate (bit rate) of spoken English. Hint: Compute the number of bits represented by 40phonemes.

Exercises 105
3.8 Consider the spectrograms defined in Section 3.3.
(a) Derive the narrowband spectrogram approximation in Equation (3.5). Assume that the widthof the window Fourier transform mainlobe is less than 2π
P, where P is the pitch period.
(b) Derive the wideband spectrogram approximation in Equation (3.6). Assume the vocal tractimpulse response decays to roughly zero by the end of a glottal cycle. Hint: Consider thevocal tract impulse response as a set of decaying sinewaves. The short sliding window seesthese sinewaves as having decreasing amplitudes.
3.9 Consider the variability of vowel characteristics among speakers. If humans can create a phonemefrom similar vocal tract shapes, but with different speaker identifiability, then the source and prosodymust play a large role in speaker characteristics, as well as the vocal tract. A ventriloquist, forexample, can keep his/her vocal tract in roughly the same shape (i.e., for a particular phoneme), yetmimic different voices. Offer an explanation in terms of source and prosodic characteristics.
3.10 Determine the Fourier transform of the response x[n] for the voiced fricative model in Example 3.4.Assuming you are given the vocal tract and front cavity responses h[n] and hf [n], respectively,propose a method for determining the source functions u[n] and q[n].
3.11 Based on the spectrogram, propose a method for measuring a speaker’s rate of articulation. Hint:Consider the difference in spectral magnitudes in time, integrate this difference across frequency,and form a speaking rate metric.
3.12 Propose a simplified mathematical model of an unvoiced plosive, accounting for the burst after theopening of the oral tract closure and aspiration noise prior to the onset of voicing. Model the burst asan impulse δ[n] and aspiration as a noise sequence q[n]. Assume a linear time-varying oral tract.
3.13 Consider the two utterances of Example 3.6 shown in Figure 3.29. For each case, normal and stressed,make a rough estimate of the pitch contour during the vowel /e/ in the word “today.” Also, make asketch of possible glottal airflow velocity, and the corresponding source spectrum, in each case.
3.14 Propose weaknesses in the motor theory of speech production and perception.
3.15 Using the simple pitch generation rules given at the beginning of Section 3.5, sketch roughly a pitchcontour for the declarative statement, “I think, therefore I am,” and for the question, “I think, thereforeI am?” It will help to listen to yourself recite the two phrases and feel the change in tension in yourvocal folds.
3.16 Consider a continuous-time window w(t) that is a rectangle over |t | ≤ T and zero elsewhere.
(a) Define the window’s duration as D = 2T and the bandwidth B as the distance between itstwo first zero crossings in frequency to the right and left of the frequency origin. State therelation constraining D and B. It is important to recognize in this case that the product DBhas a lower limit that is not equal to that given in the uncertainty principle of Chapter 2 (seeChapter 11 for the continuous-time version). This is because the definition of signal durationand bandwidth in this problem is not the same as that in Chapter 2. The specific lower-limitconstant will change with these definitions. The important property is the inverse relationbetween duration and bandwidth.
(b) Consider a very simple speech waveform consisting of only one sinewave and bandpass noisewhose spectrum is shown in Figure 3.32a. Multiply the speech by the window of part (a) andfind the shortest window length D so that the Fourier transform of the windowed sinewavecomponent does not interact with the Fourier transform of the windowed noise. Approximatethe Fourier transform of the window by only its main lobe, i.e., up to the first positive- andnegative-frequency zero crossing.

106 Production and Classification of Speech Sounds Chap. 3
3Ωo 5Ωo 30003000
Noise Noise
X(Ω) X(Ω)
1000 40004000 Ω (Hz)Ω 2ΩoΩo 4Ωo
(a) (b)
Figure 3.32 Spectra for Exercise 3.16: (a) sinewave and noise; (b) simple voiced fricative.
(c) Consider a more complex speech waveform consisting of five sinewaves harmonically relatedas in Figure 3.32b and the same noise spectrum as above; one can think of this as a simplemodel of a voiced fricative. The fundamental frequency or “pitch” is denoted by 3o . TheFourier transform of the rectangular window is again approximated as one main lobe, but nowthe width of this main lobe is given by 23o . Multiply the speech by the window and find thelargest pitch possible so that the Fourier transform of the windowed voiced speech componentdoes not interact with the Fourier transform of its windowed unvoiced (noise) component.
3.17 (MATLAB) On the companion website, you will find in the directory Chap exercises/chapter3 aworkspace ex3M1.mat. Load this workspace and plot the speech waveform labeled speech1 10k.This speech segment was taken from a vowel sound that is approximately periodic, 25 ms in duration,and sampled at 10000 samples/s.
(a) Plot the log-magnitude of the Fourier transform of the signal over the interval [0, π ], usinga 1024-point FFT. The signal should be windowed with a Hamming window of two differentdurations: 25 ms and 10 ms with the window placed at the signal’s center in each case. Showthe log-magnitude plot for each duration.
(b) Which spectral estimate is more suitable to pitch estimation? Explain.
3.18 (MATLAB) In this MATLAB exercise, you design a number of glottal pulse trains with differentshapes and pitch, and analyze their spectral and perceptual properties.
(a) Create in MATLAB the following glottal pulse, which is a time-reversed decaying exponentialconvolved with itself:
g[n] = (α−nu[−n]) ∗ (α−nu[−n]).
Set the length of g[n] to where it has effectively decayed to zero. Experiment with thedifferent values of α = 0.9, 0.95, 0.99, 0.998 and compute the resulting Fourier transformmagnitude, using a FFT length sufficiently long to avoid significant truncation of the pulse.
(b) Convolve g[n] from part (a) (with α = 0.99) with a periodic impulse train of pitch 100 Hzand 200 Hz. Assume an underlying sampling rate of 10000 samples/s. Using the MATLABsound.m function, listen to the two pulse trains and make a perceptual comparison. Windowa 20-ms piece (with a Hamming window) of the waveform and compare the spectral envelopeand harmonic structure for the two pitch selections.
(c) We can consider the glottal pulse in part (a) as arising from vocal folds with an abrupt closureand thus corresponding to a “hard” voice. Modify the pulse shape (α = 0.99) so that the

Exercises 107
sharp edge at closure is rounded off, corresponding to vocal folds that close more gradually.Compute the resulting Fourier transform magnitude. Repeat part (b) with your new glottalpulse. How does your result compare perceptually with the pulse train of part (b)?
3.19 (MATLAB) On the companion website, you will find in the directory Chap exercises/chapter3 aworkspace ex3M2.mat. In this workspace, you will find waveforms of the words “we” and “be” (at10000 samples/s) in the array we be 10k. The waveforms and a spectrogram of the waveforms areshown in Figure 3.33. To display the spectrogram and waveform, use the function specgram ex3p19.malso in Chap exercises/chapter3. To listen to the waveform, use the MATLAB function sound.m.
(a) The spectrogram in Figure 3.33b was obtained with a window duration of 20 ms (200 samplesfor a 10000-samples/s sampling rate) and a frame interval of 1 ms (10 samples for a 10000-samples/s sampling rate). Display with MATLAB the spectrogram in Figure 3.33b using theroutine specgram ex3p19.m. Is this a narrowband or wideband spectrogram? Now displaythe spectrogram using a 5-ms window and a 1-ms frame interval. Is the result a narrowband orwideband spectrogram? For this 5-ms window, describe how the time and frequency resolutionof speech events differs from that of the spectrogram in Figure 3.33b. Then display a varietyof spectrograms with window durations longer than 20 ms and shorter than 5 ms, together withframe intervals both equal to and greater than 1 ms, and describe the resulting time-frequencytradeoffs.
(b) Splice out the voiced plosive “b” in the word “be” and synthesize a word with an increase in thevoice onset time of the “b.” What is the perceptual effect? Is it possible to transform the voicedplosive “b” to the unvoiced plosive “p” with this change in the voiced onset time? Considerattributes such as vocal cord vibration and aspiration. (In splicing, display the waveform andspectrogram of the word “be” and use the MATLAB function ginput.m.) Optional: If yourtransformed sound does not sound like a “p” then, again considering vocal cord vibration andaspiration, make a more accurate transformation.
Time (s)
Freq
uenc
y (H
z)A
mpl
itude
(a)0 0.2 0.4 0.6 0.8 1 1.2 1.4
10
−1
(b)0 0.2 0.4 0.6 0.8 1 1.2 1.4
5000
4000
3000
2000
1000
0
Figure 3.33 (a) Waveform and (b) narrowband spectrogram of sequence of words “we”and “be.”

108 Production and Classification of Speech Sounds Chap. 3
(c) Now interchange the “b” and “w” in the two words “be” and “we.” In splicing, be careful thatyou capture all important perceptual cues of the two phonemes. What is the effect? Can youinterchange the two words by interchanging the two initial phones?
BIBLIOGRAPHY
[1] A. Barney, C.H. Shadle, and P.O.A.L. Davies, “Fluid Flow in a Dynamical Mechanical Model ofthe Vocal Folds and Tract. 1: Measurements and Theory,” J. Acoustical Society of America, vol.105, no. 1, pp. 444–455, Jan. 1999.
[2] R.G. Carlson, G. Fant, and B. Granstrom, “Two-Formant Models, Pitch, and Vowel Perception,”chapter in Auditory Analysis and Perception of Speech, G. Fant and B. Granstrom, eds., pp. 55–82,Academic Press, New York, 1975.
[3] N. Chomsky and M. Halle, “Sound Patterns of English,” chapter in Preliminaries to Speech Anal-ysis, R. Jakobson, G. Fant, and M. Halle, eds., The MIT Press, 1963.
[4] P.B. Denes and E.N. Pinson, The Speech Chain: The Physics and Biology of Spoken Language,Anchor Press-Doubleday, Garden City, NY, 1973.
[5] B. Delgutte, “Auditory Neural Processing of Speech,” chapter in The Handbook of Phonetic Sci-ences, W.J. Hardcastle and L. Laver, eds., Blackwell, Oxford Press, 1995.
[6] J.R. Deller, J.G. Proakis, and J.H.L. Hansen, Discrete-Time Processing of Speech, MacmillanPublishing Co., New York, NY, 1993.
[7] C.Y. Espy-Wilson, S. Narayanan, S.E. Boyce, and A.A. Alwan, “Acoustic Modeling of the AmericanEnglish /r/,” Proc. Eurospeech97, Rhodes, Greece, vol. 1, pp. 1239–1242, 1997.
[8] G. Fant, Acoustic Theory of Speech Production, with calculations based on X-ray studies of Russianarticulations, Mouton, The Hague, Paris, 1970.
[9] D.W. Farnsworth, “High-Speed Motion Pictures of the Human Vocal Folds,” Bell LaboratoryRecord, vol. 18, pp. 229–262, 1940.
[10] J.L. Flanagan, Speech Analysis, Synthesis, and Perception, Second Edition, Springer-Verlag, NewYork, NY, 1972.
[11] J.L. Flanagan and K. Ishizaka, “Computer Model to Characterize the Air Volume Displaced by theVibrating Vocal Cords,” J. Acoustical Society of America, vol. 63, no. 5, pp. 1559–1565, May1978.
[12] J.L. Flanagan and R.M. Golden, “Phase Vocoder,” Bell System Technical J., vol. 45, no. 9, pp.1493–1509, Nov. 1966.
[13] F.H. Guenther, C.Y. Espy-Wilson, S.E. Boyce, M.L. Matthies, M. Zandipour, and J.S. Perkell,“Articulatory Tradeoffs to Reduce Acoustic Variability during the American English /r/ Production,”J. Acoustical Society of America, vol. 105, no. 5, pp. 2854–2865, May 1999.
[14] H.M. Hansen, Glottal Characteristics of Female Speakers, Ph.D. Thesis, Harvard University, May1995.
[15] H. Herzel, I. Steinecke, W. Mende, and K. Wermke, “Chaos and Bifurcations during Voiced Speech,”chapter in Complexity, Chaos, and Biological Evolution, E. Moskilde, ed., pp. 41–50, PlenumPress, NY, 1991.
[16] A.S. House and K.N. Stevens, “Analog Studies of the Nasalization of Vowels,” J. Speech andHearing Disorders, vol. 21, pp. 218–232, 1957.

Bibliography 109
[17] S. Kiritani, H. Imagawa, and H. Hirose, “Vocal Cord Vibration and Voice Source Characteristics:Observations by a High-Speed Digital Image Recording,” Proc. Int. Conf. on Spoken LanguageProcessing, Kobe, Japan, pp. 61–64, 1990.
[18] D.H. Klatt and L.C. Klatt, “Analysis, Synthesis, and Perception of Voice Quality Variations amongFemale and Male Talkers,” J. Acoustical Society of America, vol. 87, no. 2, pp. 820–857, 1990.
[19] M. Krane, D. Sinder, and J. Flanagan, “Synthesis of Unvoiced Speech Sounds Using an AeroacousticSource Model,” J. Acoustical Society of America, vol. 105, no. 2, pt. 2, ASA Convention Record,pp. 1160, Feb. 1999.
[20] P.K. Kundu, Fluid Mechanics, Academic Press, New York, NY, 1990.
[21] P.M. Lieberman, “The Articulatory Implementation of the Breath Group and Prominence,” Lan-guage, vol. 46, pp. 312–327, 1970.
[22] R.P. Lippmann, “Accurate Consonant Perception without Mid-Frequency Speech Energy,” IEEETrans. Speech and Audio Processing, vol. 4, no. 1, pp. 66–69, Jan. 1996.
[23] R.J. McAulay and T.F. Quatieri, “Speech Analysis-Synthesis Based on a Sinusoidal Representa-tion,” IEEE Trans. Acoustics, Speech, Signal Processing, vol. ASSP–34, no. 4, pp. 744–754, Aug.1986.
[24] S. Narayanan, A.A. Alwan, and K. Haken, “Toward Articulatory-Acoustic Models for LiquidApproximants Based on MRI and EPG Data,” J. Acoustical Society of America, vol. 101, no. 2,pp. 1064–1089, Feb. 1997.
[25] H. Nawab and T.F. Quatieri, “Short-Time Fourier Transform,” chapter in Advanced Topics in SignalProcessing, J.S. Lim and A.V. Oppenheim, eds., Prentice Hall, Englewood Cliffs, NJ, 1988.
[26] P.M. Narins, “Frog Communication,” Scientific American, pp. 80–83, Aug. 1995.
[27] D. O’Shaughnessy, Speech Communication: Human and Machine, Addison-Wesley, Reading,MA, 1987.
[28] G.E. Peterson and H.L. Barney, “Control Methods Used in a Study of Vowels,” J. Acoustical Societyof America, vol. 24, no. 2, pp. 175–184, March 1952.
[29] J.M. Pickett, The Sounds of Speech Communication, Pro-Ed, Inc., Austin, TX, 1980.
[30] S. Pinker, The Language Instinct: How the Mind Creates Language, Harper Perennial, New York,NY, 1995.
[31] R.K. Potter, G.A. Kopp, and H.G. Kopp, Visible Speech, Dover Publications, Inc., New York, 1966.
[32] L.R. Rabiner and R.W. Schafer, Digital Processing of Speech Signals, Prentice Hall, EnglewoodCliffs, NJ, 1978.
[33] K.N. Stevens, Acoustic Phonetics, The MIT Press, Cambridge, MA, 1998.
[34] K.N. Stevens, “The Quantal Nature of Speech: Evidence from Articulatory-Acoustic Data,” chapterin Human Communication: A Unified View, P.B. Denes and E.E. David, Jr., eds., McGraw-Hill,New York, 1972.
[35] B.H. Story, I.R. Titze, and E.A. Hoffman, “Vocal Tract Area Functions from Magnetic ResonanceImaging,” J. Acoustical Society of America, vol. 100, no. 1, pp. 537–554, July 1996.
[36] A.Q. Summerfield and M.P. Haggard, “Vocal Tract Normalization as Demonstrated by ReactionTimes,” chapter in Auditory Analysis and Perception of Speech, G. Fant and M. Tatham, eds., pp.115–141, Academic Press, New York, 1975.

110 Production and Classification of Speech Sounds Chap. 3
[37] J. Sundberg, “The Acoustics of the Singing Voice,” Scientific American, pp. 82–91, March 1977.
[38] H.M. Teager and S.M. Teager, “Evidence for Nonlinear Sound Production Mechanisms in the VocalTract,” chapter in Speech Production and Speech Modeling, W.J. Hardcastle and A. Marchal, eds.,NATO Adv. Study Inst. Series D, vol. 55, Bonas, France; Kluwer Academic Publishers, Boston,MA, pp. 241–261, 1990.
[39] B. Story and I.R. Titze, “Voice Simulation with a Body Cover Model of the Vocal Folds,” J.Acoustical Society of America, vol. 97, pp. 1249–1260, 1995.
[40] R.L. Whitehead, D.E. Metz, and B.H. Whitehead, “Vibratory Patterns of the Vocal Folds duringPulse Register Phonation,” J. Acoustical Society of America, vol. 75, no. 4, pp. 1293–1297, April1984.