Embed Size (px)
Citation preview

Patterns of pre-construction bat activity at a proposed wind facility in northwest Massachusetts
2006 Annual Report
Edward B. Arnett Bat Conservation International
Manuela M. P. Huso
EcoStats, LLC
D. Scott Reynolds Northeast Ecological Services
Michael Schirmacher
Bat Conservation International
Annual Report Prepared for the BATS AND WIND ENERGY COOPERATIVE
September 2007

REPORT CITATION Arnett, E. B., M. M. P. Huso, D. S. Reynolds, and M. Schirmacher. 2007. Patterns of pre-construction bat activity at a proposed wind facility in northwest Massachusetts. An annual report submitted to the Bats and Wind Energy Cooperative. Bat Conservation International. Austin, Texas, USA.
ACKNOWLEDGMENTS
This study was conducted under the auspices of the Bats and Wind Energy Cooperative (BWEC). We wish to thank the American Wind Energy Association (AWEA), Bat Conservation International (BCI), the National Renewable Energy Laboratory-Department of Energy (NREL), and the U.S. Fish and Wildlife Service (USFWS) for partnering to form the Bats and Wind Energy Cooperative (BWEC). Tom Gray (AWEA), Alex Hoar (USFWS), Bob Thresher (NREL), and Merlin Tuttle (BCI) provided oversight for the BWEC on this project.
We wish to thank the Massachusetts Technology Collaborative (MTC) and PPM Energy for funding this study, and the numerous donors to BCI, member companies of AWEA, and the National Fish and Wildlife Foundation, for additional support. Kristen Goland, formerly with MTC and now with PPM Energy, was instrumental in pulling support together for this study. We also thank PPM Energy employees Andy Linehan and Scott McDonald for their support and efforts. Jack Waggert assisted with installation of detector systems on meteorological towers and helped with many logistical aspects of the study. We thank members of the BWEC Scientific Advisory Committee and the technical advisory committee for their review of this report.

2
EXECUTIVE SUMMARY We initiated a multi-year pre- and post-construction study in mid-summer 2006 to
determine patterns of bat activity and evaluate the use of acoustic monitoring to predict mortality of bats at a proposed wind energy facility in northwest Massachusetts. The primary objectives of this study are to 1) determine level and patterns of activity of different species groups of bats using the proposed wind facility prior to and after construction of turbines; 2) correlate bat activity with weather and other environmental variables; and 3) combine results from this study with those from similar efforts to determine if indices of pre-construction bat activity can be used to predict post-construction bat fatalities at proposed wind facilities. Here we report results from the first year of pre-construction data collection.
We recorded echolocation calls of bats with Anabat II zero-crossing ultrasonic detectors programmed to record calls from 1900 to 0700 hr each day of the study from 26 July to 20 December 2006. We used meteorological (met) towers to vertically array detectors for acoustic sampling during this study (one detector at 10, 31, and 39 m above ground level (AGL) at each tower). We recorded a total of 4,816 bat calls from all detectors at all met tower locations combined from 26 July through 11 November, an average of 8.9 calls per tower per night. No bat calls were recorded between 11 November and 20 December 2006. Bat activity generally was highest immediately after sunset and declined through the night until just before sunrise the following morning. High (>35 kHz, mostly Myotis species and red bats [Lasiurus borealis]) and low (<35 kHz, mostly hoary bats [Lasiurus cinereus] and big brown bats [Eptesicus fuscus]) frequency-emitting echolocating bats tended to fly at different heights on the study area. We estimated that activity rates for bats using high frequencies were 1.5–4.0 times higher than those using low frequencies at low altitudes (10 m). This trend was reversed at medium altitudes (31 m) where it was estimated that activity rates for bats using low frequencies were 5.75–22.9 times greater than those for high frequency users, and at 39 m AGL it was estimated that activity rates for bats using low frequencies were 11.2–38.8 times greater than those for high frequency users.
The best model of bat activity in relation to weather variables included linear effects of temperature and wind speed and their interaction, the quadratic effect of wind speed, and the interaction of temperature with high versus low frequency echolocating bat groups. Bat activity was strongly related to temperature, but the effect differed for high and low frequency groups; high frequency users responded more to temperature than did low frequency users. For every 1oC increase in temperature, bat activity increased 14–57% for high frequency users and 5–34% for those using low frequencies. Bat activity increased slightly with increasing wind speed, but then decreased at higher wind speeds. Wind speeds at which maximum bat activity was predicted changed with temperature. In general, when temperatures were warm (>20ºC) and wind speeds were moderate (about 8 m/s), the predicted number of passes on any night was low, except for high frequency using bats.
This study was conducted at one proposed wind energy facility located on a forested ridge, so statistical inferences are limited to this site. However, our findings may reflect patterns of bat activity on similar forested ridges with comparable vegetation composition and

3
topography in Massachusetts and surrounding states. Due to logistical constraints we were unable to gather activity data for the entire period of the year when bats are known to be active in this region (generally April through November), but our sampling did encompass the fall migration period when bats have been most frequently reported killed at wind facilities. Analyses presented in this report are exploratory, in part because so little data exist upon which to develop a priori, confirmatory hypotheses and associated candidate models. The current analysis only estimates activity rates and differences in activity patterns of two species groups (high and low frequency). Development of species-specific models is anticipated to occur in future years of the study. A second year of pre- construction acoustic monitoring was initiated in June 2007 and will continue through November 2007, and a third year of pre-construction acoustic data may be collected if the project is not constructed in 2008. After turbines are constructed, we anticipate gathering two consecutive years of post-construction activity and fatality data from April through November each year. INTRODUCTION
Wind has been used to commercially produce energy in North America since the early
1970s and is one of the most rapidly growing sectors of the energy industry (Pasqualetti et al. 2004, National Research Council 2007). Wind turbines are able to generate electricity without many of the negative environmental impacts associated with traditional fossil energy sources (e.g., air and water pollution, greenhouse gas emissions associated with global warming and climate change). However, fatalities of bats have been reported at wind facilities worldwide (Hall and Richards 1972, Dürr and Bach 2004, Johnson 2005, Kunz et al. 2007a, Arnett et al. 2008). Bat mortality at wind facilities received little attention until 2003 when 1,400–4,000 bats were estimated to have been killed at the Mountaineer Wind Energy Center in West Virginia (Kerns and Kerlinger 2004). Documentation of continued high bat mortality at Mountaineer in 2004 (Arnett 2005) coupled with survey data from Tennessee indicating equal and higher kill rates than Mountaineer (Fiedler 2004, Fiedler et al. 2007) support the contention that forested ridges in the eastern U.S. are exceptionally high risk sites for bat fatalities. Recent studies from New York (Jain et al. 2007) and Canada (Brown and Hamilton 2006, E. Baerwald and R.M.R. Barclay, University of Calgary, unpublished data) indicate that high fatalities are not limited to forested ridges and suggest that bat mortality is far more extensive than previously expected. These mortality levels raise concerns about potential cumulative negative effects on bat populations at a time when many species of bats are known or suspected to be in decline (Pierson 1998, Racey and Entwistle 2003, Winhold and Kurta 2006) and extensive planning and development of wind energy is increasing worldwide (EIA 2007, Kunz et al. 2007a).
Interactions between bats and wind turbines remain poorly understood. The combination of nocturnal habits, ability to fly, volancy, small size, and variation in resource dependence (i.e., species vary in roost, water, and food resource dependence), have made even a rudimentary understanding of how bats interface with their environment difficult to establish (Gannon et al. 2003). Post-construction monitoring at a few sites has provided what little information exists on bat fatalities at wind facilities. While patterns of bat fatality at wind facilities allow for some

4
conjecture about risk factors for some species, information on use of the area encompassing a facility is needed to place bat fatality in an appropriate context (Fiedler 2004). Pre-construction surveys at wind facilities have been conducted and most commonly employ mist nets and acoustic detectors (e.g., Reynolds 2006) to assess local bat species presence and activity. However, using this information to predict bat fatality and, thus risk at a site has proved to be challenging. The ability to generate reliable risk assessments during the early planning phase, and prior to site selection and construction of wind facilities, is hampered by the lack of baseline data on bat population distributions and densities (O’Shea et al. 2003, Reynolds 2006) and migratory patterns and behavior of bats (Larkin 2006, Cryan and Brown 2007) throughout much of North America. Acoustic monitoring allows researchers to detect and record calls of echolocating bats that can be used to assess relative activity and identify species or groups of species (Kunz et al. 2007b). Monitoring echolocation calls has limitations and acoustic detectors often are used in the field without the use of standardized protocols or a thorough understanding of these limitations and the underlying assumptions (Hayes 2000, Sherwin et al. 2000, Weller and Zabel 2002, Gannon et al. 2003). Estimating amount of activity is relatively straightforward, but estimating abundance requires differentiation between multiple passes of a single bat and multiple bats making single passes, and is not usually possible through echolocation monitoring. Echolocation calls are reliably distinguishable from other sounds (e.g., bird, arthropod, wind, mechanical), but ability to distinguish species of bats varies with taxon, location, type of equipment, and quality of recording, and may be quite challenging (Barclay 1999, Hayes 2000).
Understanding bat activity levels prior to construction of wind facilities could assist in identifying habitats and features that may pose high risk of fatality and aid with decision-making, including specific placement of turbines (Fiedler 2004, Reynolds 2006). Unfortunately, past and current efforts to acoustically monitor bat activity prior to construction of turbines may suffer from flaws in study design, including small sample sizes and poor temporal and spatial replication (Hayes 1997, 2000), pseudoreplication (Hurlbert 1984), and inappropriate inference because limitations and assumptions were not understood or clearly articulated (Hayes 2000, Sherwin et al. 2000, Gannon et al. 2003). Also, there is a lack of information and lack of agreement among stakeholders, biologists, and scientists regarding what constitute different levels of risk in relation to bat activity and potential fatality of bats at wind facilities. Perhaps most importantly, we currently are unaware of any study that has correlated pre-construction monitoring data with post-construction fatality, a fundamental link necessary for understanding potential risk of wind facilities to bats.
We initiated a multi-year pre- and post-construction study in summer and fall 2006 to evaluate whether indices of bat activity measured before construction, using acoustic detectors, could predict post-construction fatality of bats at a proposed wind facility (herein referred to as the “Hoosac” site) in northwest Massachusetts. This project will occur in two phases. The first phase collected echolocation calls to develop indices of bat activity from July through November 2006; we will continue to collect these data from June through November 2007 and April through November 2008 if the facility is not under construction. The second phase will involve

5
extensive fatality searches from mid-April through November for two consecutive years after construction. Here, we present results from the 2006 field season, discuss patterns and preliminary conclusions, and outline next steps for this project.
OBJECTIVES 1. Determine the levels and patterns of activity of different species groups of bats using the area
of the Hoosac site in northwestern Massachusetts. 2. Determine temporal and spatial patterns of bat activity at turbine locations across the wind
facility with acoustic detectors positioned near ground level (10m), within the bottom portion of the turbine rotor-swept zone (39.2m above the ground), and at an intermediate level (31 m above the ground).
3. Combine results from this study with those from similar studies to evaluate if indices of pre-
construction bat activity can be used to predict relative risk of post-construction bat fatalities at a site.
This report focuses on Objectives 1 and 2; results from this study will be combined with several other similar ongoing efforts (e.g., Arnett et al. 2006) after 2009 to address Objective 3. STUDY AREA and METHODS Study Area
The Hoosac study area is located in Berkshire and Franklin Counties in northwest Massachusetts (Figure 1). Elevation of this site ranges from approximately 720 to 870 m. There are two proposed “strings” of turbines at this site (Figure 1). The western string has 11 turbine locations and two 40 m tall meteorological (herein referred to as “met”) towers (Bakke 1 and Bakke 2, Figure 1) currently installed that gathered weather data continuously during the study (herein referred to as “Bakke;” Figure 1). The eastern string has 9 turbine locations and three 40 m tall met towers (Crum 1, Crum 2, and Crum 3; herein referred to as “Crum;” Figure 1).
Acoustic Surveys We recorded bat echolocation calls using broadband acoustic detectors (Anabat II zero-crossing ultrasonic detectors and CF-ZCAIM storage unit, Titley Electronics Pty Ltd, Ballina, NSW Australia) during the pre-construction phase. Each detector was programmed to record data from 1900 to 0700 hr each night of the study. We calibrated sensitivity of Anabat detectors according to Larson and Hayes (2000) at the beginning of the field season.

6
Figure 1. Location of the Hoosac study area in Berkshire and Franklin County in northwest Massachusetts, and locations of 5 meteorological towers (Bakke 1 and 2, Crum 1, 2, 3).
= 40 m meteorological tower
= Proposed turbine locations
Bakke 1
Bakke 2
Crum 1
Crum 2
Crum 3

Figure 2. Depiction of the vertical array of acoustic detectors used at portable (left) and meteorological (right) towers (figure modified from Reynolds 2006).
39 m high
31 m high
10 m high
= Detector
Meteorological Tower
Approx. Canopy Height
______________________________________________________________________________ We deployed detectors on all five met towers for acoustic sampling (Figure 2; also see Reynolds 2006) during this study. The height of met towers (40 m) allowed acoustic monitoring at a height that reached into the lower portion of the rotor-swept zone of turbines likely to be installed at this facility. Three acoustic detectors were vertically arranged at each of the 5 met towers at 10, 31, and 39 m above the ground (Figure 2). We deployed microphones for each detector within water-proof casings (a.k.a., “bat-hats;” Figure 3; EME Systems, Berkeley, California, USA) attached to electrical cable that extended to near the ground, where detectors were placed in waterproof boxes (Figure 4). We lowered each met tower and attached the bat hat system at each height. We subjectively chose the direction of each microphone on each met tower assumed to maximize recordings of calls (Weller and Zabel 2002) based on our perception of how bats would migrate through or use habitats located at each site (Table 1). Echolocation calls and weather data were collected at each tower for consecutive nights from 26 July through 20 December, 2006. All detectors at Bakke1 were functional on all 108 nights. Functionality of the other detectors ranged from as little as 55% (Crum1, medium height) to 99% (Table 2). Definitions and Assumptions Following Hayes (2000), Sherwin et al. (2000), and Gannon et al. (2003), we made the following a priori definitions: 1) a bat pass was considered a sequence of echolocation calls
7

consisting of two or more individual calls (Thomas 1988, O’Farrell and Gannon 1999, Gannon et al. 2003); 2) passes were treated as independent (i.e., any sequence was considered a discrete Figure 3. Photograph of “bat hats” used to deploy acoustic microphones at multiple heights on meteorological towers.
Figure 4. Waterproof boxes used to store acoustic detectors, data storage units, and a solar battery at ground-level and a 30 watt solar panel mounted to a meteorological tower (photo by D. S. Reynolds.)
8

event); and 3) each tower was treated as an independent observational unit repeatedly measured each night throughout the sampling period. We assumed that 1) species consistently call at either high or low frequencies and that 35 kHz (average minimum call frequency) can be used as a threshold to accurately separate these species into two groups; 2) that simultaneous sampling at five sites per night would adequately account for temporal and spatial variation; and 3) that the number of bat passes recorded reflects amount of use by bats. Analyses
We downloaded and processed data from detectors throughout the sampling period. All extraneous noise was eliminated from the data sets prior to summary and analysis using filters in the Anabat analysis program Analook. These “cleaned” call data files were then sorted by tower and date for further analyses.
High – low call frequency determination. We divided echolocation calls into two groups based on minimum frequency of the call, in part because bats using these frequencies may differ in their use of habitat and in their response to environmental factors. To accomplish this, two filters were constructed in the Anabat analysis program Analook for use in classifying echolocation calls of the file as being produced by either a high (>35 kHz minimum frequency) ______________________________________________________________________________ Table 1. Height and direction of acoustic detector microphones on each metrological (met) tower located at the proposed Hoosac site in northwestern Massachusetts. Met Tower Name Height (m) Azimuth (cardinal direction) Bakke 1
10.0 m
60 (east)
31.5 m 310 (northwest) 39.2 m 115 (east) Bakke 2 10.0 m 180 (south) 31.5 m 270 (west) 39.2 m 0 (north) Crum 1 10.0 m 135 (south) 31.5 m 0 (north) 39.2 m 180 (south) Crum 2 10.0 m 125 (southeast) 31.5 m 180 (south) 39.2 m 0 (north) Crum 3 10.0 m 150 (southeast) 31.5 m 0 (north) 39.2 m 90 (east)
9
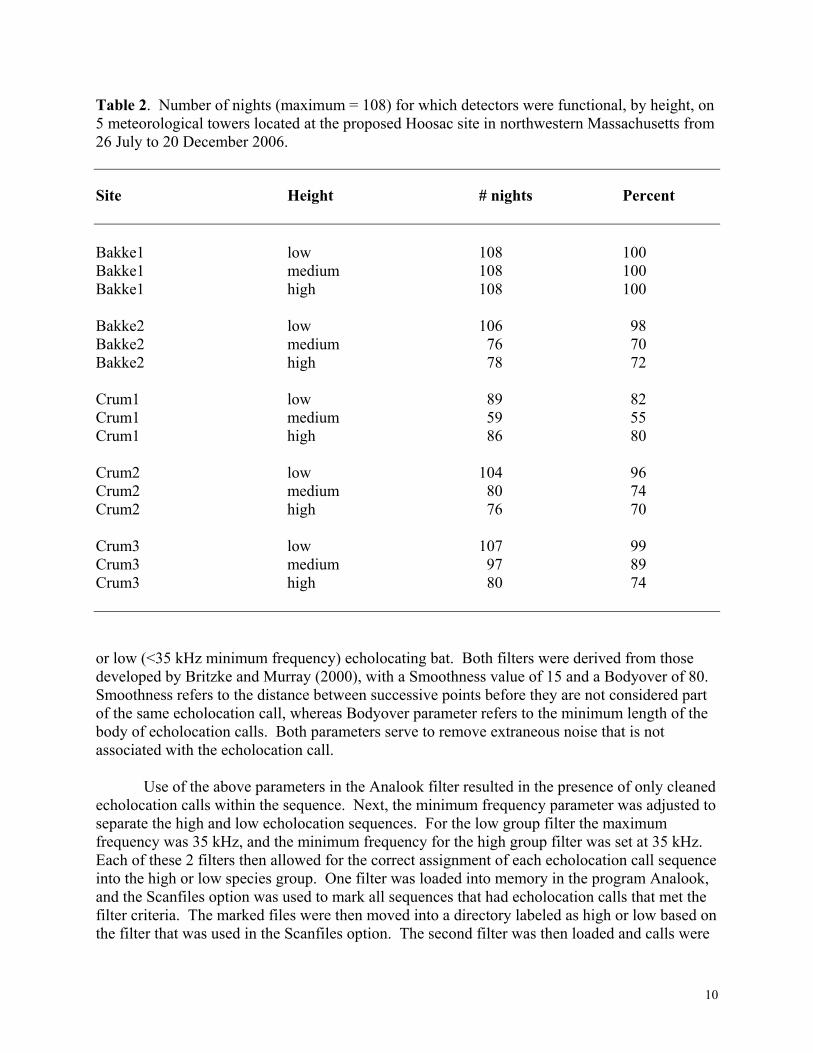
Table 2. Number of nights (maximum = 108) for which detectors were functional, by height, on 5 meteorological towers located at the proposed Hoosac site in northwestern Massachusetts from 26 July to 20 December 2006.
Site Height # nights Percent Bakke1 low 108 100 Bakke1 medium 108 100 Bakke1 high 108 100 Bakke2 low 106 98 Bakke2 medium 76 70 Bakke2 high 78 72 Crum1 low 89 82 Crum1 medium 59 55 Crum1 high 86 80 Crum2 low 104 96 Crum2 medium 80 74 Crum2 high 76 70 Crum3 low 107 99 Crum3 medium 97 89 Crum3 high 80 74 or low (<35 kHz minimum frequency) echolocating bat. Both filters were derived from those developed by Britzke and Murray (2000), with a Smoothness value of 15 and a Bodyover of 80. Smoothness refers to the distance between successive points before they are not considered part of the same echolocation call, whereas Bodyover parameter refers to the minimum length of the body of echolocation calls. Both parameters serve to remove extraneous noise that is not associated with the echolocation call.
Use of the above parameters in the Analook filter resulted in the presence of only cleaned echolocation calls within the sequence. Next, the minimum frequency parameter was adjusted to separate the high and low echolocation sequences. For the low group filter the maximum frequency was 35 kHz, and the minimum frequency for the high group filter was set at 35 kHz. Each of these 2 filters then allowed for the correct assignment of each echolocation call sequence into the high or low species group. One filter was loaded into memory in the program Analook, and the Scanfiles option was used to mark all sequences that had echolocation calls that met the filter criteria. The marked files were then moved into a directory labeled as high or low based on the filter that was used in the Scanfiles option. The second filter was then loaded and calls were
10

marked and moved into the appropriate directory. All files that could not be assigned through use of the filtering process were visually examined and moved to the appropriate directory.
Once completed, all Anabat files were moved into either a high or low directory. The associated program Dataget allowed for extraction of information saved with each echolocation file (e.g., date, location, and the filename) to be saved into a text file. Dataget was run on files in each directory and a text file was loaded into Excel, where a column was then added to designate the filenames as either high or low (depending on the text file loaded). The same process was repeated with the other text file and results were combined so that there was a single spreadsheet in Excel that contained 2 columns (filename and high/low designation). The original spreadsheet was then loaded into Excel and both spreadsheets were sorted by filename. This permitted the high/low classification to be added to the master spreadsheet for further analysis.
Data summary methods. Temperature (o C) and wind speed (m/s) were collected every 10 minutes at each tower. Wind speed was measured at ~40 m above ground level (AGL) in two directions on each tower and ambient temperature was measured at 3 m AGL at all towers except Crum3. Civil sunrise and sunset data were obtained from the U.S. Naval Observatory Astronomical Applications Department (http://aa.usno.navy.mil/data/docs/RS_OneYear.html) and used to define the crepuscular and nocturnal period (herein referred to as “night”) during which bats were expected to fly. In this study, a sampling night was defined as the period 1.5 hr before civil sunset to 1.5 hr after civil sunrise. We developed nightly mean wind speed and temperature from data collected at each met tower so as to correlate these data with bat calls. High and low frequency bat calls within each of the three heights at each tower on each night were summed to give a total number of calls in each of these 6 categories on each of the 108 nights of this study. Because no temperature data were recorded at Crum3 and because our models indicate that activity is very strongly related to temperature, data from Crum3 were not included in this analysis. Our final data set used to model the relationship of wind and temperature to bat activity had 2,592 observations (2 species groups * 3 heights * 4 towers * 108 nights).
Modeling patterns of activity. This study was designed to estimate activity rates (number of calls/tower) of bats and differences in those rates based on two factors: species group (those with high and low frequency calls) and height above the ground (~10, 31, and 39 m). We hypothesized that bats of one species group might be more active in the area or might have a tendency to fly higher than the other. Other studies (e.g., Arnett et al. 2006, Redell et al. 2006, Reynolds 2006) report that activity rates can change depending on temperature and wind speed, but how these latter two factors would affect activity patterns of the two groups at the Hoosac project site was unknown. To explore these relationships, we developed a set of 42 plausible models (see Appendix 1) describing the interaction of temperature or wind speed with each other and with each of the design factors (species group and height). All models included the design factors (site, species group, height and the interaction of group and height). Date and the quadratic effect of date also were included in all models to account for the seasonal nature of bat activity that peaked in mid-August. Although the data are counts (i.e., number of passes per night in each factor combination) and would naturally be modeled under the assumption of a Poisson distribution, the observed values generally had higher variation than expected of this distribution and were modeled as overdispersed Poisson using quasi-likelihood. The scale
11

parameter was fixed at 2.9 for all models. We used Akaike’s Information Criterion (AIC) to compare the models and to identify the best model or models in the set (Burnham and Anderson 2002). Model probabilities (Akaike weights [wi]; probability that the i-th model is actually the best approximating model among the candidate set, given the data) also were calculated. For the null model and all models in the 95% confidence set (∑wi >0.95), we present the AIC difference (AIC between each model and the best approximating model) and considered any model <2.0 AIC units from the best model to be strongly competing models warranting discussion relative to biological inferences (Burnham and Anderson 2002). All analyses were performed in SAS® (Version 9.0, SAS Institute 2006).
RESULTS
We recorded a total of 4,816 bat calls from all detectors at all met tower locations
combined from 26 July through 20 December 2006. Bat activity was highly variable throughout the study period, with four spikes of high activity in late July, early and mid-August, and in late September (Figure 5). Bat activity generally was highest within the first two hours after sunset and gradually declined through the night until just before sunrise the following morning (Figure 6).
Bats using high versus low frequencies tended to fly at different heights at the Hoosac
site and activity patterns were strongly related to height above the ground (Table 3). High frequency bats were detected most frequently at 10 m, whereas more calls of low frequency bats were recorded at 31 and 39 m (Figures 7). Activity rate of high frequency bats was estimated to be 1.5–4.0 times greater than that of low frequency bats at low altitudes (10 m) (Tables 4). This trend was reversed at medium altitudes where it was estimated that activity rate of low frequency bats was 5.8–22.9 times greater than that of high frequency bats, and high altitudes where it was estimated that activity rate of low frequency bats was 11.2–38.8 times greater than that of high frequency bats (Table 4).
Average nightly temperature ranged from 10.52 ºC (SE = 0.60) at the Crum 1 met tower
to 11.39 ºC (SE = 0.60) at Crum 2 (Table 5). Average nightly wind speed for all sampling nights combined ranged from 6.39 m/s (SE = 0.28) at the Bakke 2 tower to 8.49 m/s (SE = 0.28) at Bakke 1 (Table 5). Average wind speed at each tower ranged from 5–11 m/s; the proportion of nights sampled at each tower with mean wind speed <4 m/s ranged from 1.9–6.5%, while the proportion of nights sampled at each tower with mean wind speed <6 m/s ranged from 21.5–51.4% (Table 6). Median wind speed for all nights sampled was lowest at Crum 1 and Bakke 2 (Table 6).
Bat activity was related to both temperature (Figure 8) and wind speed (Figure 9). There
were three models less than 6 QAIC units from the best model and these models had a cumulative Akaike weight of 95%, and all included linear effects of temperature and wind speed and their interaction, the quadratic effect of wind speed, and the interaction of temperature and species group (Table 7). All but the best model included one or two additional factors related to wind speed or temperature. For the best model, significant design factors included date, frequency group, the interaction between height and frequency group, linear effects of
12

Figure 5. Average number of bat calls/night/tower from 26 July through 20 December 2006, at the Hoosac site in northwest Massachusetts.
13

Figure 6. Total number of bat calls for all towers and detectors gathered from 1900 to 0700 hr from 26 July through 20 December 2006, at the Hoosac site in northwest Massachusetts.
0
100
200
300
400
500
60019
00
1930
2000
2030
2100
2130
2200
2230
2300
2330
0000
0030
0100
0130
0200
0230
0300
0330
0400
0430
0500
0530
0600
0630
0700
Hour
Tota
l No.
Bat
Cal
ls
14

Table 3. Analysis of variance table for design factors in the best model of the set for relationships of bat activity in relation to date, height, frequency group, and weather variables at the Hoosac site in northwest Massachusetts, 26 July – 20 December 2006. Chi- Source DF Square Pr > ChiSq date 1 6.79 0.0092 date*date 1 2.03 0.1545 site 3 5.08 0.1663 height 2 4.17 0.1244 frequency group 1 8.49 0.0036 height*frequency group 2 13.87 0.0010 temperature 1 7.21 0.0072 wind speed 1 3.07 0.0800 wind speed * wind speed 1 2.35 0.1250 temperature* wind speed 1 2.39 0.1218 temperature*frequency 1 6.40 0.0114
15

Figure 7. Nightly average number of calls at different vertical heights for each meteorological tower for high (>35 kHz) and low (<35 kHz) frequency echolocating bats at the Hoosac site in northwest Massachusetts from 26 July through 20 December 2006. .
16

Table 4. Median relative increase (+, estimate and 95% CI > 1) or decrease (-, estimate and 95% CI < 1) in total bat activity for each condition described and lower and upper limits of the 95% confidence interval of this estimate. When 95% confidence limits on the estimate are >1, the inference is a positive effect, <1 indicates a negative effect, and those that include zero indicate no effect. 95 CI Condition Median lower upper Effect high vs low freq, ht=low 2.45 1.50 4.02 + low vs high freq, ht=med 11.49 5.75 22.90 + low vs high freq, ht=high 20.92 11.27 38.76 + +1 degree C for high freq. 1.34 1.14 1.57 + +1 degree C for low freq. 1.19 1.05 1.34 +
Table 5. Average nightly temperature (◦C) and wind speed (m/s) for each of 5 meteorological towers located at the Hoosac site in northwestern Massachusetts from 26 July to 20 December 2006. Standard Variable Site Estimate Error Lower Upper Temperature Bakke1 10.81 0.60 9.62 12.00
Bakke2 10.98 0.60 9.79 12.16 Crum1 10.52 0.60 9.34 11.70 Crum2 11.39 0.60 10.21 12.57
Wind Speed Bakke1 8.49 0.28 7.95 9.04
Bakke2 6.39 0.28 5.84 6.93 Crum1 7.08 0.28 6.53 7.62 Crum2 7.83 0.28 7.28 8.37 Crum3 8.10 0.28 7.55 8.64
17

18
Table 6. Proportion of nights when mean wind speed was <4 m/s and <6 m/s and median wind speed for all nights sampled at each of 5 meteorological towers located at the Hoosac site in northwestern Massachusetts from 26 July to 20 December 2006. Site
Percent of nights with x wind speed <4 m/s
Percent of nights with x wind speed <6 m/s
Median wind speed (m/s)
Bakke1 3.8 21.5 7.8 Bakke2 6.5 51.4 5.8 Crum1 6.5 43.9 6.5 Crum2 1.9 25.2 7.3 Crum3 2.8 21.5 7.7 temperature and wind speed, and the interaction of temperature and frequency group (Table 7).
Bat activity was related to temperature, but the effect differed for high and low frequency groups; high frequency bats responded more to temperature than did low frequency bats. For every 1oC increase in temperature, bat activity increased 14–57% for high frequency bats and 5–34% for low frequency bats (Table 4). Bat activity also was related to wind speed; activity increased slightly with increasing wind speed, but then decreased as wind speed increased. Wind speed at which maximum activity was predicted changed with temperature. The relationship of low and high frequency bat activity relative to wind speed at each of the three heights and for three representative temperatures (0º C, 12º C, and 20º C) is presented in Figures 10a-f; activity levels presented are on a loge scale during the middle of the monitoring period (18 September 2006). In general, the predicted number of passes on any night was quite low, except for high frequency bats when temperatures were warm (>20 ºC) and wind speeds were moderate (about 8 m/s) (Figures 10a-f).

19
Table 7. Difference in Akaike Information Criteria score between the ith and top-raked model (∆i), Akaike weights (w i), and the sum of the Akaike weights (∑ w i) of all models comprising >95% of the model weights, and the null model, used to explain relationships of bat activity in relation to weather variables at the Hoosac site in northwest Massachusetts, 26 July – 20 December 2006. ____________________________________________________________________________________________________________ Model Rank Model # Model Structure K ∆QAIC wi ∑ wi 1 405 temp ws ws*ws temp*ws temp*group 16 0.00 0.64 0.64 2 407 temp ws ws*ws temp*ws temp*group ws*group 17 2.02 0.23 0.87 3 408 temp ws ws*ws temp*ws temp*group ws*group temp*ws*group 18 4.04 0.08 0.95 42 100 Null 11 198.80 0.00 1.00 ____________________________________________________________________________________________________________
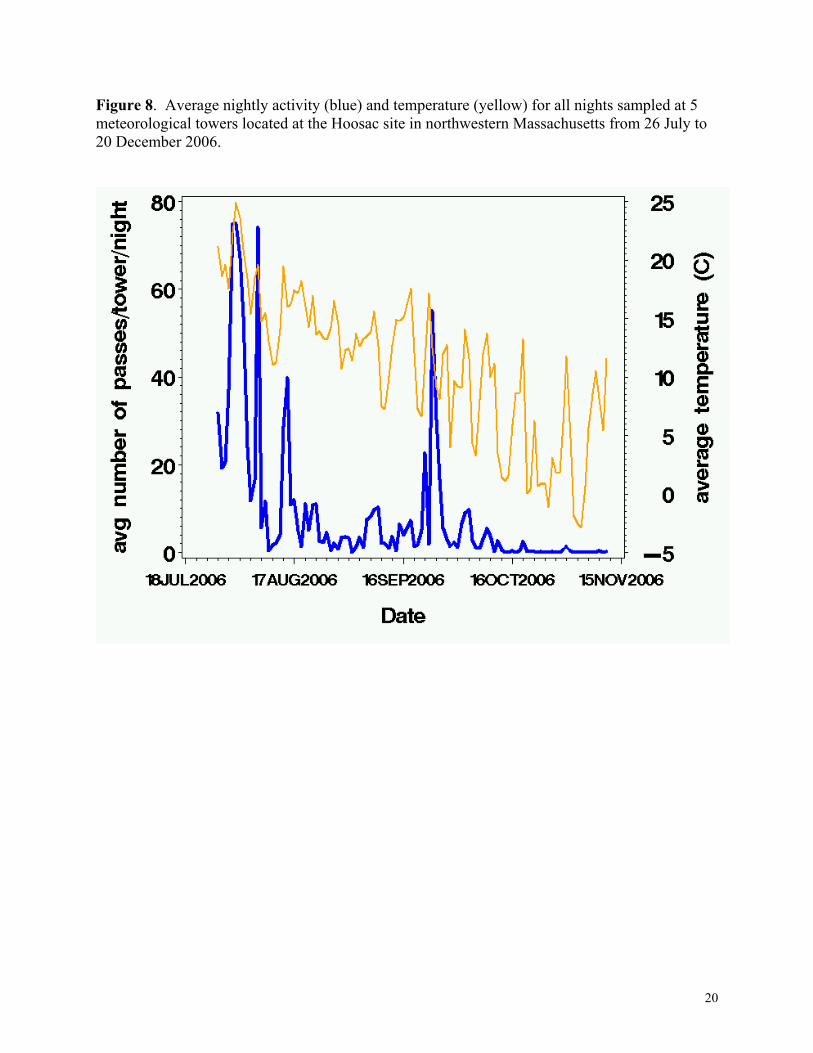
Figure 8. Average nightly activity (blue) and temperature (yellow) for all nights sampled at 5 meteorological towers located at the Hoosac site in northwestern Massachusetts from 26 July to 20 December 2006.
20

Figure 9. Average nightly activity (blue) and wind speed (yellow) for all nights sampled at 5 meteorological towers located at the Hoosac site in northwestern Massachusetts from 26 July to 20 December 2006.
21

Figure 10a-f. Predicted number of calls per night at three heights (Solid Green ~10 m, Dashed green ~31 m, Dotted Blue ~ 39 m) as a function of wind speed (m/s). Figures on the left represent high frequency bats and on the right, low frequency bats. The rows of figures represent 0 ºC, 12 ºC and 20 ºC. Fig 10a. High frequency bats, temp=0 ºC Fig 10b. Low frequency bats, temp=0 ºC
Fig 10c. High frequency bats, temp=12 ºC Fig 10d. Low frequency bats, temp=12 ºC
Fig 10e. High frequency bats, temp=20 ºC Fig 10f. Low frequency bats, temp=20 ºC
22
DISCUSSION
We found that bat activity generally was highest in late July and mid-August and declined through November. This temporal pattern of activity was similar to those gathered from other pre-construction studies. In Pennsylvania, Arnett et al. (2006) reported that bat activity was highest from mid-August through mid-September with brief peaks of high activity in October. Redell et al. (2006) recorded highest levels of bat activity in southeastern Wisconsin during August with secondary peaks in late July and September. Temporal patterns of activity we observed also are similar to those reported from post-construction studies that used acoustic detectors. In Iowa, Jain (2005) found that bat activity peaked in July (99.5 calls/detector-night) and August 2004 (56.44 calls/detector-night), declined in September (10.5 calls/detector-night), and had mostly ceased by October, when detection was curtailed. Fiedler (2004) reported that activity exhibited a seasonal peak between early August and mid-September during all three years of her study in Tennessee. Johnson et al. (2004) and Gruver (2002) reported similar patterns in Minnesota and Wyoming, respectively. Association between timing of high activity and overall incidence of bat fatality previously reported (see Fiedler 2004, Johnson et al. 2004, and Jain 2005 for examples) suggest that temporal patterns of activity may prove useful for predicting the timing of fatality events in the future, but more studies across a wide range of landscape and environmental conditions are warranted.
Accounting for spatial variation is important when collecting acoustic data at proposed wind sites or at wind turbines themselves because different species of bats partition their use of habitats vertically, particularly in forests (Hayes and Gruver 2000, Jung et al. 1999, Kalcounis et al. 1999). Consequently, the assumption that activity data gathered below the rotor-swept area represents risk of bats in the rotor-swept area may be unjustified for some bat species and certain landscape and habitat conditions. Indeed, our study found that activity patterns of the two species groups were strongly related to height above ground; high frequency bats generally flew at low to moderate heights whereas low frequency bats flew at higher levels above the ground. This finding corroborates previous pre-construction acoustic studies in other regions (Arnett et al. 2006, Redell et al. 2006, Reynolds 2006) and is supported by studies documenting partitioning of foraging habitat among sympatric species of bats (e.g., Hayes and Gruver 2000, Lacki et al. 2007). Reynolds (2006) noted that large, migratory events of different species of bats may be missed without sampling into the rotor-swept area. A large proportion of bats that are found killed at wind facilities, such as the hoary bat (Johnson 2005, Kunz et al. 2007, Arnett et al. 2008), are characterized as low frequency echolocating species that could potentially be missed by surveying with acoustic detectors at ground-level. However, it remains to be determined if vertical acoustic sampling into the rotor-swept area increases predictability of fatality events for different species and groups of species of bats.
Erickson and West (2002) reported that regional patterns of climatic conditions as well as
local weather events can predict activity of bats. We found that temperature strongly affected bat activity at the Hoosac site. Arnett et al. (2006) and Redell et al. (2006) reported that bat activity was positively related to temperature in Pennsylvania and Wisconsin, respectively. Reynolds (2006) found little activity of bats at a proposed wind facility in New York when temperatures were below 10.5 o C. The relationship between bat activity and temperature could be explained by availability of insect prey. Insect flight occurrence decreases with temperature and little or no
23

flight activity may occur below 10 oC (Taylor 1963). Insect migrations are known to be positively related to temperature (e.g., Sparks et al. 2005). We found that the effect of temperature differed between the two species groups at the Hoosac site; high frequency bats that were more active at low altitudes were more responsive to temperature than low frequency bats. This may be related to differences in body size and thermal energetic relationships. Body temperature and body size have profound impacts on how animals function, and even small changes in body temperature can have significant effects on mammals (Speakman and Thomas 2003). Larger animals are better equipped physiologically to deal with lower ambient temperatures than are smaller ones because they have a relatively smaller surface area through which heat is lost (Speakman and Thomas 2003), thus it is plausible that smaller bodied, high frequency echolocating bats are more sensitive to lower ambient temperature and consequently more active during warmer nights relative to larger, low frequency echolocating bats. Another possibility is that low frequency bats are more likely to be migrating through the area (Cryan 2003, Cryan and Brown 2007) and these bats may be less responsive to temperature than local, foraging species of high frequency bats because they are occupying the site for different reasons.
Bat activity during our study increased slightly with increasing wind speed, but then decreased and this relationship was more pronounced during warmer nights. The Hoosac site has higher average nightly wind speeds than other sites where comparable data have been gathered, which may explain why the relationship between activity and wind was not as strong as that previously documented (Arnett et al. 2006, Redell et al. 2006, Reynolds 2006). Strong winds influence insect abundance and activity, which in turn influences bat activity and bats are known to suppress their activity during periods of rain, low temperatures, and strong winds (Erkert 1982, Erickson and West 2002, Lacki et al. 2007). Wind speed and direction were found to affect habitat use by hoary bats and silver-haired bats in Canada, with higher activity detected on the lee side of a ridge (Barclay 1985). In the Netherlands, Verboom and Spoelstra (1999) reported that foraging and commuting activity of pipistrelle bats was concentrated closer to the leeward sides of trees as wind speed increased. Patterns of bat activity and wind speed also generally corroborate recent studies of bat fatality and the relationships with wind. At Buffalo Mountain in Tennessee, Fiedler (2004) found a negative relationship between bat fatality and wind speed, wind speed difference, and temperature, and a positive relationship with wind direction. The positive relationship with wind direction indicated that the further wind direction was from southwest (the prevailing wind direction) the more likely a fatality event was to occur, perhaps due to more northerly winds associated with storm fronts and/or conditions that are conducive for bat migration (Fiedler 2004). Kerns et al. (2005) reported that the majority of bats killed at the Meyersdale, Pennsylvania and Mountaineer, West Virginia facilities occurred on low wind nights, and fatalities tended to increase just before and after the passage of storm fronts. These emerging patterns of activity hold promise for improving our ability to assess risk and better predict factors influencing the timing of fatality events. SCOPE, LIMITATIONS, and NEXT STEPS This study was conducted at a single proposed wind energy facility located on forested ridges in northwestern Massachusetts, and statistical inferences are limited to this site. However, we believe that our findings likely reflect patterns of bat activity on similar forested ridges with
24

comparable vegetation composition and topography in this region. Due to logistical constraints we were unable to gather activity data for a full season when bats are known to be active in this region (generally April through November), but our sampling did encompass the fall migration period when bats appear to be most frequently killed at wind facilities. Our analyses are exploratory, in part because so little data exist upon which to develop a priori, confirmatory hypotheses and associated candidate models. We performed our analysis using weather data gathered only from met towers located on the site; future modeling may incorporate additional weather data gathered from local weather stations to more precisely model weather events and bat activity. The current analysis only estimates activity rates and differences in activity patterns of two species groups (high and low frequency), in forested habitat, and at three heights. We anticipate development of more species-specific models in the future. High variation in levels of activity has consequences with respect to sampling design and level of effort required to obtain accurate estimates of activity; as fewer nights are sampled, there is an increased probability of obtaining mean estimates of activity that differ greatly from those calculated from large datasets (Hayes 1997). Low-intensity sampling could result in under- or over-estimates of activity and the most precise and accurate estimates will likely come from intensive sampling efforts (Hayes 1997, M. Huso, Oregon State University, unpublished data). In our future analyses, we will evaluate the trade-offs among various sampling efforts regarding accuracy and precision of estimates of bat activity, with the ultimate goal of optimizing sampling designs and data requirements for employing acoustic monitoring to predict bat fatality at wind facilities. We began a second year of pre- construction acoustic monitoring in June 2007 and will continue through November 2007. A third year of pre-construction acoustic data may be collected if the project is not constructed in 2008. After turbines are constructed at the Hoosac site, we will gather two consecutive years of post-construction activity and fatality data from April through November each year.
25

LITERATURE CITED Arnett, E. B., technical editor. 2005. Relationships between bats and wind turbines in
Pennsylvania and West Virginia: an assessment of bat fatality search protocols, patterns of fatality, and behavioral interactions with wind turbines. A final report submitted to the Bats and Wind Energy Cooperative. Bat Conservation International. Austin, Texas, USA <http://www.batcon.org/wind/BWEC2004finalreport.pdf> Accessed 1 August 2007.
Arnett, E. B., J. P. Hayes, and M. M. P. Huso. 2006. Patterns of pre-construction bat
activity at a proposed wind facility in south-central Pennsylvania. An annual report submitted to the Bats and Wind Energy Cooperative. Bat Conservation International. Austin, Texas, USA. <http://www.batcon.org/wind/BWEC%202005%20 Annual%20Report.pdf> Accessed 1 August 2007.
Arnett, E. B., K. Brown, W. P. Erickson, J. Fiedler, T. H. Henry, G. D. Johnson, J. Kerns, R. R.
Kolford, C. P. Nicholson, T. O’Connell, M. Piorkowski, and R. Tankersley, Jr. 2008. Patterns of fatality of bats at wind energy facilities in North America. Journal of Wildlife Management 72: in press.
Barclay, R. M. R. 1985. Long-versus short-range foraging strategies of hoary (Lasiurus
cinereus) and silver-haired (Lasionycteris noctivagans) bats and the consequences for prey selection. Canadian Journal of Zoology 63: 2507–2515.
Barclay, R. M. R. 1999. Bats are not birds: a cautionary note on using echolocation calls to
identify bats: a comment. Journal of Mammalogy 80: 290–296. Britzke, E. R., and K. L. Murray. 2000. A quantitative method for selection of identifiable
search-phase calls using the Anabat system. Bat Research News 41: 33–36. Brown, W. K., and B. L. Hamilton. 2006. Monitoring of bird and bat collisions with wind
turbines at the Summerview Wind Power Project, Alberta, 2005–2006. Report for Vision Quest Windelectric, Inc., Calgary, Alberta, Canada.
Burnham, K. P., and D. R. Anderson. 2002. Model selection and multimodel inference: a practical information-theoretic approach, second edition. Springer-Verlag, New York, New York, USA.
Cryan, P. M. 2003. Seasonal distribution of migratory tree bats (Lasiurus and Lasionycteris) in North America. Journal of Mammalogy 84: 579–593.
Cryan, P. M., and A. C. Brown. 2007. Migration of bats past a remote island offers clues
toward the problem of bat fatalities at wind turbines. Biological Conservation 5: . Dürr, T., and L. Bach. 2004. Bat deaths and wind turbines – a review of current knowledge, and of the information available in the database for Germany. Bremer Beiträge für Naturkunde und Naturschutz 7: 253–264.
26

Eckert, H. G. 1982. Ecological aspects of bat activity rhythms. Pages 201–242 in T. H. Kunz,
editor. Ecology of bats. Plenum Press, New York, New York, USA. Energy Information Administration (EIA). 2007. Annual energy outlook 2007 with projections
to 2030. U.S. Department of Energy, Energy Information Administration, Washington, D.C., USA. <http://www.eia.doe.gov/oiaf/aeo/pdf/0383(2007).pdf> Accessed 1 May 2007.
Erickson, J. L., and S. D. West. 2002. The influence of regional climate and nightly weather conditions on activity patterns of insectivorous bats. Acta Chiropterologica 4: 17–24.
Fiedler, J. K. 2004. Assessment of bat mortality and activity at Buffalo Mountain
Windfarm, eastern Tennessee. Thesis, University of Tennessee, Knoxville, Tennessee, USA.
Fiedler, J. K., T. H. Henry, C. P. Nicholson, and R. D. Tankersley. 2007. Results of bat and bird
mortality monitoring at the expanded Buffalo Mountain windfarm, 2005. Tennessee Valley Authority, Knoxville, Tennessee, USA.
Gannon, W. L., R. E. Sherwin, and S. Haymond. 2003. On the importance of articulating
assumptions when conducting acoustic studies of bats. Wildlife Society Bulletin 31: 45–61.
Gruver, J. C. 2002. Assessment of bat community structure and roosting habitat preferences for
the hoary bat (Lasiurus cinereus) near Foote Creek Rim, Wyoming. Thesis, University of Wyoming, Laramie, Wyoming, USA.
Hall, L. S., and G. C. Richards. 1972. Notes on Tadarida australis (Chiroptera:molossidae).
Australian Mammalogy 1: 46. Hayes, J. P. 1997. Temporal variation in activity of bats and the design of echolocation-
monitoring studies. Journal of Mammalogy 78: 514–524. Hayes, J. P. 2000. Assumptions and practical considerations in the design and interpretation of
echolocation-monitoring studies. Acta Chiropterologica 2: 225–236. Hayes, J. P., and J. C. Gruver. 2000. Vertical stratification of bat activity in an old-growth forest
in western Washington. Northwest Science 74: 102–108. Hurlbert, S. H. 1984. Pseudoreplication and the design of ecological field experiments.
Ecological Monographs 54: 187–211.
Jain, A. A. 2005. Bird and bat behavior and mortality at a northern Iowa windfarm. Thesis. Iowa State University, Ames, Iowa, USA.
27

Jain, A., P. Kerlinger, R. Curry, and L. Slobodnik. 2007. Annual report for the Maple Ridge wind power project post-construction bird and bat fatality study – 2006. Annual report prepared for PPM Energy and Horizon Energy, Curry and Kerlinger LLC, Cape May Point, New Jersey, USA.
Johnson, G. D. 2005. A review of bat mortality at wind-energy developments in the United States. Bat Research News 46: 45–49.
Johnson, G. D., M. K. Perlik, W. E. Erickson, and M. D. Strickland. 2004. Bat activity, composition, and collision mortality at a large wind plant in Minnesota. Wildlife Society Bulletin 32: 1278–1288.
Jung, T. S., I. D. Thompson, R. D. Titman, and A. P. Applejohn. 1999. Habitat selection by
forest bats in relation to mixed-wood stand types and structure in central Ontario. Journal of Wildlife Management 63: 1306–1319.
Kalcounis, M.C., K.A. Hobson, R.M. Brigham, and K.R. Hecker. 1999. Bat activity in the boreal
forest: importance of stand type and vertical strata. Journal of Mammalogy 80: 673–682. Kerns, J. and P. Kerlinger. 2004. A study of bird and bat collision fatalities at the MWEC Wind
Energy Center, Tucker County, West Virginia: annual report for 2003. Technical report prepared by Curry and Kerlinger, LLC. for FPL Energy and MWEC Wind Energy Center Technical Review Committee. Curry and Kerlinger LLC, Cape May Point, New Jersey, USA.
Kerns, J, W. P. Erickson, and E. B. Arnett. 2005. Bat and bird fatality at wind energy facilities
in Pennsylvania and West Virginia. Pages 24–95 in E. B. Arnett, editor. Relationships between bats and wind turbines in Pennsylvania and West Virginia: an assessment of bat fatality search protocols, patterns of fatality, and behavioral interactions with wind turbines. A final report submitted to the Bats and Wind Energy Cooperative. Bat Conservation International, Austin, Texas, USA.
Kunz, T. H., E. B. Arnett, W. P. Erickson, A. R. Hoar, G. D. Johnson, R. P. Larkin, M. Dale.
Strickland, R. W. Thresher, and M. D. Tuttle. 2007a. Ecological impacts of wind energy development on bats: questions, hypotheses, and research needs. Frontiers in Ecology and the Environment 5: 315–324.
Kunz, T. H., E. B. Arnett, B. M. Cooper, W. P. Erickson, R. P. Larkin, T. Mabee, M. L.
Morrison, M. Dale. Strickland, J. M. Szewczak. 2007b. Methods and metrics for assessing impacts of wind energy development on nocturnally active birds and bats. Journal of Wildlife Management 71: in press.
Lacki, M. J., S. K. Amelon, and M. D. Baker. 2006. Foraging ecology of bats in forests.
Pages 83–127 in M. J. Lacki, A. Kurta, and J. P. Hayes, editors. Conservation and management of bats in forests. Johns Hopkins University Press. Baltimore, Maryland, USA.
28

Larkin, R. P. 2006. Migrating bats interacting with wind turbines: what birds can tell us. Bat
Research News 47: 23–32.
Larson, D. J., and J. P. Hayes. 2000. Variability in sensitivity of Anabat II bat detectors and a method of calibration. Acta Chiropterologica 2: 209–213.
National Research Council. 2007. Ecological impacts of wind-energy projects. National
Academies Press, Washington, D.C., USA. O’Farrell, M. J., and W. L. Gannon. 1999. A comparison of acoustic versus capture technique
for the inventory of bats. Journal of Mammalogy 80: 24–30. O’Shea, T. J., M. A. Bogan, and L. E. Ellison. 2003. Monitoring trends in bat populations of the
United States and territories: status of the science and recommendations for the future. Wildlife Society Bulletin 31: 16–29.
Pasqualetti M., R. Richter, and P. Gipe. 2004. History of wind energy. Pages 419–433 in C. J.
Cleveland, editor. Encyclopedia of energy. Volume 6. Academic Press, San Diego, California, USA.
Pierson, E. D. 1998. Tall trees, deep holes, and scarred landscapes: conservation biology of
North American bats. Pages 309–325 in T. H. Kunz and P. A. Racey, editors. Bat biology and conservation. Smithsonian Institution Press, Washington, D.C., USA.
Racey, P. A., and A. C. Entwistle. 2003. Conservation ecology of bats. Pages 680–743 in T. H.
Kunz and M. B. Fenton, editors. Bat Ecology. University of Chicago Press, Chicago, Illinois, USA.
Redell, D., E. B. Arnett, J. P. Hayes, and M. Huso. 2006. Patterns of pre-construction bat
activity at a proposed wind facility in south-central Wisconsin. A final report submitted to the Bats and Wind Energy Cooperative. Bat Conservation International. Austin, Texas, USA.
Reynolds, D. S. 2006. Monitoring the potential impact of a wind development site on bats in
the northeast. Journal of Wildlife Management 70: 1219–1227. SAS Institute Inc. 2006. SAS/STAT User’s Guide, Version 9.0. SAS Institute, Cary, North Carolina, USA. Sherwin, R. E., W. L. Gannon, and S. Haymond. 2000. The efficacy of acoustic techniques to
infer differential use of habitat by bats. Acta Chiropterlogica 2: 145–153. Sparks, T. H., D. B. Roy, and L. H. Dennis. 2005. The influence of temperature on migration of
Lepidoptera into Britain. Global Change Biology 11: 507–514.
29

Speakman, J. R., and D. W. Thomas. 2003. Physiological ecology and energetics of bats. Pages 430–490 in T. H. Kunz and M. B. Fenton, editors. Bat ecology. University of Chicago Press, Chicago, Illinois, USA.
Taylor, L. R. 1963. Analysis of the effect of temperature on insects in flight. Journal of Animal
Ecology 32: 99–117. Thomas, D. W. 1988. The distribution of bats in different ages of Douglas-fir forests.
Journal of Wildlife Management 52: 619–626. Verboom, B., and K. Spoelstra. 1999. Effects of food abundance and wind on the use of
tree lines by an insectivorous bat, Pipistrellus pipistrellus. Canadian Journal of Zoology 77: 1393–1401.
Weller, T. J., and C. J. Zabel. 2002. Variation in bat detections due to detector orientation in a
forest. Wildlife Society Bulletin 30: 922–930. Winhold, L., and A. Kurta. 2006. Are red bats (Lasiurus borealis) declining in southern Michigan? Bat Research News 46: 229
30

31
Appendix I. Description of 42 models compared in this study. All models included the design factors: site, date, quadratic effect of date, species group, height and the interaction of group and height. The autoregressive correlation coefficient was estimated to be 0.254 and the overdispersion parameter was held fixed at 2.899 in all models. Model 100 was the null model comprised of only the design factors. Models 101 through 104 model temperature and wind speed as having the same effect regardless of species group or height. Models 201 through 209 allow the effects of temperature and/or wind speed to vary by species group. Models 301 through 309 parallel models 201 through 209, but allow the effects of temperature and/or wind speed to vary by height rather than species group. In addition to these models, Models 401 through 409 and 501 through 509 also parallel models 101 through 309, but include quadratic effects of wind speed in all models that already include wind speed.
Model # Description Variables
100 Null model, no effect of temp or wind speed
101 linear effect of temperature temp
102 linear effect of wind speed ws
103 linear effect of temperature and wind speed temp ws
104 linear effect of temperature and wind speed and interaction of the two
temp ws temp*ws
201 linear effect of temperature differs between the two species groups
temp temp*group
202 linear effect of temperature and wind speed, but the linear effect of temperature differs between the two species groups
temp ws temp*group
203 linear effect of temperature and wind speed, but the linear effect of wind speed differs between the two species groups
temp ws ws*group
204 linear effect of temperature and wind speed, but the linear effect of each differs between the two species groups
temp ws temp*group ws*group
205 linear effect of temperature and wind speed, with interaction of the two, but the linear effect of temperature differs between the two species groups
temp ws temp*ws temp*group

32
Appendix I. Continued.
206 linear effect of temperature and wind speed, with interaction of the two, but the linear effect of wind speed differs between the two species groups
temp ws temp*ws ws*group
207 linear effect of temperature and wind speed, with interaction of the two, but the linear effect of both temperature and wind speed differs between the two species groups
temp ws temp*ws temp*group ws*group
208 linear effect of temperature and wind speed, with interaction of the two, all of which differ between the two species groups
temp ws temp*ws temp*group ws*group temp*ws*group
209 linear effect of wind speed differs between the two species groups
ws ws*group
301 linear effect of temperature differs between the two species heights
temp temp*height
302 linear effect of temperature and wind speed, but the linear effect of temperature differs between the two species heights
temp ws temp*height
303 linear effect of temperature and wind speed, but the linear effect of wind speed differs between the two species heights
temp ws ws*height
304 linear effect of temperature and wind speed, but the linear effect of each differs between the two species heights
temp ws temp*height ws*height
305 linear effect of temperature and wind speed, with interaction of the two, but the linear effect of temperature differs between the two species heights
temp ws temp*ws temp*height
306 linear effect of temperature and wind speed, with interaction of the two, but the linear effect of wind speed differs between the two species heights
temp ws temp*ws ws*height
307 linear effect of temperature and wind speed, with interaction of the two, but the linear effect of both temperature and wind speed differs between the two species heights
temp ws temp*ws temp*height ws*height

33
Appendix I. Continued.
308 linear effect of temperature and wind speed, with interaction of the two, all of which differ between the two species heights
temp ws temp*ws temp*height ws*height temp*ws*height
309 linear effect of wind speed differs between the two species heights
ws ws*height

Appendix II Results of model selection for 42 models used in this study. Model # = number assigned by us to track individual models, Model = list of variables besides design variables included in the model, k = number of estimated parameters, LL = log likelihood of the model, QAIC = AIC based on quasi likelihood, ) = difference in QAIC of the model relative to the best model in the set, weight = Akaike weight associated with the model, cumwt = cumulative weight from the current model and all better models, relwt = weight of evidence in favor of the best model relative to the current model. Model# Model k LL QAICc delta weight cumwt relwt 405 temp ws ws*ws temp*ws temp*group 16 539.65 -1047.04 0.00 0.63853 0.63853 1.00 407 temp ws ws*ws temp*ws temp*group ws*group 17 539.65 -1045.02 2.02 0.23270 0.87123 2.74 408 temp ws ws*ws temp*ws temp*group ws*group temp*ws*group 18 539.66 -1043.00 4.04 0.08492 0.95615 7.52 402 temp ws ws*ws temp*group 15 535.00 -1039.78 7.25 0.01701 0.97316 37.55 505 temp ws ws*ws temp*ws temp*ht 17 536.85 -1039.40 7.63 0.01405 0.98721 45.43 404 temp ws ws*ws temp*group ws*group 16 535.35 -1038.44 8.59 0.00869 0.99590 73.45 507 temp ws ws*ws temp*ws temp*ht ws*ht 19 537.05 -1035.74 11.29 0.00225 0.99815 283.83 502 temp ws ws*ws temp*ht 16 532.37 -1032.49 14.54 0.00044 0.99860 1000.00 205 temp ws temp*ws temp*group 15 531.20 -1032.17 14.86 0.00038 0.99898 1000.00 508 temp ws ws*ws temp*ws temp*ht ws*ht temp*ws*ht 21 537.17 -1031.91 15.12 0.00033 0.99931 1000.00 202 temp ws temp*group 14 529.94 -1031.68 15.36 0.00030 0.99960 1000.00 207 temp ws temp*ws temp*group ws*group 16 531.20 -1030.14 16.89 0.00014 0.99974 1000.00 204 temp ws temp*group ws*group 15 530.02 -1029.82 17.21 0.00012 0.99986 1000.00 504 temp ws ws*ws temp*ht ws*ht 18 532.41 -1028.50 18.53 0.00006 0.99992 1000.00 208 temp ws temp*ws temp*group ws*group temp*ws*group 17 531.39 -1028.49 18.55 0.00006 0.99998 1000.00 305 temp ws temp*ws temp*ht 16 528.31 -1024.37 22.66 0.00001 0.99998 1000.00 302 temp ws temp*ht 15 527.20 -1024.18 22.86 0.00001 0.99999 1000.00 201 temp temp*group 13 524.98 -1023.79 23.25 0.00001 1.00000 1000.00 307 temp ws temp*ws temp*ht ws*ht 18 528.59 -1020.86 26.17 0.00000 1.00000 1000.00 304 temp ws temp*ht ws*ht 17 527.28 -1020.28 26.76 0.00000 1.00000 1000.00 308 temp ws temp*ws temp*ht ws*ht temp*ws*ht 20 528.85 -1017.31 29.72 0.00000 1.00000 1000.00 301 temp temp*ht 14 522.08 -1015.97 31.06 0.00000 1.00000 1000.00 403 temp ws ws*ws temp*ws 15 522.80 -1015.38 31.66 0.00000 1.00000 1000.00 406 temp ws ws*ws temp*ws ws*group 16 523.04 -1013.83 33.20 0.00000 1.00000 1000.00 506 temp ws ws*ws temp*ws ws*ht 17 523.61 -1012.94 34.10 0.00000 1.00000 1000.00 402 temp ws ws*ws 14 518.52 -1008.85 38.19 0.00000 1.00000 1000.00 403 temp ws ws*ws ws*group 15 518.80 -1007.38 39.65 0.00000 1.00000 1000.00
34

Appendix II. Continued. Model# Model k LL QAICc delta weight cumwt relwt 503 temp ws ws*ws ws*ht 16 519.45 -1006.64 40.39 0.00000 1.00000 1000.00 104 temp ws temp*ws 14 515.09 -1001.98 45.06 0.00000 1.00000 1000.00 103 temp ws 13 513.83 -1001.49 45.55 0.00000 1.00000 1000.00 206 temp ws temp*ws ws*group 15 515.31 -1000.39 46.64 0.00000 1.00000 1000.00 203 temp ws ws*group 14 514.08 -999.96 47.08 0.00000 1.00000 1000.00 306 temp ws temp*ws ws*ht 16 515.81 -999.36 47.67 0.00000 1.00000 1000.00 303 temp ws ws*ht 15 514.63 -999.04 47.80 0.00000 1.00000 1000.00 101 temp 12 507.85 -991.55 55.49 0.00000 1.00000 1000.00 401 ws ws*ws 13 468.01 -909.85 137.18 0.00000 1.00000 1000.00 409 ws ws*ws ws*group 14 468.29 -908.37 138.66 0.00000 1.00000 1000.00 509 ws ws*ws ws*ht 15 468.89 -907.55 139.48 0.00000 1.00000 1000.00 102 ws 12 453.19 -882.24 164.80 0.00000 1.00000 1000.00 209 ws ws*group 13 453.40 -880.64 166.40 0.00000 1.00000 1000.00 309 ws ws*ht 14 453.85 -879.49 167.54 0.00000 1.00000 1000.00 100 Null 11 435.18 -848.24 198.80 0.00000 1.00000 1000.00
35