Embed Size (px)
Citation preview

Tucholke, B.E., Sibuet, J.-C., and Klaus, A. (Eds.)Proceedings of the Ocean Drilling Program, Scientific Results Volume 210
3. PALEOFLOW DIRECTIONS OF ALBIAN
BASIN-FLOOR TURBIDITY CURRENTS IN THE NEWFOUNDLAND BASIN1
Richard N. Hiscott2
ABSTRACT
Albian turbidites and intercalated shales were cored from ~1145 to1700 meters below seafloor at Site 1276 in the Newfoundland Basin.Strata at this level dip ~2.5° seaward (toward an azimuth of ~130°)based on seismic profiles. In contrast, beds dip an average of ~10° in thecores. This higher apparent dip is the sum of the ~2.5° seaward dip anda measured hole deviation of 7.43°, which must be essentially in thesame seaward direction. Using the maximum dip direction in the coresas a reference direction, paleocurrents were measured from 11 current-ripple foresets and 11 vector means of grain fabric in planar-laminatedsandstones. Five of the planar-laminated sandstone samples have agrain imbrication ≥8°, permitting specification of a unique flow direc-tion rather than just the line-of-motion of the current. Both ripples andgrain fabric point to unconfined flow toward the north-northeast.There is considerable spread in the data so that some paleoflow indica-tors point toward the northwest, whereas others point southeast. Nev-ertheless, the overall pattern of paleoflow suggests a source for theturbidity currents on the southeastern Grand Banks, likely from thelong-emergent Avalon Uplift in that area. On average, turbidity cur-rents apparently flowed axially in the young Albian rift, toward thenorth. This is opposite to what might be expected for a northward-propagating rift and a young ocean opening in a zipperlike fashionfrom south to north.
1Hiscott, R.N., 2007. Paleoflow directions of Albian basin-floor turbidity currents in the Newfoundland Basin. In Tucholke, B.E., Sibuet, J.-C., and Klaus, A. (Eds.), Proc. ODP, Sci. Results, 210: College Station, TX (Ocean Drilling Program), 1–27. doi:10.2973/odp.proc.sr.210.103.20072Earth Sciences Department, Memorial University of Newfoundland, St. John’s NF, A1B 3X5, Canada. [email protected]
Initial receipt: 5 January 2006Acceptance: 14 July 2006Web publication: 14 May 2007Ms 210SR-103

R.N. HISCOTTPALEOFLOW DIRECTIONS OF ALBIAN BASIN-FLOOR TURBIDITY CURRENTS 2
INTRODUCTION
The source of deep-sea turbidites can be inferred from major-component petrography (e.g., Dickinson et al., 1983; Zuffa, 1985;Marsaglia, this volume), heavy minerals (Hubert, 1971), trace elementor rare earth element geochemistry (e.g., McLennan et al., 1990), and/or paleocurrent analysis (Potter and Pettijohn, 1963). The latter tech-nique might not point unambiguously to the source region if flowstook a circuitous path to the site of deposition (e.g., Zuffa et al., 2000).This paper employs paleocurrent analysis using flow directions deter-mined from ripple foresets and grain-fabric studies of Albian sandstoneturbidites recovered in Hole 1276A east of the Grand Banks of New-foundland (Fig. F1). No downhole geophysical logs were obtained inHole 1276A, preventing the reorientation of core samples to a moderngeographic reference frame using, for example, high-resolution Forma-tion MicroScanner (FMS) images. In the absence of this type of straight-forward way to reorient samples, a different approach was used: seismicdips, bedding dips in cores, and the availability of a single measure-ment of the amount of the borehole deviation (but not its direction)were all considered in order to infer the azimuth of the dip line in corepieces. The dip line was then used as a reference direction to reorientthe core samples and paleocurrent measurements.
Site 1276 is located in 4560 m of water east of the Grand Banks andsouth of Flemish Cap. Coring began 800 meters below seafloor (mbsf)and proceeded to approximately the Aptian/Albian boundary at 1739mbsf. The sedimentation rate was generally <5–7 m/m.y. from the earli-est Oligocene to the Cenomanian but was ~20–100 m/m.y. during theAlbian. As a consequence, the Albian section predominates and extendsfrom ~1145 to 1700 mbsf (Fig. F2). This interval consists of ~ hemipe-lagic bioturbated mudrocks, ~ mud-dominated gravity-flow deposits,and volumetrically minor but numerous black shales rich in terrestrialorganic carbon. The Albian succession belongs to previously definedlithologic Subunits 5B and 5C (Shipboard Scientific Party, 2004a). Theproportion of black shales decreases below ~1400 mbsf, whereas theproportion of thick bedded to very thick bedded muddy turbidites,some as graded units thicker than 2 m, increases below ~1500 mbsf (Fig.F3). The thicker turbidites are characterized by ductile soft-sediment de-formation and pseudonodule development. Sorting in these beds ispoor, and there are common plant fragments and mud clasts.
The Albian succession corresponds to seismic Sequence B (ShipboardScientific Party, 2004a), which is characterized by mostly parallel reflec-tors that typically extend for tens to hundreds of kilometers. In its up-per part, minor local downlap and onlap suggest some depositionalrelief. There is a slight seaward dip over a broad area around Site 1276.This dip is crucial to unraveling paleocurrents in the Albian successionand will be discussed more fully in “Data and Methods,” p. 4.
During the Albian, a narrow seaway had opened between the GrandBanks and the western margin of Iberia (Fig. F4). The central segment ofthe North Atlantic Ocean was much wider; northwest Africa had sepa-rated from Nova Scotia in the Middle Jurassic. By the Albian, the Afri-can plate had slid along the south Newfoundland transform margin toa position well east of the Grand Banks. Hence, the narrow seaway atSite 1276 faced a wide ocean basin to the south. Potential source areasfor the Albian turbidites include Flemish Cap, the southern GrandBanks, and the more northerly extension of the propagating North At-
54°W 52° 50° 48° 46° 44° 42° 40°
5000 4000 3000 2000 1000 0Depth (m)
4000
4000
4000 4000
5000
3000
3000
3000
1000
1000
1000
5000
2000
Site 1276
Flemish Cap
Newfoundland Smts.
Abyssalplain Milne
Smts.
Flem
mis
h Pa
ss
Jean
ne d
'Arc
Bas
in
GrandBanks
OrphanKnoll
Newfoundland
Con
tinen
tal
rise
Northw
est
Atlantic
Mid-O
cean
Channel
SE Newfoundland
Ridge
40°
42°
44°
46°
48°
50°
52°N
Avalon Uplift
CentralAtlantic
NorthAtlantic
F1. Location of ODP Site 1276, p. 15.
Cla
ysto
neS
iltst
one
V. fi
neF
ine
Med
ium
Coa
rse
V. c
oars
eC
ongl
om.
Soft-sed. foldsand faults
Sand
753.00
Maast.
Camp.
Tur.
Con.
Sant.
Bla
ck s
hale
s
Grainstone
Sandstone
Siltstone
Diabase
Jeanne d’Arc Basin
Site 1276
South Mara Mbr.
Tilton Mbr. Avondale Mbr.
Wyandotformation
Fox Harbour Mbr.
Otter Bay Mbr. Unnamed sandsBay Bulls Mbr.
Red Island Mbr.
Ben Nevis formation
Avalon formation Whiterose shale
Nautilus shale
OB unconformity(erosion into condensed interval)
Petrel Mbr.
HiatusaboveOuterRidge
FH unconformity
Avalon unconformity
SM unconformity
Ban
quer
eau
form
atio
nD
awso
n C
anyo
n an
dW
yand
ot fo
rmat
ions
Ben
Nev
is a
ndN
autil
us fo
rmat
ions
Pal
eoge
neC
reta
ceou
s
Age
(M
a)
Condensed
Eoc
ene
Pal
eoce
neC
enom
.A
lbia
n
Dep
th (
mbs
f)
800
850
900
950
1000
1050
1100
1150
1200
1250
1300
1350
1400
1450
1500
1550
1600
1650
1700
1750
1
2
3
4
5A
5B
5C
5C
5C1
5C2
Unconformities
Sandy mudstone andmuddy sandstoneSiliciclastic fraction of claystone,mudstone, and marlstoneCarbonate fractionof marlstone
50
60
70
80
90
100
110
120
Eoceneearlymid/
Paleoc.
Maast.
Camp.
Sant.Coniac.
Tur.
Cenom.
Albian
Aptian
Southern and Western margin Central and Northern Basin Eastern margin
Uni
t
Age
Lith
.
Corerecovery
F2. Hole 1276A lithologic column correlated to time-equivalent stra-tigraphy, p. 16.
2 3⁄1 3⁄
1630
1640
1650
1660
1670
89R89R
90R90R
91R91R
92R92R
93R93R
89R
Dep
th (
mbs
f)
90R
91R
92R
93R
DF
DF
DF
DF
Mud
Silt
Ver
y fin
eF
ine
Med
ium
Coa
rse/
V. c
oars
eG
rave
l
Core
F3. Graphic section of Cores 210-1276A-89R to 93R, p. 17.
Site 637Site 639
Site 1070
Site 900
Site 901
TAP
IAP
GLB
SENR
PB
WAB
CSB
FC
OB
Transform margin
JB
M0
HB
Avalon Uplift
Iberia
CB
LB
IGB
50°N
45°
50° 45° 35°40°55°W
118 m.y.
M0
Newfoundland
Ireland UnitedKingdom
France
Site 1276135°
Albian~110 Ma
1000 km
Continent
Shallow marine carbonates anddeeper marine sediments
Marine basins floored by oceaniccrust
Continental and shallow marineclastic sediments
A
B
F4. Reconstructions of the Creta-ceous North Atlantic region, p. 18.

R.N. HISCOTTPALEOFLOW DIRECTIONS OF ALBIAN BASIN-FLOOR TURBIDITY CURRENTS 3
lantic rift system. The nascent mid-ocean ridge to the east of Site 1276likely prevented bottom-hugging gravity currents from reaching thearea from the Iberian margin, but this scenario cannot be ruled outa priori.
The time-equivalent succession in the Jeanne d’Arc Basin of theGrand Banks consists of the lowest Albian “O35 Upper Sandstone” ofthe Ben Nevis Formation, and the Nautilus Shale (Ainsworth et al.,2005) (Fig. F2). Detritus in the Ben Nevis Formation was derived fromthe southwest and south (Ainsworth et al., 2005). The Nautilus Shaleaccumulated in a well-oxygenated open-shelf environment, which de-veloped during a period of transgression.
Paleoflow in a turbidite succession can be determined by measurementof the orientation of sedimentary structures: sole markings, foresets ofcurrent-ripple cross-lamination, and foresets of dune-scale cross-bedding. In small diameter cores, sole markings (e.g., flutes, grooves)are rarely encountered and are therefore not a viable structure for rou-tine analysis. Dune-scale cross-bedding is extremely rare in turbidites,whereas the migration direction of current ripples in the Tc division (cdivision of Bouma, 1962) can commonly be measured, even in cores.
An alternative to the use of sedimentary structures is the microscopicmeasurement of the grain fabric of sandstones. Numerous studies haveshown that sand grain orientation is a reliable indicator of paleoflow di-rection in sandy turbidites (McBride and Kimberly, 1963; Spotts, 1964;Colburn, 1968; Onions and Middleton, 1968; Parkash and Middleton,1970; Hiscott and Middleton, 1980). The long axes of the detrital parti-cles are preferentially oriented parallel with the paleoflow direction (Jo-hansson, 1976; Allen, 1984, p. I-219). Even very large elongate fossils,for example graptolite stipes in Paleozoic deposits, are aligned with thepaleocurrent (Enos, 1969; Parkash and Middleton, 1970), although theytend to lie in bedding and therefore do not show imbrication. In con-trast, the average sand-sized elongate particles in planar-laminated orstratified sandstone turbidites tend to be inclined into the current, pro-ducing an imbrication of ~10°–30° (Hiscott and Middleton, 1980), al-though lower values of imbrication are not uncommon (Allen, 1984,p. I-219).
The alignment of detrital grains can be measured directly using mi-croscopic techniques or indirectly using anisotropy of magnetic suscep-tibility (AMS). AMS measures the preferred orientation of magneticgrains in a sandstone or siltstone (Rees, 1965; Taira, 1976; Hiscott et al.,1997). Like any other paleocurrent indicator, grain fabric is a measureof the local flow vector and not the average flow field. Parkash andMiddleton (1970) showed that velocity vectors in turbidity currents me-ander in a streamwise direction, so that paleoflow indicators in a singlebed can vary by tens of degrees either downcurrent or stratigraphicallyupward in the deposit of a single gravity flow (see also Onions and Mid-dleton, 1968; Hiscott and Middleton, 1980). The implication is that anumber of measurements of paleoflow must be averaged in order to as-sess the ancient dispersal direction.

R.N. HISCOTTPALEOFLOW DIRECTIONS OF ALBIAN BASIN-FLOOR TURBIDITY CURRENTS 4
DATA AND METHODS
Establishing the Original Orientation of Core Pieces and Samples
Paleocurrent measurements must be placed within a geographic co-ordinate system. At first, the correct reorientation of core pieces andgrain-fabric samples analyzed from Hole 1276A seemed an impossibilitybecause of the lack of borehole images or other guides to core orienta-tion. However, three observations prompted the author to look for analternative way to orient core samples:
1. Apparent dip measurements from crossing multichannel seismicreflection lines (Fig. F5; Table T1) indicate that the reflections inSubunits 5B and 5C, below a depth of ~1250 mbsf, dip toward~130° (seaward) at an average angle of ~2.5°.
2. The Tensor tool was deployed deep in Hole 1276A and indicatedthat the borehole is deviated 7.43° from the vertical at a depth of1652 mbsf.
3. Maximum dips measured in X-ray computed tomography (CT)scans of long sections of unbroken core are as much as ~15° andaverage ~10° (Fig. F6 and supporting discussion in “Establishingthe Amount of Maximum Apparent Dip from CT Images,”p. 5).
It is well known that holes bored into dipping strata tend to naturallydeviate either updip or downdip (McCray and Cole, 1959). The only waythat bedding can dip an average of 10° relative to the borehole, when thetrue dip is ~2.5°, is if the borehole had deviated downdip. This would re-sult in an apparent dip in cores which is the sum of the true dip and theborehole deviation. In the case of Hole 1276A, the deviation directionmust be almost exactly downdip (i.e., toward ~130°) to account for theobserved average apparent dip measured from the CT scans (Fig. F6). Thefact that both the true dip and the hole deviation are toward ~130°means that the dip line in any piece of core can be assumed to point to-ward this same azimuth. This result provides a critical reference direc-tion for the paleocurrent measurements reported in this paper.
Depth-converted multichannel seismic reflection profiles were pro-vided to the author by shipboard participant D. Shillington (extractedfrom profiles in Shillington et al., 2006). Line 2 crosses Site 1276 in thedip direction (N125E), and Line 303 crosses the site in the strike direc-tion (N35E). Six prominent dipping reflections were selected in thedepth range corresponding to the Albian succession. Apparent dipswere measured in both the dip and strike profiles, and the Macintoshapplication Stereonet (version 6.3X) was used to determine the true dipdirections and amounts after accounting for the vertical exaggerationin the profiles (Table T1). The data were then averaged to give the truedip of the Albian succession. One of the apparent dips in the strike pro-file (Line 303) is 1.44° toward the northeast; this is different from theother five apparent dips both in direction and amount (Fig. F5). How-ever, the other five apparent dips on this profile are all significantlysmaller than the corresponding apparent dips in the dip profile (Line2), indicating that the structural dip line must be quasi-parallel to theorientation of Line 2. Omitting the seemingly anomalous northeasterly
0.300.30
-1.440.70
0.37
0.00
1 km
Site 1276 Site 1276
1.543.263.192.002.00
2.04
5.0
6.0
7.0
5.5
6.0
5.5
4.5
6.5
Dep
th (
km)
Dep
th (
km)
Horizon U
Horizon Au
125° 35°Dip Line 2 Strike Line 303
F5. Depth-converted seismic re-flection profiles through Site 1276, p. 19.
T1. Apparent dips and calculated true dips of six reflections, p. 24.
1000
1200
1400
1600
1800
1
2
3
4
Dips/core
Dip angle (°)
Dep
th (
mbs
f)
Bes
t-fit
line
0 5 10 15 20
F6. Average core-by-core maxi-mum dip, p. 20.

R.N. HISCOTTPALEOFLOW DIRECTIONS OF ALBIAN BASIN-FLOOR TURBIDITY CURRENTS 5
apparent dip of 1.44° would change the orientation of the calculatedaverage dip line by <6°, from 128.6° to 134.2°.
Establishing the Amount of Maximum Apparent Dip from CT Images
An X-ray CT scanner was used for routine prescreening of unsplitwhole cores. The unit was manufactured by Lawrence Berkeley NationalLaboratory (Berkeley Lab) and is described in detail by Freifeld et al.(2003). During scanning, the core was rotated around its vertical axis180 times in steps of 2° until a complete rotation of 360° was achieved.The gantry holding the X-ray source and detector was raised and low-ered by a belt-driven actuator to permit the examination of selected 15-cm-long regions of the core. The X-ray source has a tungsten target anda 250-µm beryllium window, delivering up to 130 kV at 65 W. It has avariable focal-spot size that increases from 5 µm at 4 W to 100 µm at 65W. An image intensifier with a cesium iodide phosphor input screenwas coupled to a digital camera for image capture (a Sony XC-75 with aresolution of 768 × 494 pixels and a signal-to-noise ratio of 56 dB). Tenframes of the same image were acquired and averaged to reduce cameranoise. Each of the 180 images acquired at each position records the in-tegrated densities across the entire thickness of the core.
On shore, the archived CT scans were viewed using the special-purpose program XVIEW developed by W.G. Mills of the Ocean DrillingProgram (ODP)/Integrated Ocean Drilling Program. Images were se-lected from long intervals of unbroken or slightly fractured core inwhich dipping beds were clearly visible. Up to four good-quality imagesfitting these criteria were studied in individual 9.6-m-long cores.XVIEW allows sequential examination of the 180 images generated byrotation of the gantry during acquisition of the images. This was doneuntil the maximum dip angle (i.e., the “maximum apparent dip”) wasdisplayed. This is not, of course, the true dip of the strata because it isthe sum of the borehole deviation and some component of the beddingdip. Using a cursor-controlled tool in XVIEW, this maximum dip anglewas precisely measured. For each 9.6-m-long core, all measured maxi-mum dip angles were averaged in order to minimize the effects of slighttilting of pieces of core in the plastic liners.
Ripple and Grain-Fabric Paleocurrent Measurements
During Leg 210, the author measured paleoflow direction from 11sets of cross-lamination forming the Tc divisions of turbidites (TableT2). These were measured in degrees clockwise or counterclockwisefrom the maximum dip in the particular piece of core. Such measure-ments are believed to be accurate to ±10° because of uncertainties in de-termination of the dip direction of local bedding and the maximum dipdirection of ripple foresets.
Sixteen sandstone samples were taken from the planar-laminated Tb
divisions of turbidites (b divisions of Bouma, 1962), but only where thedip direction of the laminae could be easily determined from the sam-ple itself. For each sample, a thin section was cut parallel to the lami-nae, and the maximum dip direction was marked on the microscopeslide. All thin sections were cut so that the view, downward through theslide, is stratigraphically downward.
T2. Ripple migration directions re-corded in core pieces, p. 25.

R.N. HISCOTTPALEOFLOW DIRECTIONS OF ALBIAN BASIN-FLOOR TURBIDITY CURRENTS 6
The orientation of 200 or more grains was measured in eachbedding-parallel thin section, following procedures described byHiscott and Middleton (1980). In some samples, the elongate grains aremostly silicate minerals like quartz and feldspar, but in many finer-grained sandstones, the elongate clasts are predominantly plant frag-ments. Because of the small sample size and dearth of larger elongatesilicate grains in some samples, all particles with a clear orientationwere selected for measurement. The outline of each elongate grainlarger than ~0.1 mm and with a b/a axis ratio >1.5 was traced onto alarge sheet of stiff clear plastic laid on the 50-cm-diameter viewing win-dow of a Baty Shadowmaster (model SM20B) microprojector, at a mag-nification of 100×. After all grains in a particular view were traced, thethin section was mechanically advanced to a new position. This processcontinued until 200 grains were traced. The dip line was transferred tothe plastic sheet and orientations to the nearest degree of the long axesof the 200 grains were measured relative to the dip line, in the range of0°–179° (i.e., the smallest possible angle was recorded). Symmetricalequal-area rose diagrams were plotted for each sample after groupingthe data into 10° classes. Equal-area plots are preferred because the hu-man eye attaches more weight to the area of a slice in a pie-typediagram than to its length (Nemec, 1988; Baas, 2000).
The vector mean (υ) and vector magnitude (L) were calculated foreach sample using procedures outlined by Harrison (1957). The Tukey χ2
test (Middleton, 1965) was used to determine the significance of eachorientation. Only those samples with a significance level (SL) ≤ 0.10were deemed to have a preferred orientation and were selected for analy-sis of imbrication direction. By convention, the vector mean is recordedas the smallest possible angle so is assigned an azimuth of 000°–179°rather than 000°–359°.
For a sample size of 200 and a vector magnitude corresponding to aSL ≤ 0.10, the 90% confidence interval about the mean is bounded byapproximately υ – 5° and υ + 5° (fig. 3 in Curray, 1956). The true vectormean will lie outside these limits one time in ten. To this uncertaintymust be added realistic errors associated with determining the dip direc-tion in each piece of core. To account for these uncertainties, it is pro-posed that orientation measurements be considered accurate to nobetter than ±15°. This does not include any uncertainty associated withestablishing the geographic reference direction of 130°.
For each sample with SL ≤ 0.10, the remainder of the rock sample wascut perpendicular to its planar lamination and parallel to the paleoflowdirection deduced from grain alignment in the first thin section. Inthese bedding-perpendicular thin sections, the orientation of 200grains was measured as described above, but with the lamination itselfas the reference line. Equal-area rose diagrams provide a visual sum-mary of the data. The discovery of a significant imbrication allows theunambiguous selection of υ or υ + 180° as the true paleoflow direction.
The vector magnitude (i.e., strength) of the grain fabric tends to beconsiderably stronger perpendicular to layering than parallel to layer-ing (Harrison, 1957). Such high vector magnitudes result in moreclosely spaced 90% confidence limits bounded by approximately υ – 3°and υ + 3°. The actual vector mean of the imbrication will be outsidethese limits one time in ten and will be less than the lower confidencelimit (i.e., closer to the horizontal) only one time in twenty. However,there are additional errors and uncertainties in picking the plane of thelamination and measuring individual grains, including operator varia-tion (Hiscott and Middleton, 1980); these likely contribute to about ±5°

R.N. HISCOTTPALEOFLOW DIRECTIONS OF ALBIAN BASIN-FLOOR TURBIDITY CURRENTS 7
additional error. To account for these uncertainties, it was decided toonly consider imbrications as being significant if 8° or greater.
Many Hole 1276A samples have strong grain alignment in sectionscut perpendicular to bedding, but this alignment cannot be used touniquely specify the paleoflow direction (rather than the line-of-motion of the current) unless the average long axis of the grains is in-clined ≥8° to the sedimentary layering. Not surprisingly, samples withplant fragments as a majority of the measured fabric elements tend notto show a sufficiently high imbrication angle to permit a decision onthe paleoflow direction (i.e., to choose between υ and υ + 180°). Thesefragments are larger and less dense than associated silicate particles and,like the graptolite stipes in some Paleozoic sandstones, tend to lie hori-zontally in the lamination.
RESULTS
If the average dip angle in the cores (Fig. F6) had been less than ~10°,then there would have been two directions in which Hole 1276A mighthave been deviated, both of which would have satisfied the require-ment that the deviation angle plus the actual apparent dip measuredfrom the horizontal must equal the dip seen in the cores. These two di-rections would have been disposed to either side of the true dip direc-tion of the Albian strata. The fact that the average dip angle measuredrelative to the nominal vertical axes of the cores is ~10° greatly simpli-fies the paleocurrent analysis because the only logical solution is thatthe hole is deviated in the direction of the true dip.
Because borehole images and standard geophysical logs were notobtained in Hole 1276A, confirmation that the dip line (from seismicreflection profiles) provides a reliable geographic reference frame forthe fabric samples (with their internal dipping laminae) is difficult toestablish. Paleomagnetic data might provide an independent methodfor reorienting core pieces, if a magnetic-field orientation of known agecan be extracted from the cores. By chance rather than planning, twofabric samples (Samples 210-1276A-67R-5, 120–122 cm, and 84R-1,111–113 cm) were taken in the same pieces of split core as two paleo-magnetic samples (Samples 210-176A-67R-5, 101–103 cm, and 84R-1,100–102 cm); no other fabric samples are similarly co-located withpaleomagnetic samples. Zhao (this volume) determined declination/inclination pairs of 044.5°/–70.3° and 342.8°/+73° on the paleomag-netic samples from Sections 210-1276A-67R-5 and 84R-1, respectively.X. Zhao (pers. comm., 2005) believes that the inclinations in these sam-ples are sufficiently close to the expected earliest Albian (~112 Ma) in-clination at Site 1276 (i.e., 59° ± 6.7°) to use the measured declinationsin these samples to reorient the core pieces independent of the dip-linemethod. The early Albian declination at Site 1276 was 341.7° (based ona North American 110-Ma reference pole at 75.4°N, 208.8°E, and thelocation of Site 1276 at 45.4°N, 44.6°W).
Relative to the conventions used by ODP paleomagnetists to specifyorientations of archive and working halves (Shipboard Scientific Party,2004b), the rotations needed to correctly reorient the co-located paleo-magnetic and fabric samples in Section 210-1276A-67R-5 are 243° coun-terclockwise (paleomagnetic method; X. Zhao, pers. comm., 2005) and320° counterclockwise (dip-line method). Errors for each calculatedrotation are estimated to be approximately ±10°–15°. For the co-located

R.N. HISCOTTPALEOFLOW DIRECTIONS OF ALBIAN BASIN-FLOOR TURBIDITY CURRENTS 8
samples in Section 210-1276A-84R-1, the equivalent paleomagnetic anddip-line rotations are 000° and 040° counterclockwise, respectively.
The attempt to cross-check paleomagnetic and dip-line methods forreorienting core pieces at Site 1276 is deemed to have been unsuccess-ful. Using maximum error estimates, the discrepancies between themethods are ~50° and 10° (Sections 210-1276A-67R-5 and 84R-1, re-spectively). X. Zhao (pers. comm., 2005) has indicated to the authorthat it is a big assumption that his two samples retain the declinationand inclination of the earliest Albian magnetic field. If they do not,then the apparent discrepancies carry no weight. Even the assessmentthat the inclinations in the paleomagnetic samples are close to the ear-liest Albian inclination might be erroneous because the paleomagneticmeasurements took no account of the ~10° dip of bedding in the cores.Clearly, validation of (1) the 130° reference direction used in this paperto reorient the paleoflow determinations and (2) the method of refer-encing paleocurrent data to the dip line in individual samples awaits anunambiguous, independent method of core reorientation. It is believedthat logging of Hole 1276A, including acquisition of FMS images,would be required.
Using the dip-line method for reorientation, ripple migration direc-tions range from north-northwest to southeast (azimuths of 340° to130°; Table T2). The average of these measurements is toward thenortheast (060°). Equal-area rose diagrams of 11 fabric samples with SL≤ 0.10 show a range of paleoflow directions (Fig. F7; Table T3). Onlyfive of these samples possess an imbrication of ≥8° (Fig. F8; Table T4).Four of these support the north-northeasterly direction determinedfrom ripple foresets (Fig. F9A), whereas the fifth is anomalous in sug-gesting paleoflow toward the west-northwest (289°). This last samplehad a marginal imbrication of 8° with a relatively low vector magni-tude, so the true flow direction for this sample might be toward theeast-southeast instead.
DISCUSSION
Even if an error of ±30° is assigned to the determination of the geo-graphic reference direction, the mean paleoflow direction remains inthe northeast quadrant. A global counterclockwise rotation of the refer-ence direction by 30° results in many of the paleocurrents pointing upthe continental slope toward the Grand Banks. This is believed to be anunrealistic scenario, particularly because the young mid-ocean ridgejust to the east would have been a barrier to gravity-flow transport fromIberia. Therefore, only two cases will be discussed: that the reference di-rection is indeed 130° (Fig. F9A) or that the true reference direction(and local dip direction) is closer to 160° (Fig. F9B).
A 130° reference direction implies paleoflow toward the north-northeast (Fig. F9A) and implicates the Avalon Uplift as the likelysource area. The Avalon Uplift became a positive tectonic element inthe Late Jurassic (DeSilva, 2004) and remained an important source forsandstones in the nearby Jeanne d’Arc Basin throughout the Early Cre-taceous, undoubtedly shedding sediment into the nascent Newfound-land Basin at that time. It has been postulated that the Avalon Uplift is,in part, a response to strike-slip motions along a fault trace extendingfrom the southern Grand Banks into mainland Nova Scotia (Pe-Piperand Piper, 2004). Lower Cretaceous sandstones in the Jeanne d’Arc Ba-sin commonly contain terrestrial plant debris, but this similarity with
210-1276A-68R-3,53–57 cm
210-1276A-79R-2,95–99 cm
210-1276A-82R-1,50–54 cm
210-1276A-83R-2,53–56 cm
210-1276A-84R-1,111–115 cm
210-1276A-87R-3,120–125 cm
210-1276A-89R-4,122–127 cm
210-1276A-89R-6,137–141 cm
210-1276A-92R-3,37–42 cm
210-1276A-96R-1,89–93 cm
N
210-1276A-94R-3,69–73 cm
0 5 10 20
Paleoflow vector
Line-of-motion only
Scale, equal-area roses(number per 10° sector)
F7. Equal-area rose diagrams sum-marizing bed-parallel grain fabric, p. 21.
T3. Summary statistics for bed-par-allel thin sections, p. 26.
337°
36°
216°
157°
332°
152°
358°
178°
289°
109°
210-1276A-92R-3,37–42 cm
210-1276A-94R-3,69–73 cm
0 5 10 20 40
210-1276A-96R-1,89–93 cm
UpPaleoflow direction
Average imbrication
Scale, equal-area roses(number per 10° sector)
210-1276A-68R-3,53–57 cm
210-1276A-79R-2,95–99 cm
210-1276A-82R-1,50–54 cm
210-1276A-83R-2,53–56 cm
210-1276A-84R-1,111–115 cm
210-1276A-87R-3,120–125 cm
210-1276A-89R-4,122–127 cm
210-1276A-89R-6,137–141 cm
F8. Equal-area rose diagrams sum-marizing bed-perpendicular grain fabric, p. 22.
T4. Summary statistics for bed-perpendicular thin sections, p. 27.
Site 637Site 639
Site 1070
Site 900
Site 901
TAP
IAP
GLB
SENR
FC
WB
JB
M0
HB
AvalonUplift
LB
45°N
50°W 45° 40°
Site 1276
130°
Site 637Site 639
Site 1070
Site 900
Site 901
TAP
GLB
SENR
FC
WB
JB
M0
HB
AvalonUplift
LB
50°W 45° 40°
Site1276 160°
??
IAP
A B
F9. Unit vector plots of 11 ripple foreset dips and vector means for 11 grain-fabric determinations, p. 23.

R.N. HISCOTTPALEOFLOW DIRECTIONS OF ALBIAN BASIN-FLOOR TURBIDITY CURRENTS 9
the Site 1276 Albian sandstones does not require a common source. Inthe Figure F9A scenario, Flemish Cap and areas farther north providedno detritus. This might have been because they were largely submergedduring the high sea levels of the Albian, or because of relief created byfracture zones oriented orthogonal to the continental margin thatwould have compartmentalized the sediment dispersal and preventedthe input of detritus from farther north.
Dispersal of the Albian turbidity currents from the Avalon Uplift andenvirons would require a strong component of northward axial trans-port into the opening rift arm between the Grand Banks and Iberia. Ax-ial transport is quite common in ancient elongate basins, with thepremier examples being provided by foreland basins at convergent mar-gins (e.g., Enos, 1969). The young Newfoundland Basin would havebeen less constricted than a foreland basin, so that gravity currentswould have been more free to deviate to the left or right of the averageflow direction, perhaps accounting in part for the considerable scatterof paleocurrent measurements. As noted earlier, paleoflow indicators inOrdovician turbidites have been shown to swing from side to side fromthe base to the top of those deposits. Such free meandering of local flowvectors would be facilitated by transport across a relatively flat basinfloor (Fig. F5). The presence of thick to very thick turbidites with thickmuddy caps in the Albian succession at Site 1276 (Fig. F3) is typical ofbasin-plain settings (Pickering et al., 1989) and supports the notion of arelatively flat featureless area where successive currents could takesomewhat different routes across the basin floor.
A 160° reference direction implies paleoflow toward the east (Fig.F9B) and permits detrital supply from a broader source area across thesouthern Grand Banks. Turbidity currents could have taken a path di-rectly downslope, essentially orthogonal to the young continental mar-gin. However, much of this part of the Grand Banks is occupied byCretaceous basins which themselves contain Albian marine shales (e.g.,Nautilus Shale of Jeanne d’Arc Basin). These submerged or low-lyingareas are unlikely sources for the thick, terrigenous Albian succession inthe Newfoundland Basin.
There are no strong criteria to guide the selection of Figure F9A orF9B as the more realistic reconstruction of Albian paleoflow. However,either option implicates the Avalon Uplift as a primary source for thelarge volumes of Albian sediment present in the Newfoundland Basin.The southeasternmost part of this long-lived high is underlain by rocksof the Meguma Zone of the Canadian Appalachians (Haworth and Lefort,1979; Schenk, 1995). Where exposed in Nova Scotia, the Meguma Zoneis largely underlain by Lower Paleozoic shales/slates and sandstone tur-bidites of the Goldenville and Halifax groups (Schenk, 1995). The restof the Grand Banks is underlain by Precambrian–Lower Paleozoic rocksof the Avalon Zone (Williams et al., 1995), covered in large part byyounger Carboniferous rocks (Sanford et al., 1979) believed to bemostly continental to deltaic sandstones and shales similar to the out-cropping Carboniferous strata in the Canadian Appalachians. All ofthese rock types would be suitable sources for the Albian succession re-covered at Site 1276. During the Early Cretaceous, this area had a lati-tude of ~30°N (Irving, 1979; Dercourt et al., 1986) and a maritimeclimate. These conditions would have promoted chemical weathering,fluvial transport of erosional products to the coast, and subsequent re-mobilization into the deep Newfoundland Basin by turbidity currents.A fairly direct fluvial–deltaic supply is indicated by the abundance of
R.N. HISCOTTPALEOFLOW DIRECTIONS OF ALBIAN BASIN-FLOOR TURBIDITY CURRENTS 10
terrestrial organic material in the Albian succession (Shipboard Scien-tific Party, 2004a) and the textural immaturity of the sediments.
The North Atlantic rift opened progressively from the southernGrand Banks toward the north. With this zipperlike opening, it mightbe predicted that the region around the propagating rift tip would bethe most highly elevated area and therefore the most likely source forcoarser-grained detritus. An ancient example showing this polarity isthe Athapuscow Aulacogen (Hoffman, 1969), which is the failed arm ofa rift system in the Proterozoic of the Great Slave Lake area, northernCanada. In that system, siliciclastic sediments of the Sosan Group weretransported axially from the inland tip of the failed rift toward the tri-ple junction. If the North Atlantic rift had behaved in the same way,then one might have expected southward axial flow between the GrandBanks and Iberia from source areas to the north. However, there was al-ready an Albian seaway extending well to the north of the Grand Banks(Dercourt et al., 1986; Ziegler, 1988; Gradstein et al., 1990), with marinesediments widely distributed in basins of the United Kingdom shelf andinto the Bay of Biscay (Fig. F4A). This seaway signifies low relief in therift zone, which allowed high Albian sea levels to inundate large areas.Detritus from adjacent lands would have been used to fill local accom-modation space, rather than being shunted farther south. As notedabove, fracture zones oriented transverse to the rift zone also mighthave played a role in preventing sediment supply to Site 1276 from thenorth (cf. Escanaba Trough in the modern eastern Pacific, Zuffa et al.,2000).
Without significant detrital input from the northern extremities ofthe propagating rift, the persistent Avalon Uplift took on this role andeffectively reversed the expected polarity of paleoflow in the New-foundland Basin by shedding large amounts of detritus onto the west-ern slopes of the narrow Albian ocean basin. From this marginalposition, a variety of slope failures generated large-volume mud-ladenturbidity currents that formed the typical basin-plain succession seen atSite 1276.
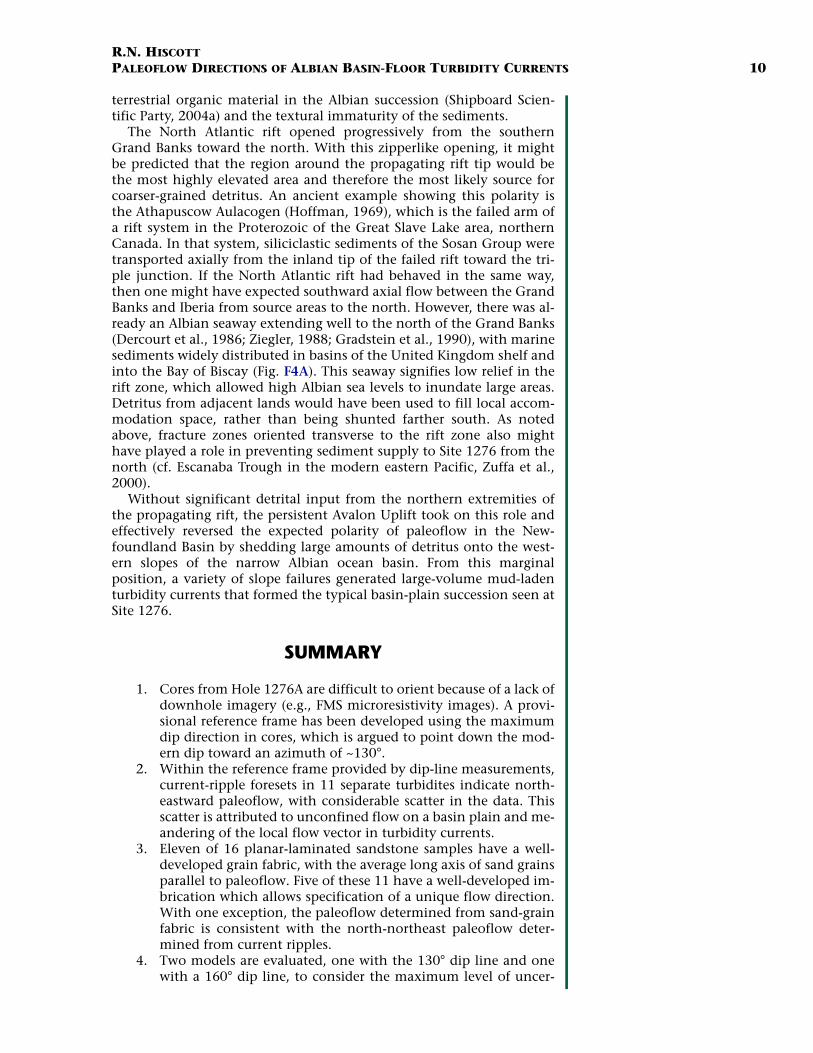
SUMMARY
1. Cores from Hole 1276A are difficult to orient because of a lack ofdownhole imagery (e.g., FMS microresistivity images). A provi-sional reference frame has been developed using the maximumdip direction in cores, which is argued to point down the mod-ern dip toward an azimuth of ~130°.
2. Within the reference frame provided by dip-line measurements,current-ripple foresets in 11 separate turbidites indicate north-eastward paleoflow, with considerable scatter in the data. Thisscatter is attributed to unconfined flow on a basin plain and me-andering of the local flow vector in turbidity currents.
3. Eleven of 16 planar-laminated sandstone samples have a well-developed grain fabric, with the average long axis of sand grainsparallel to paleoflow. Five of these 11 have a well-developed im-brication which allows specification of a unique flow direction.With one exception, the paleoflow determined from sand-grainfabric is consistent with the north-northeast paleoflow deter-mined from current ripples.
4. Two models are evaluated, one with the 130° dip line and onewith a 160° dip line, to consider the maximum level of uncer-
R.N. HISCOTTPALEOFLOW DIRECTIONS OF ALBIAN BASIN-FLOOR TURBIDITY CURRENTS 11
tainty which might exist in the specification of geographic ori-entations. This uncertainty includes possible errors indetermination of the seismic dip direction, the bedding dip incore samples, and the direction of borehole deviation. Bothmodels suggest derivation of the Albian turbidites from the adja-cent Grand Banks, specifically from the southeast corner of thatplatform in the vicinity of the Avalon Uplift. There is no supportfor a source to the east in Iberia, nor for a source farther north inthe developing North Atlantic rift.
5. Although some uncertainty will continue to surround the reori-entation of samples and cores used for this study, it has beenpossible to demonstrate that sand-grain fabric can be used to de-termine the paleoflow of the Albian turbidites in the Newfound-land Basin. If this area is revisited and borehole images permit abetter orientation of Leg 210 or other core samples, then there isclear promise in reevaluating the data in this paper or in apply-ing the same methods to new samples.
ACKNOWLEDGMENTS
I thank the crew of the JOIDES Resolution for skillful operations in theNewfoundland Basin. This research used samples and/or data providedby the Ocean Drilling Program (ODP). ODP is sponsored by the U.S. Na-tional Science Foundation (NSF) and participating countries under themanagement of Joint Oceanographic Institutions (JOI), Inc. This studywas supported by Natural Sciences and Engineering Research Council ofCanada. Travel funding to join the leg was provided by the Dean of Sci-ence at Memorial University of Newfoundland (MUN). William (Bill)Mills is thanked for prodigious efforts to ensure operation of the CTscanner at sea, and for writing the XVIEW software. Helen Gillespie wasvery helpful in overseeing sample preparation for the fabric work atMUN. The SCREECH seismic reflection data (Fig. F5) were acquiredwith support from NSF grant OCE98-19053, B.E. Tucholke and W.S.Holbrook, principal investigators. Critical comments by reviewersDavid J.W. Piper, William R. Normark, and editor Brian E. Tucholkeimproved the content of the paper.

R.N. HISCOTTPALEOFLOW DIRECTIONS OF ALBIAN BASIN-FLOOR TURBIDITY CURRENTS 12
REFERENCES
Ainsworth, N.R., Riley, L.A., and Sinclair, I.K., 2005. A mid-Cretaceous (upper Barre-mian–Turonian) lithostratigraphic and biostratigraphic framework for the Hiber-nia oilfield reservoir sequence, Jeanne d’Arc Basin, Grand Banks of Newfoundland.In Hiscott, R.N., and Pulham, A.J. (Eds.), Petroleum Resources and Reservoirs of theGrand Banks, Eastern Canadian Margin. Geol. Assoc. Can. Spec. Pap., 43:45–72.
Allen, J.R.L., 1984. Sedimentary Structures: Their Character and Physical Basis. Dev. Sedi-mentol., 30: Amsterdam (Elsevier).
Andeweg, B., 2002. Cenozoic tectonic evolution of the Iberian Peninsula, causes andeffects of changing stress fields [Ph.D. thesis]. Vrije Universiteit Amsterdam.
Baas, J.H., 2000. EZ-ROSE: a computer program for equal-area circular histograms andstatistical analysis of two-dimensional vectorial data. Comp. Geosci., 26(2):153–166.doi:10.1016/S0098-3004(99)00072-2
Bouma, A.H., 1962. Sedimentology of Some Flysch Deposits: a Graphic Approach to FaciesInterpretation. Amsterdam (Elsevier).
Colburn, I.P., 1968. Grain fabrics in turbidite sandstone beds and their relationship tosole mark trends on the same beds. J. Sediment. Petrol., 38:146–158.
Curray, J.R., 1956. Analysis of two-dimensional orientation data. J. Geol., 64:117–131.Deptuck, M.E., MacRae, R.A., Shimeld, J.W., Williams, G.L., and Fensome, R.A., 2003.
Revised Upper Cretaceous and lower Paleogene lithostratigraphy and depositionalhistory of the Jeanne d’Arc Basin, offshore Newfoundland, Canada. AAPG Bull.,87(9):1459–1483. doi:10.1306/050203200178
Dercourt, J., Zonenshain, L.P., Ricou, L.-E., Kazmin, V.G., Le Pichon, X., Knipper, A.L.,Grandjacquet, C., Sbortshikov, I.M., Geyssant, J., Lepvrier, C., Pechersky, D.H.,Boulin, J., Sibuet, J.-C., Savostin, L.A., Sorokhtin, O., Westphal, M., Bazhenov,M.L., Lauer, J.P., and Biju-Duval, B., 1986. Geological evolution of the Tethys beltfrom the Atlantic to the Pamirs since the Lias. Tectonophysics, 123(1–4):241–315.doi:10.1016/0040-1951(86)90199-X
DeSilva, N.R., 2004. Application of petroleum system logic to Jeanne d’Arc Basin off-shore Newfoundland. In Hiscott, R.N., and Pulham, A.J. (Eds.), Petroleum Resourcesand Reservoirs of the Grand Banks, Eastern Canadian Margin. Geol. Assoc. Can. Spec.Pap., 43:1–10.
Dickinson, W.R., Beard, L.S., Brakenridge, G.R., Erjavec, J.L., Ferguson, R.C., Inman,K.F., Knepp, R.A., Lindberg, F.A., and Ryberg, P.T., 1983. Provenance of NorthAmerican Phanerozoic sandstones in relation to tectonic setting. Geol. Soc. Am.Bull., 94:222–235.
Enos, P., 1969. Anatomy of a flysch. J. Sediment. Petrol., 39:680–723.Freifeld, B.M., Kneafsey, T.J., Tomutsa, L., and Pruess, J., 2003. Development of a por-
table X-ray computed tomographic imaging system for drill-site investigation ofrecovered core. Proc. Int. Symp. Soc. Core Anal., 581–586.
Gradstein, F.M., Jansa, L.F., Srivastava, S.P., Williamson, M.A., Bonham-Carter, G.,and Stam, B., 1990. Aspects of North Atlantic paleo-oceanography. In Keen, M.J.and Williams, G.L. (Eds.), The Geology of North America (Vol. 2): Geology of the Conti-nental Margin of Eastern Canada: Boulder (Geol. Soc. Am.), 351–389.
Harrison, P.W., 1957. New technique for three-dimensional fabric analysis of till andenglacial debris containing particles from 3 to 40 millimetres in size. J. Geol.,65:98–105.
Haworth, R.T., and Lefort, J.P., 1979. Geophysical evidence for the extent of the Ava-lon zone in Atlantic Canada. Can. J. Earth Sci., 16:552–567.
Hiscott, R.N., Hall, F.R., and Pirmez, C., 1997. Turbidity-current overspill from theAmazon Channel: texture of the silt/sand load, paleoflow from anisotropy of mag-netic susceptibility and implications for flow processes. In Flood, R.D., Piper,D.J.W., Klaus, A., and Peterson, L.C. (Eds.), Proc. ODP, Sci. Results, 155: College Sta-tion, TX (Ocean Drilling Program), 53–78. doi:10.2973/odp.proc.sr.155.202.1997

R.N. HISCOTTPALEOFLOW DIRECTIONS OF ALBIAN BASIN-FLOOR TURBIDITY CURRENTS 13
Hiscott, R.N., and Middleton, G.V., 1980. Fabric of coarse deep-water sandstones,Tourelle formation, Quebec, Canada. J. Sediment. Petrol., 50:703–722.
Hoffman, P.F., 1969. Proterozoic paleocurrents and depositional history of the eastarm fold belt, Great Slave Lake, NWT. Can. J. Earth Sci., 6:441–462.
Hubert, J.F., 1971. Analysis of heavy-mineral assemblages. In Carver, R.E. (Ed.), Proce-dures in Sedimentary Petrology: New York (Wiley), 453–478.
Irving, E., 1979. Paleopoles and paleolatitudes of North America and speculationsabout displaced terrains. Can. J. Earth Sci., 16:669–694.
Johansson, C.E., 1976. Structural studies in frictional sediments. Geogr. Ann., Ser. A,4:201–301.
McBride, E.F., and Kimberly, J.E., 1963. Sedimentology of the Smithwick shale (Penn-sylvanian), eastern Llano region, Texas. AAPG Bull., 47:1840–1854.
McCray, A.W., and Cole, F.W., 1959. Oil Well Drilling Technology: Norman (Univ. Okla-homa Press).
McLennan, S.M., Taylor, S.R., McCulloch, M.T., and Maynard, J.B., 1990. Geochemi-cal and Nd-Sr isotopic composition of deep-sea turbidites: crustal evolution andplate tectonic associations. Geochim. Cosmochim. Acta, 54(7):2015–2050.doi:10.1016/0016-7037(90)90269-Q
Middleton, G.V., 1965. The Tukey chi-squared test. J. Geol., 73:547–549.Nemec, W., 1988. The shape of the rose. Sediment. Geol., 59(1–2):149–152.
doi:10.1016/0037-0738(88)90105-4 Onions, D., and Middleton, G.V., 1968. Dimensional grain orientation of Ordovician
turbidite greywackes. J. Sediment. Petrol., 38:164–174.Parkash, B., and Middleton, G.V., 1970. Downcurrent textural changes in Ordovician
turbidite greywackes. Sedimentology, 14(3–4):259–293. doi:10.1111/j.1365-3091.1970.tb00195.x
Pe-Piper, G., and Piper, D.J.W., 2004. The effects of strike-slip motion along theCobequid–Chedabucto–southwest Grand Banks fault system on the Cretaceous–Tertiary evolution of Atlantic Canada. Can. J. Earth Sci., 41(7):799–808.doi:10.1139/e04-022
Pickering, K., Hiscott, R., and Hein, R., 1989. Deep-Marine Environments: Clastic Sedi-mentation and Tectonics: London (Unwin-Hyman).
Potter, P.E., and Pettijohn, F.J., 1963. Paleocurrents and Basin Analysis: Berlin (Springer-Verlag).
Rees, A.I., 1965. The use of anisotropy of magnetic susceptibility in the estimation of sed-imentary fabric. Sedimentology, 4(4):257–271. doi:10.1111/j.1365-3091.1965.tb01550.x
Sanford, B.V., Grant, A.C., Wade, J.A., and Barss, M.S., 1979. Geology of Eastern Canadaand Adjacent Areas. Map.—Geol. Surv. Can., 1401A.
Schenk, P.E., 1995. Meguma zone. In Williams, H. (Ed.), The Geology of North America(Vol. 6): Geology of the Appalachian–Caledonian Orogen in Canada and Greenland:Boulder (Geol. Soc. Am.), 261–277.
Shillington, D.J., Holbrook, W.S., Van Avendonk, H.J.A., Tucholke, B.E., Hopper, J.R.,Louden, K.E., Larsen, H.C., and Nunes, G.T., 2006. Evidence for asymmetric non-volcanic rifting and slow incipient oceanic accretion from seismic reflection dataon the Newfoundland margin. J. Geophys. Res., 111(B9):B09402. doi:10.1029/2005JB003981
Shipboard Scientific Party, 2004a. Leg 210 summary. In Tucholke, B.E., Sibuet, J.-C.,Klaus, A., et al., Proc. ODP, Init. Repts., 210: College Station, TX (Ocean Drilling Pro-gram), 1–78. doi:10.2973/odp.proc.ir.210.101.2004
Shipboard Scientific Party, 2004b. Explanatory notes. In Tucholke, B.E., Sibuet, J.-C.,Klaus, A., et al., Proc. ODP, Init. Repts., 210: College Station, TX (Ocean Drilling Pro-gram), 1–69. doi:10.2973/odp.proc.ir.210.102.2004
Spotts, J.H., 1964. Grain orientation and imbrication of Miocene turbidity currentsandstones, California. J. Sediment. Petrol., 34:229–253.
Srivastava, S.P., and Verhoef, J., 1992. Evolution of Mesozoic sedimentary basinsaround the North Central Atlantic: a preliminary plate kinematic solution. In Par-

R.N. HISCOTTPALEOFLOW DIRECTIONS OF ALBIAN BASIN-FLOOR TURBIDITY CURRENTS 14
nell, J. (Ed.), Basins of the Atlantic Seaboard: Petroleum Geology, Sedimentology andBasin Evolution. Spec. Publ.—Geol. Soc. London, 62:397–420.
Taira, A., 1976. Grain orientation and depositional processes—fabric analyses of mod-ern and laboratory flume deposits [Ph.D. thesis]. Univ. Texas, Dallas.
Williams, H., O’Brien, S.J., King, A.F., and Anderson, M.M., 1995. Avalon Zone—New-foundland. In Keen, M.J., and Williams, G.L. (Eds.), The Geology of North America(Vol. 2): Geology of the Continental Margin of Eastern Canada: Boulder (Geol. Soc.Am.), 226–237.
Ziegler, P.A. (Ed.), 1988. Evolution of the Arctic-North Atlantic and the westernTethys. AAPG Mem., 43.
Zuffa, G.G., 1985. Optical analyses of arenites: influence of methodology on compo-sitional results. In Zuffa, G.G. (Ed.), Provenance of Arenites. NATO ASI Ser., Ser. C,148:165–189.
Zuffa, G.G., Normark, W.R., Serra, F., and Brunner, C.A., 2000. Turbidite megabeds inan oceanic rift valley recording Jökulhlaups of late Pleistocene glacial lakes of thewestern United States. J. Geol., 108(3):253–274. doi:10.1086/314404

R.N. HISCOTTPALEOFLOW DIRECTIONS OF ALBIAN BASIN-FLOOR TURBIDITY CURRENTS 15
Figure F1. Location of ODP Site 1276 east of the Grand Banks of Newfoundland. Contours in meters.
54°W 52° 50° 48° 46° 44° 42° 40°
5000 4000 3000 2000 1000 0Depth (m)
4000
4000
4000 4000
5000
3000
3000
3000
1000
1000
1000
5000
2000
Site 1276
Flemish Cap
Newfoundland Smts.
Abyssalplain Milne
Smts.
Flem
mis
h Pa
ss
Jean
ne d
'Arc
Bas
in
GrandBanks
OrphanKnoll
Newfoundland
Con
tinen
tal
rise
Northw
est
Atlantic
Mid-O
cean
Channel
SE Newfoundland
Ridge
40°
42°
44°
46°
48°
50°
52°N
Avalon Uplift
CentralAtlantic
NorthAtlantic

R.N. HISCOTTPALEOFLOW DIRECTIONS OF ALBIAN BASIN-FLOOR TURBIDITY CURRENTS 16
Figure F2. Lithologic column for Hole 1276A (left: Shipboard Scientific Party, 2004a) correlated to the time-equivalent stratigraphy in the Jeanne d’Arc Basin of the Grand Banks (right: Deptuck et al., 2003; Ainsworthet al., 2005). Dark blue grain-size labels denote grades of sand. SM = South Mara, FH = Fox Harbour,OB = Otter Bay, Mbr. = member.
Cla
ysto
neS
iltst
one
V. fi
neF
ine
Med
ium
Coa
rse
V. c
oars
eC
ongl
om.
Soft-sed. foldsand faults
Sand
753.00
Maast.
Camp.
Tur.
Con.
Sant.
Bla
ck s
hale
s
Grainstone
Sandstone
Siltstone
Diabase
Jeanne d’Arc Basin
Site 1276
South Mara Mbr.
Tilton Mbr. Avondale Mbr.
Wyandotformation
Fox Harbour Mbr.
Otter Bay Mbr. Unnamed sandsBay Bulls Mbr.
Red Island Mbr.
Ben Nevis formation
Avalon formation Whiterose shale
Nautilus shale
OB unconformity(erosion into condensed interval)
Petrel Mbr.
HiatusaboveOuterRidge
FH unconformity
Avalon unconformity
SM unconformity
Ban
quer
eau
form
atio
nD
awso
n C
anyo
n an
dW
yand
ot fo
rmat
ions
Ben
Nev
is a
ndN
autil
us fo
rmat
ions
Pal
eoge
neC
reta
ceou
s
Age
(M
a)
Condensed
Eoc
ene
Pal
eoce
neC
enom
.A
lbia
n
Dep
th (
mbs
f)
800
850
900
950
1000
1050
1100
1150
1200
1250
1300
1350
1400
1450
1500
1550
1600
1650
1700
1750
1
2
3
4
5A
5B
5C
5C
5C1
5C2
Unconformities
Sandy mudstone andmuddy sandstoneSiliciclastic fraction of claystone,mudstone, and marlstoneCarbonate fractionof marlstone
50
60
70
80
90
100
110
120
Eoceneearlymid/
Paleoc.
Maast.
Camp.
Sant.Coniac.
Tur.
Cenom.
Albian
Aptian
Southern and Western margin Central and Northern Basin Eastern margin
Uni
t
Age
Lith
.
Corerecovery

R.N. HISCOTTPALEOFLOW DIRECTIONS OF ALBIAN BASIN-FLOOR TURBIDITY CURRENTS 17
Figure F3. Graphic section of Cores 210-1276A-89R to 93R showing very thick bedded mud-dominated tur-bidites (in white) toward the base of the Albian succession in Hole 1276A. The fine-grained bed tops ofthese organized gravity flow deposits contain pseudonodules and ductile deformation structures; basal di-visions are planar laminated and locally cross-laminated. Interbedded shale is pale gray. Disorganizedsandy to pebbly debris flow deposits (DF) are dark gray.
1630
1640
1650
1660
1670
89R89R
90R90R
91R91R
92R92R
93R93R
89R
Dep
th (
mbs
f)
90R
91R
92R
93R
DF
DF
DF
DF
Mud
Silt
Ver
y fin
eF
ine
Med
ium
Coa
rse/
V. c
oars
eG
rave
l
Core
R.N. HISCOTTPALEOFLOW DIRECTIONS OF ALBIAN BASIN-FLOOR TURBIDITY CURRENTS 18
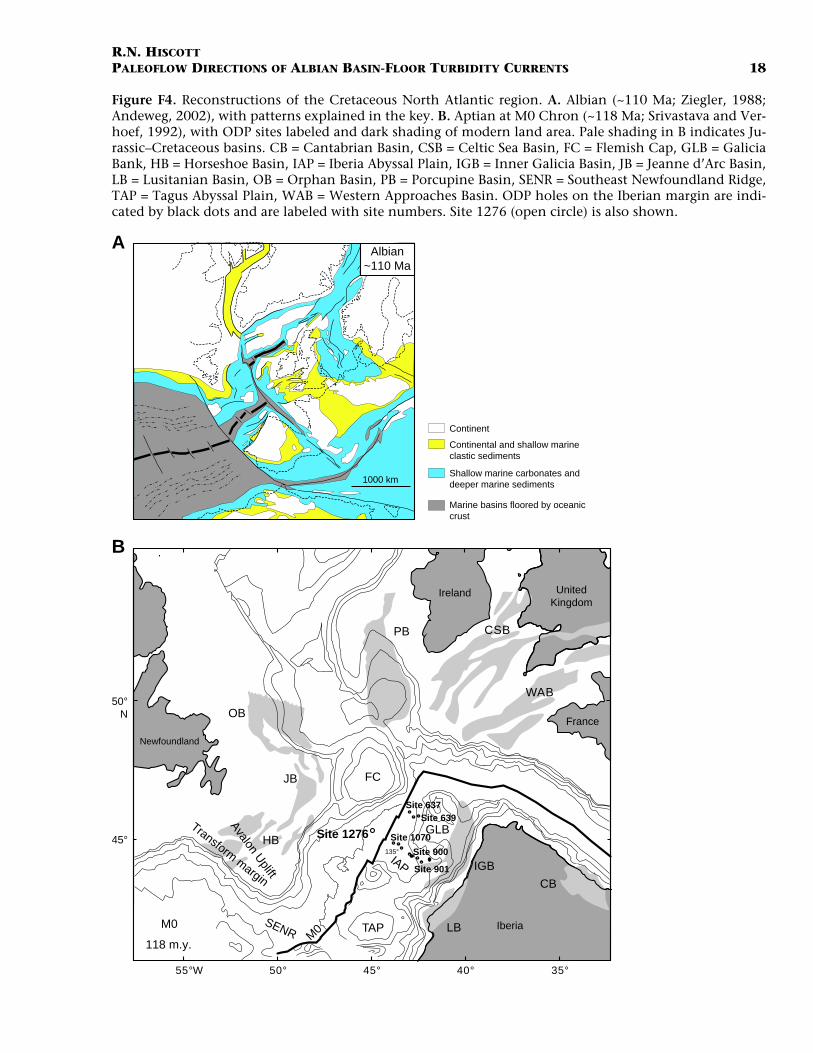
Figure F4. Reconstructions of the Cretaceous North Atlantic region. A. Albian (~110 Ma; Ziegler, 1988;Andeweg, 2002), with patterns explained in the key. B. Aptian at M0 Chron (~118 Ma; Srivastava and Ver-hoef, 1992), with ODP sites labeled and dark shading of modern land area. Pale shading in B indicates Ju-rassic–Cretaceous basins. CB = Cantabrian Basin, CSB = Celtic Sea Basin, FC = Flemish Cap, GLB = GaliciaBank, HB = Horseshoe Basin, IAP = Iberia Abyssal Plain, IGB = Inner Galicia Basin, JB = Jeanne d’Arc Basin,LB = Lusitanian Basin, OB = Orphan Basin, PB = Porcupine Basin, SENR = Southeast Newfoundland Ridge,TAP = Tagus Abyssal Plain, WAB = Western Approaches Basin. ODP holes on the Iberian margin are indi-cated by black dots and are labeled with site numbers. Site 1276 (open circle) is also shown.
Site 637Site 639
Site 1070
Site 900
Site 901
TAP
IAP
GLB
SENR
PB
WAB
CSB
FC
OB
Transform margin
JB
M0
HB
Avalon Uplift
Iberia
CB
LB
IGB
50°N
45°
50° 45° 35°40°55°W
118 m.y.
M0
Newfoundland
Ireland UnitedKingdom
France
Site 1276135°
Albian~110 Ma
1000 km
Continent
Shallow marine carbonates anddeeper marine sediments
Marine basins floored by oceaniccrust
Continental and shallow marineclastic sediments
A
B

R.N. HISCOTTPALEOFLOW DIRECTIONS OF ALBIAN BASIN-FLOOR TURBIDITY CURRENTS 19
Figure F5. Depth-converted seismic reflection profiles through Site 1276, from Shillington et al. (2006). DipLine 2 and strike Line 303 cross at Site 1276. Compass bearings of the ends of the lines are provided. Verticalexaggeration (VE) is 3×. The Albian section is indicated by a double-headed green arrow in both profiles.Apparent dips of reflections are marked with red line segments, with dip angles corrected for VE. Duplicateuninterpreted segments of the central parts of each profile are provided below for comparison. True dipsand dip directions are listed in Table T1, p. 24.
0.300.30
-1.440.70
0.37
0.00
1 km
Site 1276 Site 1276
1.543.263.192.002.00
2.04
5.0
6.0
7.0
5.5
6.0
5.5
4.5
6.5
Dep
th (
km)
Dep
th (
km)
Horizon U
Horizon Au
125° 35°Dip Line 2 Strike Line 303

R.N. HISCOTTPALEOFLOW DIRECTIONS OF ALBIAN BASIN-FLOOR TURBIDITY CURRENTS 20
Figure F6. Average core-by-core maximum dip, plotted against the depths of core tops. The number of in-dividual dip determination contributing to each point is indicated by color coding. The dips were measuredusing XVIEW software. The line of best fit was generated by Microsoft Excel. Scatter about this linedecreases as the number of dip determinations per core increases.
1000
1200
1400
1600
1800
1
2
3
4
Dips/core
Dip angle (°)
Dep
th (
mbs
f)
Bes
t-fit
line
0 5 10 15 20

R.N. HISCOTTPALEOFLOW DIRECTIONS OF ALBIAN BASIN-FLOOR TURBIDITY CURRENTS 21
Figure F7. Equal-area rose diagrams, with 10° bin size, summarizing the bed-parallel grain fabric of 11 sam-ples with a χ2 significance level ≤0.10. Data for all 16 samples are in Table T3, p. 26. North is up. Paleoflowdirections (red arrows) are based on imbrication results in Figure F8, p. 22, and Table T4, p. 27.
210-1276A-68R-3,53–57 cm
210-1276A-79R-2,95–99 cm
210-1276A-82R-1,50–54 cm
210-1276A-83R-2,53–56 cm
210-1276A-84R-1,111–115 cm
210-1276A-87R-3,120–125 cm
210-1276A-89R-4,122–127 cm
210-1276A-89R-6,137–141 cm
210-1276A-92R-3,37–42 cm
210-1276A-96R-1,89–93 cm
N
210-1276A-94R-3,69–73 cm
0 5 10 20
Paleoflow vector
Line-of-motion only
Scale, equal-area roses(number per 10° sector)

R.N. HISCOTTPALEOFLOW DIRECTIONS OF ALBIAN BASIN-FLOOR TURBIDITY CURRENTS 22
Figure F8. Equal-area rose diagrams, with 10° bin size, summarizing the bed-perpendicular grain fabric ofthe 11 samples in Figure F7, p. 21. All thin sections were cut parallel with the bed-parallel vector mean. Allsamples have a χ2 significance level ≤0.005. The bedding is horizontal. Paleoflow directions are only given,with an arrow, for the five samples with imbrication ≥8°. Data for each sample are in Table T4, p. 27.
337°
36°
216°
157°
332°
152°
358°
178°
289°
109°
210-1276A-92R-3,37–42 cm
210-1276A-94R-3,69–73 cm
0 5 10 20 40
210-1276A-96R-1,89–93 cm
UpPaleoflow direction
Average imbrication
Scale, equal-area roses(number per 10° sector)
210-1276A-68R-3,53–57 cm
210-1276A-79R-2,95–99 cm
210-1276A-82R-1,50–54 cm
210-1276A-83R-2,53–56 cm
210-1276A-84R-1,111–115 cm
210-1276A-87R-3,120–125 cm
210-1276A-89R-4,122–127 cm
210-1276A-89R-6,137–141 cm

R.N. HISCOTTPALEOFLOW DIRECTIONS OF ALBIAN BASIN-FLOOR TURBIDITY CURRENTS 23
Figure F9. Unit vector plots of 11 ripple foreset dips (gray arrows) and the vector means for 11 grain-fabricdeterminations (black lines). In five cases where imbrication results defined a unique flow direction, theblack lines have arrow heads indicating the paleoflow direction. In the other cases, the vector means areplotted to be as consistent as possible with the known flow directions, although the data do permit a 180°rotation of these vectors. Two cases are presented. A. The reference line is oriented downdip toward 130°.B. The reference line is rotated 30° clockwise to an azimuth of 160°. The M0 map is a cropped version ofFigure F4, p. 18. FC = Flemish Cap, GLB = Galicia Bank, HB = Horseshoe Basin, IAP = Iberia Abyssal Plain,JB = Jeanne d’Arc Basin, LB = Lusitanian Basin, SENR = Southeast Newfoundland Ridge, TAP = Tagus AbyssalPlain, WB = Whale Basin, ? = least likely dispersal pathway (originating in the vicinity of several rift basinson the Grand Banks).
Site 637Site 639
Site 1070
Site 900
Site 901
TAP
IAP
GLB
SENR
FC
WB
JB
M0
HB
AvalonUplift
LB
45°N
50°W 45° 40°
Site 1276
130°
Site 637Site 639
Site 1070
Site 900
Site 901
TAP
GLB
SENR
FC
WB
JB
M0
HB
AvalonUplift
LB
50°W 45° 40°
Site1276 160°
??
IAP
A B
R.N. HISCOTTPALEOFLOW DIRECTIONS OF ALBIAN BASIN-FLOOR TURBIDITY CURRENTS 24
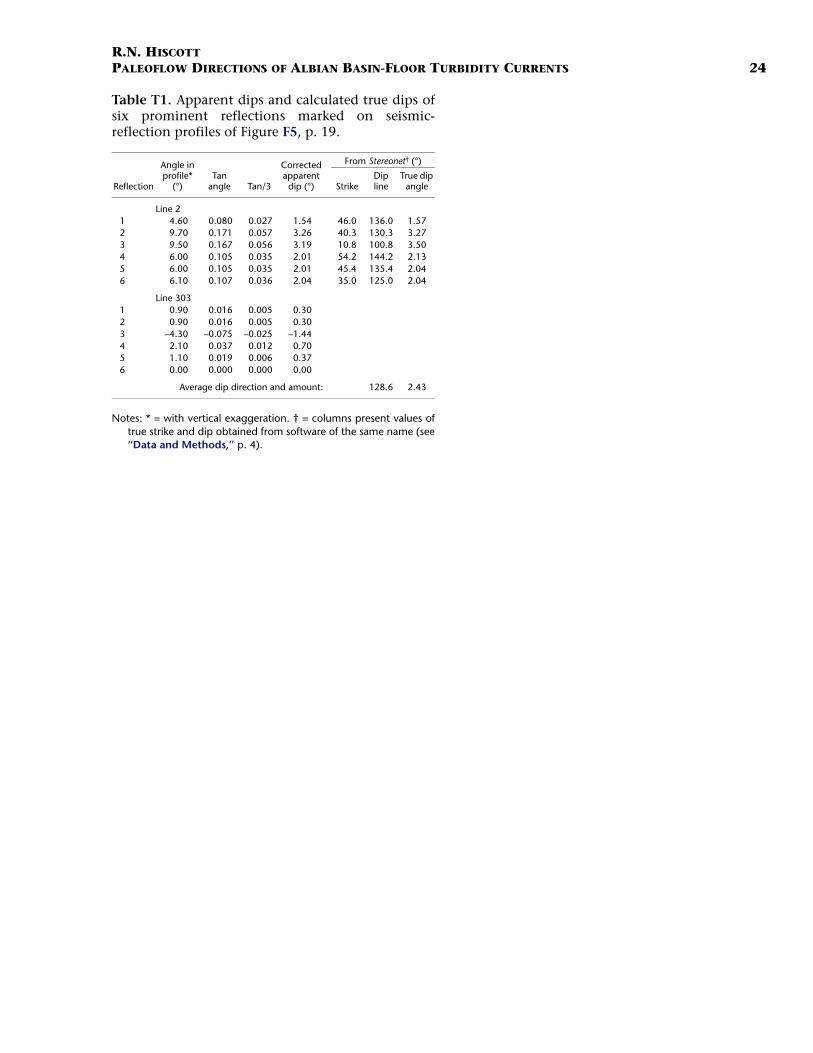
Table T1. Apparent dips and calculated true dips ofsix prominent reflections marked on seismic-reflection profiles of Figure F5, p. 19.
Notes: * = with vertical exaggeration. † = columns present values oftrue strike and dip obtained from software of the same name (see“Data and Methods,” p. 4).
Reflection
Angle in profile*
(°)Tan
angle Tan/3
Corrected apparent
dip (°)
From Stereonet† (°)
StrikeDip line
True dip angle
Line 21 4.60 0.080 0.027 1.54 46.0 136.0 1.572 9.70 0.171 0.057 3.26 40.3 130.3 3.273 9.50 0.167 0.056 3.19 10.8 100.8 3.504 6.00 0.105 0.035 2.01 54.2 144.2 2.135 6.00 0.105 0.035 2.01 45.4 135.4 2.046 6.10 0.107 0.036 2.04 35.0 125.0 2.04
Line 3031 0.90 0.016 0.005 0.302 0.90 0.016 0.005 0.303 –4.30 –0.075 –0.025 –1.444 2.10 0.037 0.012 0.705 1.10 0.019 0.006 0.376 0.00 0.000 0.000 0.00
Average dip direction and amount: 128.6 2.43
R.N. HISCOTTPALEOFLOW DIRECTIONS OF ALBIAN BASIN-FLOOR TURBIDITY CURRENTS 25
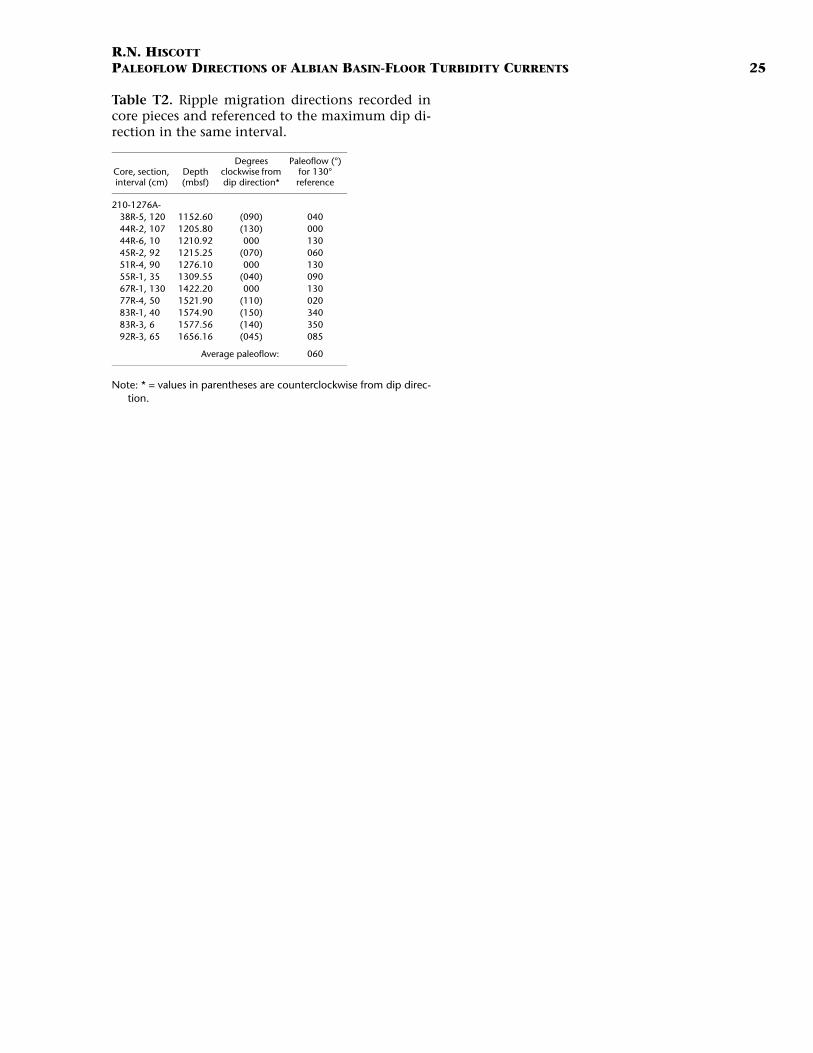
Table T2. Ripple migration directions recorded incore pieces and referenced to the maximum dip di-rection in the same interval.
Note: * = values in parentheses are counterclockwise from dip direc-tion.
Core, section, interval (cm)
Depth (mbsf)
Degrees clockwise from dip direction*
Paleoflow (°) for 130° reference
210-1276A-38R-5, 120 1152.60 (090) 04044R-2, 107 1205.80 (130) 00044R-6, 10 1210.92 000 13045R-2, 92 1215.25 (070) 06051R-4, 90 1276.10 000 13055R-1, 35 1309.55 (040) 09067R-1, 130 1422.20 000 13077R-4, 50 1521.90 (110) 02083R-1, 40 1574.90 (150) 34083R-3, 6 1577.56 (140) 35092R-3, 65 1656.16 (045) 085
Average paleoflow: 060

R.N. HISCOTTPALEOFLOW DIRECTIONS OF ALBIAN BASIN-FLOOR TURBIDITY CURRENTS 26
Table T3. Summary statistics for grain fabric mea-sured in 16 thin sections cut parallel with planarlaminae of Tb divisions of turbidites.
Notes: υ = vector mean. L = vector magnitude. SL = significancelevel. Vector means are based on a 130° reference direction andare presented as angles in the range 0°–179°. Nonsignificantvector means are in parentheses.
Core, section, interval (cm)
Depth (mbsf)
υ (°)
L (%)
SL less than this value
210-1276A-55R-1, 73–77 1309.93 (125) 11.23 0.20067R-1, 70–74 1421.60 (029) 6.34 1.00067R-5, 120–125 1428.10 (171) 3.96 1.00068R-3, 53–57 1434.03 162 16.92 0.00579R-2, 95–99 1538.65 157 34.06 0.00582R-1, 50–54 1565.50 083 22.88 0.00583R-2, 53–56 1576.53 029 18.24 0.00584R-1, 111–115 1585.31 175 16.20 0.01085R-4, 103–107 1592.48 (129) 7.82 0.20087R-3, 120–125 1608.74 036 13.84 0.02589R-4, 122–127 1628.53 178 22.58 0.00589R-6, 137–141 1631.51 053 28.17 0.00590R-5, 68–71 1641.45 (071) 6.23 1.00092R-3, 37–42 1655.87 066 43.17 0.00594R-3, 69–73 1675.34 109 25.66 0.00596R-1, 89–93 1691.79 136 22.74 0.005

R.N. HISCOTTPALEOFLOW DIRECTIONS OF ALBIAN BASIN-FLOOR TURBIDITY CURRENTS 27
Table T4. Summary statistics for grain fabric mea-sured in 11 sections cut perpendicular to planarlaminae of Tb divisions of turbidites.
Notes: υ = vector mean. L = vector magnitude. SL = significancelevel. Vector means are based on a 130° reference direction andare presented as angles in the range 0°–179°. Nonsignificantvector means (<8° or >172°) are in parentheses. Flow directionsare relative to true north, based on a 130° reference direction.
Core, section, interval (cm)
Depth (mbsf)
υ (°)
L (%)
SL less than this value
Decision on flow direction
(°)
210-1276A-68R-3, 53–57 1434.03 172 55.24 0.005 33279R-2, 95–99 1538.65 010 66.06 0.005 33782R-1, 50–54 1565.50 (002) 81.89 0.005 083 or 26383R-2, 53–56 1576.53 (005) 76.46 0.005 029 or 20984R-1, 111–115 1585.31 (178) 77.80 0.005 175 or 35587R-3, 120–125 1608.74 019 63.88 0.005 03689R-4, 122–127 1628.53 008 68.90 0.005 35889R-6, 137–141 1631.51 (178) 61.67 0.005 053 or 23392R-3, 37–42 1655.87 (173) 76.78 0.005 066 or 24694R-3, 69–73 1675.34 008 44.92 0.005 28996R-1, 89–93 1691.79 (005) 63.88 0.005 136 or 316