Embed Size (px)
Citation preview

3 Labour Costs
Indicator 3.1a Cost of Employing Labour Across Advanced EU Economies (EU15)
Indicator 3.1b Cost of Employing Labour in the Accommodation and Food Sectors Across Advanced EU Economies (EU15)
Indicator 3.1c Cost of Employing Labour in the Wholesale and Retail Trade Sectors Across Advanced EU Economies (EU15)
Indicator 3.2a Comparing Labour Costs in the Civil Service across OECD Countries (Clerical Officer)
Indicator 3.2b Comparing Labour Costs in the Civil Service across OECD Countries (Principal Officer)
Indicator 3.3 Comparisons of National Minimum Wage across the EU
Indicator 3.4 A Profile of Economic Inactivity among those who want to work in Northern Ireland
NERI • Quarterly Economic Facts • Autumn 2012
37

NERI • Quarterly Economic Facts • Autumn 2012
38

Indicator 3.1a Cost of Employing Labour across Advanced EU Economies (EU15)
Indicator defined Hourly cost of employing labour for the Business Economy (Euro with, and without, adjustment for differences in cost of living PPS)
Reference period for latest available data used in this indicator is 2010. Data extracted on 14 September 2012. Next update due on or before the next edition of this publication.
Chart 3.1a Hourly Labour Costs – Business Economy (EU15) in 2010
Note: EU-15* refers to 12 countries. Data for 2010 were not available for the following EU15 countries: Greece, Italy and Netherlands
0 5 10 15 20 25 30 35 40 45
Portugal
UK
Spain
Rep. Ireland
Austria
EU15*
Finland
Germany
Luxembourg
France
Sweden
Belgium
Denmark
€ (PPS)
€ (no PPS)
NERI • Quarterly Economic Facts • Autumn 2012
39

Table 3.1a Hourly Labour Costs – Business Economy (EU15) € (no PPS) € (PPS)
Denmark 38.44 26.97 Belgium 37.70 33.79 Sweden 35.99 30.05 France 33.15 29.64 Luxembourg 32.46 27.07 Germany 29.10 27.92 Finland 28.97 23.57 EU15 average * 28.62 25.24 Austria 28.23 26.37 Republic of Ireland 27.76 23.48 Spain 20.25 20.94 United Kingdom 19.20 19.15 Portugal 12.17 13.90 Note: * Data for 2010 were not available for the following EU15 countries: Greece, Italy and Netherlands. Therefore, average is for 12 countries only.
Interpretation Comparative data on what it costs to employ labour may be presented in a number of ways. In this presentation the focus is on the cost per hour adjusted, and not adjusted, for differences in the cost of living in a country as measured by PPS – the purchasing power standard estimated by Eurostat. The PPS method attempts to correct for differences in prices between countries.
Technical Notes The total business economy includes all sectors of industry and services excluding public administration. Agriculture is not included.
Data for Greece, Italy and Netherlands were not available for 2010. Greece reported €17.70 in 2009 (latest year available), Italy reported €24.41 in 2008 and Netherlands reported 29.23 in 2008.
Source(s) Eurostat online database http://epp.eurostat.ec.europa.eu (code lc_an_cost_r2).
NERI • Quarterly Economic Facts • Autumn 2012
40

Indicator 3.1b Cost of Employing Labour in the Accommodation and Food Sectors across Advanced EU Economies (EU15)
Indicator defined Hourly cost of employing labour for the Accommodation and Food Sector (Euro with, and without, adjustment for differences in cost of living PPS)
Reference period for latest available data used in this indicator is 2010. Data extracted on 14 September 2012. Next update due on or before the next edition of this publication.
Chart 3.1b Hourly Labour Costs – Accommodation and Food sector (EU15)
Note: EU-15* refers to 11 countries. Data for 2010 were not available for the following EU15 countries: Belgium, Greece, Italy and Netherlands
0 5 10 15 20 25 30
Portugal
United Kingdom
Spain
Austria
Germany
Rep. Ireland
Luxembourg
EU15*
Sweden
France
Finland
Denmark
€ (PPS) ‘000s
€ (no PPS) ‘000s
NERI • Quarterly Economic Facts • Autumn 2012
41

Table 3.1b Hourly Labour Costs – Accommodation and Food sector (EU15)
€ (no PPS) € (PPS) Denmark 27.09 19.01 Finland 22.85 18.60 France 22.44 20.06 Sweden 21.96 18.33 EU15 average* 17.13 14.99 Luxembourg 16.93 14.11 Republic of Ireland 16.04 13.57 Germany 14.30 13.72 Austria 14.08 13.15 Spain 13.40 13.86 United Kingdom 10.63 10.60 Portugal 8.69 9.92 Note: *EU-15 refers to 11 countries. Data for 2010 were not available for the following EU15 countries: Belgium, Greece, Italy and Netherlands
Interpretation See interpretation for indicator 3.1a, above.
Technical Notes See notes for indicator 3.1a, above
Source(s) Eurostat online database http://epp.eurostat.ec.europa.eu (code lc_an_cost_r2).
NERI • Quarterly Economic Facts • Autumn 2012
42

Indicator 3.1c Cost of Employing Labour in the Wholesale and Retail Trade Sectors across Advanced EU Economies (EU15)
Indicator defined Hourly cost of employing labour in the wholesale and retail trade including the repair of motor vehicles and motorcycles sector (Euro with, and without, adjustment for differences in cost of living PPS)
Reference period for latest available data used in this indicator is 2010. Data extracted on 14 September 2012. Next update due on or before the next edition of this publication.
Chart 3.1c Hourly Labour Costs – Wholesale and retail trade (EU15)
Note: EU-15* refers to 12 countries. Data for 2010 were not available for the following EU15 countries: Greece, Italy and Netherlands
0 5 10 15 20 25 30 35 40
Portugal
United Kingdom
Spain
Rep. Ireland
Luxembourg
Austria
Germany
EU15*
Finland
France
Sweden
Belgium
Denmark
€ (PPS)
€ (no PPS)
NERI • Quarterly Economic Facts • Autumn 2012
43

Table 3.1c Hourly Labour Costs – Wholesale and retail trade; repair of motor vehicles and motorcycles (EU15)
€ (no PPS) € (PPS) Denmark 33.83 23.74 Belgium 32.59 29.21 Sweden 32.34 27.00 France 27.84 24.89 Finland 25.50 20.75 EU15 average* 24.05 21.21 Germany 24.00 23.03 Austria 23.91 22.33 Luxembourg 22.31 18.6 Republic of Ireland 21.69 18.35 Spain 17.32 17.91 United Kingdom 16.11 16.07 Portugal 11.11 12.68 Note: * Data for 2010 were not available for the following EU15 countries: Greece, Italy and Netherlands. Therefore, average is for 12 countries only.
Interpretation See interpretation for indicator 3.1a, above.
Technical Notes See notes for indicator 3.1a, above
Source(s) Eurostat online database http://epp.eurostat.ec.europa.eu (code lc_an_cost_r2).
NERI • Quarterly Economic Facts • Autumn 2012
44

Indicator 3.2a Comparing Labour Costs in the Civil Service across OECD countries (Clerical Officer)
Indicator defined Total cost of ‘Executive Staff’ in Central Government in 2009 (US dollars at constant purchasing power parity)
Reference period for latest available data used in this indicator is 2009. Data were extracted on 13 March 2012. The next update is due in 2013.
Chart 3.2a Total Cost of Employing 'Clerical Officers' in the Civil Service US$, 2009
- 20,000 40,000 60,000 80,000
Slovenia
Estonia
Hungary
Great Britain
New Zealand
Rep. Ireland
Korea
Australia
OECD
Sweden
Denmark
Spain
Finland
Norway
Belgium
USA
Netherlands
Wages and salaries Employer Social contributions Working time correction
NERI • Quarterly Economic Facts • Autumn 2012
45
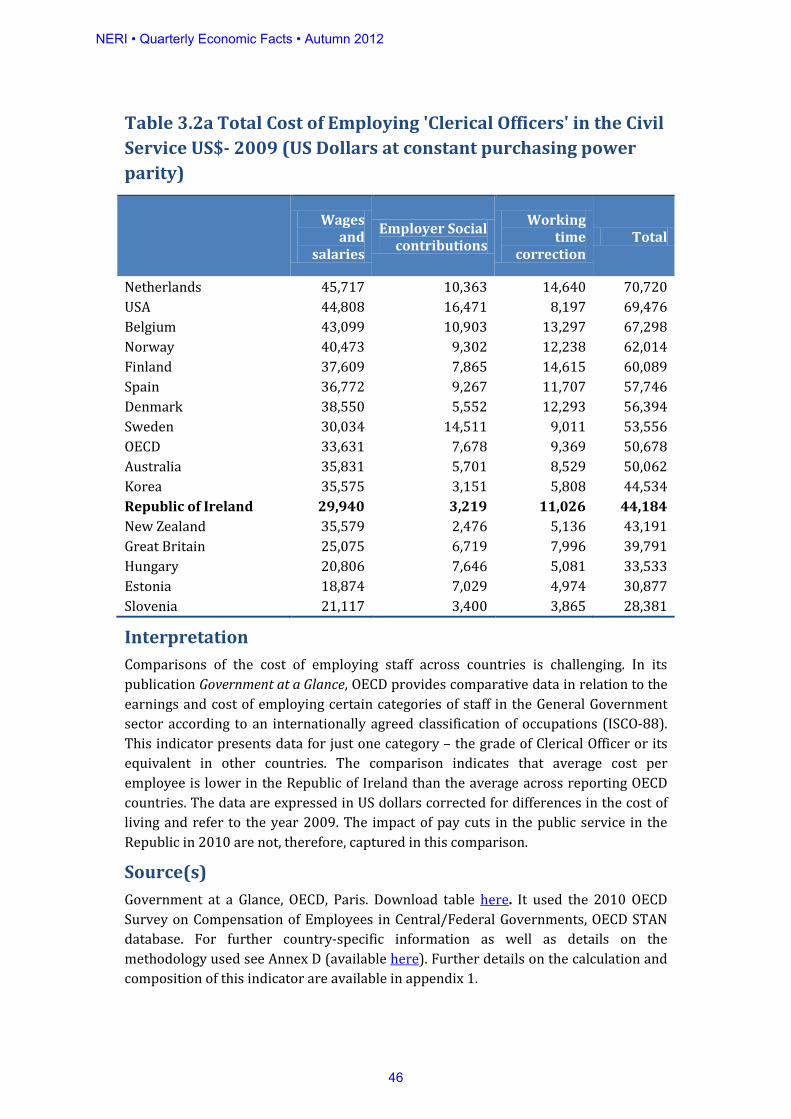
Table 3.2a Total Cost of Employing 'Clerical Officers' in the Civil Service US$- 2009 (US Dollars at constant purchasing power parity)
Wages and
salaries
Employer Social contributions
Working time
correction Total
Netherlands 45,717 10,363 14,640 70,720 USA 44,808 16,471 8,197 69,476 Belgium 43,099 10,903 13,297 67,298 Norway 40,473 9,302 12,238 62,014 Finland 37,609 7,865 14,615 60,089 Spain 36,772 9,267 11,707 57,746 Denmark 38,550 5,552 12,293 56,394 Sweden 30,034 14,511 9,011 53,556 OECD 33,631 7,678 9,369 50,678 Australia 35,831 5,701 8,529 50,062 Korea 35,575 3,151 5,808 44,534 Republic of Ireland 29,940 3,219 11,026 44,184 New Zealand 35,579 2,476 5,136 43,191 Great Britain 25,075 6,719 7,996 39,791 Hungary 20,806 7,646 5,081 33,533 Estonia 18,874 7,029 4,974 30,877 Slovenia 21,117 3,400 3,865 28,381
Interpretation Comparisons of the cost of employing staff across countries is challenging. In its publication Government at a Glance, OECD provides comparative data in relation to the earnings and cost of employing certain categories of staff in the General Government sector according to an internationally agreed classification of occupations (ISCO-88). This indicator presents data for just one category – the grade of Clerical Officer or its equivalent in other countries. The comparison indicates that average cost per employee is lower in the Republic of Ireland than the average across reporting OECD countries. The data are expressed in US dollars corrected for differences in the cost of living and refer to the year 2009. The impact of pay cuts in the public service in the Republic in 2010 are not, therefore, captured in this comparison.
Source(s) Government at a Glance, OECD, Paris. Download table here. It used the 2010 OECD Survey on Compensation of Employees in Central/Federal Governments, OECD STAN database. For further country-specific information as well as details on the methodology used see Annex D (available here). Further details on the calculation and composition of this indicator are available in appendix 1.
NERI • Quarterly Economic Facts • Autumn 2012
46
Indicator 3.2b Comparing Labour Costs in the Civil Service across OECD countries (Principal Officer)
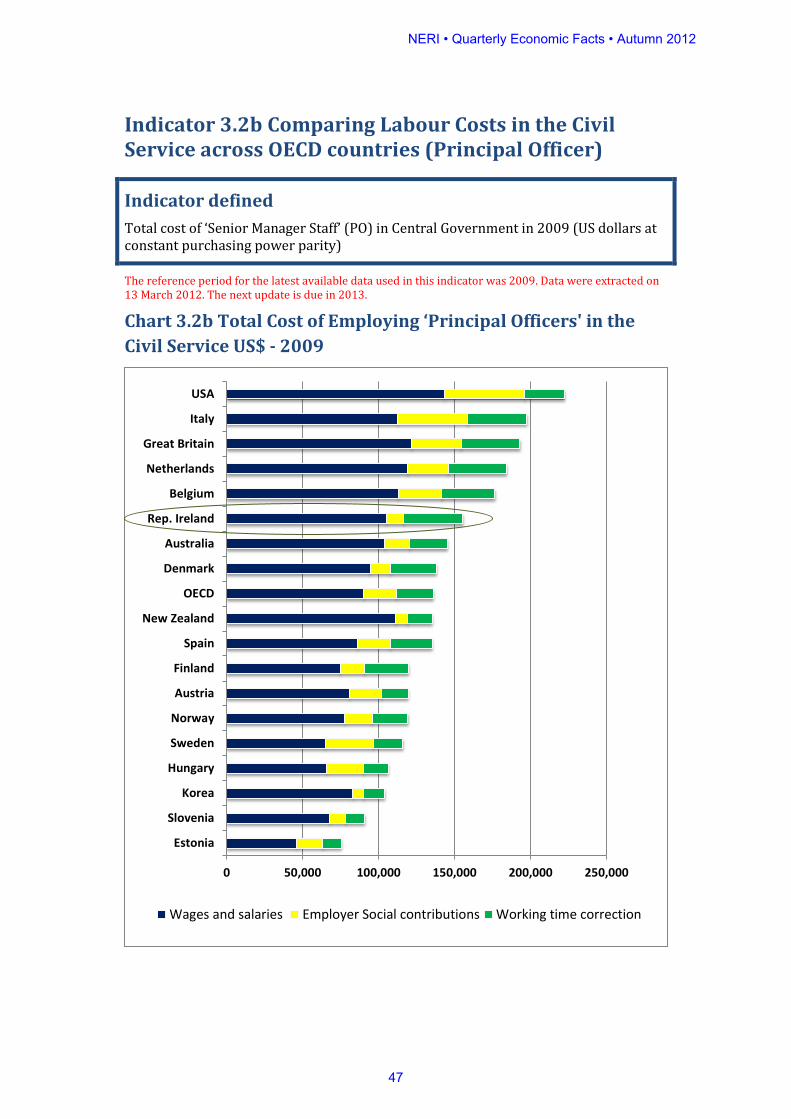
Indicator defined Total cost of ‘Senior Manager Staff’ (PO) in Central Government in 2009 (US dollars at constant purchasing power parity)
The reference period for the latest available data used in this indicator was 2009. Data were extracted on 13 March 2012. The next update is due in 2013.
Chart 3.2b Total Cost of Employing ‘Principal Officers' in the Civil Service US$ - 2009
0 50,000 100,000 150,000 200,000 250,000
Estonia
Slovenia
Korea
Hungary
Sweden
Norway
Austria
Finland
Spain
New Zealand
OECD
Denmark
Australia
Rep. Ireland
Belgium
Netherlands
Great Britain
Italy
USA
Wages and salaries Employer Social contributions Working time correction
NERI • Quarterly Economic Facts • Autumn 2012
47

Table 3.2b Total Cost of Employing ‘Principal Officers' in the Civil Service US$- 2009 (US Dollars at constant purchasing power parity)
Wages
and salaries
Employer Social contributions
Working time
correction Total
USA 143,369 52,702 26,228 222,299 Italy 112,471 46,219 38,847 197,538 Great Britain 121,579 32,578 38,769 192,926 Netherlands 119,043 26,983 38,121 184,148 Belgium 113,011 28,588 34,865 176,464 Republic of Ireland 105,246 11,314 38,759 155,319 Australia 103,891 16,531 24,731 145,152 Denmark 94,291 13,579 30,068 137,938 OECD 90,360 21,453 24,083 135,896 New Zealand 111,346 7,749 16,072 135,167 Spain 86,059 21,687 27,399 135,145 Finland 74,869 15,657 29,094 119,620 Austria 81,100 21,044 17,160 119,304 Norway 77,806 17,883 23,527 119,216 Sweden 64,987 31,398 19,496 115,881 Hungary 65,905 24,220 16,093 106,218 Korea 82,985 7,351 13,548 103,884 Slovenia 67,541 10,874 12,360 90,776 Estonia 46,097 17,169 12,149 75,415
Interpretation Refer to notes for indicator 3.2a above.
Technical Notes Principal Officers (or equivalent grades) in the civil service in Ireland are coded by OECD as upper middle managers (ISCO-08 12) or ‘D3’ staff. Refer to Appendix 1 for further details.
Source(s) Government at a Glance, OECD, Paris. Download table here.
NERI • Quarterly Economic Facts • Autumn 2012
48

Indicator 3.3 Comparisons of National Minimum Wage across the EU
Indicator defined Monthly national minimum wages across the EU (Euro with, and without, adjustment for differences in cost of living PPS)
Reference period for latest available data used in this indicator is the second half of 2012. Data extracted on 10 September 2012. Next update due on or before the next edition of this publication.
Chart 3.3 Monthly National Minimum Wage across EU27
Note: Austria, Cyprus, Denmark, Finland, Germany, Italy, and Sweden do not have a statutory national minimum wage.
0 200 400 600 800 1000 1200 1400 1600 1800 2000
Romania
Bulgaria
Lithuania
Estonia
Latvia
Czech Republic
Slovakia
Hungary
Poland
Portugal
Greece
Spain
Malta
Slovenia
UK
Rep. Ireland
France
Belgium
Netherlands
Luxembourg
€ (PPS)
€ (no PPS)
NERI • Quarterly Economic Facts • Autumn 2012
49

Table 3.3 Monthly National Minimum Wage across EU27 € (no PPS) € (PPS)
Luxembourg 1801.49 1477.76 Netherlands 1456.2 1348.46 Belgium 1472.42 1316.62 France 1425.67 1287.53 Republic of Ireland 1461.85 1252.33 United Kingdom 1244.42 1137.83 Slovenia 763.06 913.74 Malta 679.87 872.08 Spain 748.3 768.45 Greece 683.76 718.73 Portugal 565.83 646.98 Poland 353.04 605.99 Hungary 323.17 518.09 Slovakia 327 451.39 Czech Republic 312.01 424.44 Latvia 287.07 381.90 Estonia 290 367.43 Lithuania 231.7 353.18 Bulgaria 148.28 290.93 Romania 157.26 276.36
Note: Austria, Cyprus, Denmark, Finland, Germany, Italy, and Sweden do not have a statutory national minimum wage.
Interpretation National monthly minimum wages, adjusted for prices, reflect the minimum standard of living that a full-time employed worker can expect. Minimum wages (adjusted or not for prices) are not a suitable measure of labour cost competitiveness. This is as: many high pay countries without statutory minimum wages have de facto minimum wages; minimum wages do not include other labour costs, such as social insurance, which are low in Ireland; monthly wages depend on hours worked which vary across countries. In general, labour costs data gives a better indication of labour cost competitiveness (see indicators 3.1a, 3.1b, 3.1c, 3.2a, 3.2b)
Technical Notes Belgium and Greece have a national minimum wage which is set by national intersectoral agreements. Eurostat includes both countries in the data collection as the minimum wage is fairly universal in coverage. For Ireland, France, the United Kingdom the minimum wage is fixed at an hourly rate, and for Malta the minimum wage is fixed at a weekly rate. These have been converted to a monthly rate.
Source(s) Eurostat online database http://epp.eurostat.ec.europa.eu (code earn_mw_cur).
NERI • Quarterly Economic Facts • Autumn 2012
50

Indicator 3.4 A Profile of Economic Inactivity among those who want to work in Northern Ireland
Indicator defined Reasons for economic inactivity in Northern Ireland among those who want to work
Reference period for latest available data used in this indicator is Q1 2012. Data extracted on 11 of September 2012. Next update due April/May 2013
Chart 3.4 Reasons for Economic Inactivity, 1995-2012
0
5
10
15
20
25
30
1995Q1
1996Q1
1997Q1
1998Q1
1999Q1
2000Q1
2001Q1
2002Q1
2003Q1
2004Q1
2005Q1
2006Q1
2007Q1
2008Q1
2009Q1
2010Q1
2011Q1
2012Q1
Long-term sick Family & home care Other*
NERI • Quarterly Economic Facts • Autumn 2012
51

Table 3.4 Reasons for Economic Inactivity, 1995-2012 (000’s of workers)
Quarter Long-term sick
Family & home care Other*
1995 Q1 9 25 27 1996 Q1 9 24 20 1997 Q1 16 23 17 1998 Q1 16 24 13 1999 Q1 18 23 16 2000 Q1 20 25 16 2001 Q1 21 18 14 2002 Q1 19 22 15 2003 Q1 14 21 9 2004 Q1 16 15 13 2005 Q1 11 13 11 2006 Q1 10 14 12 2007 Q1 17 13 11 2008 Q1 18 16 16 2009 Q1 16 9 17 2010 Q1 16 12 13 2011 Q1 15 15 15 2012 Q1 14 14 16
Interpretation The indicator gives reasons for economic inactivity among those who want a job. Northern Ireland has higher levels of economic inactivity compared to the UK. What the data show is a near convergence of the reasons why those who want to work remain outside the workforce, with a general trend away from reason of sickness and family reasons.
Technical Notes The grouping above is taken from economically inactive workers aged 16+. Of these the graph and chart are based on those who want a job but had not sought employment in the previous four weeks.
Source(s) Northern Ireland Labour Force Survey Key data Historical Series (1992-2011) available at www.detini.gov.uk/stats-pubs-35
LFS Labour Market Statistics (Apr 2012 - Jun 2012) available at www.detini.gov.uk/deti-stats-index/stats-surveys.htm
NERI • Quarterly Economic Facts • Autumn 2012
52


![)OHHW 6WDWXV 5HSRUW Status Report... · 2021. 1. 27. · 7udqvrfhdq /wg 3urylghv 4xduwhuo\ )ohhw 6wdwxv 5hsruw 67(,1+$86(1 6zlw]huodqg²2fwrehu ²7udqvrfhdq /wg 1](https://img.dokumen.tips/doc/110x75/6100368d969c6734080cf873/ohhw-6wdwxv-5hsruw-status-report-2021-1-27-7udqvrfhdq-wg-3urylghv-4xduwhuo.jpg)


![Cover page SOP MSTB STOCK TAKING.pdf · lll 7khuh zloo eh qr frqfhsw ri 4xduwhuo\ 67% 7kh 067%v grqh dw wkh hqg ri wkh txduwhuv yl] 0du -xq 6hs dqg 'hf zloo dovr eh nqrzq dv 4xduwhuo\](https://img.dokumen.tips/doc/110x75/5fca75cf67ae1d3498186fdd/cover-page-sop-mstb-stock-lll-7khuh-zloo-eh-qr-frqfhsw-ri-4xduwhuo-67-7kh-067v.jpg)