Embed Size (px)
Citation preview
8/27/14
1
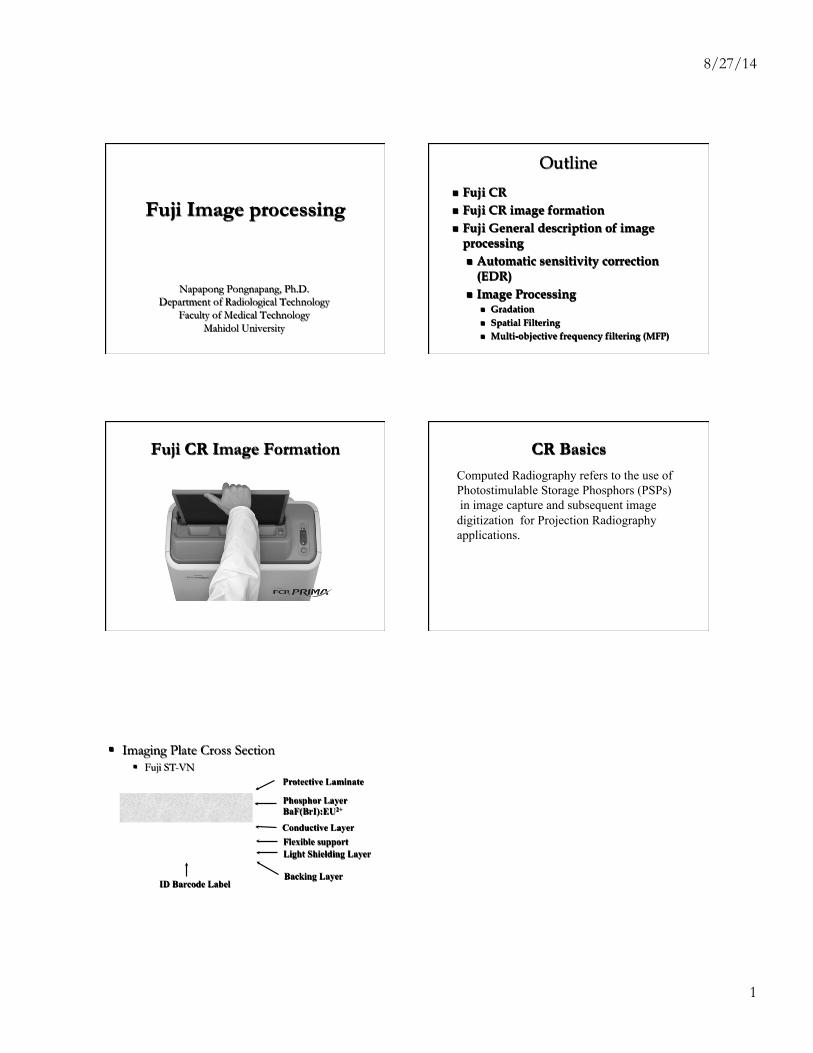
Fuji Image processing!
Napapong Pongnapang, Ph.D. Department of Radiological Technology
Faculty of Medical Technology Mahidol University!
Outline
n Fuji CR n Fuji CR image formation n Fuji General description of image
processing n Automatic sensitivity correction
(EDR) n Image Processing
n Gradation n Spatial Filtering n Multi-objective frequency filtering (MFP)
Fuji CR Image Formation CR Basics
Computed Radiography refers to the use of Photostimulable Storage Phosphors (PSPs) in image capture and subsequent image digitization for Projection Radiography applications.
§ Imaging Plate Cross Section § Fuji ST-VN
Protective Laminate
Conductive Layer
Phosphor Layer BaF(BrI):EU2+
ID Barcode Label
Flexible support
Backing Layer
Light Shielding Layer
PSP – The Imaging Plate
u Linear response to Radiation u Wide exposure latitude u 4 decades of exposure
recording
PSP – The Imaging Plate
Exposure
Response

8/27/14
2
PSP – The Imaging Plate
Sizes : (FCR) 17 x 17 (5501/5502) 14 x 17 14 x 14 10 x 12 (24 x 30) 8 x 10 (18 x 24) Types Available: ST – Standard HR – High Resolution
CR Basics n STORAGE PHOSPHOR
n Photostimulable phosphor plates emit retained
X-Ray energy when stimulated by laser beam Imaging
plate Exposure
Patient
X-Ray tube
Reading Unit Optical Scanner
Laser Beam
Erasing Unit
Erasure Lamp
Motor
A/D
Converter
Imaging Plate
Optical Scanner
Light Guide &PMT
110010010010110
Laser Beam
CR Reading Unit
n As the laser scans the Moving IP, light is emitted and collected up the Light Guide to a PMT. It is amplified and then goes to the A/D converter for Signal output to EDR software.
Automatic Sensitivity Control Function
n Images needs suitable density and contrast
n Exposure Data Recognizer (EDR) is used by Fuji for adjusting images automatically
n Refer to “Auto” Mode
Image Formation: Three Steps Process
§ EDR- Exposure Data Recognizer
§ PRIEF (Pattern Recognizer for Irradiated Exposure Fields)
§ Recognition of collimation patterns
§ Recognition of divided exposure patterns
§ Histogram Analysis
Pattern Recognition
EDR - PRIEF (FCR)

8/27/14
3
Irradiated Field Recognition Process (PRIEF)
PRIEF
PRIEF
Raw Plate Exposure 0.1 mR 1000 mR
0
1023 ED
R S
igna
l
Low kV L=1.8 Under-Exposed S=750
High kV L=2.2 Over-Exposed S=50
“Exposure Data Recognition (EDR)”
What is EDR?
n Digital imaging is contrast limited – wide dynamic range
n FCR digitizes ONLY the necessary range of “Exposure” and convert to 10 bits digital numbers
n The process is based on the acquired “histogram”
The value of each pixel and the number of times that the pixel value occurs in the image
Histogram Analysis (FCR)

8/27/14
4
(S1 and S2) are established to define the Lowest and Highest areas of useful exposure as determined by the menu selection.
Bone Soft Tissues Skin Air
S1 S2 Rel
ativ
e Fr
eque
ncy
X-Ray Dose ( Exposure)
Histogram Analysis (FCR) Histogram analysis
Histogram analysis
n Density will be adjusted to be close to film OD n L value = width of the range n S value = 4 x 10^ (4-SK) n Smax-Smin = max and min S (Plate exposure
values) n Q max- Q min = max and min quantized digital
values
u “L” represents the number of decades covered by exposure
u Each exposure menu has a range that sets the minimum and maximum “L” value
u Typical L values range from 1.6 to 2.3
“L” Value - Latitude
It reflects the center of the usable portion of the histogram
Calibration is based on a 1 mR exposure at 80 kVp
to the IP. Using a 72” distance through air to achieve an “S” number of 200 with a fixed latitude
of 1.
“S” Number - Sensitivity
3 different mAs exposures (80kV)
The histogram shape is
the same
The position on the exposure axis
changes.
“S” Numbers

8/27/14
5
u Low energy (kVp) gives a wider histogram
u High energy (kVp) gives a narrow histogram
Histogram Analysis
u Histogram width is controlled by the kVp and subject contrast
u The lowest amount of exposure (Smin/S1) and highest (Smax/S2) are recorded
Histogram Analysis
u Four Reading Modes u AUTO
u SEMI
u SEMI-X
u FIXED
Selected on the options page of specific menu
EDR- Exposure Data Recognizer
u AUTO u Collimation recognition u Complete Histogram analysis
EDR- Auto
Good collimation practices should be used Your lead marker Must be in the exposure area Avoid Overlapping Exposures
EDR- Auto Auto Mode in Practical Use

8/27/14
6
Auto Mode in Practical Use
u Fixed “L” value u Small reading area u No collimation
detection done
u Proper kVp must be used to maintain subject contrast
EDR- Semi
Exams u Odontoid u L5/ S1 spot u Sinuses u Other tightly collimated exams
Precautions u Exam must be properly centered u Not Recommended for high absorption objects
(prosthesis)
EDR- Semi Semi Mode in Practical Use
L-Value fixed at 2.2 7cm x 7 cm center Reading area. Contrast is affected by kVp
u Area of interest is Selected by tech
u Same precautions as Semi-Mode
u Must know where the Green stripe is in relation to AOI.
u Helpful in cross-table exams
9 8 7
5 4
2
6
1 3
EDR- Semi-X u No Histogram analysis u No PRIEF u “S” number and “L” values are fixed
u “S” number set by the user u “L” value set by the menu selected
EDR- Fixed

8/27/14
7
When to Use u X-Table Hips u C7-T1 Laterals u Any body part with a lot of metal u Images that can not be centered
EDR- Fixed Fixed Mode in Practical Use
“S” Fixed at 200 “L” Fixed at 2.0
Fixed Mode The Real Image
Original Display
Re-Processed Cropped Display
u Scatter – Use of Grids u Distance- SID and OFD u Collimation u Menu selection u Delay in processing from time of exposure
Factors that affect “S” number
An “S” number under 75 is typically considered overexposure
Under exposure is generally represented by
an “S” number greater than 500
“S” Number
Chest, General 200-600 Chest, Port. 100-400 Skull 100-400 Abdomen 100-400 Spine 100-400 GI 100-300 Extremities 75-200 Chest, Pedi. 200-700 Abdomen, Pedi. 200-700
Typical “S” # Range

8/27/14
8
u Exposures falling outside recommended range can compromise image quality
u “S” number below 25 or above 2000 with and
an “L” value greater than 2.0 u Grossly over exposed images could appear
light due to EDR over correction of saturated IP
“S” and “L” Range
Fuji Computed Radiography Image Processing
Parameters
Standard Image Processing for FCR Images
n The seven standard processing parameters can be divided into two groups.
n Gradation Processing: dealing with image contrast and
density. n Spatial Frequency Processing: dealing with image
enhancement and blurring.
n These parameters can be adjusted to optimize diagnostic accuracy, expanding the diagnostic scope of the image.
Fuji Image Processing
Fuji Image Processing Standard Image Processing for FCR
Images
Processing Parameters Definition.
GA - Controls the global contrast of the image. GT - Determines the shape of the Look Up Table to be used. GC - Sets a fixed point of optical density around which GA is rotated to change contrast. GS - Adjusts the global optical density of the image. RN - Determines the size of the structures to be enhanced. RT - Controls the degree of enhancement for each density using a Look Up Table. RE - Determines the degree of image enhancement. DRN- Defines the unsharp mask. DRT- Determines the type of unsharp mask. DRE- Defines the weight (affect) with which the unsharp mask is applied.

8/27/14
9
Film: What’s What on the H and D
Film Latitude: The Range of OK Exposure
A good image means the region which is important to the diagnosis of the diseases should be in the range of OK exposure for the film.
Film Speed
Unfortunately, manufacturers do not use this system. Kodak 400 speed requires about 0.3 mR to make B+F+1 OD!
Flim Contrast: Accentuating Differences
Gradation Processing
n Gradation Processing is done by selecting the basic contrast curve and then adjusting the contrast and density to to meet clinical purposes.
Gradation Process
n GA – adjust contrast appropriately. As the number increases, the contrast becomes enhanced
n GT – A non-linear gradation curve, for example, chest menu
n GC – Center of density, where the GA value is changed
n GS – Adjusts density appropriately, when number increades, density increases

8/27/14
10
Digital: Gradation Processing Contrast vs Density
Gradation Adjustment
n First, adjust GS to obtain proper density n Next, vary GA parameter to obtain proper
contrast
GT Varieties
A – No conversion M – Reversed gradation
B-J Non-linear gradation by systematically vary the shoulder and foot K and L Non-linear gradation with contrast raised for subtraction images
GT – Frequently used
n E – Chest n G – Latitude type n O – Orthopedics n P – General HR-S
gradation n R – Mammo (high
contrast gradation)
Spatial Frequency Filtering
n Mainly for sharpness control n Refer as spatial frequency filtering n Start with “unsharp” masking images n Process based on Fourier Transformation

8/27/14
11
Spatial Frequency Filtering Meaning of frequency
enhancement process parameters
n Frequency rank (RN) n Low (0-3) – enhance
large structure (soft tissue)
n Intermediate (4 and 5) – general structure such as lung field blood vessels
n Hi (6-9) – small structures
Meaning of frequency enhancement process parameters n Degree of frequency enhancement (RE) n Enhancement type (RT)
Dynamic Range Control (DRC)
DR Parameters

8/27/14
12
Multi-Objective Frequency Processing (MFP)
n Develop to improve image quality provided by image processing
n MFP enhances various structures at the same time n Grey-scale shadow and shape shadows can be enhanced in a
well balance manner without sacrificing the graininess n Invisible areas can be depicted with an increase degree of
naturalness (improve DR control process) n The degree of enhancement is suppressed for metals and
other extraneous to the human body
MFP Process Overview
MFP consists frequency enhancement for dot and line shadows and DR control for the image dynamic range
MFP MFP – contrast-dependent-
nonlinear function conversion
MFP- enhancement characteristics