Embed Size (px)
Citation preview

49
3 Demand Forecasts
This section documents Umgeni Water’s water demand forecast review that was completed in September 2012. The review process:
Reviewed the figures for the financial year ending in June 2012 (2011/2012).
Assessed and revised the short-term forecast for the financial year ending in June 2013 (2012/2013);
Compiled short-term forecasts for the financial years ending in June 2014 (2013/2014), June 2015 (2014/2015) and June 2016 (2015/2016); and
Extended these short-term forecasts to a long-term forecast (30-year forecast) to the end of June 2043 (2042/2043).
All data presented has been updated to include the November 2012 sales figures and all statistics and trends have been based on the moving annual average and year-on-year growth figures as determined at 30 November 2012.
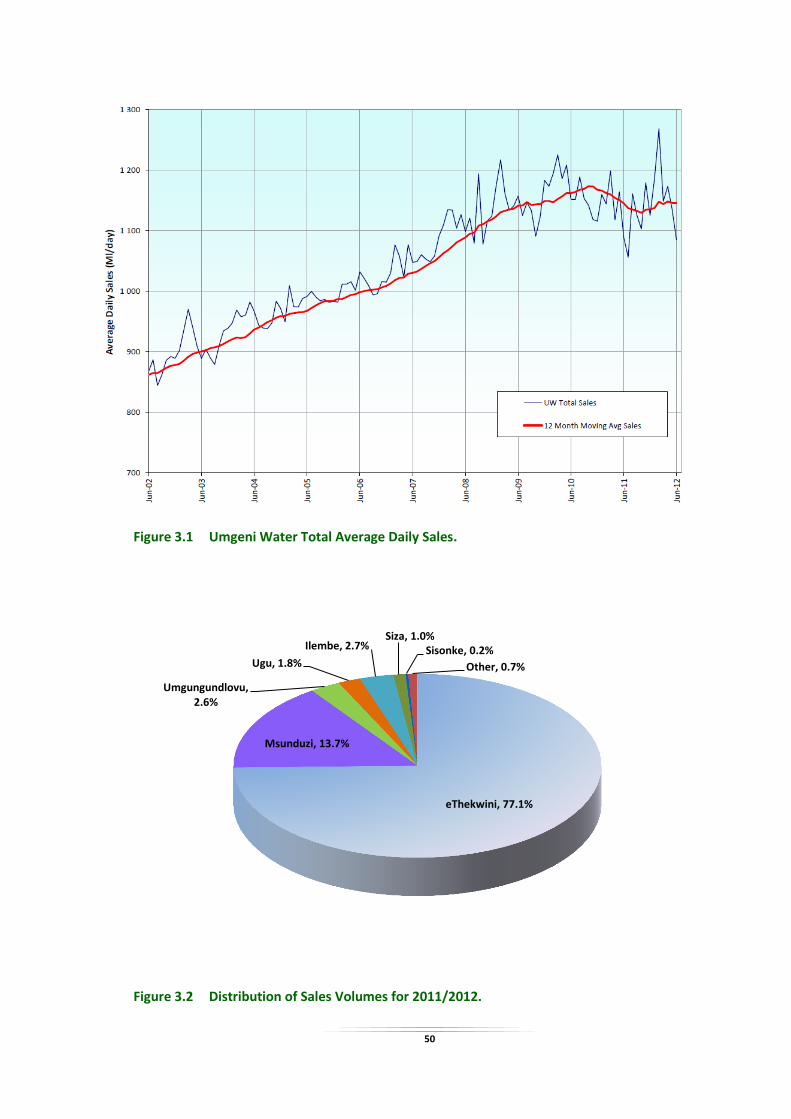
3.1 Review of 2011/12 Sales The initial forecasted water sales value for the financial year ending in June 2012 (2011/12), as determined in September 2010, was 1 146 Ml/day. In September 2011 this figure was further revised down to 1 127 Ml/day after updated discussions with customers. Total sales recorded for the 2011/12 financial year averaged 1 135 Ml/day (414 200 Ml). This was higher than the September 2011 projection but lower than the September 2010 projection. Total average water sales for the 2010/11 financial year was 1 129 Ml/day (412 200 Ml), and hence the 2011/12 sales are 0.5% year-on-year higher than the 2010/11 financial year. This can be compared to the 3.2% negative growth that was realized in the previous financial year. The positive growth over the 2011/2012 period shows a recovery against the negative growth experienced previously and as a result of eThekwini Metro’s Water Demand Management Initiatives. In June 2007 the annual sales amounted to 373 850 Ml and hence, even though there was a substantial reduction in sales in 2010/2011, there is still a positive growth of 2.1% per annum over the last five years. This five year average annual positive growth rate is, however, down from the five year average growth rate of 2.7% calculated in 2011. Figure 3.1 shows the 12-month moving average of Umgeni Water’s total average daily water sales for the past 10 years. Bulk water sales to eThekwini Municipality constituted by far the largest percentage (77.1%) of Umgeni Water’s total water sales for 2011/12. Their proportion of the total sales has increased from 75.3% in the previous year, due primarily to higher water purchases from the municipality. The Msunduzi Municipality is Umgeni Water’s second largest customer, accounting for 13.7% of the organisation’s total sales. The remaining customers make up the balance of the sales. Figure 3.2 illustrates the average daily sales volume distribution per customer for the financial year 2011/12.
50
Figure 3.1 Umgeni Water Total Average Daily Sales.
Figure 3.2 Distribution of Sales Volumes for 2011/2012.
eThekwini, 77.1%
Msunduzi, 13.7%
Umgungundlovu, 2.6%
Ugu, 1.8%
Ilembe, 2.7% Siza, 1.0%
Sisonke, 0.2%
Other, 0.7%
51
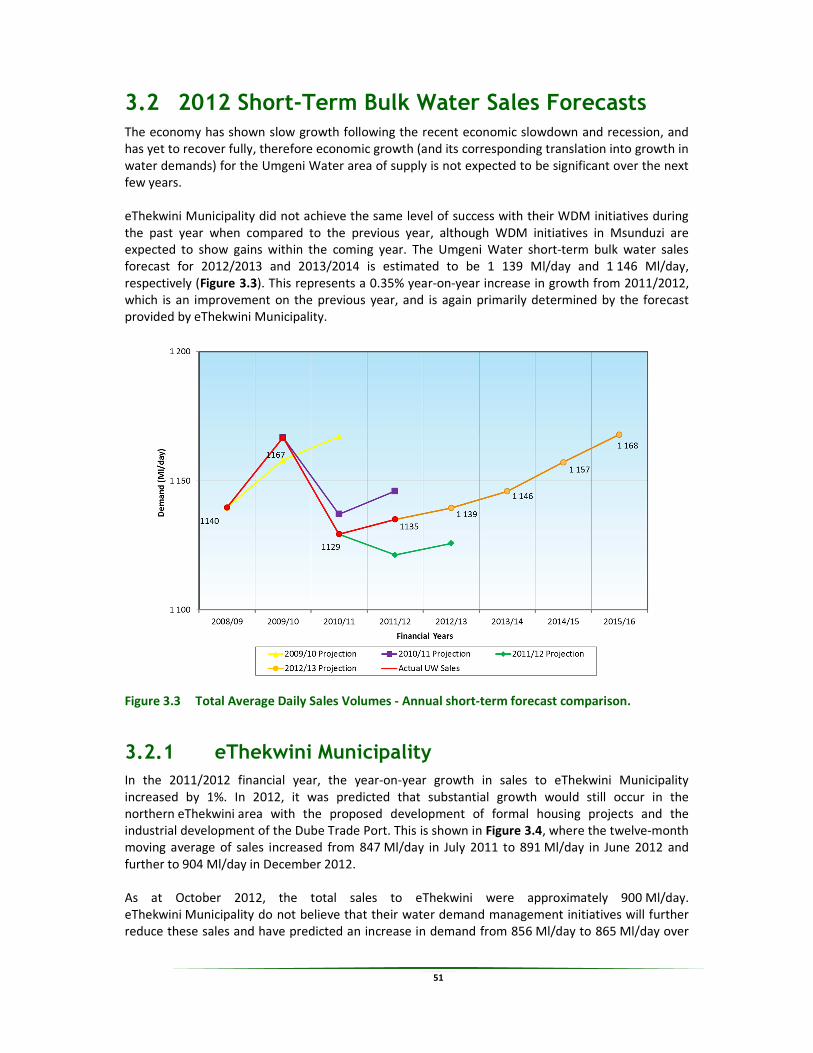
3.2 2012 Short-Term Bulk Water Sales Forecasts The economy has shown slow growth following the recent economic slowdown and recession, and
has yet to recover fully, therefore economic growth (and its corresponding translation into growth in
water demands) for the Umgeni Water area of supply is not expected to be significant over the next
few years.
eThekwini Municipality did not achieve the same level of success with their WDM initiatives during
the past year when compared to the previous year, although WDM initiatives in Msunduzi are
expected to show gains within the coming year. The Umgeni Water short-term bulk water sales
forecast for 2012/2013 and 2013/2014 is estimated to be 1 139 Ml/day and 1 146 Ml/day,
respectively (Figure 3.3). This represents a 0.35% year-on-year increase in growth from 2011/2012,
which is an improvement on the previous year, and is again primarily determined by the forecast
provided by eThekwini Municipality.
Figure 3.3 Total Average Daily Sales Volumes - Annual short-term forecast comparison.
3.2.1 eThekwini Municipality
In the 2011/2012 financial year, the year-on-year growth in sales to eThekwini Municipality
increased by 1%. In 2012, it was predicted that substantial growth would still occur in the
northern eThekwini area with the proposed development of formal housing projects and the
industrial development of the Dube Trade Port. This is shown in Figure 3.4, where the twelve-month
moving average of sales increased from 847 Ml/day in July 2011 to 891 Ml/day in June 2012 and
further to 904 Ml/day in December 2012.
As at October 2012, the total sales to eThekwini were approximately 900 Ml/day.
eThekwini Municipality do not believe that their water demand management initiatives will further
reduce these sales and have predicted an increase in demand from 856 Ml/day to 865 Ml/day over

52
the 2012/2013 financial year and to 874 Ml/day in 2013/2014. The historical sales and future demand projection for eThekwini Municipality are presented in Figure 3.4. eThekwini Municipality have predicted an increased demand from the Hazelmere WTP, due to proposed development on the KwaZulu-Natal North Coast. If possible, this demand will be shifted to the Durban Heights WTP. This load shift will occur via the eThekwini Northern Aqueduct and the Hazelmere to Verulam Pipeline.
Figure 3.4 eThekwini Municipality Total Volumes - Annual short-term forecast.
3.2.2 The Msunduzi Municipality
The water sales to Msunduzi Municipality increased by 2.3% from 174 Ml/day in the 2010/2011 financial year to 178 Ml/day in 2011/2012. This is consistent with the rate of natural organic growth within an urban environment.
The projected demands for 2012/2013 were determined in consultation with the municipality and it was agreed that the demand will increase at a rate of 1% for the short term forecast. The following significant factors influenced this short term forecast:
There are no significant developments (housing, commercial and industrial) that will result in a steeper increase.
Reductions due to water demand management are not expected to be reflected in the projections for this period.
The projection for Msunduzi Municipality is reflected in Figure 3.5

53
3.2.3 Umgungundlovu District Municipality
The projected demands for 2012/2013 were determined in consultation with the municipality and it was agreed that the demand would increase at a rate of 2% for the short term forecast. The following significant factors influenced this short term forecast:
Gradual implementation of the Greater Eston Bulk Water Supply Scheme
Phase 1 of the Khayelisha housing development which consists of 500 units.
Expected commercial and industrial growth in Camperdown. The projection for Umgungundlovu District Municipality is reflected in Figure 3.6.
Figure 3.5 Msunduzi Municipality Total Sales Volumes - Annual short-term forecast.

54
Figure 3.6 reflects a spike in demand since July 2012. This is due to a rationalisation of meters that came into effect from July 2012 (Section 5.2.1), which effected an increased demand to Umgungundlovu District Municipality from reticulation sales.
3.2.4 Ilembe District Municipality (including Sembcorp Siza Water)
Sales to Ilembe District Municipality can be described as follows:
Sales to the Coastal Area of Ilembe through Sembcorp Siza Water.
Sales to the Coastal Area of Ilembe through Ilembe District Municipality.
Sales to Ilembe District Municipality through schemes owned by the municipality and managed by Umgeni Water.
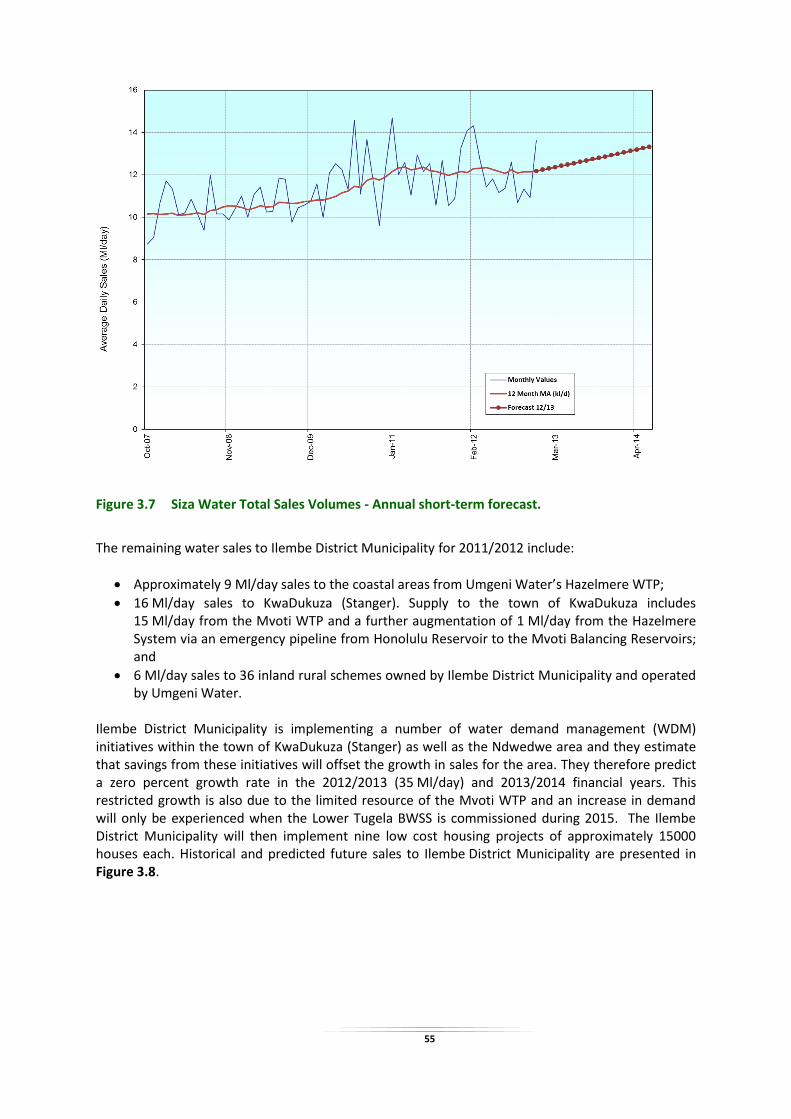
Urban and peri-urban growth across Sembcorp Siza Water’s concession area has caused a corresponding increase in water demand with the growth for the 2011/2012 financial year being 6.3%. Sembcorp Siza Water expects that further developments in this area will increase the demand from 12 Ml/day in 2011/2012 to 13 Ml/day in 2012/2013 and 13.3 Ml/day in 2013/2014. The interventions of a North Coast Task Team highlighted a number of problematic demand areas. The historical and future predicted increase in demand for Sembcorp Siza Water is presented in Figure 3.7.
Figure 3.6 Umgungungdlovu District Municipality Total Sales Volumes - Annual short-term forecast.
55
Figure 3.7 Siza Water Total Sales Volumes - Annual short-term forecast.
The remaining water sales to Ilembe District Municipality for 2011/2012 include:
Approximately 9 Ml/day sales to the coastal areas from Umgeni Water’s Hazelmere WTP;
16 Ml/day sales to KwaDukuza (Stanger). Supply to the town of KwaDukuza includes 15 Ml/day from the Mvoti WTP and a further augmentation of 1 Ml/day from the Hazelmere System via an emergency pipeline from Honolulu Reservoir to the Mvoti Balancing Reservoirs; and
6 Ml/day sales to 36 inland rural schemes owned by Ilembe District Municipality and operated by Umgeni Water.
Ilembe District Municipality is implementing a number of water demand management (WDM) initiatives within the town of KwaDukuza (Stanger) as well as the Ndwedwe area and they estimate that savings from these initiatives will offset the growth in sales for the area. They therefore predict a zero percent growth rate in the 2012/2013 (35 Ml/day) and 2013/2014 financial years. This restricted growth is also due to the limited resource of the Mvoti WTP and an increase in demand will only be experienced when the Lower Tugela BWSS is commissioned during 2015. The Ilembe District Municipality will then implement nine low cost housing projects of approximately 15000 houses each. Historical and predicted future sales to Ilembe District Municipality are presented in Figure 3.8.

56
Figure 3.8 Ilembe District Municipality Total Sales Volumes - Annual short-term forecast.
3.2.5 Ugu District Municipality
Total sales to the Ugu District Municipality increased by 11.8% from 8 205 Ml (22.48 Ml/day) in the 2010/2011 financial year to 9 307 Ml (25.5 Ml/day) in 2011/2012. This increase was primarily due to increased levels of the Umzinto and E. J. Smith dams allowing for increased sales when compared to the previous financial year when water restrictions were imposed. Ugu District Municipality is currently constructing a pipeline from their Hazelwood Reservoir to the Greater Vulamehlo area. This will allow water to be supplied from the Umzinto WTP supply system to Vulamehlo resulting in an expected growth rate of 2.5%. The expected growth in sales to the Ugu District Municipality (as confirmed by them) is estimated at 2.2% in the 2012/2013 financial year and 2% in 2013/2014. This equates to total sales for 2012/2013 and 2013/2014 of 9 512 Ml and 9 684 Ml respectively (Figure 3.9). Ugu District Municipality highlighted potential growth of sales to the Middle South Coast following the commissioning of the South Coast Pipeline (SCP-2a). This expected growth would be as a result of Ugu District Municipality’s proposed initiatives towards the reduction of backlogs. Rapid growth in water sales in the inland rural areas of the municipality, specifically in the Greater Vulamehlo, Ifafa and Mathulini areas are thus expected. Ugu District Municipality has embarked on a number of water demand management initiatives. However, these are mainly in the Lower South Coast region, and not in the Umgeni Water area of

57
supply and hence these are not expected to have an impact on projected water demand growth rates. Figure 3.9 Ugu District Municipality Total Sales Volumes - Annual short-term forecast.

58
3.2.6 Sisonke District Municipality
The Ixopo WTP supplies the Greater Ixopo area. Average daily sales from the WTP currently amount to approximately 2.7 Ml/day. There has been an inexplicable increase in demand since December 2011. The growth in future demand is constrained by the available resource. Following discussions with the municipality, the projection for Sisonke District Municipality has been kept at a 0% growth at 2.6 Ml/day (Figure 3.10).
Figure 3.10 Sisonke District Municipality Total Sales Volumes - Annual short-term forecast
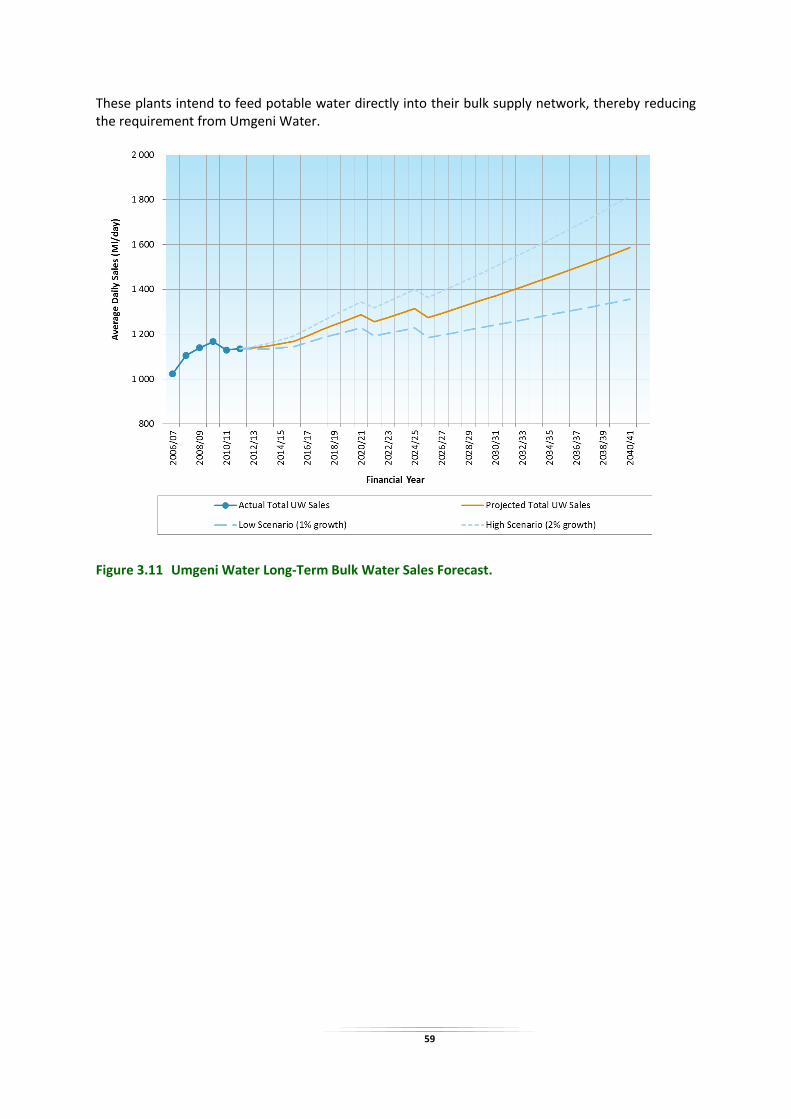
3.3 Long-Term Forecast The 30-year long-term sales forecast for Umgeni Water’s supply area (Figure 3.11) has been based on the anticipated natural growth from the existing supply system, plus bulk sales from new supply infrastructure that would extend the area supplied. The base projection has been developed from the short-term forecasts described in Section 3.2 of this report and then extended at a compounded 1.5% per annum growth rate until 2040/2041. This growth rate has been agreed to by the major water users in the region and is considered acceptable for this long-term forecast as it closely matches the forecast that was independently derived as part of the “Water Reconciliation Strategy Study for the KwaZulu-Natal Coastal Metropolitan Areas” recently completed by DWA, which used a population projection technique to estimate demand forecasts. The drop in sales in the 2019/2020 and 2022/2023 financial years, as shown in Figure 3.11, is as a result of the anticipated commissioning by eThekwini Municipality of their Northern and KwaMashu wastewater re-use plants which are anticipated to produce 50 Ml/day and 60 Ml/day respectively.
59
These plants intend to feed potable water directly into their bulk supply network, thereby reducing the requirement from Umgeni Water.
Figure 3.11 Umgeni Water Long-Term Bulk Water Sales Forecast.