Embed Size (px)
Citation preview
Mitsubishi UFJ Securities Holdings Co., Ltd. October, 2017
2QFY2017 Financial Summary

1 1
Consolidated Financial Results
・ Consolidated Performance Highlights P2
・ Net Operating Revenue and SG & A P3
・ Overview by Business Segments P5
Financial Results of Significant Subsidiaries
・ Mitsubishi UFJ Morgan Stanley Securities (MUMSS) P6
・ 【Reference】 Domestic Securities Companies P9
・ kabu.com Securities Co., Ltd. ( kabu.com ) and Overseas Business P10
Appendix
・ Consolidated Statement of Income (Full year, Quarter) P11
・ Consolidated Balance Sheet P12
・ Mitsubishi UFJ Morgan Stanley Securities (MUMSS) P13
・ Financial Soundness Indicators (Credit Rating, Capital Adequacy Ratio, etc.) P14
・ Market Risks P15
Contents
2 2
0
50
100
150
200
250
300FY2017 2Q simple aggregation with MUSA’s resultsFY2017 2QFY2016 2QFY2015 2Q
SG&A Ordinary profit Profit(owners of parent)
Net operating revenue0
20
40
60
80
100
120
140
1 3 5 7 9 11 13 15 17 19 21 23 25 27 29 31
FY2017 2Q simple aggregation with MUSA's resultsFY2017 2QFY2017 1Q simple aggregation with MUSA's resultsFY2017 1QFY2016 4Q simple aggregation with MUSA's resultsFY2016 4QFY2016 3Q simple aggregation with MUSA's resultsFY2016 3QFY2016 2QFY2016 1Q
Net operatingrevenue
SG&A Ordinary profit Profit(owners of parent)
Consolidated Performance Highlights
2Q (cumulative) Performance Trends Quarterly Performance Trends
(JPY billion) (JPY billion) 2Q (cumulative) Trends Quarterly Trends
JPY billion JPY billion
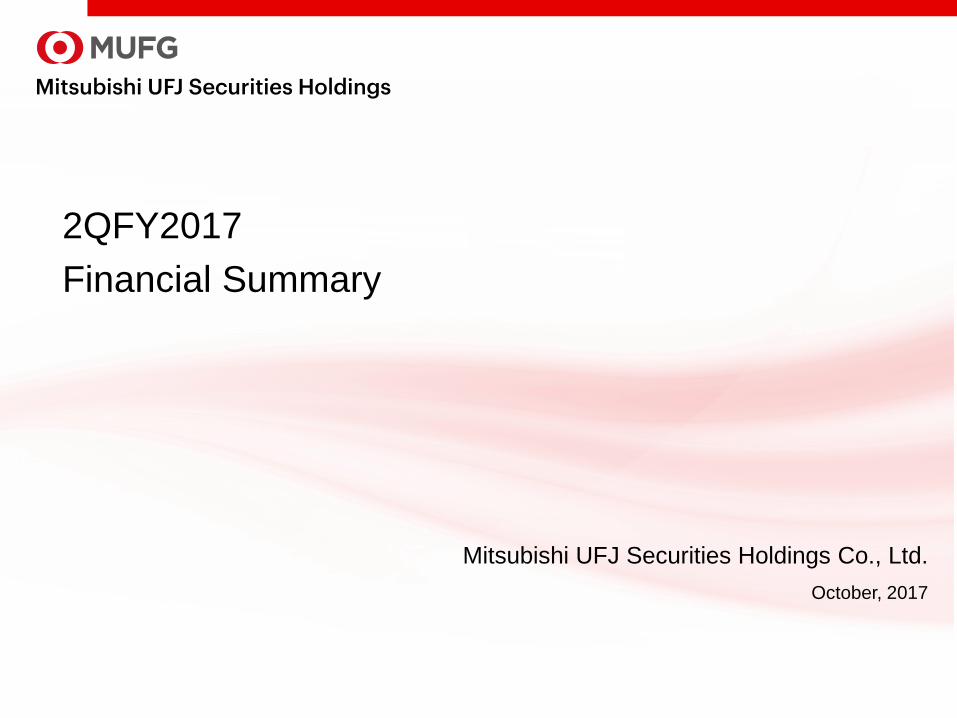
Net operating revenue of JPY 175.7 billion (-5% YoY), ordinary profit of JPY 35.1 billion (-26% YoY) and profit attributable to owners of parent of JPY 17.7 billion (-34% YoY). Both revenue and profit decreased from those in FY2016 2Q due to the struggle of domestic securities companies affected by intermittently heightened geopolitical risks and decreasing volatilities.
Net operating revenue for 2Q in a simple aggregation with the results of MUFG Securities Americas Inc. (hereinafter “MUSA”), which was deconsolidated from FY2016 3Q, was JPY 208.1 billion (+12% YoY), and increased from that of FY2016 2Q.
MUMSS increased its revenue and profit in Q2 from the previous quarter due to the recovery of retail business and net trading income thanks to the market recovery trend, and also became a main drive for the consolidated performance upturn from the previous quarter. Overseas subsidiaries continued to be strong, despite slowing down from the previous quarter.
Ordinary profit in a simple aggregation with the results of MUSA was JPY 23.6 billion and profit attributable to owners of parent was JPY 10.1 billion.
FY2015
2Q (cumulative) FY2016
2Q (cumulative) FY2017
2Q (cumulative) Net operating revenue 245.3 185.0 175.7 SG&A 191.2 160.9 149.1 Ordinary profit 66.8 47.7 35.1 Profit (owners of parent) 27.5 27.1 17.7
Net operating revenue - - 208.1 SG&A - - 173.5 Ordinary profit - - 43.2 Profit (owners of parent) - - 22.6
Simple aggregation with MUSA’s results
FY2016 1Q
FY2016 2Q
FY2016 3Q
FY2016 4Q
FY2017 1Q
FY2017 2Q
Net operating revenue 87.5 97.4 83.0 111.1 83.3 92.3 SG&A 78.4 82.4 69.6 84.5 73.6 75.5 Ordinary profit 21.5 26.2 18.8 33.0 15.1 20.0 Profit (owners of parent) 14.8 12.3 8.9 12.9 9.8 7.9
Net operating revenue - - 97.0 128.9 99.5 108.6 SG&A - - 79.3 98.6 85.4 88.0 Ordinary profit - - 23.0 36.7 19.5 23.6 Profit (owners of parent) - - 11.4 15.1 12.4 10.1
Simple aggregation with MUSA’s results

3 3
0
10
20
30
40
50
60
70
80
FY2016 1Q FY2016 2Q FY2016 3Q FY2016 4Q FY2017 1Q FY2017 2Q
Other fees received (Others)Other fees received (Beneficiary certificates)Flotation and distribution feeUnderwriting and distribution commissionCommission to consignees
0
20
40
60
80
100
120
FY2016 1Q FY2016 2Q FY2016 3Q FY2016 4Q FY2017 1Q FY2017 2Q
Commission receivedNet trading incomeNet financial revenue and others
Net Operating Revenue and SG & A (1)
FY2016
1Q FY2016
2Q FY2016
3Q FY2016
4Q FY2017
1Q FY2017
2Q
Commission received 39.6 45.8 38.7 48.9 36.8 39.6
Net trading income 42.5 38.8 41.5 56.1 36.9 42.3
Net financial revenue and others 5.4 12.6 2.7 6.0 9.6 10.2
Total 87.5 97.4 83.0 111.1 83.3 92.3
JPY billion JPY billion
Net Operating Revenue
Quarterly Trends (JPY billion) (JPY billion)
Both commission received and net trading income increased from the previous quarter. Net operating revenue managed to revert to JPY 90.0 billion levels.
Commission Received Commission to consignees: Recorded stable revenue due to a recovery in trading
value. Underwriting and distribution commission: Increased from the previous quarter due to
big deals in both stocks and bonds. Flotation and distribution fee: Increased from FY2016 2Q and maintained stable
revenue, although sales of investment trusts decreased slightly from the previous quarter.
Other fees received: Increased from the previous quarter due to strong performance in arranging finance deals, etc.
Quarterly Trends
FY2016 1Q
FY2016 2Q
FY2016 3Q
FY2016 4Q
FY2017 1Q
FY2017 2Q
Commission to consignees 8.8 9.1 11.0 10.0 9.8 9.7 Underwriting and distribution commission 10.1 13.1 5.2 8.0 4.5 6.9
Flotation and distribution fee 7.6 8.0 7.9 11.9 8.7 8.3 Other fees received (Beneficiary certificates)
5.4 5.4 5.7 5.6 5.8 5.8
Other fees received (Others) 7.6 10.0 8.7 13.2 7.8 8.7 Total 39.6 45.8 38.7 48.9 36.8 39.6
4 4
0
20
40
60
80
100
120
FY2016 1Q FY2016 2Q FY2016 3Q FY2016 4Q FY2017 1Q FY2017 2Q
Trading related expensesPersonnel expensesReal estate expensesOffice costDepreciationOthers
(20)
0
20
40
60
80
100
FY2016 1Q FY2016 2Q FY2016 3Q FY2016 4Q FY2017 1Q FY2017 2Q
Bonds and OthersStocksTotalTotal (including net financial revenue)
Net Operating Revenue and SG & A (2)
JPY billion
FY2016 1Q
FY2016 2Q
FY2016 3Q
FY2016 4Q
FY2017 1Q
FY2017 2Q
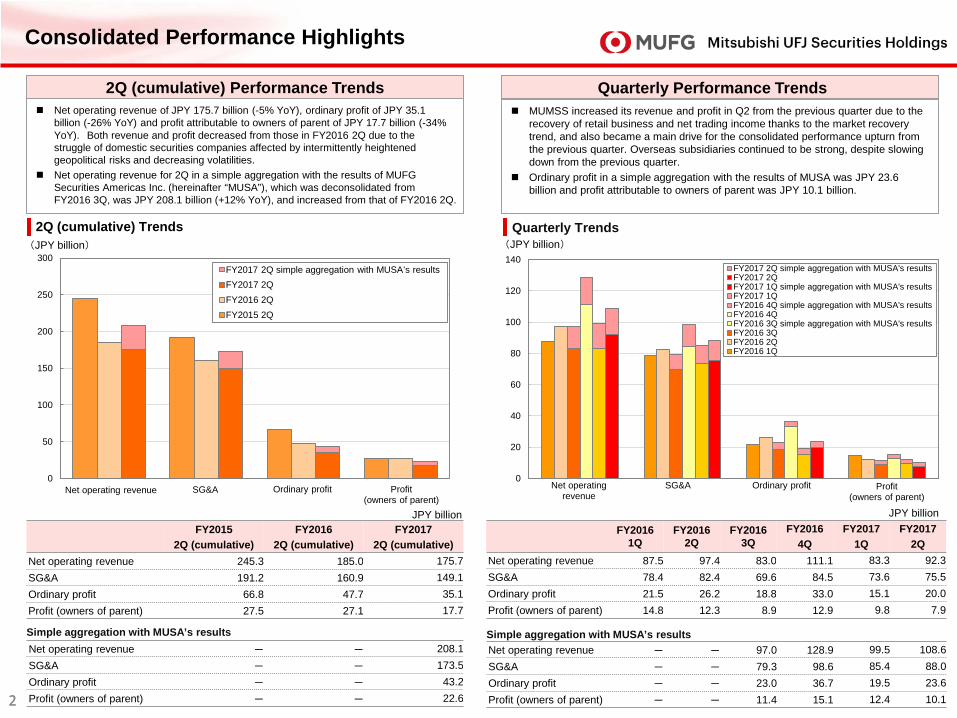
Trading related expenses 23.1 23.9 21.2 30.0 22.0 24.2
Personnel expenses 30.5 34.3 25.6 29.9 26.9 27.1 Real estate expenses 6.8 7.0 5.8 6.3 6.2 6.0 Office cost 7.7 7.9 7.7 8.0 7.9 8.0 Depreciation 5.9 5.4 5.4 6.1 6.5 6.3 Others 4.2 3.7 3.5 4.0 3.9 3.7 Total 78.4 82.4 69.6 84.5 73.6 75.5
JPY billion
Net Trading Income Increased due to higher trading related expenses, which are
strongly linked to revenues. Despite incremental increase in depreciation, fixed costs continued to be curbed in domestic and overseas subsidiaries, restraining increase in costs.
SG & A
Quarterly Trends Quarterly Trends (JPY billion) (JPY billion)
Domestic subsidiaries increased revenue in both stocks and bonds from previous quarter, making up for the decreased revenue opportunities under low volatility by capturing investment needs for foreign bonds / structured bonds under low-yield domestic bond market and flow from integrated S&T business of BTMU and MUS. Overseas subsidiaries continued to be strong, despite slowing down from the previous quarter. Total trading income including net financial revenue maintained a stable level.
FY2016 1Q
FY2016 2Q
FY2016 3Q
FY2016 4Q
FY2017 1Q
FY2017 2Q
Stocks (14.1) 2.5 12.4 28.4 7.0 9.9 Bonds and Others 56.6 36.3 29.1 27.7 29.8 32.4 Total 42.5 38.8 41.5 56.1 36.9 42.3
Net financial revenue 5.4 12.6 2.7 6.0 9.6 10.2 Total (including net financial revenue) 47.9 51.5 44.2 62.2 46.5 52.6

5 5
0
20
40
60
80
100
120
140
FY2016 1Q FY2016 2Q FY2016 3Q FY2016 4Q FY2017 1Q FY2017 2Q
Retail / Middle MarketsGlobal Markets BusinessInvestment Banking Business
Overview by Business Segments
Overview by Business Segments
Quarterly Trends
(JPY billion)
* Figures are based on management accounting basis (before internal transaction elimination) including MUSA which was deconsolidated since FY2016 3Q.
Retail / Middle Markets, Global Markets and Investment Banking increased revenue from the previous quarter.
Retail / Middle Markets: Showed solid performances supported by recovery trend of stock prices despite intermittently heightened geopolitical risks. Consignment transactions of domestic stock and structured bond sales were strong.
Global Markets: For domestic revenue, fixed income business, which had struggled in the previous quarter, picked up. Overseas revenue (April – June) slowed down due to lower customer flow caused by political events such as the French presidential election and the UK general election, as well as heightened geopolitical risks stemming from countries including Syria and North Korea.
Investment Banking: Increased both domestic and overseas revenue from the previous quarter driven by strong performances in underwriting business.

6 6
0
10
20
30
40
50
60
70
80
90
100
FY2016 1Q FY2016 2Q FY2016 3Q FY2016 4Q FY2017 1Q FY2017 2Q
Commission receivedNet trading incomeNet financial revenue and others
0
10
20
30
40
50
60
70
80
90
100
Net operating revenue SG&A Ordinary profit Profit(owners of parent)
FY2016 1Q
FY2016 2Q
FY2016 3Q
FY2016 4Q
FY2017 1Q
FY2017 2Q
Increased in both revenue and profit from the previous quarter due to strong performance in the Retail / Middle Market Division by capturing investment needs for stocks supported by the stock price recovery and foreign bonds / structured bonds. Underwriting business and trading business also recovered. Ordinary profit was JPY 14.0 billion, and profit attributable to owners of parent was JPY 9.1 billion.
Strong revenues by MUMSPB, which accurately anticipated customer needs, contributed to the performance results.
Quarterly Performance Trends
Mitsubishi UFJ Morgan Stanley Securities (MUMSS) (1)
Net Operating Revenue Revenue increased significantly from the previous quarter, recording
JPY 75.1 billion, following FY2016 4Q, which recorded a strong performance of the past six quarters.
Growth in the equity underwriting and debt capital markets businesses, together with recovery in trading of bonds from the previous quarter resulted in increases in commission received and net trading income.
JPY billion
FY2016 1Q
FY2016 2Q
FY2016 3Q
FY2016 4Q
FY2017 1Q
FY2017 2Q
Net operating revenue 61.8 73.4 67.7 92.0 61.4 75.1
SG&A 56.2 59.4 58.4 68.5 58.6 61.5
Ordinary profit 5.8 14.3 9.7 23.8 3.1 14.0
Profit (owners of parent) 3.5 9.1 6.1 15.5 1.8 9.1
JPY billion
Quarterly Trends Quarterly Trends (JPY billion) (JPY billion)
* Figures are on a consolidated basis, which include those of MUMSPB.
FY2016 1Q
FY2016 2Q
FY2016 3Q
FY2016 4Q
FY2017 1Q
FY2017 2Q
Commission received 27.8 34.2 33.5 43.4 31.6 34.7
Net Trading income 32.2 36.3 31.5 42.7 25.3 33.3
Net financial revenue and others 1.6 2.8 2.6 5.8 4.5 7.0
Total 61.8 73.4 67.7 92.0 61.4 75.1

7 7
0
5
10
15
20
25
30
35
40
2016/6 2016/9 2016/12 2017/3 2017/6 2017/9
Stocks Bonds Investment trusts Others
.
0
100
200
300
400
500
600
700
Stock investment trust Foreign debt for individualinvestors
JGBs for individual investors
FY2016 1Q
FY2016 2Q
FY2016 3Q
FY2016 4Q
FY2017 1Q
FY2017 2Q
Investment trusts, mainly emerging countries’ stock related ones, were strong, and increased from the previous quarter.
Foreign bonds for individual investors remained on a recovery trend mainly due to solid sales of structured bonds.
Sales of Retail / Middle Market Division
Mitsubishi UFJ Morgan Stanley Securities (MUMSS) (2)
Trends of AUM AUM recorded approximately JPY 37.2 trillion at the end of
September, 2017, increasing from the previous quarter mainly due to increased bonds.
Of the above, AUM for the Retail / Middle Market Division recorded JPY 30.6 trillion (JPY 29.9 trillion at the end of June, 2017).
2016/6 2016/9 2016/12 2017/3 2017/6 2017/9
Stocks 13.5 15.8 16.3 16.1 17.5 17.6
Bonds 11.4 11.6 11.8 11.9 12.1 12.5
Investment trusts 6.1 6.2 6.7 6.5 6.5 6.4
Others 0.7 0.7 0.7 0.7 0.7 0.7
Total 31.7 34.3 35.4 35.2 36.7 37.2
JPY trillion
FY2016 1Q
FY2016 2Q
FY2016 3Q
FY2016 4Q
FY2017 1Q
FY2017 2Q
Stock investment trusts 535.1 500.4 467.4 490.7 466.9 476.7
Foreign bonds for individual investors 320.7 335.1 403.4 598.3 460.0 522.7
JGBs for individual investors 99.6 66.7 33.4 78.3 54.7 48.5
JPY billion
Quarterly Trends Quarterly Trends (JPY billion) (JPY trillion)
* Simple aggregation of MUMSS and MUMSPB * From this disclosure, the scope of calculation of AUM for the Retail / Middle Market Division (of which, stocks and bonds) has been changed.

8 8
Investment banking business ~ League Table (from April, 2017 to September, 2017)
Mitsubishi UFJ Morgan Stanley Securities (MUMSS) (3)
*1 Source: Thomson Reuters, Thomson Reuters DealWatch (data compiled by Mitsubishi UFJ Morgan Stanley) Includes Japanese Straight Bonds, Ex-FILP Agency Bonds (incl. Expressway company's Bonds) and Municipal Bonds Related. Based on lead manager's credit.
*2 Source: Thomson Reuters (data compiled by Mitsubishi UFJ Morgan Stanley) Mitsubishi UFJ Morgan Stanley includes domestic offerings of Japanese issuers underwritten by Morgan Stanley MUFG Securities as well as global offerings of Japanese issuers
underwritten by Morgan Stanley. Based on underwriting amount.
*3 Source: Thomson Reuters (data compiled by Mitsubishi UFJ Morgan Stanley) Any Japanese involvement announced including property acquisitions. Mitsubishi UFJ Morgan Stanley includes deals advised by Morgan Stanley.
Japan Domestic Debt*1
Rank Securities Firm Share (%)
1 Mizuho Securities 23.2 2 Mitsubishi UFJ Morgan Stanley 21.5 3 Nomura Securities 18.8 4 Daiwa Securities 16.6 5 SMBC Nikko Securities 15.0 6 Tokai Tokyo Securities 1.4 7 Goldman Sachs Japan 1.2 8 Shinkin Securities 1.1 9 Okasan Securities 0.3 10 Merrill Lynch Japan Securities 0.3
Japan Equity and Equity-linked*2
Rank Securities Firm Share (%)
1 Nomura 26.5 2 Daiwa Securities Group 25.0 3 Mitsubishi UFJ Morgan Stanley 11.7 4 Sumitomo Mitsui Financial Group 9.5 5 Goldman Sachs & Co 6.9 6 Mizuho Financial Group 6.8 7 Bank of America Merrill Lynch 3.7 8 JP Morgan 3.4 9 SBI Holdings 1.1 10 OKASAN Securities Group 0.8
M&A Advisory / Based on Rank Value*3
Rank Financial Advisor JPY billion
1 Nomura 4,056 2 Goldman Sachs & Co 3,073 3 Mitsubishi UFJ Morgan Stanley 2,978 4 Sumitomo Mitsui Financial Group 920 5 Bank of America Merrill Lynch 825 6 Citi 556 7 JP Morgan 546 8 Mizuho Financial Group 527 9 PricewaterhouseCoopers 354 10 UBS 343

9 9
0
20
40
60
80
100
120
140
160
180
200
Net operatingrevenue
SG&A Ordinary income Profit
kabucom
Japan JV
Japan JVkabu.com
Securities Companies’ Performance Net operating revenue of Domestic Securities Companies is over JPY 180 billion on a simple sum basis. It includes the full net operating revenue
from Morgan Stanley MUFG Securities Co., Ltd. (“MSMS”); this is one of the joint venture securities companies with Morgan Stanley in Japan and an associated company accounted for by using the equity-method.
“Domestic Securities Companies” consist of four companies including three joint venture companies with Morgan Stanley (“Japan JV”) and kabu.com Securities Co., Ltd.
【Reference】 Domestic Securities Companies
Performance of FY 2Q (cumulative) 2017
(JPY billion)
(Simple sum of the figures for Domestic Securities Companies) FY 2017 2Q(cumulative)
Net Operating Revenue 186.4 Japan JV 176.5
Mitsubishi UFJ Morgan Stanley Securities Co., Ltd. Consolidated base (“MUMSS” + “MUMSPB”) *1 136.6
Morgan Stanley MUFG Securities Co., Ltd. (“MSMS”) *2 39.8
kabu.com Securities Co., Ltd.(“kabu.com”) 9.9 SG & A 156.2 Japan JV 149.2
MUMSS Consolidated base 120.1 MSMS 29.0
kabu.com 7.0 Ordinary profit 30.9 Japan JV 28.0
MUMSS Consolidated base 17.1 MSMS 10.8
kabu.com 2.9 Profit 21.0 Japan JV 18.4
MUMSS Consolidated base (Profit attributable to owners of parent) 11.0
MSMS 7.3 kabu.com 2.5
(JPY billion)
* The figures in the graph above represent the simple sum of the Domestic Securities Companies.
*1 MUMSS consolidated base which includes Mitsubishi UFJ Morgan Stanley PB Securities Co., Ltd. (MUMSPB). *2 MSMS is an associated company accounted for by using the equity-method.

10 10
-4
-2
0
2
4
6
8
10
12
14
FY2016 1Q FY2016 2Q FY2016 3Q FY2016 4Q FY2017 1Q FY2017 2Q
North AmericaEuropeAsia
0
1
2
3
4
5
6
7
8
Net operating revenue SG&A Ordinary profit Profit
FY2016 1Q
FY2016 2Q
FY2016 3Q
FY2016 4Q
FY2017 1Q
FY2017 2Q
FY2016 1Q
FY2016 2Q
FY2016 3Q
FY2016 4Q
FY2017 1Q
FY2017 2Q
Net operating revenue 4.8 4.2 4.6 7.3 5.0 4.8
SG&A 2.8 2.9 2.7 5.0 3.8 3.1
Ordinary profit 2.0 1.3 1.9 1.9 1.2 1.6
Profit 1.8 1.2 1.5 1.3 1.4 1.1
Ordinary profit (loss): Quarterly Trends
kabu.com Securities Co., Ltd. ( kabu.com ) and Overseas Business
FY2016 1Q
FY2016 2Q
FY2016 3Q *
FY2016 4Q *
FY2017 1Q *
FY2017 2Q *
North America 1.09 3.04 4.24 3.69 4.32 3.68
Europe 2.47 (1.78) 3.46 4.00 7.52 3.59
Asia 0.12 0.21 0.26 (0.49) 0.34 (0.84)
Total 3.70 1.48 7.97 7.20 12.19 6.43
Business in Europe maintained favorable level of revenue despite a slowdown in the secondary business from the previous quarter due to the political events and the heightened geopolitical risks.
Business in Asia decreased revenue due to lower customer flow and the revenue could not cover costs.
Business in North America maintained steady performance mainly in the underwriting business. Overseas business as a whole including business in North America recorded JPY 6.4 billion of ordinary profit.
kabu.com Quarterly Trends Ordinary profit increased from the previous quarter due to a
decrease in SG&A from the previous quarter, in which SG&A had increased attributable to temporary causes, while net operating revenue remained almost unchanged.
Overseas Business Quarterly Trends
Quarterly Trends (JPY billion) (JPY billion)
JPY billion JPY billion
* Figures represent the aggregation with MUSA’s results.

11 11
Appendix Consolidated Statement of Income (Full year, Quarter)
Full year Quarter
FY2015 FY2016
Operating revenue 474,449 404,497
Commission received 226,105 173,279
Net trading income 178,770 179,112
Other operating revenue 0 0
Financial revenue 69,573 52,105
Financial expenses 36,706 25,260
Net operating revenue 437,742 379,237
SG & A 357,055 315,125
Operating profit 80,687 64,111
Non-operating income 27,885 37,075
Non-operating expenses 715 1,591
Ordinary profit 107,857 99,595
Extraordinary income 275 180
Extraordinary losses 3,513 3,465
Income taxes 33,971 21,695
Profit attributable to non-controlling interests 27,384 25,529
Profit attributable to owners of parent 43,262 49,085
FY2016 FY2017
1Q 2Q 3Q 4Q 1Q 2Q
98,805 101,774 87,038 116,879 86,684 94,947
39,633 45,883 38,779 48,983 36,821 39,692
42,557 38,889 41,524 56,141 36,943 42,389
0 0 - - 0 0
16,613 17,001 6,735 11,755 12,918 12,865
11,213 4,341 4,018 5,687 3,305 2,568
87,592 97,432 83,020 111,191 83,378 92,379
78,489 82,486 69,607 84,542 73,660 75,528
9,103 14,946 13,413 26,648 9,718 16,850
12,541 11,942 5,380 7,210 6,195 3,185
107 680 (30) 833 733 25
21,536 26,208 18,823 33,026 15,181 20,010
196 (1) 19 (34) 83 11
455 427 1,806 775 7 9
1,808 5,461 4,274 10,150 2,792 6,667
4,597 7,990 3,840 9,099 2,646 5,413
14,872 12,327 8,922 12,964 9,817 7,930
JPY million

12 12
As of Mar. 31,
2017
As of Sep. 30,
2017 Change
ASSETS
Current assets 29,807 25,300 (4,507)
Cash and deposits 1,620 1,792 +172
Trading products 14,756 12,867 (1,889)
Loans secured by securities 10,826 8,321 (2,505)
Others 2,604 2,318 (285)
Non-current assets 685 575 (109)
PP & E 39 38 (1)
Intangible assets 109 107 (1)
Investments and other assets
536 429 (106)
Total assets 30,493 25,876 (4,616)
As of Mar. 31,
2017
As of Sep. 30,
2017 Change
LIABILITIES
Current liabilities 27,986 23,349 (4,637)
Trading products 14,156 10,907 (3,249)
Loans payable secured by securities 8,462 6,374 (2,087)
Short-term loans payable 1,855 2,024 +168
Others 3,511 4,041 +530
Non-current liabilities 1,543 1,549 +5
Bonds payable 1,022 995 (26)
Long-term loans payable 505 538 +33
Others 16 15 (0)
Total liabilities 29,533 24,902 (4,631)
NET ASSETS
Shareholders’ equity 700 707 +7
Accumulated other comprehensive income (25) (22) +3
Subscription rights to shares 0 0 +0
Non-controlling interests 284 288 +4
Total net assets 959 974 +14
Total liabilities and net assets 30,493 25,876 (4,616)
Appendix Consolidated Balance Sheet
JPY billion

13 13
FY2015 FY2016
Operating revenue 302,534 270,069 Commission received 149,536 122,569
Net trading income 132,248 126,070
Others 0 0 Financial revenue 20,748 21,428
Financial expenses 9,636 8,284 Net operating revenue 292,897 261,784 SG & A 225,938 218,219 Operating profit 66,958 43,564 Net non-operating income (expenses) 10,885 6,918 Ordinary profit 77,844 50,482 Net extraordinary income (losses) 0 (1,945) Income taxes 22,095 12,817 Profit 55,749 35,720
FY2016 FY2017 1Q 2Q 3Q 4Q 1Q 2Q
57,005 66,641 61,750 84,672 53,133 66,746 24,383 30,373 29,765 38,047 26,862 29,716 28,898 31,581 27,668 37,922 19,927 28,589
0 0 - - 0 0 3,723 4,686 4,316 8,702 6,342 8,439 1,989 1,748 1,667 2,879 1,794 1,394
55,016 64,892 60,082 81,792 51,338 65,351 50,728 53,138 52,792 61,560 51,888 54,722 4,287 11,753 7,290 20,232 (549) 10,629 2,983 579 2,772 582 3,462 721 7,271 12,333 10,062 20,815 2,912 11,350 (449) (385) (379) (730) (7) (9) 1,176 3,617 2,142 5,881 (442) 3,351 5,645 8,331 7,540 14,203 3,347 7,989
As of
Mar. 31, 2017 As of
Sep. 30, 2017 Change
Current assets 14,742 12,952 (1,789) Cash and deposits 1,254 1,343 +89 Trading products 8,254 7,941 (313) Loans secured by securities 4,051 2,786 (1,265) Others 1,180 881 (299)
Non-current assets 158 156 (2) PP& E 27 25 (1) Intangible assets 61 59 (1) Investments and other assets 70
70 +0
Total assets 14,900 13,108 (1,792)
As of
Mar. 31, 2017 As of
Sep. 30, 2017 Change
Current liabilities 14,108 12,287 (1,820) Trading products 7,819 6,251 (1,568) Loans payable secured by securities 2,795 1,935 (859) Short-term loans payable 2,174 2,275 +100 Others 1,319 1,826 +506
Non-current liabilities 366 383 +17 Long-term loans payable 355 372 +17 Others 10 10 (0)
Total liabilities 14,476 12,672 (1,803) Net assets 424 435 +11 Total liabilities and net assets 14,900 13,108 (1,792)
JPY million
Statement of Income
Balance Sheet
Full year Quarter
JPY billion
Appendix Mitsubishi UFJ Morgan Stanley Securities (MUMSS)
Full year Quarter
FY2015 FY2016
Net operating revenue 38,642 33,375 Ordinary profit 12,703 9,493 Profit 8,582 6,510
FY2016 FY2017 1Q 2Q 3Q 4Q 1Q 2Q
6,812 8,595 7,725 10,241 10,170 9,816 1,468 2,463 2,135 3,426 3,535 3,109 1,008 1,685 1,461 2,354 2,435 2,127
JPY million
Statement of Income
MUMSS (non-consolidated)
MUMSPB (non-consolidated)
14 14
Appendix Financial Soundness Indicators (Credit Rating, Capital Adequacy Ratio, etc.)
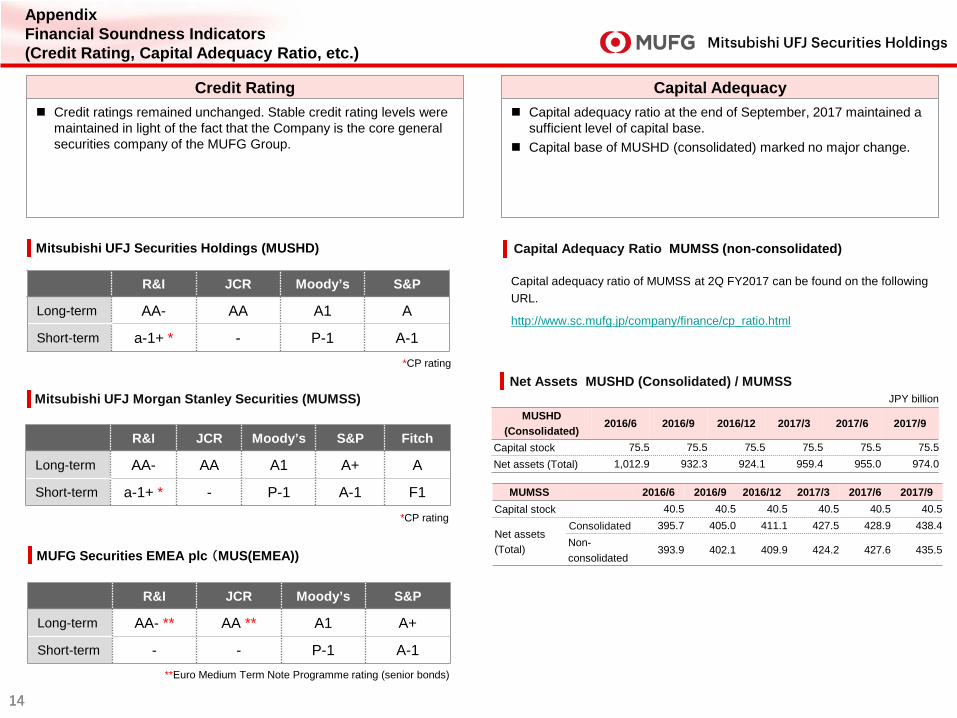
MUMSS 2016/6 2016/9 2016/12 2017/3 2017/6 2017/9 Capital stock 40.5 40.5 40.5 40.5 40.5 40.5
Net assets (Total)
Consolidated 395.7 405.0 411.1 427.5 428.9 438.4 Non- consolidated
393.9 402.1 409.9 424.2 427.6 435.5
MUSHD (Consolidated)
2016/6 2016/9 2016/12 2017/3 2017/6 2017/9
Capital stock 75.5 75.5 75.5 75.5 75.5 75.5 Net assets (Total) 1,012.9 932.3 924.1 959.4 955.0 974.0
Credit Rating Capital adequacy ratio at the end of September, 2017 maintained a
sufficient level of capital base. Capital base of MUSHD (consolidated) marked no major change.
Capital Adequacy
Capital Adequacy Ratio MUMSS (non-consolidated)
Net Assets MUSHD (Consolidated) / MUMSS JPY billion
*CP rating
Mitsubishi UFJ Morgan Stanley Securities (MUMSS)
Mitsubishi UFJ Securities Holdings (MUSHD)
R&I JCR Moody’s S&P
Long-term AA- AA A1 A
Short-term a-1+ * - P-1 A-1
MUFG Securities EMEA plc (MUS(EMEA))
R&I JCR Moody’s S&P
Long-term AA- ** AA ** A1 A+
Short-term - - P-1 A-1 **Euro Medium Term Note Programme rating (senior bonds)
*CP rating
Credit ratings remained unchanged. Stable credit rating levels were maintained in light of the fact that the Company is the core general securities company of the MUFG Group.
Capital adequacy ratio of MUMSS at 2Q FY2017 can be found on the following URL.
http://www.sc.mufg.jp/company/finance/cp_ratio.html
R&I JCR Moody’s S&P Fitch
Long-term AA- AA A1 A+ A
Short-term a-1+ * - P-1 A-1 F1
15 15
0
2
4
6
8
10
12
2016/6 2016/9 2016/12 2017/3 2017/6 2017/9
Domestic SubsidiaryOverseas Subsidiaries
0
2
4
6
8
10
12
14
16
2016/6 2016/9 2016/12 2017/3 2017/6 2017/9
Interest rates
Equities
Foreign exchange
Total
2016/6 2016/9 2016/12 2017/3 2017/6 2017/9
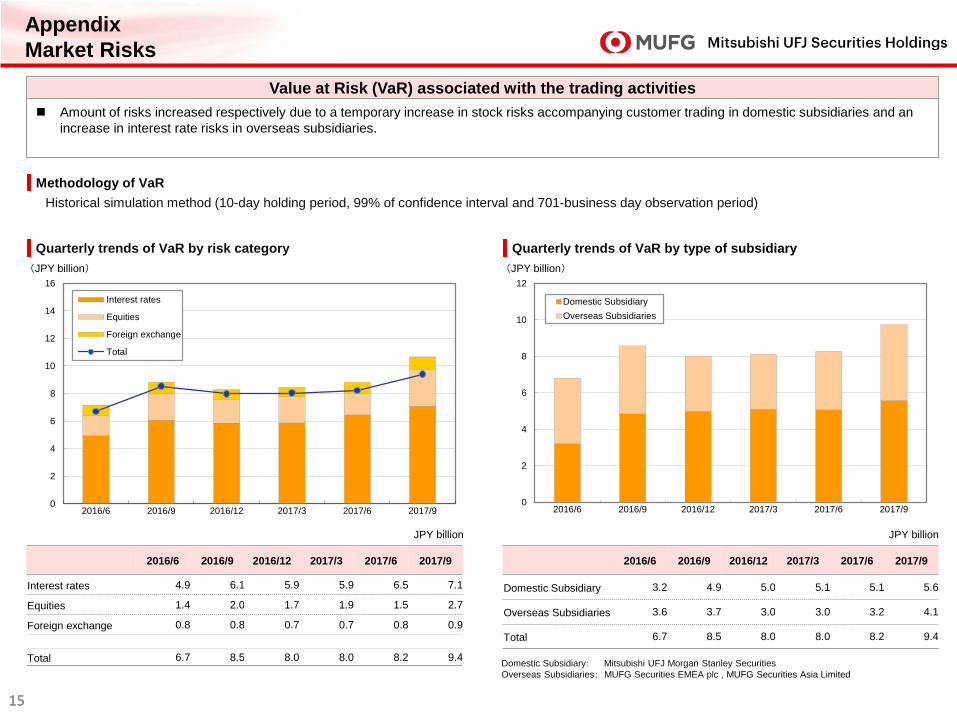
Interest rates 4.9 6.1 5.9 5.9 6.5 7.1
Equities 1.4 2.0 1.7 1.9 1.5 2.7
Foreign exchange 0.8 0.8 0.7 0.7 0.8 0.9
Total 6.7 8.5 8.0 8.0 8.2 9.4
Value at Risk (VaR) associated with the trading activities Amount of risks increased respectively due to a temporary increase in stock risks accompanying customer trading in domestic subsidiaries and an
increase in interest rate risks in overseas subsidiaries.
Quarterly trends of VaR by type of subsidiary Quarterly trends of VaR by risk category
Historical simulation method (10-day holding period, 99% of confidence interval and 701-business day observation period)
2016/6 2016/9 2016/12 2017/3 2017/6 2017/9
Domestic Subsidiary 3.2 4.9 5.0 5.1 5.1 5.6
Overseas Subsidiaries 3.6 3.7 3.0 3.0 3.2 4.1
Total 6.7 8.5 8.0 8.0 8.2 9.4
Domestic Subsidiary: Mitsubishi UFJ Morgan Stanley Securities Overseas Subsidiaries: MUFG Securities EMEA plc , MUFG Securities Asia Limited
(JPY billion) (JPY billion)
Appendix Market Risks
JPY billion JPY billion
Methodology of VaR

This document has been compiled solely for the purpose of providing information regarding the financial results for the second quarter of the fiscal year ending March 31, 2018, and is not intended as a solicitation or recommendation to invest in or dispose of the securities issued by the Company. This document was prepared based on information available as of October 27, 2017. Financial information and other information contained in this document are not subject to reviews by the accounting auditors. The facts and opinions presented in this document are facts that the Company acknowledged and opinions held by the Company as of the time of the preparation of this document. No guarantees or warranties are made by the Company as to the accuracy or completeness of the information contained therein, and such information is subject to change without notice. In addition, the Company is not liable for any omissions or errors in the data or representations contained in this document. Please note that all rights, including copyrights, to this document, in whole or in part, belong to Mitsubishi UFJ Securities Holdings Co., Ltd., and are not permitted to reproduce, distribute or transmit this document, digitally or otherwise in any format, for any purpose, without the express consent of Mitsubishi UFJ Securities Holdings Co., Ltd.


![[PPT]Supplier Consignment Training - Supplier.intel.com · Web viewSM KM Consignment Model Supplier Consignment Training Agenda Overview of SM KM Consignment Model Current vs Consignment](https://img.dokumen.tips/doc/110x75/5b37de867f8b9a600a8cb065/pptsupplier-consignment-training-web-viewsm-km-consignment-model-supplier.jpg)