Embed Size (px)
Citation preview

1
1 Isolation of lactoferrin and immunoglobulins from dairy whey by an
2 electrodialysis with filtration membrane process
3 Qiuyue Wang, George Q. Chen, Sandra E. Kentish*
4 Department of Chemical and Biomolecular Engineering, The University of Melbourne,
5 Victoria 3010, Australia
6
7 *Corresponding author. Tel: +61 3 8344 6682; Fax: +61 3 8344 6682; E-mail: 8 [email protected] (Sandra E. Kentish).
9
10 Abstract:
11 Isolation of high value minor proteins such as lactoferrin and immunoglobulins from crude dairy
12 streams is a major challenge for the dairy industry. Here we investigate an electrodialysis with filtration
13 membrane (EDFM) approach to separate lactoferrin (LF) and immunoglobulins (Ig) from other dairy
14 proteins. A polyvinyl alcohol (PVA) membrane is prepared using phase inversion in a coagulation bath
15 with 80% ethanol to serve as the filtration membrane. A range of treatment times and two electric field
16 strengths (38.5 and 77 V/cm) were then investigated within the electrical cell. The results show that the
17 filtration membrane prepared in-house can offer strong rejection for LF and Ig while allowing a high
18 flux of other proteins. The separation of LF and Ig from a simulated whey solution can be achieved.
19 The use of a partially demineralised whey reduces protein loss, but there is a tradeoff between the energy
20 consumption and the protein removal rate as the extent of this demineralisation is increased.
21

2
22 1. Introduction:
23 The dairy industry generates large quantities of whey which contain many nutrients such as lactose,
24 soluble proteins, minerals, lactic acid and fats [1]. Generally, 7-11% of the total solids of whey are
25 proteins [2]. Considering the vast quantum of whey produced globally (over160 million tons per annum
26 [3]), the recovery of these proteins not only can decrease the environmental problems associated with
27 its disposal, but also produce bioactive ingredients of high economic value.
28 The isolation of major whey proteins such as α-lactalbumin (α-LA) and β-lactoglobulin (β-LG) have
29 been achieved[4] while the separation of minor whey proteins with similar size still need a satisfactory
30 solution. The traditional method for whey protein extraction is chromatography, but it has disadvantages
31 of fouling, long cycle times and high cost[5]. Further, chromatography adds significant volumes of salt
32 to the factory effluent during the elution cycle, which is increasingly an issue for factories in rural
33 regions where dryland salinity is increasing. Comparing with a chromatographic method, pressure-
34 driven membrane filtration can be more cost-effective, but it has low selectivity. To improve the
35 selectivity of the filtration method, electrodialysis with filtration membrane (EDFM) has been proposed.
36 The use of an electrical driving force allows the EDFM process to have greater selectivity than a
37 pressure driven filtration method [6]. Further, the elimination of a pressure driving force minimises the
38 compressive forces that lead to a highly impermeable and non-selective fouling cake as occurs in protein
39 microfiltration [7, 8].
40 The use of an electrical driving force to separate proteins in combination with a filtration membrane
41 was first suggested by the Gradipore company [9], who showed that the approach could be used to
42 separate Immunoglobulin G from human plasma[10], proteins from egg white [11] and haemoglobin
43 from a mixture with bovine serum albumin [12]. Due to the relatively large size of the proteins the
44 electrical field strength required to move the proteins across this membrane is high (10 V/cm to 2,000
45 V/cm[10]). This means that non-charged membranes must be used to prevent water splitting. The
46 Gradipore company used polyacrylamide membranes for this purpose. However, these membranes are
47 difficult to produce at a commercial scale, due to the use of toxic monomers and comonomers and the
48 need to operate in oxygen-free conditions.
49 A similar approach, termed electrodialysis with ultrafiltration (EDUF) was later patented by the
50 Bazinet group [13] for the separation of peptides. The smaller size of these molecules means that a
51 lower electrical field strength can be used (<15 V/cm). This lower field strength allows the use of
52 charged ion exchange membranes to isolate the electrode chambers without water splitting. The Bazinet
53 group have applied this technology to the separation of a range of molecules, including chitosan
54 oligomers [14, 15], polyphenols[16], catechins[17]and anthocyanins [18].

3
55 Lactoferrin (LF) is a well-characterized iron-binding glycoprotein that belongs to the transferrin
56 family [19]. It is a major whey protein in human milk with concentrations of 1.4–2.0 mg/mL but only
57 a minor component in bovine milk with concentrations of only about 0.1– 0.2 mg/mL [20]. Hence it is
58 necessary to use highly concentrated, purified bovine LF as an ingredient of infant nutritional formula.
59 Lactoferrin is an important antimicrobial milk protein [21]; and also has many other advantages for
60 human health, such as antibacterial [22], antitumor [23] and anti-inflammation activity [24]. The
61 immunoglobulins (Ig) are the largest protein in whey and comprise at least 2% of the total milk protein.
62 They link various parts of the cellular and humoral immune system and prevent the adhesion of
63 microbes, inhibit bacterial metabolism, agglutinate bacteria, augment phagocytosis of bacteria and
64 neutralize toxins and viruses [25]. The nutritional, therapeutic, and functional characteristics of LF and
65 Ig make the fractionation of LF and Ig of considerable commercial interest. However, the large-scale
66 utilisation of LF requires a cost-effective purification process. The biggest challenge of Ig and LF
67 fractionation is the separation of BSA and LF as they have similar size [26] and hence this is the focus
68 of the present work.
69 Lactoferrin has a higher isoelectric point (~9) than other whey proteins (~5) in pure water and low
70 salt solution concentrations [27], meaning that it is positively charged. However, when the ionic
71 strength exceeds 30 mM at pH 6.5, negative values of the zeta potential are recorded[27]. This can be
72 attributed to the formation of net-negatively charged LF aggregates or micelles, which are observed to
73 form at NaCl concentrations above 10 mM[27]. Mela et al.[27] observe that 60% of the dynamic light
74 scattering intensity of LF can be attributed to large aggregates of 110 nm in size at 100mM salt
75 concentration. It has also been reported that lactoferrin undergoes polymerisation in solutions of 10mM
76 calcium chloride, with the predominant species being a tetramer of molecular weight ~300 kDa [28].
77 The ionic strength of either milk or whey is higher than 30mM and there is usually sodium and calcium
78 present [29], so the net charge of lactoferrin particles in whey or milk is expected to be negative. This
79 makes it hard to separate lactoferrin from other negatively charged proteins such as BSA based on
80 charge. Ndiaye et al. [30] was able to transfer LF within an LF-enriched whey solution at pH 3.0 from
81 the feed to permeate channel of an EDUF unit separated by a polyethersulfone ultrafiltration membrane
82 (MWCO: 500 kDa). However, the migration yield was only 15% and the selectivity was decreased due
83 to concomitant migration of β-lactoglobulin or other whey proteins.
84 Conversely, the aggregation of LF may make it possible to separate this molecule based on size. A
85 membrane with a pore size larger than proteins such as BSA (molecular weight (MW): ~66 kDa), while
86 smaller than Ig (MW: 150~250 kDa) and tetramers of LF (MW: 312 kDa) can be used as the separation
87 membrane in an EDFM system. A protein fraction rich in Ig and tetramers or aggregates of LF would
88 then be obtained in the retentate chamber, which would be of great economic benefit.

4
89 Poly (vinyl) alcohol (PVA) is selected in this work for the fabrication of a suitable ultrafiltration
90 separation membrane[31]. PVA is a nontoxic polymer with good chemical, thermal and mechanical
91 stability [32]. It is hydrophilic and known to be resistant to protein fouling [33-35]. The pore size of
92 the PVA filtration membrane can be controlled by varying the composition of polymer solution [36]
93 and coagulant bath during phase inversion [37]. However, PVA has very poor stability in aqueous
94 solutions, which makes it impossible to use directly for a membrane that will be used in the aqueous
95 phase [38]. Katz [39] and Senturk [40] treated PVA membranes using a heating method to improve
96 their water resistance and found that the application of heat decreased the water content of the
97 membrane, in turn reducing both the water and salt permeabilities and collapsing the pore structure.
98 Chemical crosslinking is a more common approach with dialdehydes such as glutaraldehyde [41] and
99 formaldehyde [42] generally used as the crosslinking agents.
100 In the present work, the aggregation of LF has been utilized to separate it from other proteins such as
101 BSA. PVA membranes are prepared by a phase inversion method to provide size selectivity between
102 LF and BSA. The water resistance of these membranes is increased by using glutaraldehyde as a
103 crosslinking agent, catalysed by sulfuric acid. To achieve a highly efficient, low investment and eco-
104 friendly approach to Ig and LF fractionation, the operating conditions of the EDFM process with these
105 in-house developed filtration membranes is then optimized.
106

5
107 2. Materials and Methods
108 2.1 Materials
109 Poly vinyl alcohol (PVA, 89 kDa, 99+% hydrolyzed) was purchased from Sigma (St. Louis, USA);
110 the crosslinking reagent glutaric dialdehyde (25%), solvents acetone (Purity≥99.5%) and acetonitrile
111 (HPLC grade) were purchased from Merck Pty Ltd (Darmstadt, Germany); other solvents such as
112 methanol (99.5%) and ethanol (99.5%) were obtained from Chem-supply (Adelaide, Australia).
113 Experiments were performed using bovine serum albumin (BSA) with a purity greater than 98%
114 (Sigma, St. Louis, USA) and lactoferrin (LF) concentrate with a LF concentration higher than 85%
115 which was kindly supplied by a Victorian dairy company. In real whey, the concentration of BSA and
116 LF are around 0.4 g/L and 0.1 g/L respectively [2, 31]. In these experiments, we elected to at least
117 double these concentrations to ensure that these proteins could be adequately detected using High
118 Performance Liquid Chromatography (HPLC).
119 An unflavoured whey protein isolate (WPI) powder (whey protein=91%) branded as Bodies (NSW,
120 Australia) was purchased from Chemist Warehouse (Melbourne, Australia). BSA (assay≥98%), LF
121 (assay≥ 85%), Immunoglobulins (assay≥ 99%), β-lactoglobulin (assay≥ 90%) and α-lactalbumin
122 (assay≥85%) obtained from Sigma (St. Louis, USA) were used as standards for quantitative analysis
123 of the corresponding protein through High Performance Liquid Chromatography (HPLC).
124 Simulated milk ultrafiltrate (SMUF) was used to represent the buffered salt mixture present in dairy
125 whey. It was prepared according to Jenness(1962) [29] (see Supporting Information Table S1), in which
126 potassium carbonate (99%), potassium chloride (99%), ethylenediaminetetraacetic acid (EDTA)
127 disodium salt (>99%), magnesium chloride (>98%) and calcium chloride (>99%) were purchased from
128 Chem-supply (Adelaide, Australia); tri-sodium citrate (99%), potassium dihydrogen orthophosphate
129 (99%-101%), potassium hydroxide (99%) and potassium sulphate (99%) were obtained from Ajax
130 Finechem (NSW, Australia); potassium citrate tribasic (assay≥99%) was purchased from Sigma (St.
131 Louis, USA). In some cases, the divalent cationic salts (calcium and magnesium chloride) were
132 excluded from this mixture, to evaluate their impact on the process and to reduce the possibility of
133 mineral fouling.
134 Tris-base buffer was used in preliminary experiments to optimise the coagulation bath conditions
135 for the membrane preparation. This was prepared from 20 mM of Trizma® base (99.9%) purchased
136 from Sigma (St. Louis, USA) and 10 mM of Hepes (99.8%) purchased from Formedium Ltd
137 (Hunstanton, England).

6
138
139 Laemmli Sample buffer, Native sample buffer, Tris/Glycine buffer and Tris/Glycine/SDS buffer for
140 Native-Page and SDS-Page were supplied by Bio-Rad Laboratories Pty. Ltd (NSW, Australia).
141 All reagents were used without any further purification.
142 2.2 Preparation of PVA filtration membranes
143 To prepare the PVA solution, 44.5 g high-purity water (18.2 MΩ·cm, 25 ℃) was added to a round
144 bottom flask which was placed in a thermostatic oil bath (90°C) and stirred under reflux. Then 5.5 g
145 PVA was added into the water. The slurry was stirred at 90°C until no undissolved gel was observed,
146 forming a viscous solution. The solution was then stirred for an additional 30 min under reflux to ensure
147 complete dissolution of the PVA, then held overnight without stirring to remove entrained bubbles.
148 The PVA solution was cast onto a glass plate (130 µm), air-dried for 5 minutes, and then immersed
149 in a non-solvent coagulation bath (300 mL), containing a mixture of water and ethanol in a specific
150 ratio, for 2 hours. Following this, the solvent was exchanged by immersion of the membranes in an
151 acetone bath (100 mL) for 30 minutes to reduce membrane shrinkage and pore collapse upon drying.
152 The membranes were air-dried overnight then annealed at 110 °C for 1 hr.
153 After the annealing step, the membrane was put in 300 mL of high-purity water for 24 hr. To
154 crosslink the membrane and so to improve its hot water resistance, the membrane was then placed in a
155 crosslinking solution of 0.5% H2SO4 and 1% glutaraldehyde for 20 min after wiping the water on its
156 surface gently (Kimtech wipes). After crosslinking, the membrane was washed and put into 300 mL of
157 high-purity H2O for at least 24 hours to eliminate any possible glutaraldehyde and sulfuric acid residuals.
158 Each membrane was then immersed in the same buffer as the feed solution for at least 24 hours before
159 each experiment.
160 2.3 Analysis
161 Cryo- Scanning electron microscopy (Cryo-SEM) images of PVA filtration membranes were taken
162 with a Joel JSM-7001F scanning electron microscope.
163 A HPLC system with a YarraTM Column (3 µm SEC-2000 (300×7.8 mm)) from Phenomenex was
164 used to determine the concentration of BSA, Ig, α-LA and β-LG. Based on the column specifications,
165 the mobile phase was a 0.1 M phosphate buffer at a pH of 6.8, with protein concentration evaluated at
166 220 nm using a UV detector. The injection volume was 10 µL and the flowrate was 1 mL/min.
167 LF quantification is based on the method of Bobe et al [43]. A HPLC system with a C18 column
168 (Jupiter 300Å C18) with Solvent A as 100 parts acetonitrile, 900 parts water and 1 part trifluoroacetic
169 acid by volume; and Solvent B as 900 parts acetonitrile, 100 parts water and 1 part trifluoroacetic acid

7
170 by volume was used. Keeping the column temperature at 45 ℃ and sample temperature at 15 ℃. The
171 flow rate was 1 mL/min and the gradient used was 0-2 min, 27%-34% B; 2-18 min, 34%-37% B; 18-
172 23 min, 37% B; 23-30 min, 37%-50% B; 30-40 min, 50%-55% B; 40-45 min, 55%-27% B.
173 Protein physicochemical properties were tested with a Malvern Zetasizer Nano ZS with phase
174 analysis light scattering (PALS). The isoelectric points and mobilities of LF and BSA in pure water and
175 SMUF were determined by PALS, in which the pH titration was performed using 0.1 M KOH and 0.1
176 M HCl solution.
177 SDS-PAGE and Native-PAGE were used to test the size of protein in a denatured state or native
178 state respectively. A CriterionTM cell from Bio-Rad Laboratories Pty., Ltd (NSW, Australia) with
179 specific running buffer, sample buffer, gel and sample preparation method was used. The operation
180 details of SDS-PAGE and Native-PAGE are shown in the Supporting information.
181
182 2.4 EDFM module and running conditions
183 All the EDFM tests are performed on a Gradipore Gradflow BF400 System kindly provided by
184 Memphasys Limited (Sydney, Australia). As shown in Figure 1, the EDFM configuration is composed
185 of one separation membrane, two restriction membranes and a pair of electrodes. The feed solution
186 passes on one side of the membrane, with a buffer solution passing on the permeate side. Restriction
187 membranes are used to allow the passage of ions to conduct the electric current, while preventing the
188 proteins from entering into the electrode compartments. The restriction membranes used here are
189 polyacrylamide (PAm) membranes with MWCO of 5 kDa supplied by Memphasys Limited (Sydney,
190 Australia), or Neosepta cation-exchange membranes (CMB) and anion-exchange membranes (AHA)
191 from Astom Corporation (Tokyo, Japan). The filtration membrane was a PVA membrane prepared in-
192 house as above. All membranes have an active area of 15.6 cm2. Unless otherwise stated, the skin layer
193 (Figure S3) of the membrane faced the feed side. A tank placed inside the BF400 and chilled with iced
194 water was used to maintain the temperature of all solutions at 15 ±1 ℃.
195

8
196
197
198 Figure 1 Schematic of an electrodialysis with filtration membrane (EDFM) approach to the
199 separation of proteins from a feed solution.
200 The electrode solution used in EDUF processes is commonly sodium sulphate [44-46] or sodium
201 chloride[30], replicating the common practice in conventional ED processes. However, in the present
202 case, the electrode solution was prepared from an identical buffer to that of the feed and permeate
203 solution (i.e. either SMUF, SMUF without divalent cations or TRIS-HEPES). This ensures that the feed
204 whey solution is not contaminated with foreign ions such as sulphate due to ion transfer between the
205 feed and electrode chambers, minimises Fickian diffusion of ions and ensures that the pH value of the
206 EDFM system remains stable. One litre of buffer solution was placed in the electrode tank. This solution
207 was continuously re-circulated at a flowrate of 3.4 L/min through both electrode chambers throughout
208 the experiment. Unless otherwise stated, the volume of permeate solution and feed solution was 10 mL.
209 These feed and permeate solutions were re-circulated through the membrane unit at a flowrate of 17
210 mL/min each (crossflow velocity of 3.2 cm/s). A voltage of 100V (~77 V/cm, distance between two
211 electrodes: 1.3 ± 0.1 cm) was applied for 30 min across the membrane stack unless otherwise stated.
212 2.5 Calculation method
213 After the determination of the target protein concentration by HPLC [47, 48], the flux ( ) of 𝐹'
214 each specific protein can be defined as below:
215 Equation 1𝑭' =𝑪𝑷,𝒕 × 𝑽𝑷,𝒕
𝑨 × ∆𝒕
216 where CP,t is the protein concentration in the permeate, is the volume of the permeate solution at 𝑉𝑃,𝑡
217 the end of EDFM process. A is the effective area of the separation membrane and t is the treatment
218 time.
219 The removal rate of a specific protein ( ) from the feed chamber can be defined as:𝑅'

9
220 Equation 2𝑹' =𝑪𝑭,𝟎 × 𝑽𝑭,𝟎 ‒ 𝑪𝑭,𝒕 × 𝑽𝑭,𝒕
𝑨 × ∆𝒕
221 where CF,0 and CF,t refers to the protein concentration in the feed at the beginning and at the end of
222 EDFM process, and are the volume of the feed solution at the beginning and at the end of 𝑉𝐹,0 𝑉𝐹,𝑡
223 EDFM process respectively.
224 The difference between the protein flux and the removal rate from the chamber represents the
225 protein loss due to absorption on or within the membranes (L, in g/m2.h) during the EDFM process
226 and so can be defined as below:
227 Equation 3𝑳 = 𝑭' ‒ 𝑹'
228 This total protein lost in this manner over the full experimental period (P, g/m2) is:
229 Equation 4𝑷 = 𝑳.∆𝒕
230 While the percentage loss (%L) is:
231 Equation 5 %𝑳 =𝑳·𝑨·∆𝒕
𝑪𝑭,𝟎 × 𝑽𝑭,𝟎× 𝟏𝟎𝟎%
232 The water transfer or flux (F) during this process is defined as below:
233 Equation 6𝑭 =𝑽𝑷,𝒕 ‒ 𝑽𝑷,𝟎
𝑨 × ∆𝒕
234 The energy consumption E for removing BSA, α-LA and β-LG from the retentate chamber
235 can be calculated as below:
236 Equation 7𝐄 =𝑼 ∙ ∫𝑰𝒅𝒕
𝒎(𝑩𝑺𝑨 + 𝛂 ‒ 𝐋𝐀 + 𝛃 ‒ 𝐋𝐆)
237
238 where U is the applied voltage (V); I is the measured current (A); (kg) is the 𝑚(𝐵𝑆𝐴 + α ‒ LA + β ‒ LG)
239 total mass of BSA, α-LA and β-LG removed from the feed chamber.
240 2.6 Statistical Analysis
241 A number of experiments were repeated in triplicate, to determine the percentage error in both flux
242 and recovery, as two standard deviations either side of the mean. This percentage error was used to
243 prepare error bars and error margins and to assess whether data was significantly different.

10
244 3. Results and discussion
245 3.1 The physicochemical properties of BSA and LF
246 As aforementioned, the biggest challenge of Ig and LF fractionation is the separation of bovine serum
247 albumin (BSA) and lactoferrin as they have similar size. Proteins are quite sensitive to the solution
248 composition, so it is necessary to investigate the physicochemical properties as a function of this
249 composition.
250 A Native-PAGE analysis of a mixture of Ig (molecular weight: 150~250 kDa), LF (molecular weight:
251 ~78 kDa) and BSA (molecular weight:~66 kDa) made up in SMUF (no Ca2+ and Mg2+) indicated that
252 the lactoferrin was unable to enter into the gel (Figure S1). This is quite different to the results of SDS-
253 PAGE, where surfactant was added to break down protein aggregates (see Figure S2). In this case, the
254 LF bands appear at the same molecular weight (~78 kDa) as expected from the literature [27, 49]. As
255 shown in Table S2, the mobility of LF in the Native-PAGE running buffer is also negative. This
256 confirms that difference between Native-PAGE and SDS-PAGE is the aggregation of lactoferrin
257 molecules to form tetramers (molecular weight ~312 kDa) and aggregates in these solutions [28, 50].
258 Figure 2 shows the mobility of lactoferrin and BSA in different solutions, which again shows that the
259 ions in the solution can affect the mobility of proteins. The isoelectric point of lactoferrin in pure water
260 is consistent with the literature [30, 49, 51]; but both lactoferrin and BSA have a large change in their
261 isoelectric point when dissolved in SMUF. As the composition of SMUF is close to that of whey, the
262 isoelectric points shown in Figure 2 (6.2 for BSA and 5.2 for lactoferrin) are likely to be similar in a
263 whey system. The similarity in these values makes it difficult to separate those two proteins based on
264 their charge.
265

11
266
267
268 Figure 2 The electrophoretic mobility of lactoferrin (LF) and bovine serum albumin (BSA) in pure
269 water and in simulated milk ultrafiltration permeate (SMUF), both with and without divalent cations.
270 The vertical dashed line shows the pH of the SMUF without the divalent cations, while the solid
271 vertical line shows the pH when these are added. The horizontal dashed line shows the isoelectric
272 point (red square: mobility of LF in tris-base buffer; purple circle: mobility of BSA in tris-base buffer)
273 Lactoferrin is clearly very sensitive to the ionic strength of the solution, with the isoelectric point
274 changing from 8.4 to 5.2 when SMUF buffer is used. Further tests showed that this buffer could be
275 diluted up to 85 times before the electrophoretic mobility of LF changed from negative to positive
276 (Figure 3a). This mobility may be affected by the pH change that also occurs during dilution, so separate
277 tests with controlled pH (6.6) were also conducted (see Figure 3 b). The addition of alkali (0.1 M KOH)
278 to control pH increases the conductivity of the diluted solution slightly, which in this case means that
279 the lactoferrin remains negatively charged after dilution of 120 times. This confirms that the lactoferrin
280 will remain negatively charged and aggregated even if an eightfold diluted SMUF is used and/or if there
281 is significant water migration during the EDFM process.
282

12
283
284
285 Figure 3 The conductivity of diluted SMUF and the mobility of lactoferrin (1g/L) in diluted SMUF
286 (a. solutions diluted with water; b. solutions diluted with water, pH maintained at 6.6 using 0.1 M
287 KOH).
288 Based on this mobility test, both BSA and lactoferrin are negatively charged in whey systems. Ig
289 is also known to be negatively charged, with an isoelectric point of ~5.0 regardless of solution
290 composition [2]. Under the influence of an appropriate electrical driving force, a membrane with
291 molecular weight cut-off larger than BSA and smaller than Ig or a tetramer of LF would thus allow
292 these two valuable proteins to be separated from smaller whey proteins.
293 3.2 PVA filtration membrane characterization and optimization
294 3.2.1 Optimization of membrane structure
295 To provide a non-fouling separation membrane of the appropriate pore size (~150 kDa), PVA was
296 used in a phase inversion process. The pore size and composition of these uncrosslinked membranes
297 were optimised by varying the coagulation bath composition (see Supporting Information). These initial
298 experiments concluded that a coagulation bath of 80 to 85 vol% ethanol in water achieved the best BSA
299 flux and BSA/Ig selectivity. The addition of methanol into the bath increased the pore size and thus
300 reduced the BSA/Ig selectivity and so this addition was not considered further.
301 However, these uncrosslinked membranes could be dissolved in hot water even after annealing at 110
302 ℃ for 1 hour. This means that the membrane will not survive prolonged exposure to aqueous solutions
303 even at lower temperatures. The use of thermal treatment to improve water resistance resulted in
304 membranes of smaller pore size [39, 40]. Hence, chemical crosslinking with 0.5% H2SO4 and 1%
305 glutaraldehyde was used as an alternative approach to strengthen the structures. After chemical
306 crosslinking, a slightly greater BSA flux was achieved, but the increase was almost within the error
307 margin, indicating that the crosslinking step had little influence on the membrane pore size (Table 1).
308 The LF flux remained at zero indicating that this membrane retained a significant selectivity between

13
309 LF and BSA. Further experiments confirmed that varying the ethanol concentration within the
310 coagulation bath between 75 and 85% had little impact on these BSA and LF fluxes (see Supporting
311 Information) and so a bath of 80 vol% ethanol was chosen for further study.
312 Table 1 The performance of membranes prepared with an 85 vol% ethanol coagulation bath, after
313 annealing at 110oC for 1h; and after annealing at 110oC for 1h followed by crosslinking with
314 glutaraldehyde (feed solution: 10 mL 1 g/L BSA, Tris-base buffer, 100 V (~77 V/cm), 30 min)
Membrane BSA concentration (g/L)
BSA flux (g·m-
2·h-1)BSA loss (g·m-
2·h-1)Water Transfer
(g·m-2·h-1)No crosslinking 1 11.0±0.5 2.9±0.4 +0.6±0.2
Crosslinking 1 13.2±0.5 1.9±0.3 +1.0±0.3315 (water transfer: “+” means water transfer from permeate chamber to feed chamber)
316 The zeta potential of the membranes after crosslinking is -13± 2 mV (pH=6.5), so the crosslinking
317 induces a negative charge that is similar to that observed in commercial nanofiltration membranes[52].
318 This negative charge reduces the membrane fouling (BSA loss) relative to an uncrosslinked membrane,
319 due to repulsion of the negatively charged BSA from the charged membrane surface (see Table 1).
320 Secondly, under the same voltage, using a crosslinked membrane leads to a higher cell current density
321 than using a membrane with no crosslinking, due to the onset of some water splitting at the high voltages
322 used (See Figure 4). While this will increase the energy requirement for the process somewhat, the
323 water transfer does not increase significantly (Table 1), indicating that electro-osmotic flows should not
324 be of concern.
325
326 Figure 4 the current density of the system when using an uncrosslinked membrane and crosslinked 327 membrane (coagulation bath: 80 vol% ethanol, Feed solution: 10 mL 1 g/L LF, Tris-base, pH=8, 328 Voltage: 100 V (~77 V/cm), 30 min)
329
330

14
331 3.3 Reduction of protein loss due to fouling
332 To reduce the protein loss due to fouling and the energy intensity we reduced the ionic strength of
333 the buffer, by using a diluted SMUF. The LF loss halves from 3.5 g·m-2 ·h-1 (shown in Figure 5) to 1.4
334 g·m-2 ·h-1 (Table 2) under these conditions. This may be because the lower ionic strength provides less
335 screening of the protein and membrane charge (see Figure 3), so that repulsion between these is greater.
336 Further, the absorbed lactoferrin can be readily desorbed when using a 0.5 M NaCl wash for 30 min
337 (0.5/1 M NaCl, pH~7).
338 We also considered the use of ion exchange membranes as restriction membranes, as this is
339 common in EDUF applications[13]. Our earlier work had also indicated that the use of such charged
340 membranes could increase protein recovery by reducing the absorption of charged proteins[53]. When
341 using cation-exchange membranes (CEM) for the restriction membranes, the loss of lactoferrin can be
342 reduced to 0.2 g/m2.hr and again this can be recovered during a saltwater wash (Table 2). Conversely,
343 the use of anion-exchange membranes (AEM) leads to a greater loss of 2.7 g/m2.hr. The positively
344 charged surface of the AEM is attractive for deposition of the negatively charged lactoferrin molecules.
345 Only around half of this absorbed lactoferrin can be desorbed when using a salty water wash.
346
347 Table 2 The recovery rate of LF when using different membranes as restriction membrane (Feed
348 solution: 10 mL 1 g/L LF, ¼ SMUF no Ca2+ and Mg2+, voltage: 50 V (~38 V/cm), time: 30 min)
Membrane
Performance
PAm membrane AEM CEM
LF flux (g·m-2 ·h-1) 0 0 0
(g·m-2 ·h-1) 1.4 ± 0.3 2.7 ± 0.6 0.2 ± 0.1LF loss
(%) 12 ± 3 24 ± 6 1.9 ± 0.4
Wash condition (0.5h) 0.5 M NaCl 0.5 M NaCl 0.5 M NaCl
Recovered (g·m-2 ·h-1) 1.9 ± 0.4 1.5 ± 0.3 0.4 ± 0.1
Water transfer (g) +0.3 ± 0.1 +0.9 ± 0.2 +0.4 ± 0.1
349 (water transfer: “+” means water transfer from permeate chamber to retentate chamber)
350 While not discussed in our prior work[53], the use of ion exchange membranes in place of the
351 neutral PAm, is likely to also cause the onset of greater water splitting, which in turn will result in
352 significantly greater energy demand and higher electro-osmotic flows of water. Indeed, the PAm
353 membranes results in less water transfer than when ion exchange membranes are used (Table 2).
354

15
355 The permselectivity of most commercial ion exchange membranes in dilute salt solutions is between
356 90 and 100 % due to the presence of fixed charge groups[54]. Thus, the transport number of counter
357 ions are 0.9~1 and co-ions have a transport number of 0~0.1. As shown by Długołęcki et al.[55], the
358 limiting current density ( of a membrane can be calculated by Equation 8:𝑖𝑙𝑖𝑚)
359 Equation 8𝑖𝑙𝑖𝑚 =𝐹 ∙ 𝐶𝑏 ∙ 𝐷
𝛿(𝑡 𝑚𝑐𝑜𝑢 ‒ 𝑡 𝑠
𝑐𝑜𝑢)
360 Where F is the Faraday constant, D is the salt diffusion coefficient, is the bulk solution 𝐶𝑏
361 concentration, and is the counter ion transport number in the membrane and solution 𝑡 𝑚𝑐𝑜𝑢 𝑡 𝑠
𝑐𝑜𝑢
362 respectively and is the boundary layer thickness. For ion exchange membranes at the salt solution 𝛿
363 concentrations in ¼ SMUF, the limiting current density is around 5-10 mA/cm2 [55]. Conversely, as
364 the PAm is a neutral hydrogel membrane with a very high water concentration, the values of and 𝑡 𝑚𝑐𝑜𝑢
365 are essentially identical, so that the denominator in the equation above approaches zero and the 𝑡 𝑠𝑐𝑜𝑢
366 limiting current approaches infinity. The utilization of these neutral membranes in the system thus
367 makes it is possible to apply a higher voltage than other EDUF processes without water splitting [30,
368 56].
369 To further investigate the effects of water splitting, a mixture of BSA and LF was used with the
370 different restriction membranes.
371
372
373 Figure 6 The current density for experiments with different restriction membranes treating a mixture
374 of 0.8 g/L BSA and 0.2 g/L LF (feed solution: 40 mL, ¼ SMUF no Ca2+ and Mg2+, pH=8, voltage: 50
375 V (~38 V/cm), time: 40 min).

16
376 The current density of the system with CEMs as restriction membranes is clearly higher than when
377 using the PAm membrane (Figure 6) and exceeds the limiting current density predicted from the
378 literature[55]. Further, in this arrangement, the pH of both the retentate solution and permeate solutions
379 increases substantially from 8.1 to 11.6 and 12.2 respectively (Table 3); at the same time, the pH of the
380 electrode solution is reduced to 3.5. Further, the conductivity of the retentate and permeate solutions
381 increase significantly. The high current density, changes in pH and conductivity all indicate that there
382 is significant water splitting on the surface of the CEM [29, 55]. and that most of the current for the
383 process has been used in water splitting and the resulting ion transfer, consuming energy .
384 The BSA flux obtained in repeat experiments using the CEM restriction membranes was highly
385 variable. Contrary to our prior work[53], there also appeared to be no increase in this flux relative to
386 the use of a PAm restriction membrane. The pH changes observed in our earlier work were much less
387 significant, due to the use of an alternate buffer system. In the present case, the increase in pH above
388 11, is likely to cause deprotonation of the tyrosine residues within BSA, resulting in significant
389 denaturation and loss of secondary structure[60]. This denaturation could cause the BSA to aggregate,
390 preventing permeation. The denaturation was evident during sample analysis, as the BSA could often
391 not be detected using the size exclusion column and the retention time shifted when using a C18 column.
392 Thus, while the use of CEMs may reduce the protein loss, it is not an economical or efficient approach.
Table 3 The pH value of each chamber after treating for 60 min when using different membranes
(feed solution: 40 mL 0.8 g/L + 0.2 g/L LF; ¼ SMUF no Ca2+ and Mg2+, pH=8, voltage: 50 V (~38
V/cm), time: 60 min)
Retentate solution Permeate solution Electrode solutionRestriction
Membranes
Separation
Membranes pH Cond.
(ms/cm)
pH Cond.
(ms/cm)
pH Cond.
(ms/cm)
Initial value 8.1±0.4 1.9±0.1 8.1±0.4 1.7±0.1 8.1±0.4 1.7±0.1
PAm Crosslinked
PVA
7.6±0.5 0.77±0.03 7.9±0.6 3.3±0.2 8.2±0.6 1.7±0.1
PAm Uncrosslinked
PVA
7.7±0.5 0.94±0.05 8.1±0.6 3.1±0.2 7.9±0.6 2.0±0.2
CEM Crosslinked
PVA
11.6±0.1 5.8±0.6 12.2±0.1 47±4 3.5±0.1 1.1±0.1
The chemical crosslinking of the PVA separation membrane also results in this membrane gaining
some charge. For this reason, the use of an uncrosslinked separation membrane was also tested under
these conditions. As shown in Table 3, the change of pH and conductivity of each chamber is much
smaller when the separation membrane is changed in this manner, indicating that water splitting is much

17
less significant. A process with PAm restriction membranes and a crosslinked PVA separation
membrane, coupled with a cleaning process to recover adsorbed protein appears to be the best option.
3.4 Whey protein isolate (WPI) treatment
The optimized process was then used in the treatment of a model whey system. This model whey was
prepared from commercial whey protein isolate powder, which is free of salts. Feed solutions with a
protein composition similar to that of whey were prepared by combining 6.5 g/L WPI, 0.2 g/L LF, 0.4
g/L BSA, 0.5 g/L Ig. The conductivity may affect the protein removal rate and protein loss of this
process, so feed solutions with 4 times diluted SMUF (no Ca2+ and Mg2+) and 8 times diluted SMUF
(no Ca2+ and Mg2+) at a pH of 8 were compared. These dilutions are indicative of partially demineralised
and de-ionised whey, a common intermediate in dairy processing operations.
Owing to its lower electrical resistance, the process with 4 times diluted SMUF (no Ca2+, Mg2+)
initially offers a higher protein removal rate than the process with 8 times diluted SMUF (no Ca2+,
Mg2+) (see Figure 7). For this process, nearly half of the total protein in the feed solution has been
moved to the permeate after 60 minutes of treatment. As the permeate solution is being recycled, at this
point the concentration of protein in the permeate becomes higher than that in the feed solution. This
results in a significant back diffusion of protein into the feed chamber due to Fick’s Law, as also
observed in conventional ED processes [61]. This dynamic balance between the electrical and
diffusional driving forces means that the concentration of protein in both feed solutions begins to
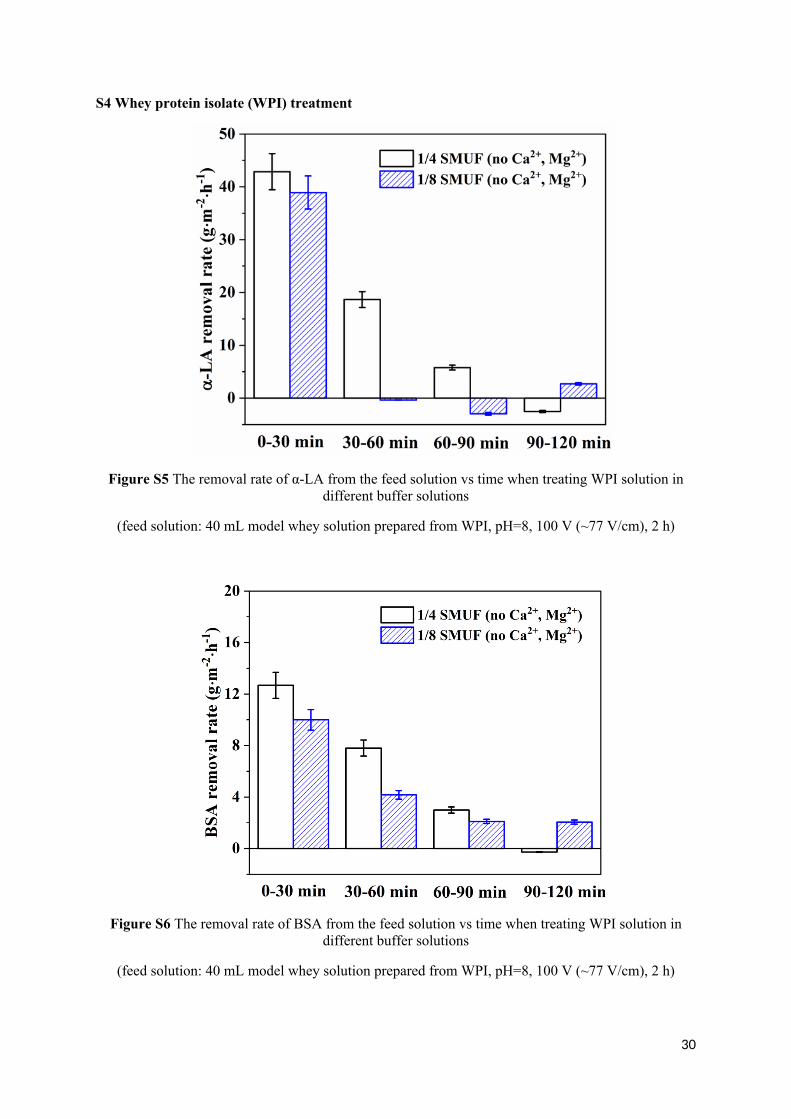
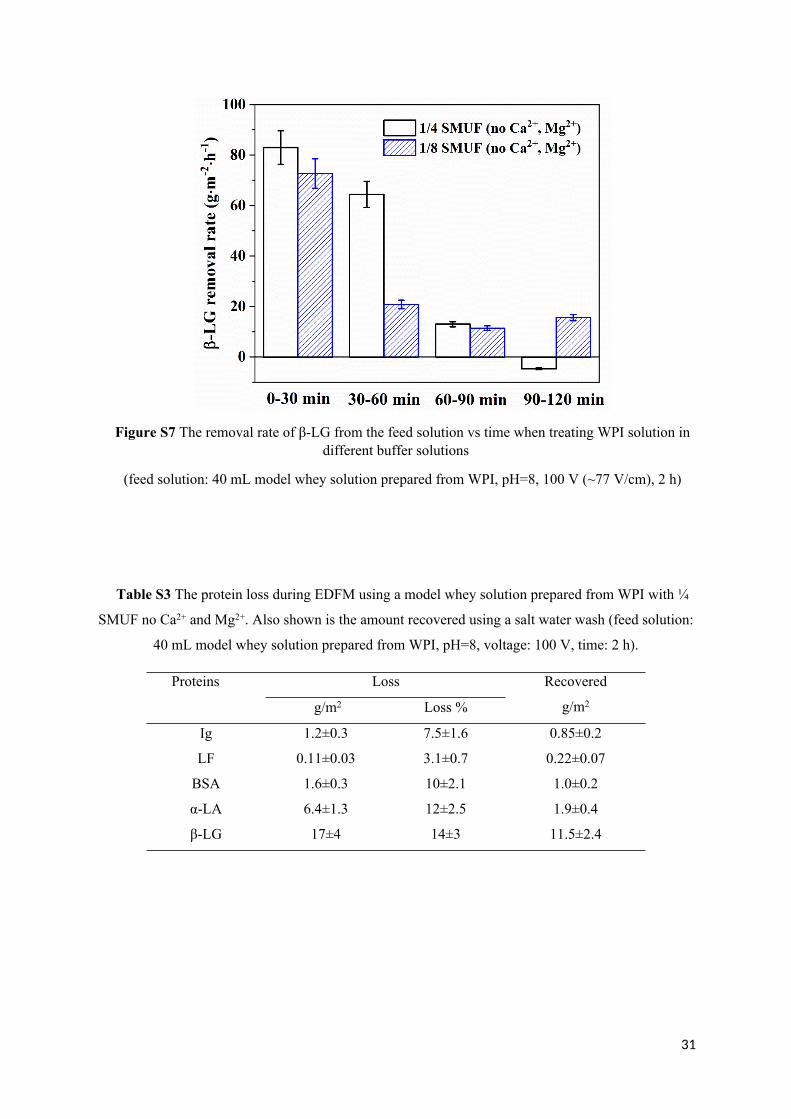
stabilise after 60 minutes of treatment and further treatment is ineffective. As shown in Figure S5-S7,
the removal rate of individual proteins also shows the same trend, with α-lactalbumin particularly
affected due to its lower isoelectric point (4.5~4.8) and smaller molecular size (14.2 kDa) [2] compared
with other whey proteins (Figure S5). In industrial practice, this issue would be overcome by increasing
the permeate/feed volume ratio, or by avoiding a permeate recycle and instead using a continuous
counter current operation. Conversely the protein transfer for the case with 1/8 SMUF was slower so in
the timescale of this experiment it did not reach a dynamic balance.
18
Figure 7 The amount of total protein (α-LA+β-LG+BSA) vs time in the feed/permeate chamber
when using (a) ¼ SMUF and (b) 1/8 SMUF as buffer solution (feed solution: 40 mL model whey
solution prepared from WPI, pH=8, voltage: 100 V (~77 V/cm), time: 2 h).
As shown in Figure 8, the process can realize the isolation of LF and Ig from BSA, α-LA and β-
LG in the period before this dynamic balance is reached, with the flux of β-LG over twenty times that
of Ig. The protein composition of the retentate chamber shows the steady migration of the smaller
proteins (BSA, α-LA and β-LG) (see Figure 9) into the permeate, leading to an increasing proportion
of LF/Ig in the retentate chamber. Given the small membrane area and the buildup of protein in the
permeate solution, pure protein solutions cannot be obtained within the timescale of the experiment.
However, it is anticipated that if permeate recycling is avoided and a larger membrane area is used that
a retentate of pure Ig and LF can be obtained.

19
Figure 8 The flux of different whey proteins based on a 1-hour experiment using a model whey
solution prepared from WPI (feed solution: 40 mL model whey solution prepared from WPI; ¼
SMUF (no Ca2+, Mg2+) pH=8, voltage: 100 V (~77 V/cm), time: 1 h).
Figure 9 The composition of retentate solution vs operating time using a model whey solution
prepared from WPI (feed solution: 40 mL model whey solution prepared from WPI; ¼ SMUF (no
Ca2+, Mg2+), pH=8, voltage: 100 V (~77 V/cm), time: 1 h).
The protein loss due to fouling with different buffer solutions was also tested. With a ¼ SMUF (no
Ca2+, Mg2+) buffer, the loss of alpha-lactalbumin and beta-lactoglobulin over two hours is highest
(6.4±1.3 and 17±4 g/m2 respectively, or 12-14%) (see Table S-3) due to their smaller size which can
readily be accommodated within the membrane structure. The loss of the more valuable LF and Ig is
smaller both in absolute and percentage terms (Figure 10 and Table S-3). The process with 4 times
diluted SMUF (no Ca2+, Mg2+) buffer results in significantly less loss of LF compared to the one with
8 times diluted SMUF (no Ca2+, Mg2+). It may be that at the eightfold dilution, the LF may no longer

20
be present entirely as tetramers or aggregates, with monomers or dimers penetrating the membrane
structure and adsorbing within the porous support. As shown in Figure 10 (a), the washing process can
only recover some of the LF that is adsorbed during the use of an eightfold dilution. The Ig loss during
both processes is greater than the LF loss both because it is present in the feed solution at a higher
concentration and because its lower molecular weight may mean that it can pass through larger pores
within the separation membrane and adsorb within the porous support. Again, only a proportion of this
Ig can be recovered during a wash step.
Figure 10 The LF/Ig loss/recovered of processes using a model whey solution prepared from WPI
with different buffer solutions. (feed solution: 40 mL model whey solution prepared from WPI, pH=8,
voltage: 100 V (~77 V/cm), time: 2 h).
As aforementioned, using 4 times diluted SMUF (no Ca2+, Mg2+) as buffer solution gives a higher
protein transfer rate and lower LF loss, but the energy consumption of this process also should be
investigated. Due to its lower ionic concentrations, the feed solution with 1/8 SMUF has less ions
transferred (i.e. less current) in the first 30 minutes and thus the energy consumption is lower both in
absolute terms (43 versus 67 W) and per kg of protein (BSA, α-LA and β-LG) removed from the
retentate chamber (250 versus 345 kWh/kg). The range of energy consumption generally observed in
EDUF/EDFM is 130~25000 kWh/kg [30, 44, 45], so these results are within the range of other reported
EDFM processes. Beyond 30 minutes, the ion concentrations in the retentate chamber decrease for both
SMUF concentrations, reducing the current, which leads to a lower absolute energy consumption.
However, due to back diffusion of protein from the permeate chamber, the energy consumption per kg
of protein removed increases to an unsustainable level. In an industrial process, a once through mode
or changes to the permeate/feed volume ratio would reduce this back diffusion and thus keep the energy
demand to a realistic level.

21
4. Conclusion
The biggest challenge of Ig and lactoferrin fractionation is the separation of BSA and lactoferrin.
In the present case, this is achieved by the aggregation of lactoferrin in a salty buffer, such as that
available naturally in whey The solution containing the aggregated lactoferrin and other dairy proteins
can then be passed through an electrodialysis with ultrafiltration process, where the smaller proteins,
characterised here by BSA, can pass through, while the larger LF aggregates and Ig are retained.
In this article, asymmetric PVA filtration membranes prepared by a phase inversion method were
used as the ultrafiltration separation method. Chemical crosslinking was used to provide structural
resistance. Further, for a process with a negatively charged target protein, this chemical crosslinking
method reduced the extent of membrane fouling, by inducing a negative charge. To counteract this, the
negative charge induces a small amount of water splitting, which increased energy demand and water
transfer.
To achieve a high recovery rate for target proteins, neutral polyacrylaminde membranes were most
effective as restriction membranes. Protein loss was also minimised by using a whey solution of lower
ionic strength, which can be readily achieved through the partial demineralisation of the whey. Further,
a washing process with a simple salt solution was able to recover the residual protein deposit. A partially
deionised whey of fourfold reduced total salt concentration and depleted in divalent ions provides a
high protein removal rate and low Ig/LF loss. However, the use of a whey with lower salt concentration
(diluted eightfold) leads to a lower energy consumption, as fewer ions must be moved. To reduce the
energy consumption and to achieve higher product purity, back diffusion of protein must be avoided,
by maintaining the permeate protein concentration below that of the feed. In practice, this could possibly
be achieved by once through countercurrent operation, or by varying the permeate to feed volume ratio.
The process shows good selectivity between Ig/LF and other whey proteins.
At this point, the largest feed volume we have tested is only 40 mL and the effective area of our
device is only 15.6 cm2. Further work is required to scale up such a device to investigate if a product
with a greater percentage of Ig and LF can be obtained. It is established that EDUF processes are highly
effective in separating large molecules with biological activity [30, 46, 62]. Further, the approach uses
no solvents or other chemicals that can add to the environmental footprint of the operation [63]. Hence,
there is an incentive to further develop the process to make it suitable for the separation/fractionation
of charged molecules of large size.
22
AUTHOR INFORMATION
*Corresponding author. Prof. S. E. Kentish, Tel: +61 3 8344 6682; Fax: +61 3 8344 6682; E-mail:
[email protected] (S. E. Kentish)
ACKNOWLEDGMENTS
This work was supported by the Australian Research Council’s Industrial Transformation Research Program (ITRP) funding scheme (Project Number IH120100005), Q. Wang acknowledges the University of Melbourne for a Melbourne Research Scholarship. We also acknowledge the generous donation of the EDUF apparatus by Memphasys Ltd.

23
References:
[1] S. Ganju, P.R. Gogate, A review on approaches for efficient recovery of whey proteins from dairy industry effluents, Journal of Food Engineering, 215 (2017) 84-96.[2] R. Aguero, E. Bringas, M. San Roman, I. Ortiz, R. Ibanez, Membrane Processes for Whey Proteins Separation and Purification. A Review, Current Organic Chemistry, 21 (2017) 1740-1752.[3] R. Božanić, I. Barukčić, K. Lisak, Possibilities of whey utilisation, Austin Journal of Nutrition and Food Sciences, 2 (2014) 1036.[4] A. Arunkumar, M.R. Etzel, Fractionation of alpha-lactalbumin and beta-lactoglobulin from bovine milk serum using staged, positively charged, tangential flow ultrafiltration membranes, Journal of Membrane Science, 454 (2014) 488-495.[5] L. Bazinet, J. Amiot, J.-F. Poulin, D. Labbe, A. Tremblay, Process and system for separation of organic charged compounds, WO 2005/082495A1, (2005).[6] M.-E. Langevin, C. Roblet, C. Moresoli, C. Ramassamy, L. Bazinet, Comparative application of pressure-and electrically-driven membrane processes for isolation of bioactive peptides from soy protein hydrolysate, Journal of Membrane Science, 403 (2012) 15-24.[7] N. Lawrence, S. Kentish, A. O’Connor, A. Barber, G. Stevens, Microfiltration of skim milk using polymeric membranes for casein concentrate manufacture, Separation and Purification Technology, 60 (2008) 237-244.[8] J.-F. Poulin, J. Amiot, L. Bazinet, Simultaneous separation of acid and basic bioactive peptides by electrodialysis with ultrafiltration membrane, Journal of Biotechnology, 123 (2006) 314-328.[9] J. Margolis, Electrophoretic method for preparative separation of charged molecules in liquids, WO 1988/007406 A1, (1988).[10] D. Ogle, G. Vigh, D. Rylatt, Multi-port separation apparatus and method, WO 2002/028516 A1, (2002).[11] D. Ogle, A. Ho, T. Gibson, D. Rylatt, E. Shave, P. Lim, G. Vigh, Preparative-scale isoelectric trapping separations using a modified Gradiflow unit, Journal of Chromatography A, 979 (2002) 155-161.[12] Z.S. Horvath, G.L. Corthals, C.W. Wrigley, J. Margolis, Multifunctional apparatus for electrokinetic processing of proteins, Electrophoresis, 15 (1994) 968-971.[13] L. Bazinet, J. Amiot, J.-F. POULIN, D. LABBÉ, D. Tremblay, Process and system for separation of organic charged compounds WO 2005/082495 A1, (2005).[14] M. Aider, S. Brunet, L. Bazinet, Effect of pH and cell configuration on the selective and specific electrodialytic separation of chitosan oligomers, Separation and Purification Technology, 63 (2008) 612-619.[15] M. Aider, S. Brunet, L. Bazinet, Electroseparation of chitosan oligomers by electrodialysis with ultrafiltration membrane (EDUF) and impact on electrodialytic parameters, Journal of Membrane Science, 309 (2008) 222-232.[16] L. Bazinet, Y. DeGrandpré, A. Porter, Electromigration of tobacco polyphenols, Separation and Purification Technology, 41 (2005) 101-107.[17] D. Labbé, M. Araya-Farias, A. Tremblay, L. Bazinet, Electromigration feasibility of green tea catechins, Journal of Membrane Science, 254 (2005) 101-109.[18] E. Husson, M. Araya-Farias, Y. Desjardins, L. Bazinet, Selective anthocyanins enrichment of cranberry juice by electrodialysis with ultrafiltration membranes stacked, Innovative Food Science & Emerging Technologies, 17 (2013) 153-162.[19] J. Billakanti, Extraction of High-Value Minor Proteins from Milk(Ph.D. dissertation), University of Canterbury (2009).[20] M.J. Playne, L. Bennett, G. Smithers, Functional dairy foods and ingredients, Australian Journal of Dairy Technology, 58 (2003) 242-264.[21] B. Van der Strate, L. Beljaars, G. Molema, M. Harmsen, D. Meijer, Antiviral activities of lactoferrin, Antiviral research, 52 (2001) 225-239.[22] L.H. Vorland, Lactoferrin: a multifunctional glycoprotein, Apmis, 107 (1999) 971-981.[23] Y.-C. Yoo, S. Watanabe, R. Watanabe, K. Hata, K.-i. Shimazaki, I. Azuma, Bovine Lactoferrin and Lactoferricin TM Inhibit Tumor Metastasis in Mice, in: Advances in Lactoferrin Research, Springer, 1998, pp. 285-291.

24
[24] D. Legrand, E. Elass, A. Pierce, J. Mazurier, Lactoferrin and host defence: an overview of its immuno-modulating and anti-inflammatory properties, Biometals, 17 (2004) 225-229.[25] E.-M. Lilius, P. Marnila, The role of colostral antibodies in prevention of microbial infections, Current Opinion in Infectious Diseases, 14 (2001) 295-300.[26] V. Valiño, M.F. San Román, R. Ibañez, I. Ortiz, Improved separation of bovine serum albumin and lactoferrin mixtures using charged ultrafiltration membranes, Separation and Purification Technology, 125 (2014) 163-169.[27] I. Mela, E. Aumaitre, A.-M. Williamson, G.E. Yakubov, Charge reversal by salt-induced aggregation in aqueous lactoferrin solutions, Colloids and Surfaces B: Biointerfaces, 78 (2010) 53-60.[28] R.M. Bennett, G.C. Bagby, J. Davis, Calcium-dependent polymerization of lactoferrin, Biochemical and Biophysical Research Communications, 101 (1981) 88-95.[29] R. Jenness, Preparation and properties of a salt solution which simulates milk ultrafiltrate, Netherlands Milk and Dairy Journal, 16 (1962) 153-164.[30] N. Ndiaye, Y. Pouliot, L. Saucier, L. Beaulieu, L. Bazinet, Electroseparation of bovine lactoferrin from model and whey solutions, Separation and Purification Technology, 74 (2010) 93-99.[31] H. Nur, M. Van Koeverden, S.E. Kentish, Biocompatible Polymeric Membranes, in: A.P. Office (Ed.), 2017.[32] B. Bolto, T. Tran, M. Hoang, Z. Xie, Crosslinked poly (vinyl alcohol) membranes, Progress in Polymer Science, 34 (2009) 969-981.[33] X. Wang, M. Zhou, X. Meng, L. Wang, D. Huang, Effect of protein on PVDF ultrafiltration membrane fouling behavior under different pH conditions: interface adhesion force and XDLVO theory analysis, Frontiers of Environmental Science & Engineering, 10 (2016) 12.[34] Y. Zhang, H. Li, H. Li, R. Li, C. Xiao, Preparation and characterization of modified polyvinyl alcohol ultrafiltration membranes, Desalination, 192 (2006) 214-223.[35] A. Amanda, S.K. Mallapragada, Comparison of protein fouling on heat-treated poly(vinyl alcohol), poly(ether sulfone) and regenerated cellulose membranes using diffuse reflectance infrared Fourier transform spectroscopy, Biotechnology Progress, 17 (2001) 917-923.[36] W.Y. Chuang, T.H. Young, W.Y. Chiu, C.Y. Lin, The effect of polymeric additives on the structure and permeability of poly(vinyl alcohol) asymmetric membranes, Polymer, 41 (2000) 5633-5641.[37] X. He, C. Chen, Z. Jiang, Y. Su, Computer simulation of formation of polymeric ultrafiltration membrane via immersion precipitation, Journal of Membrane Science, 371 (2011) 108-116.[38] A. Ahmad, N. Yusuf, B. Ooi, Preparation and modification of poly (vinyl) alcohol membrane: Effect of crosslinking time towards its morphology, Desalination, 287 (2012) 35-40.[39] M.G. Katz, T. Wydeven Jr, Selective permeability of PVA membranes. II. Heat‐treated membranes, Journal of Applied Polymer Science, 27 (1982) 79-87.[40] H. Bodugoz-Senturk, J. Choi, E. Oral, J.H. Kung, C.E. Macias, G. Braithwaite, O.K. Muratoglu, The effect of polyethylene glycol on the stability of pores in polyvinyl alcohol hydrogels during annealing, Biomaterials, 29 (2008) 141-149.[41] G. Mukherjee, Modification of poly (vinyl alcohol) for improvement of mechanical strength and moisture resistance, Journal of Materials Science, 40 (2005) 3017-3019.[42] B. Han, J. Li, C. Chen, C. Xu, S. Wickramasinghe, Effects of degree of formaldehyde acetal treatment and maleic acid crosslinking on solubility and diffusivity of water in PVA membranes, Chemical Engineering Research and Design, 81 (2003) 1385-1392.[43] G. Bobe, D.C. Beitz, A.E. Freeman, G.L. Lindberg, Separation and quantification of bovine milk proteins by reversed-phase high-performance liquid chromatography, Journal of Agricultural and Food Chemistry, 46 (1998) 458-463.[44] S. Suwal, C. Roblet, J. Amiot, A. Doyen, L. Beaulieu, J. Legault, L. Bazinet, Recovery of valuable peptides from marine protein hydrolysate by electrodialysis with ultrafiltration membrane: impact of ionic strength, Food Research International, 65 (2014) 407-415.[45] V.K. Noudou, S. Suwal, J. Amiot, S. Mikhaylin, L. Beaulieu, L. Bazinet, Simultaneous electroseparation of anionic and cationic peptides: Impact of feed peptide concentration on migration rate, selectivity and relative energy consumption, Separation and Purification Technology, 157 (2016) 53-59.

25
[46] A. Doyen, C.C. Udenigwe, P.L. Mitchell, A. Marette, R.E. Aluko, L. Bazinet, Anti-diabetic and antihypertensive activities of two flaxseed protein hydrolysate fractions revealed following their simultaneous separation by electrodialysis with ultrafiltration membranes, Food chemistry, 145 (2014) 66-76.[47] K.P. Palmano, D.F. Elgar, Detection and quantitation of lactoferrin in bovine whey samples by reversed-phase high-performance liquid chromatography on polystyrene–divinylbenzene, Journal of Chromatography A, 947 (2002) 307-311.[48] J.J. Pesek, M.T. Matyska, J.P. Venkat, Evaluation of protein, peptide, and amino acid retention on C5 hydride-based stationary phases, Journal of Separation Science, 31 (2008) 2560-2566.[49] V. Valiño, M.F. San Román, R. Ibáñez, J.M. Benito, I. Escudero, I. Ortiz, Accurate determination of key surface properties that determine the efficient separation of bovine milk BSA and LF proteins, Separation and Purification Technology, 135 (2014) 145-157.[50] B. Chaufer, M. Rabiller-Baudry, D. Lucas, F. Michel, M. Timmer, Selective extraction of lysozyme from a mixture with lactoferrin by ultrafiltration. Role of The Physico-chemical Environment, Le Lait, 80 (2000) 197-203.[51] G. Brisson, M. Britten, Y. Pouliot, Electrically-enhanced crossflow microfiltration for separation of lactoferrin from whey protein mixtures, Journal of Membrane Science, 297 (2007) 206-216.[52] G. Rice, A.R. Barber, A.J. O'Connor, A. Pihlajamaki, M. Nystrom, G.W. Stevens, S.E. Kentish, The influence of dairy salts on nanofiltration membrane charge, Journal of Food Engineering, 107 (2011) 164-172.[53] H. Deng, G.Q. Chen, S.L. Gras, S.E. Kentish, The effect of restriction membranes on mass transfer in an electrodialysis with filtration membrane process, Journal of Membrane Science, 526 (2017) 429-436.[54] R. Simons, Electric field effects on proton transfer between ionizable groups and water in ion exchange membranes, Electrochimica Acta, 29 (1984) 151-158.[55] P. Długołęcki, B. Anet, S.J. Metz, K. Nijmeijer, M. Wessling, Transport limitations in ion exchange membranes at low salt concentrations, Journal of Membrane Science, 346 (2010) 163-171.[56] G. Chen, W. Song, B. Qi, J. Li, R. Ghosh, Y. Wan, Separation of protein mixtures by an integrated electro-ultrafiltration-electrodialysis process, Separation and Purification Technology, 147 (2015) 32-43.[57] H.-J. Lee, H. Strathmann, S.-H. Moon, Determination of the limiting current density in electrodialysis desalination as an empirical function of linear velocity, Desalination, 190 (2006) 43-50.[58] H.-J. Lee, F. Sarfert, H. Strathmann, S.-H. Moon, Designing of an electrodialysis desalination plant, Desalination, 142 (2002) 267-286.[59] R. Simons, The origin and elimination of water splitting in ion exchange membranes during water demineralisation by electrodialysis, Desalination, 28 (1979) 41-42.[60] B. Ahmad, M.Z. Kamal, R.H. Khan, Alkali-induced conformational transition in different domains of bovine serum albumin, Protein and Peptide Letters, 11 (2004) 307-315.[61] M. Turek, Cost effective electrodialytic seawater desalination, Desalination, 153 (2003) 371-376.[62] R. He, A.T. Girgih, E. Rozoy, L. Bazinet, X.-R. Ju, R.E. Aluko, Selective separation and concentration of antihypertensive peptides from rapeseed protein hydrolysate by electrodialysis with ultrafiltration membranes, Food Chemistry, 197 (2016) 1008-1014.[63] R. Durand, E. Fraboulet, A. Marette, L. Bazinet, Simultaneous double cationic and anionic molecule separation from herring milt hydrolysate and impact on resulting fraction bioactivities, Separation and Purification Technology, 210 (2019) 431-441.

26
Supporting information:
S1. Composition of Simulated Milk Ultrafiltrate (SMUF) buffer
The simulated milk ultrafiltrate (SMUF) was prepared as shown in Table 1
Table S1. Compositions of SMUF buffer [29]
Composition (mg/100 mL)
Ingredient Weight Na K Ca Mg P Cl Citrate as
citrate acid
SO4 CO2
KH2PO4 1.58 45.4 36.0
K3citrate·H2O 1.20 43.4 70.0
Na3citrate·5H2O 2.12 42.0 115
K2SO4 0.18 8.0 9.9
CaCl2·2H2O 1.32 35.9 63.8
MgCl2·6H2O 0.65 7.8 22.7
K2CO3 0.30 17.0 9.5
KCl 0.60 31.4 28.5
KOH to pH 6.6 2.25 8.0
mg/100 mL 42.0 154.0 35.9 7.8 36.0 115.0 185.1 9.9 9.5Total
mM/L 18.3 39.4 9.0 3.2 11.6 32.4 9.6 1.0 2.2
S2. Polyacrylamide Gel Electrophoresis (PAGE)
Native-PAGE and SDS-PAGE were used to determine the size of native and denatured proteins
respectively. All reagents for SDS-Page and Native-Page are purchased from Bio-Rad Laboratories Pty.,
Ltd (NSW, Australia). For native-page, a CriterionTM TGXTM Precast gel with a gel percentage of 8%-
16% and 18 wells was used; the running buffer was 10×Tris/glycine buffer (before dilution: 25 mM
Tris, 192 mM glyclne, pH 8.3) which was diluted 10 times before use; the sample buffer was 62.5 mM
tris-HCl, pH 6.8, 40% (v/v) glycerol and 0.01% bromophenol. For SDS-PAGE, a CriterionTM TGXTM
Precast gel with a gel percentage of 4%-20% and 18 wells was used; the running buffer was
10×Tris/glycine/SDS buffer (before dilution: 25 mM Tris, 192 mM glyclne,0.1% SDS, pH 8.3) which
was diluted 10 times before use. The sample buffer was laemmli sample buffer with 65.8 mM tris-HCl,
pH 6.8, 2.1% SDS, 26.3%(W/V) glycerol, 0.01 bromophenol, which would mix with loading solution
with a ratio of 1:1. For both SDS-PAGE and Native-PAGE, Bio-SafeTM Coomassie G-250 stain was
used.

27
Figure S1 the Native PAGE test result of Ig, LF and BSA (Channels 1 and 2 are for a feed of 1 g/L Ig; Channels 4 and 5 are for 1 g/L of Lactoferrin, Channels 7 and 8 are for 1 g/L of BSA, Channel 10
provides molecular weight standards)
Figure S2 the SDS PAGE test result of LF and BSA (Channels 1 and 2 are for a mixture of 0.1 g/L LF +0.4 g/L BSA; Channels 3 and 4 are for 0.2 g/L LF +0.8 g/L BSA, Channels 5 and 6 are for 0.25
g/L of LF, Channels7 and 8 are for 0.5 g/L of LF, Channels 9 and 10 are for 0.75 g/L of LF, Channels 11 and 12 are for 1 g/L of LF, Channel 14 provides molecular weight standards)
To confirm that the LF is restricted from the Native-PAGE gel by its size, rather than charge, its
mobility in a Native PAGE running buffer was investigated using the Malvern Zetasizer NanoZS. As
shown in Table S2, although the mobility of lactoferrin is affected by its concentration, it remains
negatively charged in the running buffer.
Table S2 the mobility of lactoferrin in the Native PAGE running buffer
LF concentration (g/L) 1 0.1Mobility (×10-8 m2V-1S-1)) -0.23 ± 0.06 -0.08 ± 0.02

28
S3. Characterization of PVA uncrosslinked membranes
The PVA filtration membrane made here is a hydrophilic membrane with a water content of 0.78±0.01
(g water/g swollen membrane) and thickness of 170 ±3 μm. Cryo-SEM and BSA/Ig flux tests were
performed to understand its structure and pore size.
As shown in Figure S3, the PVA membrane is asymmetric with a skin layer of thickness ~5 μm. The
skin layer is always orientated to the feed side to reduce protein loss.
Figure S3 Cryo-SEM image of PVA filtration membrane (80 vol% of EtOH)
For filtration membranes prepared by phase inversion method, the pore size and structure are affected
by the rate of antisolvent diffusion within the coagulation bath. A high concentration of ethanol relative
to water corresponds to a rapid phase inversion which can cause a larger pore size but may also lead to
shrinkage during the drying process which can make the membrane pore size become smaller. Adding
methanol to the coagulation bath can also change the membrane morphology since methanol has a
greater diffusion coefficient in water.
Based on our preliminary test, changing the ratio of ethanol and methanol in the coagulation bath
while keeping the water content constant (15 vol%) had little impact on the flux of BSA. However, the
flux of the larger Ig protein decreased significantly with a decrease in methanol content. Hence it was
decided to focus only on coagulation baths of ethanol/water mixtures.
Increasing the relative proportion of ethanol in the coagulant bath led to a small decline in BSA flux
and a more substantial decline in the Ig flux (Figure S4). All of the PVA filtration membranes had a
lower flux of Ig than the commercial PAm reference membrane (6.2 g·m-2·h-1) but comparable in BSA
flux indicating a molecular weight cut-off below 250 kDa but well above that of BSA (69 kDa). The
highest BSA flux is achieved when the proportion of ethanol is 80 vol%, (33.3 g·m-2·h-1) while the
greatest selectivity occurs at 85 vol%. The BSA flux (33.1 g·m-2·h-1) of this membrane is also higher

29
than the value of the reference membrane (31.8 g·m-2·h-1). This indicates that a coagulant bath with an
ethanol proportion between 80% and 85% should provide the best results for this uncrosslinked system.
Figure S4 Ig Flux and BSA flux of membranes with different coagulant bath (Ethanol: H2O). (Feed solution: 10 mL 3 g/L BSA, Tris-base, pH=8, Voltage: 100 V, time: 30 min)
It should be noted that the BSA flux shown in Figures S4 are approximately three times greater than
that shown in Table 1 for an uncrosslinked membrane (11.0±0.8 g·m-2·h-1) because these experiments
used a feed solution with a threefold higher BSA concentration (3 versus 1 mg/mL).
30
S4 Whey protein isolate (WPI) treatment
Figure S5 The removal rate of α-LA from the feed solution vs time when treating WPI solution in different buffer solutions
(feed solution: 40 mL model whey solution prepared from WPI, pH=8, 100 V (~77 V/cm), 2 h)
Figure S6 The removal rate of BSA from the feed solution vs time when treating WPI solution in different buffer solutions
(feed solution: 40 mL model whey solution prepared from WPI, pH=8, 100 V (~77 V/cm), 2 h)
31
Figure S7 The removal rate of β-LG from the feed solution vs time when treating WPI solution in different buffer solutions
(feed solution: 40 mL model whey solution prepared from WPI, pH=8, 100 V (~77 V/cm), 2 h)
Table S3 The protein loss during EDFM using a model whey solution prepared from WPI with ¼
SMUF no Ca2+ and Mg2+. Also shown is the amount recovered using a salt water wash (feed solution:
40 mL model whey solution prepared from WPI, pH=8, voltage: 100 V, time: 2 h).
Loss Proteins
g/m2 Loss %
Recovered
g/m2
Ig 1.2±0.3 7.5±1.6 0.85±0.2
LF 0.11±0.03 3.1±0.7 0.22±0.07
BSA 1.6±0.3 10±2.1 1.0±0.2
α-LA 6.4±1.3 12±2.5 1.9±0.4
β-LG 17±4 14±3 11.5±2.4
Minerva Access is the Institutional Repository of The University of Melbourne
Author/s:
Wang, Q; Chen, GQ; Kentish, SE
Title:
Isolation of lactoferrin and immunoglobulins from dairy whey by an electrodialysis with
filtration membrane process
Date:
2020-02-15
Citation:
Wang, Q., Chen, G. Q. & Kentish, S. E. (2020). Isolation of lactoferrin and immunoglobulins
from dairy whey by an electrodialysis with filtration membrane process. Separation and
Purification Technology, 233, https://doi.org/10.1016/j.seppur.2019.115987.
Persistent Link:
http://hdl.handle.net/11343/230664
File Description:
Submitted version