Embed Size (px)
Citation preview

Appendix No.2
OUTLINES OF MEERUT BASED ON NCR PLAN AND MASTER PLAN
1. NATIONAL CAPITAL REGION
National Capital Region was created by Parliamentary Act of 1985, covering an area of 30,242 Sq.kms. as per the 2001 plan which has been increased to 33,578 Sq.kms. in 2021 plan. NCR includes part of U.P., Haryana, Rajasthan and N.C.T. Delhi.
The Regional Plan 2021 for National Capital Region has been prepared and notified on 17.09.05 under section-13 of National Capital Region Planning Board Act, 1985. Main features of the Regional Plan 2021 and the copy of the NCR PB Act, 1985 are available at Meerut Development Authority.
2. CONCERN MAPS OF NCR TO BE USED FOR PLANNNING OF A ZONE OF ANY METRO CITY OF NCR; LIKE MEERUT
1. Regional Plan of NCR-Sub Region U.P. 2021 AD (Physiography and slope)
(Appendix no.3)2. Regional Plan of NCR-Sub Region U.P. 2021 AD
(Lithology)
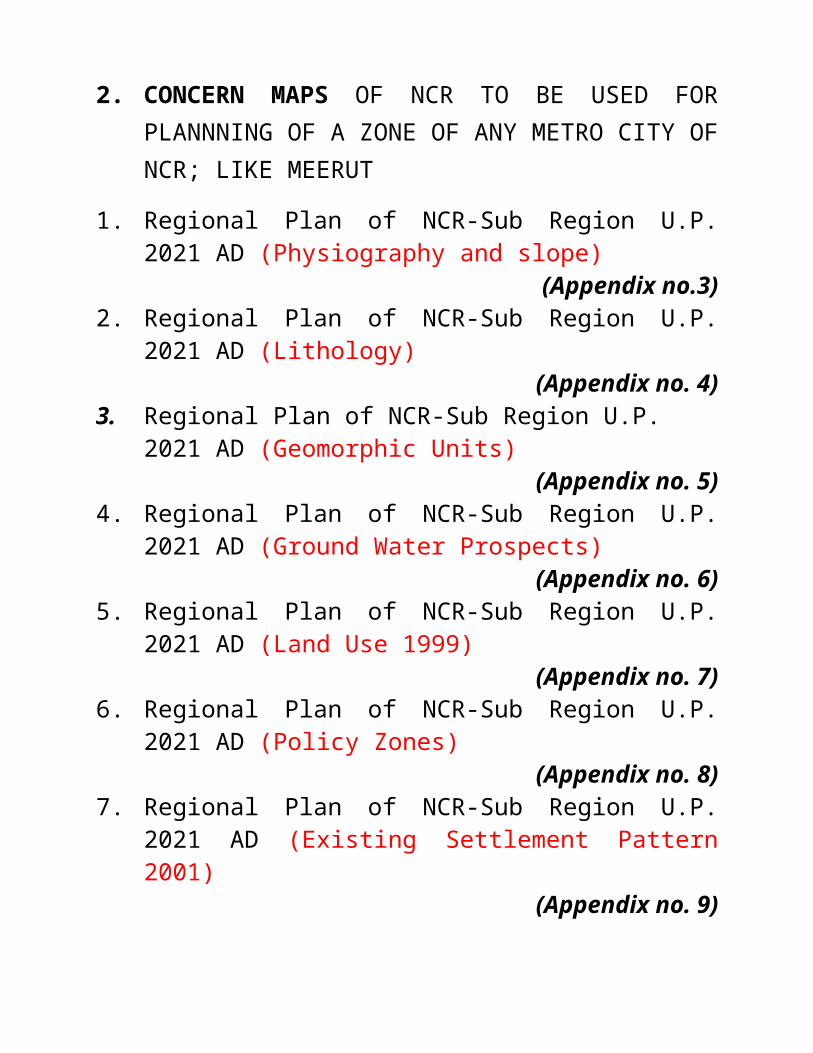
(Appendix no. 4)3. Regional Plan of NCR-Sub Region U.P. 2021 AD
(Geomorphic Units)(Appendix no. 5)
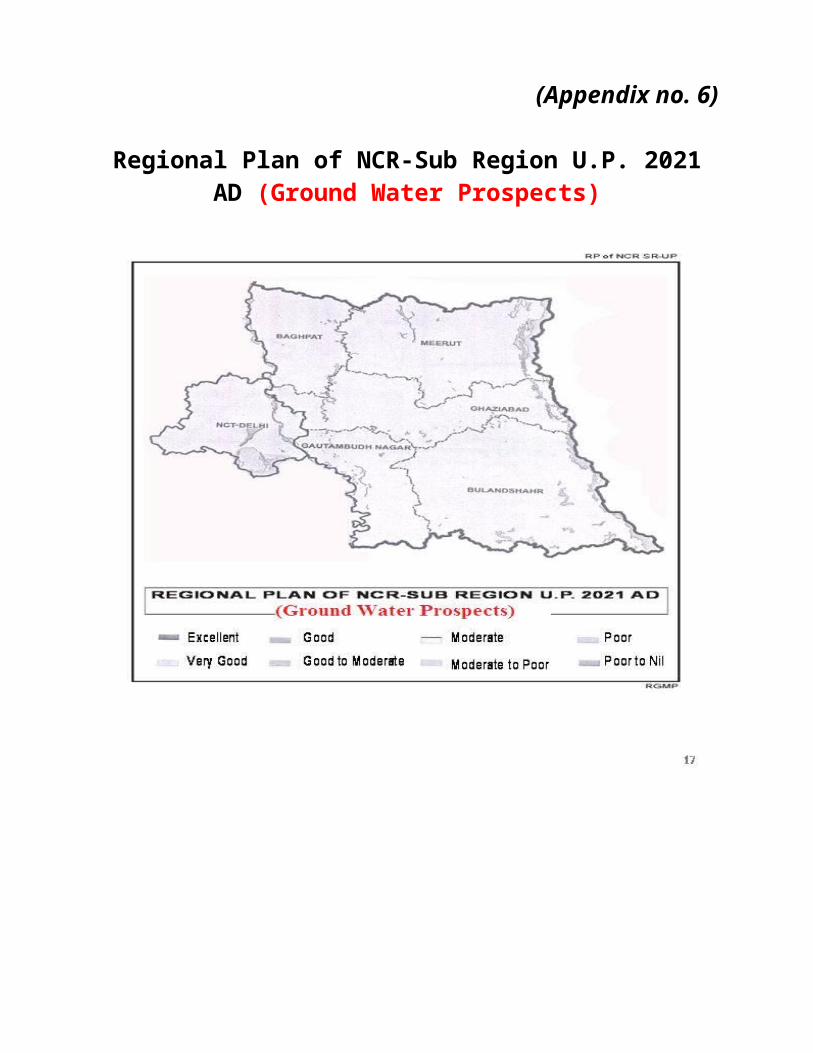
4. Regional Plan of NCR-Sub Region U.P. 2021 AD (Ground Water Prospects)
(Appendix no. 6)5. Regional Plan of NCR-Sub Region U.P. 2021 AD (Land
Use 1999)(Appendix no. 7)
6. Regional Plan of NCR-Sub Region U.P. 2021 AD (Policy Zones)
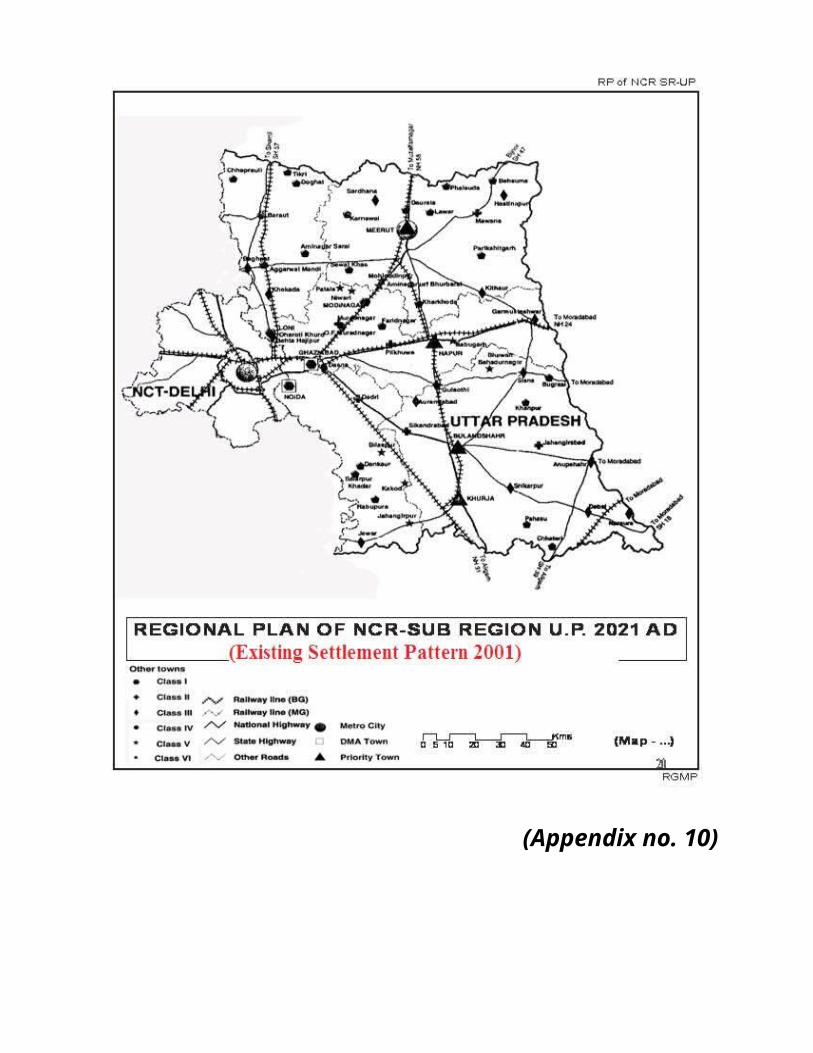
(Appendix no. 8)7. Regional Plan of NCR-Sub Region U.P. 2021 AD (Existing
Settlement Pattern 2001)(Appendix no. 9)
8. Regional Plan of NCR-Sub Region U.P. 2021 AD (Existing Transport Network (Roads) 2002)
(Appendix no. 10)9. Regional Plan of NCR-Sub Region U.P. 2021 AD
(Proposed Settlement Pattern 2021)(Appendix no. 11)
10. Regional Plan of NCR-Sub Region U.P.2021 AD (Proposed Transport Network (Rail) 2021)
(Appendix no. 12)11. Regional Plan of NCR-Sub Region U.P. 2021 AD (Ground
Water Rechargeable Areas)(Appendix no. 13)
12. Regional Plan of NCR-Sub Region U.P. 2021 AD (Status of Ground Water Availability)
(Appendix no. 14)

13. Regional Plan of NCR-Sub Region U.P. 2021 AD (Seismo – Tectonic Features)
(Appendix no. 15)
14. Regional Plan of NCR-Sub Region U.P. 2021 AD (Proposed Land Use 2021)
(Appendix no. 16)15. Regional Plan of NCR-Sub Region U.P. 2021 AD (Counter
Magnet Towers)(Appendix no. 17)
3. HISTORICAL PERSPECTIVE:
1. Historical city – dating back to Ramayana and Mahabharata
2. In 1806 the cantonment was established.3. Declared as District HQ in 1818.4. The birth place of the Indian mutiny of 1857.5. It is the largest town in Western Uttar Pradesh.6. Second largest city under NCR.7. Headquarter of Meerut division comprising five
districts.8. Emperor Ashoka – 1400 BC.9. Some buildings of Harappa time.10. Mayrasta father of the Mandodri (wife of Ravan). On
this name of the City became Meerut.11. 10th century Raja Hardutt

12. 11th century Jama Masjid13. Firozshah Tuglaq in 1364 shifted a pillar to Delhi
Meerut is surrounded by a wall but mostly demolished with 9 gates; some of them are: Delhi gate, Lisari gate, Baghpat gate, Bhudhana gate, Sapeer gate, Kambo gate and some others.
4. FOCAL POINTS:
(1) Ghanta ghar, (2) Suraj Kund, (3) Nauchandi Fair, (4) Kali Paltan Temple, (5) Saradhna Church, (6) Hashtinapur Fort, (7) Bhashali ground (Ashoka Kilat), (8) Pura Mahadev Temple, (9) Gagol, (10) Bholley Ki Jhal (Ganga Kanal)
5. ROADS & RAILWAYS LINKAGES
Details have been given in separate part.
6. PROVISIONS AS GIVEN IN MEERUT MASTER PLAN IN TABULAR FORM
(Appendix no. 18)
Table No. 1: Meerut Metro City; its population and growth (1901-2001)Table No. 2: Description of Industrial Unit of Meerut CityTable No. 3: Distribution of Offices in Meerut CityTable No. 4: Details of present different Educational Institutions in Meerut City – 2002
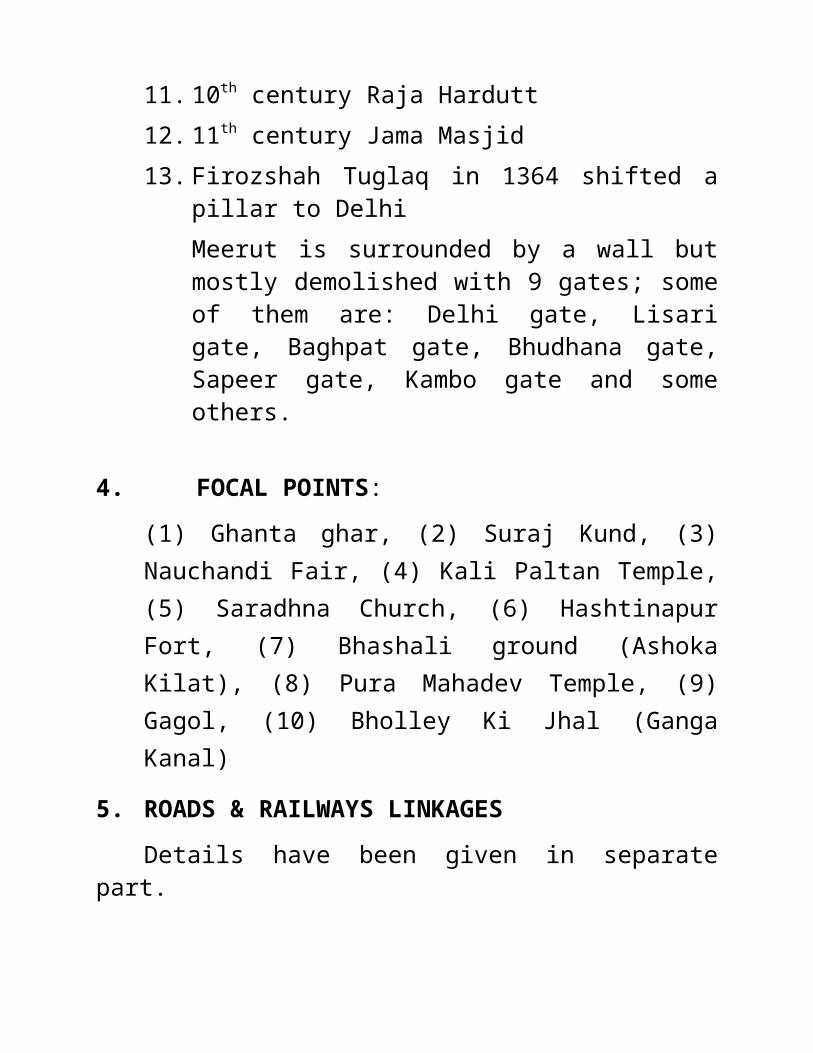
Table No. 5: Details of available different Health facilities in Meerut City – 2002Table No. 6: No. of working employees in urbanized area of MeerutTable No. 7: Demand of Educational & Health Centre upto 2021 ADTable No. 8: Demand for Residential Unit of Income Group wiseTable No. 9: Description of proposed land use in Meerut Master Plan 2021Table No.5.8: Workers participation ratio in selected towns of UP Sub Region (1981-91)
7. FACTORS & COMPONENTS TO LOCATE NEW CITY/ CITIES1. Urban extension as shown in the Master Plan of
Meerut city2. Ground water prospects3. Policy zone as per NCR4. Existing settlements pattern – 20015. Proposed settlements pattern – 20216. Existing Transport Network (Roads) – 20087. Existing Transport Network (Rail) – 20088. Proposed Transport Network (Roads) – 20219. Proposed Transport Network (Rail) – 202110. Ground Water Rechargeable Areas

11. Status of Ground Water Availability12. Seismo-Tectonic features13. Proposed Land Use 2021 AD as given in NCR Plan14. Effects of Ganga Expressway 15. Upper Ganga Dedicated Rail Freight Corridor 16. Peripheral Expressways including Delhi, Ghaziabad,
Meerut, Expressway.17. Special Economic Zone 18. Impact of Higher Education Zone (ii) Manufacturing
(iii) Sugar (iv) Sports (v) Information Technology (vi) Cargo
8. COMPONENTS OF FINAL OUTPUT
1. New Housing
(i) Housing for Urban poor through Slum & JJ approaches, (ii) Houses on Independent Plots & Redevelopment, (iii) Group Housing, (iv) Employer Housing, (v) Unauthorized Regularized Colonies, (vi) Other Housing areas Up- gradation of Old areas Traditional/Villages;
2. Physical Infrastructure
(i) Augmentation of water distribution, (ii) Construction of new treatment plants, (iii) Augmentation of sewerage T Plants, (iv) Construction of new sewerage treatment plants, (v) Augmentation of power distribution system,

(vi) Development of sanitary landfill sites, (vii) Construction/development of compost/incineration plants (viii) Municipal Solid Waste
3. Social Infrastructure
3.1 Health - (i) Hospital A (501 beds & above), (ii) Hospital B (201 beds to 500 beds), (iii) Hospital C (101 beds to 200 beds); (iv) Hospital D (Up to 100 beds), (v) Veterinary hospital.
3.2 Education – (i) School for physically handicapped, (ii) School for mentally handicapped, (iii) Vocational Training Centre, (iv) General college, (v) Professional college, (vi) Medical college, (vii) Nursing and Paramedic Institute, (viii) Training-cum-Research Institute in Veterinary Sciences.
3.3 Communication – (i) Head Post Office – Administrative Office, (ii) Telephone Exchange.
3.4 Security-Police – (i) Police Station, (ii) Police line, (iii) District Jail, (iv) District Office and battalion, (v) Police training institute / college, (vi) Traffic and police control room.
3.5 Safety-Fire – (i) Fire Station, (ii) Disaster Management Centre, (iii) Fire Training Institute,
3.6 Socio-cultural facilities – (i) Multipurpose community hall, (ii) Community Recreational Club, (iii) Recreational

Club, (iv) Socio Cultural Activities Centre, (v) Exhibition sites.
3.7 Other community facilities – (i) Old Age Home, (ii) Working women hostels, (iii) Night Shelters, (iv) Orphanage, (v) Religious premises, (vi) Cremation grounds, (vii) Cemetery / burial grounds;
4. Trade and Commerce
(i) Metropolitan City Centre; (Preparation of integrated schemes & specific projects); (ii) District Centre/Sub CBD – (Up gradation of existing areas & New locations in urban extension); (iii) Community Centre - (Up-gradation of existing areas, & New locations in urban extension/projects);
5. Transport
(i) MRTS, (ii) Construction of grade separators, (iii) Development of Urban relief roads, (iv) Construction of interstate bus terminals, (v) Construction of Metropolitan Passenger Terminals, (vi) Integrated Freight Complexes, (vii) Petrol Pumps & CNG stations, (viii) Parking facilities including automatic multi level car parking.
6. Restructuring along MRTS Network

(i) Up-gradation of existing areas, (ii) New locations in Urban extension;
7. Industries
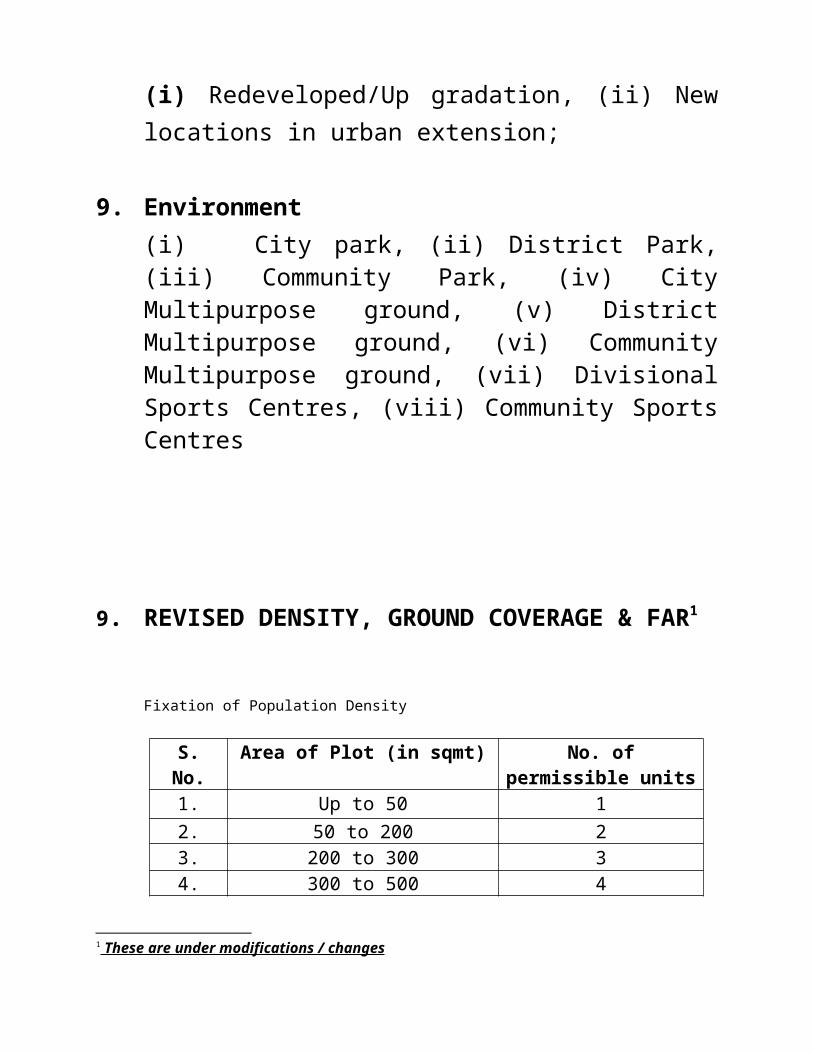
(i) Redeveloped/Up gradation, (ii) New locations in urban extension;
8. Government Offices/District Court
(i) Redeveloped/Up gradation, (ii) New locations in urban extension;
9. Environment(i) City park, (ii) District Park, (iii) Community Park, (iv) City Multipurpose ground, (v) District Multipurpose ground, (vi) Community Multipurpose ground, (vii) Divisional Sports Centres, (viii) Community Sports Centres
9. REVISED DENSITY, GROUND COVERAGE & FAR1
Fixation of Population Density
S. No. Area of Plot (in sqmt) No. of permissible units1. Up to 50 12. 50 to 200 2
1 These are under modifications / changes

3. 200 to 300 34. 300 to 500 4
Net residential density proposed for plotted development & Group Housing Society.
Provision Present Standard(man per hectare)
Proposed Amendment (man per hectare)
Plotted development
Maximum 600 30% growth (maximum 750)
Group Housing Maximum 750(150 units per hectare)
30% growth (maximum 1000)
(200 units per hectare)
Proposed amendment as per ‘National Building Code’
S. No. Land Use & Level
Maximum Ground Coverage
Maximum FAR
Present Proposed Present Proposed1. Residential1.1 Plotted residential 65 65 2.00 2.001.2 Group Housing 35 35 1.50 2.502. Commercial2.1 General commercial(a) Convenience shopping 60 50 1.20 1.50(b) Bazaar street 60 50 1.20 1.50(c) Neighborhood / Sector
Shopping Centre 50 40 1.50 1.75
(d) Zonal Shopping Centre
40 35 1.50 2.00
(e) City Centre 30 30 2.00 3.002.2 Hotel(a) Up to 3 star 40 40 1.20 1.50(b) 5 star and above 30 30 2.00 2.502.3 Wholesale Commercial (a) Grain Market 35 35 Not
fixed1.00
(b) Fruit & Vegetable Mandi
40 40 Not fixed
1.00
(c) Other Wholesale Profession
60 50 Not fixed
1.50

S. No. Land Use & Level
Maximum Ground Coverage
Maximum FAR
Present Proposed Present Proposed2.4 Storage(a) Godown 40 40 Not
fixed1.20
(b) Building Construction Material Yard
30 30 Not fixed
0.60
3. Offices3.1 Govt. & Semi-Govt. 35 35 2.00 2.003.2 Professional /
Commercial Offices 30 30 2.00 2.50
4. Industrial4.1 Flatted Factories 50 50 1.00 1.204.2 Small & Light
Industries80 60 0.60 0.80
4.3 Heavy Industries 40 40 0.60 0.605. Service Industries 5.1 Petrol Pump / Service
Garage, Repair, Shop etc.
10 10 0.15 0.15
6. Public & Semi-public Convenience 6.1 Educational (a) Nursery School 40 40 0.80 0.80(b) Primary School 35 35 0.60 1.00(c) High School/Inter
College35 35 1.00 1.20
(d) Degree College 35 35 1.00 1.50(e) Technical /
Management Institute35 35 1.00 2.00
6.2 Medical(a) Clinic / Dispensary 35 40 1.50 1.60(b) Nursing Home (up to
50 beds)35 35 1.60 1.60
(c) Hospital (50 to 100 beds)
35 30 1.50 2.00
(d) Hospital (above 100 beds)
35 30 1.50 2.50
6.3 Other uses(a) Community Centre, 35 40 1.60 1.60

S. No. Land Use & Level
Maximum Ground Coverage
Maximum FAR
Present Proposed Present ProposedBarat Ghar, Religious Premises
(b) Other institutions 35 30 1.50 2.006.4 Utilities & Services 10 10 0.10 0.107. Open ground (Except
Park & Play Ground) 2.5 2.5 0.025 0.025
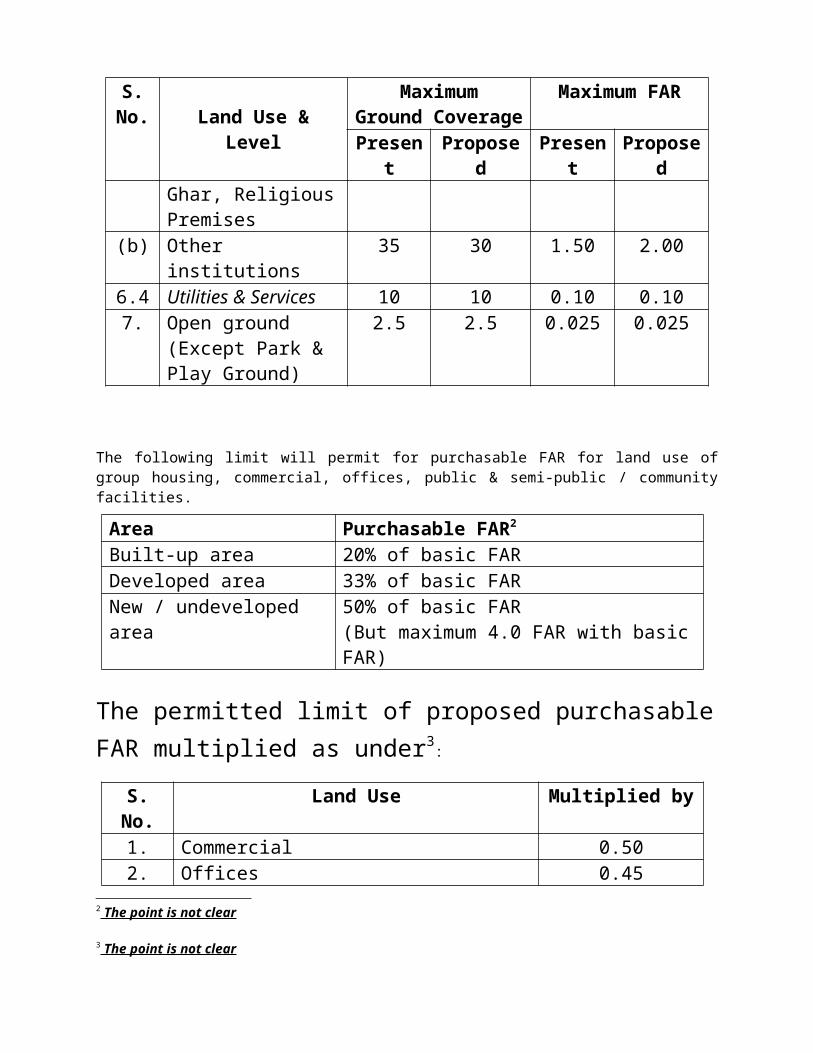
The following limit will permit for purchasable FAR for land use of group housing, commercial, offices, public & semi-public / community facilities.
Area Purchasable FAR2
Built-up area 20% of basic FARDeveloped area 33% of basic FARNew / undeveloped area 50% of basic FAR
(But maximum 4.0 FAR with basic FAR)
The permitted limit of proposed purchasable FAR multiplied as under3
:
S. No. Land Use Multiplied by1. Commercial 0.502. Offices 0.453. Group Housing 0.404. Public & Semi-public / Community facilities 0.20
2 The point is not clear
3 The point is not clear
(Appendix no.3)
Regional Plan of NCR-Sub Region U.P. 2021 AD (Physiography & slope)

(Appendix no.4)
Regional Plan of NCR-Sub Region U.P. 2021 AD (Lithology)

(Appendix no. 5)
Regional Plan of NCR-Sub Region U.P. 2021 AD (Geomorphic Units)

(Appendix no. 6)
Regional Plan of NCR-Sub Region U.P. 2021 AD (Ground Water Prospects)
(Appendix no. 7)
Regional Plan of NCR-Sub Region U.P. 2021 AD (Land Use 1999)
(Appendix no. 8)
Regional Plan of NCR-Sub Region U.P. 2021 AD (Policy Zones)

(Appendix no. 9)
Regional Plan of NCR-Sub Region U.P. 2021 AD (Existing Settlement Pattern 2001)

(Appendix no. 10)
Regional Plan of NCR-Sub Region U.P. 2021 AD (Existing Transport Network (Roads) 2002)


(Appendix no. 11)
Regional Plan of NCR-Sub Region U.P. 2021 AD (Proposed Settlement Pattern 2021)
(Appendix no. 12)
Regional Plan of NCR-Sub Region U.P. 2021 AD (Proposed Transport Network (Rail) 2021)

(Appendix no. 13)
Regional Plan of NCR-Sub Region U.P. 2021 AD (Ground Water Rechargeable Areas)

(Appendix no. 14)
Regional Plan of NCR-Sub Region U.P. 2021 AD (Status of Ground Water Availability)
(Appendix no. 15)
Regional Plan of NCR-Sub Region U.P. 2021 AD (Seismo – Tectonic Features)

(Appendix no. 16)
Regional Plan of NCR-Sub Region U.P. 2021 AD (Proposed Land Use 2021)

(Appendix no. 17)
Regional Plan of NCR-Sub Region U.P. 2021 AD (Counter Magnet Towers)

Appendix no. 18
Various Provisions as given in Meerut Master Plan – 2021 AD in 10 tables given under:
Table No. 1Meerut Metro City; its population and growth (1901 – 2001)
S. No.
Year Population Difference in decade
Growth in %
1. 1901 1,21,180 - -2. 1911 1,19,435 - 1,745 - 1.443. 1921 1,25,506 + 6,071 + 5.084. 1931 1,41,025 + 15,519 + 12.375. 1941 1,79,155 + 38,130 + 27.046. 1951 2,39,440 + 60,285 + 33.657. 1961 2,94,853 + 55,413 + 23.148. 1971 3,71,760 + 76,907 + 26.089. 1981 5,36,615 + 1,64,855 + 44.3410. 1991 8,49,799 + 3,13,184 + 58.3611. 2001 11,70,985 + 3,21,186 + 37.79(Source: Meerut Master Plan 2021 from page no. 8)
Table No. 2Description of Industrial Unit of Meerut City
Sl. No.
Classification of Industry unit
No. of Units
Total Labour
% No. of labour and total % of labourSkilled Semi-Skilled Non SkilledLabour % labour % labour %
1. Large & Medium
39 4,683 6.31 235 0.32 796 1.07 3,652 4.92
2. Small Scale Industry
15,510
61,254 82.52 1838 2.48 15,313 20.63 44,103 59.41
3. Household Industry
7,922 8,295 11.17 141 0.19 995 1.34 7,159 9.64
Total 23,471 74,232 100.00 2214 2.99 17,104 23.04 54,914 73.97
(Source: Meerut Master Plan 2021 from page no. 14)

Table No. 3Distribution of Offices in Meerut City
S. No.
Distribution of Department
No. of Offices
No. of working officers and employees
1. Central Govt. 41 10,1612. Quasi Govt. 123 3,8863. State Govt. 180 20,9294. Semi-State Govt.
/Nigam93 9,408
(Source: Meerut Master Plan 2021 from page no. 17)
Table No. 4DETAILS OF PRESENT DIFFERENT EDUCATIONAL INSTITUTIONS IN MEERUT CITY – 2002
Sl.No.
Category of Educational Institution
No. of Educational InstitutionsGovt./ Semi Govt. Recognized by Govt.
Total No. of Students
1. Primary/Nursery 106 539 54,2462. Junior High School 10 94 11,5483. Intermediate School 1 26 9,5784. Higher Intermediate
School 2 45 80,893
5. Graduate College - 1
475
6. Post Graduate College - 11
29,221
7. University 2 - -8. Professional College 8 - 3709. Professional College
ITI 4 - 1,362
(Source: Meerut Master Plan 2021 from page no. 26)
Table No. 5DETAILS OF AVAILABLE DIFFERENT HEALTH FACILITIES IN MEERUT CITY – 2002

Sl. No.
Nature of Organization No. of Organization
No. of Beds
No. of Doctors
1. Primary Health Centre 8 - 122. Hospital (Male) 1 250 423. Hospital (Female) 1 116 214. Medical College 2 1,090 595. Nursing Home 104 - -
Cantonment Area6. Hospital 1 70 17. Primary Health Centre 1
(Source: Meerut Master Plan 2021 from page no. 27)
Table No. 6No. of working employees in urbanized area of Meerut
Sl. No.
Business level
1991 2001 2011 2021
Total labour
% Total labour
% Total labour
% Total labour
%
1. Primary Level
23,912 10.25 26,230 8.00 27,030 6.00 28,520 4.00
2. Secondary level2.1 Household industry 2.2 Non household industry 2.3 Construction
71,399
12,178
15,197
8,112
30.61
5.22
21.91
3.48
1,01,641
17,213
72,133
12,295
31.00
5.25
22.00
3.75
1,44,163
24,778
1,01,365
18,020
32.00
5.50
22.50
4.00
2,35,290
39,215
1,63,990
32,085
33.00
5.50
23.00
4.50
3. Tartary level3.1 Trade & Commerce 3.2 Transport
1,37,929
49,174
59.1421.08
6.52
2,00,004
68,854
61.00
21.00
2,79,317
96,860
62.00
21.50
4,49,190
1,53,295
63.0021.50
8.50

& Communication system3.3 Other activities3.4 Marginal workers
15,197
69,748
3,810
29.90
1.64
24,591
1,06,559
-
7.50
32.50
-
36,041
1,46,416
-
8.00
32.50
-
60,605
2,35,290
-
33.00
-
Total labours 2,33,240
100.0 3,27,875
100.0
4,50,510
100.0
7,13,000
100.00
Population 8,49,799
11,70,985
15,27,156
23,00,000
Ratio of participant worker
27.44 28.00
29.50
31.00
(Source: Meerut Master Plan 2021 from page no. 41)
Table No. 7Demand of Educational & Health Centre up to 2021 AD
Sl.No. Name of the Institution No.1. Pre-primary School 9202. Primary School 4603. Sr. Secondary School 464. College 235. Higher Education Technical &
Management Institution8
6. Medical College 27. General Hospital 118. Important Hospital 289. Polyclinic 2810 Dispensary 153
(Source: Meerut Master Plan 2021 from page no. 44)
Table No. 8Demand for Residential Unit of Income Group wise
S. Level Year - Year Year-

No. 2005 2015 20251. E.W.S 20151 30689 435702. L.I.G 25560 38925 552643. M.I.G 29871 45491 645854. H.I.G 12568 19140 27174
Total 88151 134244 190593(Source: Meerut Master Plan 2021 from page no. 45)
Table No. 9Description of proposed land use in Meerut Master Plan 2021
S. No.
Land use level Area (hect.)
% Remarks
1. Regularized housing area
1540.14 9.88 With Market & Congested Market area
2. Housing 6201.00 39.7 With Mixed Land use
3. Business 352.80 2.26 -4. Industries 1228.85 7.88 -5. Offices 351.17 2.25 -6. Community Centre 1486.65 9.54 -7. Transport 1549.65 9.94 -8. Park, Play ground,
Green verge and forest area
2897.71 18.59 -
15589.97 -Or 15590.00 100 -
(Source: Meerut Master Plan 2021 from page no. 48)
Table 5.8:
Workers Participation ratio in selected Towns of UP Sub Region (1981-1991)
(Page – 43)

Cities/Towns 1981 1991Meerut 28.3 26.9
Source: Census 1981 and 1991, Census of India