Embed Size (px)
Citation preview

2D Model For Steady State TemperatureDistribution
Finite Element Method
Vinh Nguyen, Giuliano Basile, Christine Rohr
University of Massachusetts Dartmouth
September 23, 2010

Introduction
Advisor
Dr. Nima Rahbar: Civil Engineering
Project Objective
To learn the fundamentals of matrices and how to analyzethem.
To learn how to use Matlab and finite element method toconstruct a 2D computer model for temperature distribution.
Nguyen, Basile, Rohr 2D Model For Temperature Distribution
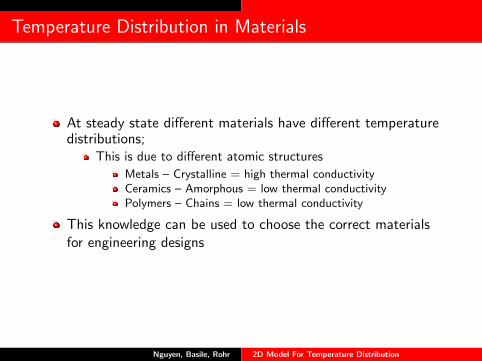
Temperature Distribution in Materials
At steady state different materials have different temperaturedistributions;
This is due to different atomic structures
Metals – Crystalline = high thermal conductivityCeramics – Amorphous = low thermal conductivityPolymers – Chains = low thermal conductivity
This knowledge can be used to choose the correct materialsfor engineering designs
Nguyen, Basile, Rohr 2D Model For Temperature Distribution
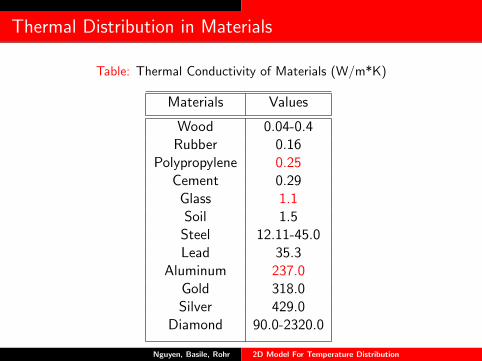
Thermal Distribution in Materials
Table: Thermal Conductivity of Materials (W/m*K)
Materials Values
Wood 0.04-0.4Rubber 0.16
Polypropylene 0.25Cement 0.29
Glass 1.1Soil 1.5
Steel 12.11-45.0Lead 35.3
Aluminum 237.0Gold 318.0Silver 429.0
Diamond 90.0-2320.0
Nguyen, Basile, Rohr 2D Model For Temperature Distribution

Why Do We Study 2D Temperature Distribution?
To generate new understanding and improve computermethods for calculating thermal distribution.
2D computer modeling is
cheapfast to processgives accurate numerical resultsparallel method can be used for higher efficiency
Nguyen, Basile, Rohr 2D Model For Temperature Distribution
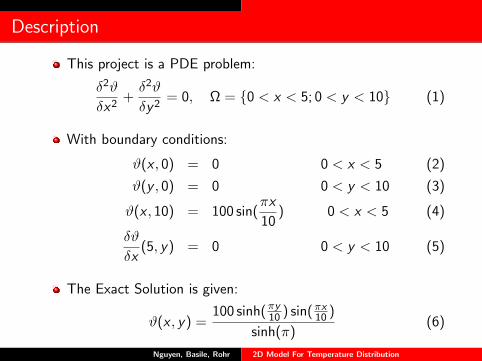
Description
This project is a PDE problem:
δ2ϑ
δx2+δ2ϑ
δy2= 0, Ω = 0 < x < 5; 0 < y < 10 (1)
With boundary conditions:
ϑ(x , 0) = 0 0 < x < 5 (2)
ϑ(y , 0) = 0 0 < y < 10 (3)
ϑ(x , 10) = 100 sin(πx
10) 0 < x < 5 (4)
δϑ
δx(5, y) = 0 0 < y < 10 (5)
The Exact Solution is given:
ϑ(x , y) =100 sinh(πy
10 ) sin(πx10 )
sinh(π)(6)
Nguyen, Basile, Rohr 2D Model For Temperature Distribution

Description-Building The Mesh
!
!
!
!
The problem was firstapproached by creating 25node- 32 elementtriangular mesh.
The nodes are built fromleft to right and bottomup.
An element is formed byconnecting 3 nodal points.
No heat is applied to thesides and the bottom.
Heat is applied at the topof the plate:
ϑ = 100 sin(πx
10) (7)
Nguyen, Basile, Rohr 2D Model For Temperature Distribution

25 Nodes (32 Elements) — Plate vs. MatLab Solution
0 1 2 3 4 50
1
2
3
4
5
6
7
8
9
10Temperature Distribution
Horizontal Side
Vert
ical S
ide
45
50
55
60
65
70
75
80
85
90
Student Version of MATLAB
Nguyen, Basile, Rohr 2D Model For Temperature Distribution
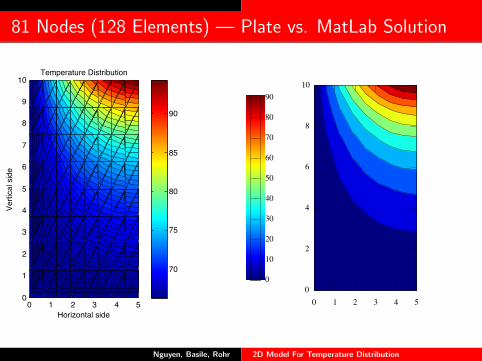
81 Nodes (128 Elements) — Plate vs. MatLab Solution
0 1 2 3 4 50
1
2
3
4
5
6
7
8
9
10Temperature Distribution
Horizontal side
Ve
rtic
al sid
e
70
75
80
85
90
Student Version of MATLAB
Nguyen, Basile, Rohr 2D Model For Temperature Distribution
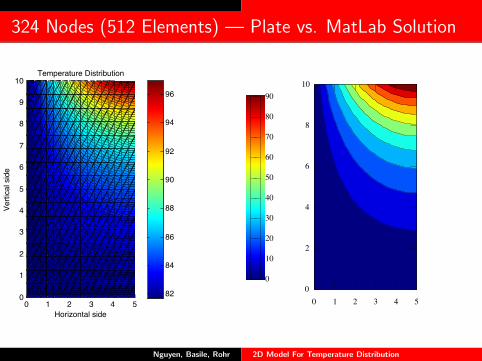
324 Nodes (512 Elements) — Plate vs. MatLab Solution
0 1 2 3 4 50
1
2
3
4
5
6
7
8
9
10Temperature Distribution
Horizontal side
Vert
ical sid
e
82
84
86
88
90
92
94
96
Student Version of MATLAB
Nguyen, Basile, Rohr 2D Model For Temperature Distribution
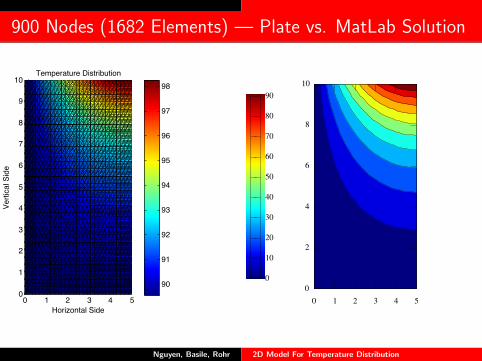
900 Nodes (1682 Elements) — Plate vs. MatLab Solution
0 1 2 3 4 50
1
2
3
4
5
6
7
8
9
10Temperature Distribution
Horizontal Side
Ve
rtic
al S
ide
90
91
92
93
94
95
96
97
98
Student Version of MATLAB
Nguyen, Basile, Rohr 2D Model For Temperature Distribution

Temperature Distribution (Right Side)
δ(x , y) =100 sinh
(πy10
)sin
(πx10
)sinh(π)
0 1 2 3 4 5 6 7 8 9 100
10
20
30
40
50
60
70
80
90
100
Y!Axis
Temperature
32Elements
Student Version of MATLAB
Nguyen, Basile, Rohr 2D Model For Temperature Distribution

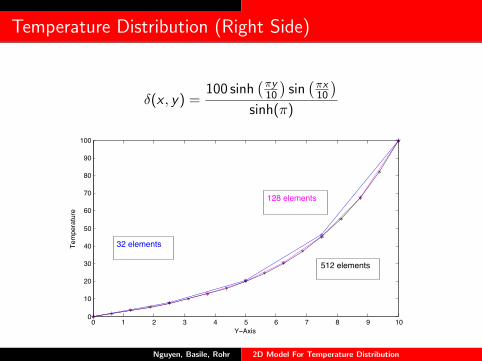
Temperature Distribution (Right Side)
δ(x , y) =100 sinh
(πy10
)sin
(πx10
)sinh(π)
0 1 2 3 4 5 6 7 8 9 100
10
20
30
40
50
60
70
80
90
100
Y!Axis
Temperature
32elements
128elements
Student Version of MATLAB
Nguyen, Basile, Rohr 2D Model For Temperature Distribution
Temperature Distribution (Right Side)
δ(x , y) =100 sinh
(πy10
)sin
(πx10
)sinh(π)
0 1 2 3 4 5 6 7 8 9 100
10
20
30
40
50
60
70
80
90
100
Y!Axis
Tem
pera
ture
32 elements
128 elements
512 elements
Student Version of MATLAB
Nguyen, Basile, Rohr 2D Model For Temperature Distribution

Temperature Distribution (Right Side)
δ(x , y) =100 sinh
(πy10
)sin
(πx10
)sinh(π)
0 1 2 3 4 5 6 7 8 9 100
10
20
30
40
50
60
70
80
90
100
Y!Axis
Tem
pera
ture
32 elements
128 elements
512 elements
1682 elements
Temperature at TheRight Side of ThePlate
The temperature linesconverge to a smooth lineasthe number of elementsincreases
Student Version of MATLAB
Nguyen, Basile, Rohr 2D Model For Temperature Distribution
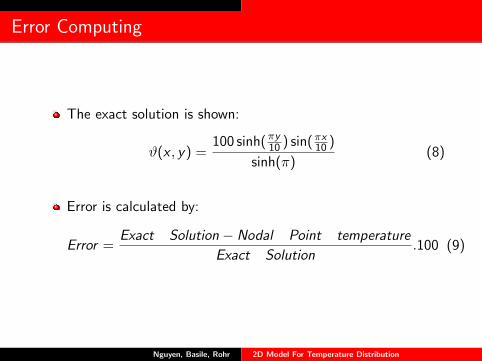
Error Computing
The exact solution is shown:
ϑ(x , y) =100 sinh(πy
10 ) sin(πx10 )
sinh(π)(8)
Error is calculated by:
Error =Exact Solution − Nodal Point temperature
Exact Solution.100 (9)
Nguyen, Basile, Rohr 2D Model For Temperature Distribution
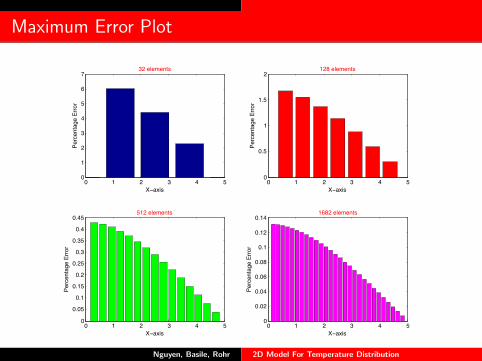
Maximum Error Plot
0 1 2 3 4 50
1
2
3
4
5
6
732 elements
X!axis
Pe
rce
nta
ge
Err
or
0 1 2 3 4 50
0.5
1
1.5
2128 elements
X!axis
Pe
rce
nta
ge
Err
or
0 1 2 3 4 50
0.05
0.1
0.15
0.2
0.25
0.3
0.35
0.4
0.45512 elements
X!axis
Pe
rce
nta
ge
Err
or
0 1 2 3 4 50
0.02
0.04
0.06
0.08
0.1
0.12
0.141682 elements
X!axis
Pe
rce
nta
ge
Err
or
Student Version of MATLAB
Nguyen, Basile, Rohr 2D Model For Temperature Distribution

Building The Mesh For Hole Defect Model
0 1 2 3 4 50
1
2
3
4
5
6
7
8
9
10Mesh
1 2 3 4 5
6 7 8 9 10
11 12 13 14
15 16 17 18 19
20 21 22 23 24
(1) (2) (3) (4)
(5) (6) (7) (8)
(9) (10)
(11) (12)
(13) (14)
(15) (16)
(17) (18) (19) (20)
(21) (22) (23) (24)
X!axis
Y!axis
Student Version of MATLAB
Nguyen, Basile, Rohr 2D Model For Temperature Distribution
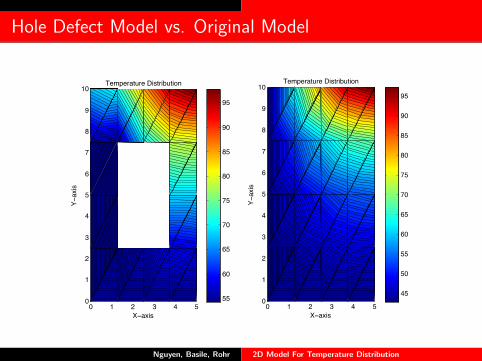
Hole Defect Model vs. Original Model
0 1 2 3 4 50
1
2
3
4
5
6
7
8
9
10Temperature Distribution
X!axis
Y!
axis
55
60
65
70
75
80
85
90
95
Student Version of MATLAB
(a) Hole model
0 1 2 3 4 50
1
2
3
4
5
6
7
8
9
10Temperature Distribution
X!axis
Y!
axis
45
50
55
60
65
70
75
80
85
90
95
Student Version of MATLAB
(b) Original model
Figure 9: Matlab’s numerical results for the defected model and the original model from left to right (a), (b)
As in the figure we can see that heat is spreading further to the left at the top part and further down onthe right side of the plate with hole.
0.3.4 Matlab Code for Temperature Distribution of The Defected Model
The temperature distribution in this model is controlled by boundary conditions as below
%!!!!!!!!!!!!!!!!!!!!!!!!!!!!!%% Boundary cond i t i on s %%!!!!!!!!!!!!!!!!!!!!!!!!!!!!!%% pre s c r i b e d d i sp lacement ( e s s e n t i a l boundary cond i t i on )%% Idb ( i ,N)=1 i f the degree o f freedom i o f the node N i s p r e s c r i b e d% =0 otherw i s e%% 1) i n i t i a l i z e Idb to 0idb=zeros ( ndf , nnp ) ;% 2) enter the f l a g f o r p r e s c r i b e d d i sp lacement boundary cond i t i on sfor i = 1 : nxd
idb (1 , i )=1;end
for i = 1 : nxd : ( nyd"(nxd!1)+1)idb (1 , i )=1;
end
for i = nxd"(nyd!1)+1:nxd"( nyd )idb (1 , i )=1;
end
12
Nguyen, Basile, Rohr 2D Model For Temperature Distribution

References
[Civil Engineer] Dr. Nima RahbarFundamental Matrix AlgebraUniversity of Massachusetts Dartmouth, Summer 2010.
[Thermal Conductivity of some common Materials]Thermal Conductivity of Materialswww. engineeringtoolbox. com , July 2010
Cu Atomic StructureCrystalline Atomic Structurehttp: // www. webelements. com , July 2010
Ceramic Atomic StructureAmorphous Atomic Structurehttp: // www. bccms. uni-bremen. de , July 2010
Polymer Atomic StructureChain Atomic Structurehttp: // www. themolecularuniverse. com , July 2010

Questions?
????????????????????????????????????????????????????????????
Nguyen, Basile, Rohr 2D Model For Temperature Distribution