Embed Size (px)
Citation preview
UNDERGROUND MINING ENGINEERING 34 (2019) 59-76 UDK 62
UNIVERSITY OF BELGRADE - FACULTY OF MINING AND GEOLOGY ISSN 03542904
Original scientific paper
2D GEOELECTRICAL RESISTIVITY TOMOGRAPHY APPLICATION
AT THE FORMER CITY WASTE DUMP “ADA HUJA” –
ECO - GEOLOGICAL PROBLEM
Branislav Sretenović1, Filip Arnaut1, Ivana Vasiljević1, Vesna Cvetkov1
Received: April 18, 2019 Accepted: June 3, 2019
Abstract: Rapid yearly technology development has enabled the possibility of
renewing already acquisitioned data using new and improved software capabilities.
The potential to gather 3D inversion results from 2D acquisitioned data is one of
many new software options that were not available twenty years ago. Data obtained
by ground penetrating radar (GPR) using 500 MHz and 300 MHz frequencies were
used to confirm information attained by electrical resistivity tomography, hence
the GPR survey was only conducted on a small portion of one profile line. Suitable
location of the former communal waste site “Ada Huja” and the degree of possible
environmental pollution are one of many reasons why it was crucial to reinterpret
the 2D inversion data. Two decades after the initial scanning the data was used to
solve the eco-geological problem which is a side effect of the decade long disposal
and non-aiding of the communal waste dump.
Keywords: 2D inversion; geoelectrical method; Wenner array; ecology; Ada
Huja
1 INTRODUCTION
The location of the former city waste dump “Ada Huja” was labeled as IBA (Important
Bird Area), where refuge was found by some endangered species of birds like the black-
headed seagull, big and small cormorant and the white-tailed eagle. Ada Huja, which is
located only 4 km from the city center of Belgrade, was under the supervision from the
former Federal executive council of SFRY and declared a communal waste dump in the
year 1960. From then on it is representing an unsolved ecological problem. Such a
solution for the daily production of waste causes several threats for the ecosystem such
as the production of methane, hydrogen-sulfide, carbon-dioxide and carbon-monoxide.
Based on the research of the disposed waste origin and the knowledge of building
material production during the twentieth century, there exists a founded assumption of
environmental pollution with fiber (asbestos) silicates which increase the chance of
1 University of Belgrade – Faculty of Mining and Geology
Emails:[email protected];[email protected];[email protected];
60 Sretenović B., Arnaut F., Vasiljević I., Cvetkov V.
getting a variety of cancer types. Housing development “Deponija”, which is proclaimed
to be the most unattractive housing settlement in Belgrade, is located near the former
waste dump site “Ada Huja”. The lack of statistical reports on the health condition of the
people who live in the near vicinity of the waste site indicates a neglecting attitude for
the health of people, but also for the condition of the environment in general. This is best
noticed in the completely wrong classification of forest classes in that area.
Lateral resistivity changes in the disposed waste were detected using 2D geoelectrical
scanning method along three profile lines. The chosen Wenner array proved to be the
most adequate because of the present urban noises, economical aspects of the survey and
required staff. Geoelectrical methods for surveying subsurface structures serve as
economically efficient and time-saving process (with regards to other subsurface
surveying methods). The main limitation of exploration drilling is a high cost (drills,
required staff etc.), and in this case (communal waste dump) the lack of utilization of
geological logic in connecting the acquired data.
The classification of geophysical (geoelectrical) methods is based on the number of
dimensions shown, thus, we have one-dimensional, two-dimensional and three-
dimensional geophysical methods. One-dimensional methods (1D) are used only when
we want to get the information of the thickness and depth of layers, without knowing
what kind of lateral changes are present. This kind of survey method requires the least
amount of data that has to be acquired and therefore is the cheapest. Two-dimensional
(2D) geoelectrical surveys are giving us the information about the lateral changes of
resistivity, because of that they demand more acquired field data (hundreds or a couple
of hundreds) for the subsurface to be graphically presented. Generally speaking, 2D
surveys give the best ratio of needed funds to be executed, required field acquisitioned
data and gained information of the subsurface. That is why they are a favorable option
of geoelectrical surveying methods (Dahlin, 1996). Three-dimensional (3D) surveys
provide information about the whole geometry of the surveyed half-space. For this kind
of study, the largest amount of acquired data is needed (couple of thousands) (Loke,
2004).
2D geoelectrical surveying was applied at the former communal waste dump “Ada Huja”
(Figure 1). This type of method was used given that immense lateral resistivity changes
were expected in the hoarded material and accounting for the time and funding aspect,
this kind of method was a logical choice.

2D geoelectrical resistivity tomography … 61
Figure 1 Satellite image of the surveyed field (Google Earth)
Accounting for the occurrence of the subsurface material (anthropogenic) the
stratigraphic column is of little use, except to provide the information about the
impermeable marl base. Geotechnical profile (Figure 2), constructed using data from 22
exploration drill holes is an improved source of information about the subsurface. It is
noticeable that there exists a surface embankment layer (sand, gravel, construction
material etc.), which generally enhances the already bad load capacity and subsidence
characteristics of the terrain. The embankment mostly lies on the formerly disposed
waste, with a smaller part laying on a layer of sand. The base which meanders from 7.5
m to 12 m is composed of marl type rocks. That type of rock is porous but impermeable,
in a hydrogeological sense (Šperl and Tročkova, 2008). Water level varies in the range
of about 3 m, passing through the deposited waste of the surveyed subsurface forming
an ecologic problem that will be discussed in the latter chapters.
Figure 2 Geotechnical profile of the surveyed terrain (Sretenović, 1998)

62 Sretenović B., Arnaut F., Vasiljević I., Cvetkov V.
2 RESULTS OF THE 2D GEOELECTRICAL SCANNING METHOD
The survey was carried out with three parallel profile lines, east-west heading (Figure
3a), “profile line I” is the longest and consists out of six parts, the other two profile lines
(II and III) consist out of five parts. The construction of resistivity models and sections
was enabled using the software package Res2DINV from the developer Geotomosoft
(Loke, 1998). Further surveying was executed with another three parallel profile lines
heading north-south (Figure 3b) with a total length of 279 m.
Figure 3 Location of profile lines (Sretenović, 1998)
Primary research was conducted using 32, 51 and 52 electrode arrays according to the
accessible length of the scanned unit. Electrode spacing was 4 m, which in the high
contrast resistivity subsurface gave out a horizontal resolution of 2 m for the first depth
level. The horizontal resolution further decreases with the increasing of the depth level.
Mutual profile line distance was 5 m.
Farther scanning on the “test field” was carried out with a goal of getting a better
understanding of the geotechnical characteristics. The north-south bearing additional
profile lines were shorter in length, with a distance between the electrodes set at 3 m.
This was done for the improvement of the horizontal resolution. Like the first scanning
that was carried out, the additional one used the Wenner Alpha array with 32 electrodes.
All profile lines were scanned on six depth levels, which amounted to a depth reach of
around 12 m. The value of the depth of investigation did not enable the detection of the
marl base all along the profile line. This was caused by the low resistivity value zones
(1-2 Ωm) which made a “screen” type effect and made it difficult for the penetration of
electric current to deeper levels of the half-space, i.e. regardless of Wenner array
dimensions.

2D geoelectrical resistivity tomography … 63
Due to the large resistivity value variations (1-200 Ωm), the establishment of one unique
resistivity scale and observing the profile line as a whole would produce the loss of model
features. Because of the overwhelming heterogeneity of the subsurface it was strived to
maintain the maximal amount of details of 2D models, and because of that units of the
same profile line can have different resistivity scales.
Part three of the profile line I has a length of 124 m (Figure 4). A high value resistivity
zone with a length of 56 m (252 m to 308 m of the profile line) can be noticed and it
represents most likely sand, gravel and other construction materials. Decomposed waste
has a lens-like geometry and retains a low resistivity value. It obtains that low value from
the reaction with electrolytic leachate. Marl type rocks that make up the basis of the half-
space also have a low resistivity value, but one order of magnitude greater that the
deposited waste.
Figure 4 Sections of apparent (top) and true (bottom) resistivity values of profile line I,
part 3 (modified after Sretenović, 1998)
Information acquired from the fourth part of profile I (Figure 5) can be compared with
the geotechnical profile (borehole data). Four boreholes confirmed the presence of
decomposed waste material as well as a sand lens and surface embankment layer
consisting of previous construction material. Like the previous section (Figure 4), the
decomposing waste is represented as a distinctive laterally changing low resistivity layer.

64 Sretenović B., Arnaut F., Vasiljević I., Cvetkov V.
Figure 5 Profile I part 4, model-section of true resistivity values (top), geotechnical profile
with borehole data (middle), ground penetrating radar (GPR) cross section (bottom)
(modified after Sretenović, 1998)
Furthermore, the survey was conducted using ground penetrating radar (GPR). The depth
of investigation achieved with GPR is generally very limited along the whole examined
half-space because of the electromagnetic signal attenuation due to low value resistivity
layers. The GRP section (Figure 5, bottom) corresponds to the marked rectangle on the
2D model-section of true resistivity values (Figure 5, top) where the presence of
relatively high resistivity sands had to enable the least amount of attenuation to
electromagnetic signals. At the depth that corresponds to the two-way travel time of 200
ns,the horizontal reflection is noticed that could indicate a horizontal interface, that was
not detected with the geoelectrical scanning method. Acquired borehole data indicated a
presence of subsurface water at a depth of around 5 m (Figure 5, middle) which makes
a good reflective surface that divides two diametrically opposite resistivity values and a
dielectric constant value which are in contact. Taking into account that the GPR survey
was conducted in the urban environment where the presence of noise is at a higher level,
the horizontal interface could be coherent noise that was picked up by the receiving
antenna which looks like a horizontally continuing reflection that is hard to distinguish
from the primary interface reflections. Within the first 1 to 2 m of the GPR cross section
thin layers (laminas) can be seen that indicate a high vertical resolution of the GPR
equipment.

2D geoelectrical resistivity tomography … 65
Display of the sand lens distribution (Figure 6) as well as the marl basis can greatly help
with getting a better understanding of the subsurface geometry. The sand lens is active
around the mark of 360 m and it gains maximal thickness along the middle survey line.
The last profile line (Figure 6, bottom) shows again a decrease of thickness of the sand
lens. The profile lines are at a mutual distance of 5 m.
Figure 6 Display of the sand lens distribution through three parallel profile lines (I, II, III)
part 4 (modified after Sretenović, 1998)
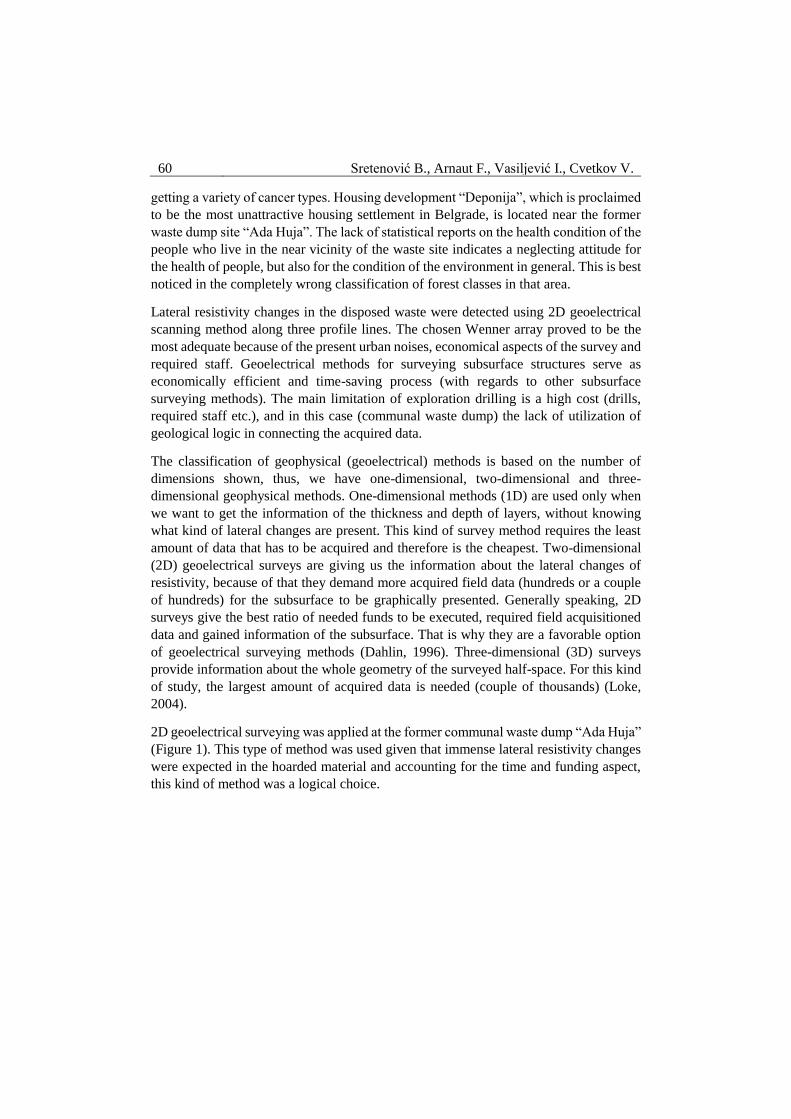
3D inversion results (Figure 7) obtained on six depth levels can be used to further
understand the overall geometry of the examined half-space. Layer one, two and three
are high resistivity layers due to the disposal of sand, gravel and construction material.
This type of resistivity trend can be followed to the depth of 6.95 m. Beneath the first
three layers, a lower value of resistivity can be observed, due to the leachate waters
reacting with decomposing waste. The deepest layer (layer six) is located on the contact
with marl that has its upper layers alternated by means of leachate waters, hence, it has
a low resistivity value as well.
66 Sretenović B., Arnaut F., Vasiljević I., Cvetkov V.
Figure 7 3D inversion results of profile I, II and III, part 4
Profile I is “compressed” and compared with the geotechnical profile (Figure 8). This
procedure was done with partial overlap of the previously scanned parts. Detail loss is
greatly expressed in comparison with individually scanned parts, but with this procedure
the whole spectrum of lateral resistivity changes can be observed. Correlation with the
geotechnical profile is to a great extent good even though the geotechnical profile is a
simplified version of the profile obtained by 2D inversion process. Near the end of the
cross section some very low resistivity values can be noticed (1.2 Ωm) which further
disrupt the resistivity scale and the level of details.
In addition to the good correlation between three mutually parallel profile lines (similar
geometry and resistivity distribution), for the sake of confirmation and justification of
the 2D geoelectrical scanning method, the root mean square value (RMS) should be
viewed. Considering the instrumental error, ambient (urban) noise and the pronounced
lateral resistivity changes of the subsurface, the RMS% values could be considered
satisfactory. The enhancement of the RMS% value in some parts of the profile could be
attributed to the generally 3D character of the examined half-space.
It is necessary to consider the possibility of contamination of the lower layers (marl
rocks) by means of electrolytic fluids. These marl type rocks are located near the
maximum depth of investigation under the low resistivity layered waste and for that
reason the contact between marl and waste can produce a “screen” type effect. To check
the existence of the “screen” effect profile I was examined from 652-856 m. Near the
mark of 784 m (Figure 8), the black rectangle shows a very low resistivity value zone
(1.2 Ωm). Comparing it to the geotechnical profile the waste is laying on top of the marl
basis which starts to be detected at the depth of around 8-8.5 m. Using the 2D
geoelectrical scanning method, that zone was not detected even though marl has an order
of magnitude higher resistivity value.

2D geoelectrical resistivity tomography … 67
Figure 8 Entire length of profile line I compared with the geotechnical profile
(modified after Sretenović, 1998.)
Forward modeling using the program Res2DMOD (Geotomosoft) was applied and a 2D
model with twenty depth levels was obtained. Using that model and putting it through
the process of inversion resulted in theoretical models calculated to the depth of forty
meters (Figure 9).
Figure 9 Theoretically calculated model for obtaining the information
about the lower marl base
With a resistivity value of 2 Ωm (waste) the marl base can be detected i.e. the basic
principle was held (resistivity values increase with depth). The red rectangle indicates a
depth of investigation larger than the one originally used (six depth levels), but even
when using a ten-depth layer survey, the marl basis can not be detected all along the
profile line. It is necessary to perform a survey with more than ten depth levels, because
the low resistivity electrolytes do have a “screen” like effect and deflect the electrical
current from its natural flow. Furthermore, it is vital to conduct an exploratory borehole
at the contact of the waste and marl to get a better understanding of the contaminated
uppermost marl layers.
68 Sretenović B., Arnaut F., Vasiljević I., Cvetkov V.
3 ENVIRONMENTAL PROBLEM OF THE FORMER WASTE DUMP
SITE “ADA HUJA”
3.1 Basic Information
Convenient location of the former waste site “Ada Huja” (4 km from the Belgrade city
center, first city zone) resulted in the housing development for 900 to 2000 people built
on the most unsanitary locality in Belgrade (housing development “Deponija”). In the
beginning of the year 1960, under the jurisdiction of the former Federal executive council
of SFRY, “Ada Huja” became a waste dump site. A variety of birds was endangered as
consequence of this decision, one of which was the white-tailed-eagle, the largest eagle
in Europe. Through the decades that followed, rapid agglomeration caused the habitation
of the surroundings, but the site between the Pančevo bridge and the Danube riverside
remained unregulated.
Palilula municipality is currently the largest in area and the second largest by the number
of inhabitants (Republic statistical institute, 2011). A couple of thousands of people pass
through Višnjički Boulevard on a daily basis not knowing that there is a serious
possibility of environmental contamination on the edge of the boulevard.
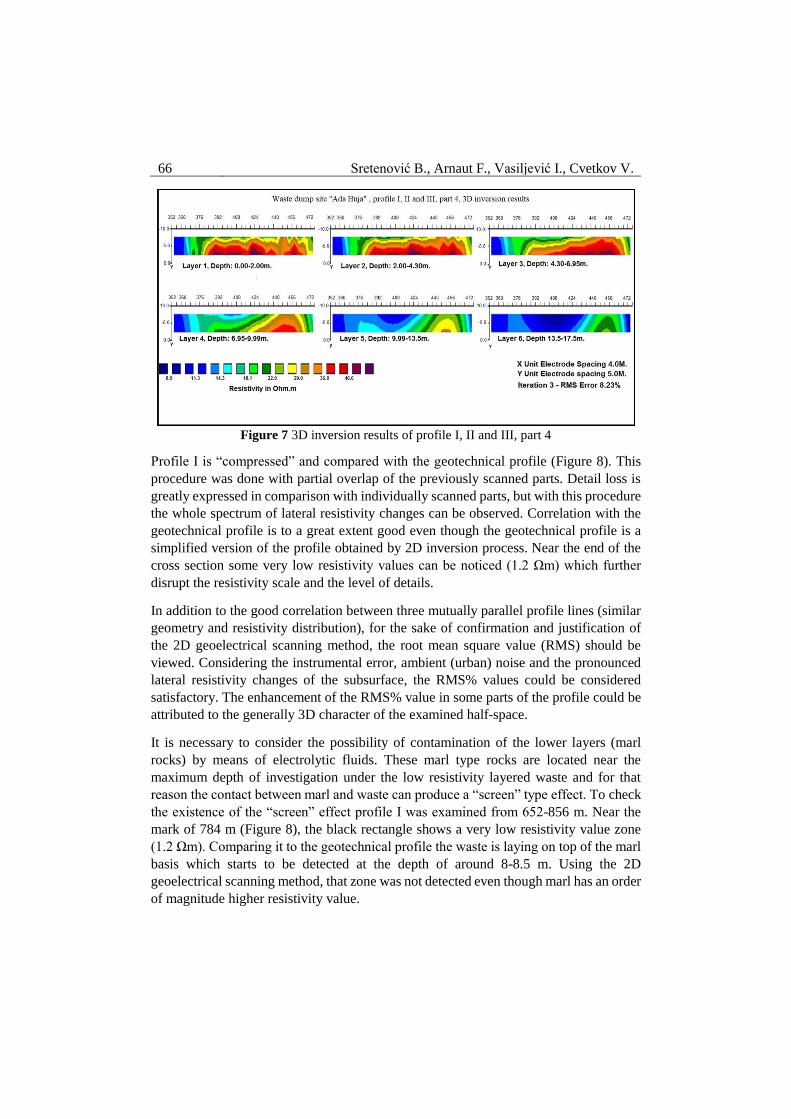
Plot areas should be taken with a reserve considering that they go out of the examined
terrain, hence nobody can know for sure if the contaminated trend is maintained. Figure
10b shows the real area of the surveyed terrain and Figure 10a shows the cadastre plots
of the terrain.
Figure 10 Maps: a) Location of cadastre plots (National Spatial Data Infrastructure, 2019)
and b) the real area of the surveyed terrain (Google Earth)
Table contents (Table 1) should give adequate information about the land class. Parcels
7/36, 7/38 and 7/40 are labeled as “Class I Forest” (ash and oak tree) and they occupy
around 19280 m2 (192.8 are). Class I forest represents the highest quality of wood
(Official Gazette of the Republic of Serbia, 1994).

2D geoelectrical resistivity tomography … 69
Table 1 Basic information about the cadaster parcels on the investigated terrain
(Republic Geodetic Authority, 2019)
Parcel
Number Owner/User Way of Land Use Type of Land
Status of the
Construction
(if it exists)
Area
[m2]
7/1 Belgrade Pier
AS
Land under Construction
Buildings/Class I Forest
Cities Urban Construction
Land
Unknown Purpose, Constructed Without
a Permit 77897
7/2 City of
Belgrade Canal
Cities Urban Construction
Land / 2716
7/3 City of
Belgrade
Land under Construction Buildings
and Other Objects
Cities Urban Construction
Land
Unknown Purpose, Constructed Without
a Permit 460
7/7 City of
Belgrade Deep Pond
Cities Urban Construction
Land / 11
7/32 Belgrade Pier
AS
Land under Construction Buildings
and Other Objects
Cities Urban Construction
Land
Unknown Purpose, Constructed Without
a Permit 1995
7/35 City of
Belgrade
Land under Construction Buildings
and Other Objects
Cities Urban Construction
Land
Unknown Purpose, Constructed Without
a Permit
1531
7/36 City of
Belgrade Class I Forest
Cities Urban Construction
Land / 9377
7/37 City of
Belgrade Canal
Cities Urban Construction
Land / 35
7/38 City of
Belgrade Class I Forest
Cities Urban
Construction
Land
/ 236
7/39 City of
Belgrade Deep Pond
Cities Urban
Construction
Land
/ 57864
7/40 City of
Belgrade Class I Forest
Cities Urban
Construction
Land
/ 9667
7/42 City of
Belgrade
Artificialy Made
Infertile Land
Cities Urban
Construction
Land
/ 359

70 Sretenović B., Arnaut F., Vasiljević I., Cvetkov V.
Visiting the examined terrain (Figure 11), it was quickly obvious that there is no
indication of a Class I Forest.
Figure 11 Examined terrain photographed on 29thMarch 2019.
3.2 Possible Environmental Threats
The list of the possible ecosystem threats regarding the locality of the former communal
waste dump site “Ada Huja” can be lengthy, but without thorough examination it remains
speculative i.e. theoretical. Investigation based on theoretical assumptions can be quite
appropriate, if conducted correctly and relying on already accepted previous research.
Broadly speaking, the main waste dump site contaminants are asbestos (if construction
material that was assembled during the twentieth century was deposited), hydrogen-
sulfide (H2S), carbon-monoxide (CO), carbon-dioxide (CO2) and the side effects of
decomposition of polyethylene-terephthalate (PET).
3.2.1 Asbestos
Because of its mechanical properties, asbestos was used in civil engineering from the
beginning of the twentieth century. During the 1980’s health consequences were
established (a vast variety of carcinogens and respiratory diseases) that were directly
2D geoelectrical resistivity tomography … 71
linked to air contamination by asbestos fibers. From that point on, any handling is heavily
regulated (from 2008 banned for civil use by the Republic of Serbia). Guided by the rule
book “Handling of asbestos contaminated waste” published in the journal “Official
Gazette of the Republic of Serbia” number 75/2010 main concerns will be expressed.
The term asbestos does not relate to one substance, but to a whole group of fiber silicates
that will be cited:
• Crocidolite,
• Actinolite,
• Anthophyllite,
• Chrysotile
• Amosite,
• Tremolite.
It is important to note that the Republic of Serbia does not have a waste dump site for
the disposal of environmental threatening and industrial waste where asbestos, mineral
wool, waste with adsorption properties and ionic masses belong (Environmental
protection secretariat, 2008). Because of this kind of assertion, it is not unlikely that
during the lifespan of the waste dump site “Ada Huja” construction material containing
asbestos was deposited, and was not handled according to Article 4 (Official Gazette of
the Republic of Serbia, 1994) i.e. did not succumb to regular air emission measurements
and fluid leakage.
Results of geoelectrical measurements and borehole data did show a groundwater level
existed, that water reacts with the decomposing waste and creates and electrolyte with a
very low resistivity value. The fibrous minerals do not react with water nor with acid
solutions except chrysotile which in a reaction with acidic solutions can release toxic
matter to the ecosystem.
3.2.2 Side effects of continuous disposal of polyethylene-terephthalate
(PET containers)
Polyethylene-terephthalate (PET) is half-crystalline, thermoplastic polyester which is
one of the most used varieties of polyester due to its superior mechanical and chemical
properties (Supawee and Wanlop, 2014). Primary use of PET containers in everyday life
is for water and soft drink packaging, as well as electronics, home appliances, textiles
etc.
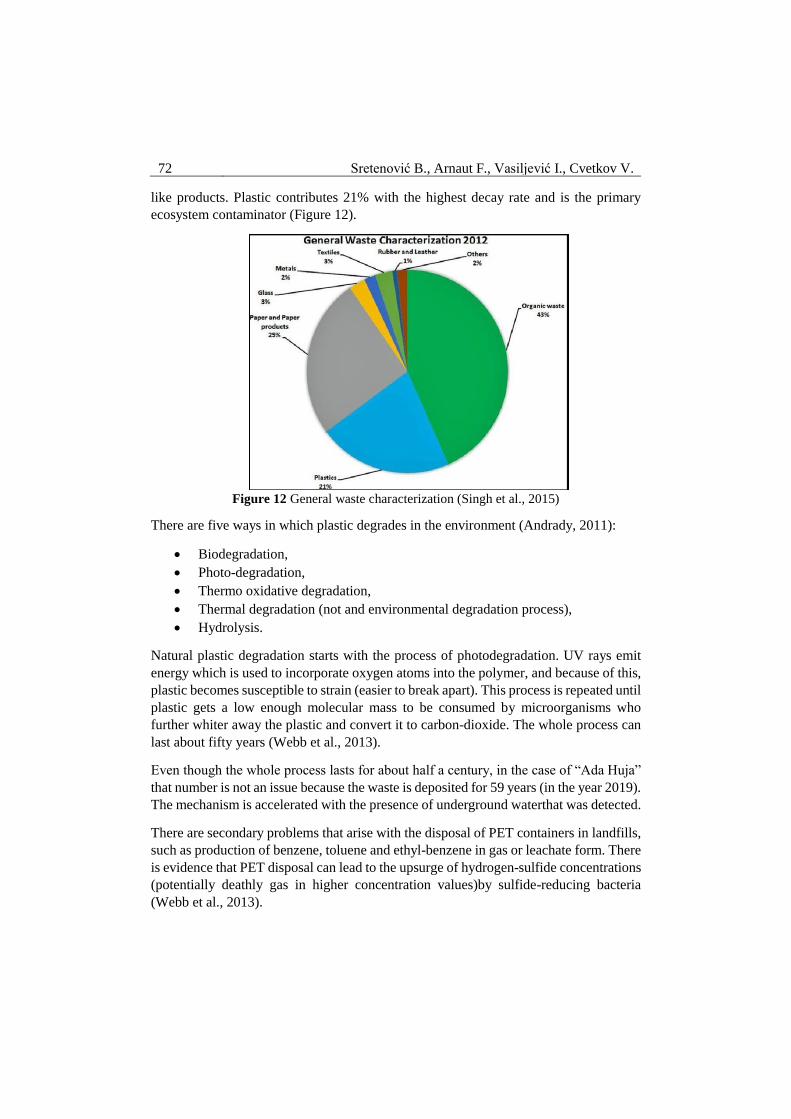
According to data of the “General characterization of waste” (Singh et al., 2015) which
was not conducted for the Belgrade locality but can be used with some reserves, organic
waste boasts a maximum of household waste with 43%, but that waste is biodegradable
so it is not accounted for in the “Ada Huja” case. This is also true for paper and paper-
72 Sretenović B., Arnaut F., Vasiljević I., Cvetkov V.
like products. Plastic contributes 21% with the highest decay rate and is the primary
ecosystem contaminator (Figure 12).
Figure 12 General waste characterization (Singh et al., 2015)
There are five ways in which plastic degrades in the environment (Andrady, 2011):
• Biodegradation,
• Photo-degradation,
• Thermo oxidative degradation,
• Thermal degradation (not and environmental degradation process),
• Hydrolysis.
Natural plastic degradation starts with the process of photodegradation. UV rays emit
energy which is used to incorporate oxygen atoms into the polymer, and because of this,
plastic becomes susceptible to strain (easier to break apart). This process is repeated until
plastic gets a low enough molecular mass to be consumed by microorganisms who
further whiter away the plastic and convert it to carbon-dioxide. The whole process can
last about fifty years (Webb et al., 2013).
Even though the whole process lasts for about half a century, in the case of “Ada Huja”
that number is not an issue because the waste is deposited for 59 years (in the year 2019).
The mechanism is accelerated with the presence of underground waterthat was detected.
There are secondary problems that arise with the disposal of PET containers in landfills,
such as production of benzene, toluene and ethyl-benzene in gas or leachate form. There
is evidence that PET disposal can lead to the upsurge of hydrogen-sulfide concentrations
(potentially deathly gas in higher concentration values)by sulfide-reducing bacteria
(Webb et al., 2013).
2D geoelectrical resistivity tomography … 73
3.2.3 Methane
Methane is a carbonic compound formed when one hydrogen atom is linked to four
oxygen atoms with single bounds. Methane is an odorless, colorless gas which is not
toxic but is highly flammable and it is a side effect of every landfill especially the ones
that are not regulated by the state (safely secured).
Not sanitizing the methane released from a landfill will inevitably lead to its release into
the atmosphere. Methane has a 23 times higher global warming index than the same
volume of carbon-dioxide (Themelis and Ulloa, 2006)
Not long after the waste is disposed in a landfill, organic compounds initiate biochemical
reactions in an air stimulated environment. The product of this reaction is carbon-dioxide
and water vapor. First phase is bacteria fermentation, which in a process of hydrolysis
dissolve complex organic compounds into smaller molecules. Second phase is the
transformation of those molecules into organic acids, carbon-dioxide and hydrogen. The
last phase is methane production by methanogenic bacteria which either dissolve those
acids into methane and carbon-dioxide or reduce carbon-dioxide with hydrogen
(Themelis and Ulloa, 2006).
Looking at the research done by the Environmental and Energy Study Institute (Pierson,
2013), and neglecting the cost of installation of such a plant, the calculated values were
that one million tons on a day to day basis can produce 12233 m3 of landfill methane,
that is equivalent to 0.78 MW of electrical energy.
Taking into account the previously exhibited data, and looking at the 2017 methane
stimulated fire at the landfill “Vinča“, which posed a threat to a million and a half
inhabitants of Belgrade, such a mini-plant would not be a enormous investment. Daily
production of waste for the city of Belgrade reaches 1700 tones (Mitrović, 2014).
3.2.4 Other hazardous compounds
Presence of other compounds which take less than 1%in the produced landfill substances
cannot be ignored. Those compounds are mostly organic-sulfides, oxidized and other
organic compounds. The biggest accompanying problem of these gases is the smell
threshold, a value that can be quantified. The best representative compound is hydrogen-
sulfide (H2S) with its well-known smell (like rotten eggs) which has less than 1% intake
in the total discharged gas. Measuring the smell threshold in a landfill hydrogen-sulfide
ranks in the top three causes of repulsive odor just behind methyl-sulfide and ethyl-
acetate (Yue et al., 2012).
Gases that contribute to global warming cannot be forgotten, they predominantly consist
of carbon-dioxide and carbon-monoxide. Alongside methane which makes up 45-60%
of the total emitted gas from a landfill, carbon-dioxide takes the rest 40-60% leaving just
around 1% to other gases (Marković and Stevović, 2016). The presence of water vapor

74 Sretenović B., Arnaut F., Vasiljević I., Cvetkov V.
can speed up the process of gas production. This is of great value for the examined terrain
“Ada Huja” because underground water level was detected.
4 CORRECT ECOLOGICAL AND GEOLOGICAL CONDITIONS FOR
A LANDFILL
From a geological point of view, the most important aspect of a controlled and safe
landfill is the isolation of the disposed waste. This implies scouting the terrain for
favorable conditions (not in contact with a water spring or any underground water,
appropriate rock type basis, further enough from housing estates but still a good road
connection etc.) and after this the engineering part starts (correct isolation of the hole,
pipelines for oxygen pumping and methane recovery, mini-station for leachate treatment
etc.)
Geoelectrical and geotechnical investigations that were carried out on the terrain
established a marl foundation. Pure marl is a carbonate-clay rock that consists out of 75-
40% calcium-carbonate (CaCO3) and around 43-22.4% calcium-oxide (CaO) (Đorđević
et al., 1991). Clay type rocks are most suitable for a good foundation for a controlled
landfill. Additionally, boreholes have to be present to monitor the subsurface water level
even though the waste is “incubated” from the surrounding rocks (Figure 13).
This kind of a landfill not only uses the waste to produce electric energy, but it provides
several job openings, and reduces the risk of a methane stimulated fire. Monetary
investments for this kind of a project can be steep, but it is of most importance to make
a good economical calculation for taking a part in this kind of project. United States of
America is a country that has the most initiative for methane exploitation with 519 plants
(Alexander, 2010).
Figure 13 Controlled landfill with a methane induced mini-plant (Earle, 2005)
2D geoelectrical resistivity tomography … 75
5 CONCLUSION
Geoelectrical surveys for obtaining a better understanding about the subsurface geometry
have shown its full potential in the form of needed funds, reliability and acquisition
speed. Further surveys showed a good correlation between the borehole data and 2D
inversion process.
The location of the surveyed area is a very interesting terrain in a form of civil
engineering opportunities, because of its proximity to the Belgrade city center. It is of
great importance that any sort of civil engineering project that takes place on the
examined terrain should be heavily regulated. The release of subsurface gasses into the
atmosphere will yield side effects on the environment.
To get a completely detailed picture of the ecological situation of “Ada Huja” further
research should be undertaken. This research should include additional geoelectrical
measurements with more depth levels, pH value measurements (to reveal whether the
electrolyte is a strong acid or a strong base), measurements to determine how much
subsurface gas is present (methane, hydrogen-sulfide, carbon-monoxide, carbon-dioxide
etc.), and hydrogeological measurements for the quality of the underground water.
REFERENCES
ALEXANDER, A. (2010) An Overview of Landfill Gas Energy, Landfill Methane
Outreach Program (LMOP).
ANDRADY, A. (2011) Microplastics in the marine environment. Marine Pollution
Bulletin, 62, pp. 1596-1605.
DAHLIN, T. (1996) 2D Resistivity surveying for environmental and engineering
applications. First Break, 14, pp. 275-284.
EARLE, S. (2005) Geology 312. Malaspina University College.
ĐORĐEVIĆ, V. and ĐORĐEVIĆ P. (1991) Petrology. Belgrade: Nauka.
ENVIRONMENTAL PROTECTION SECRETARIAT (2008) Report on life quality in
the Belgrade area in 2008. Belgrade, Serbia.
GOOGLE EARTH (2019) Google Earth. [Online] Available from:
https://earth.google.com/web [Accessed 13/04/19]
LOKE, M.H. (2004) Tutorial: 2-D and 3-D electrical imaging surveys. Geotomo
Software, Res2dinv 3.5 Software.
MARKOVIĆ, J. and STEVOVIĆ, S. (2016) The process of creation and analysis of the
landfill gas from the landfill in the region of Pchinja. Journal on Processing and Energy
in Agriculture, 20, pp. 63-68.

76 Sretenović B., Arnaut F., Vasiljević I., Cvetkov V.
MITROVIĆ, S. (2014) Applied Ecology- guidebook,chapter 3 (Green potential of the
city of Belgrade). Ministry of agriculture and environmental protection, pp. 208-235.
NATIONAL SPATIAL DATA INFRASTRUCTURE (2019) Geosrbija. [Online]
Available from: https://geosrbija.rs/en/ [Accessed 13/04/19]
OFFICIAL GAZETTE OF THE REPUBLIC OF SERBIA (1994) Rulebook on the
cadastre land classing, 37/94 and 49/94. Belgrade, Serbia.
OFFICIAL GAZETTE OF THE REPUBLIC OF SERBIA (2010) Rulebook on handling
asbestos contaminated waste, 75/2010. Belgrade, Serbia.
PIERSON, R. (2013) Landfill Methane, Fact Sheet. Washington: Environmental and
Energy Study Institute.
REPUBLICAL STATISTICAL INSTITUTE (2011) Republic of Serbia Census report
2011. Belgrade, Serbia.
REPUBLIC GEODETIC AUTHORITY (2019) Real-estate cadaster (eCadaster).
[Online] RGZ, Available from: http://www.rgz.gov.rs/ [Accessed 13/04/19]
SINGH, R.K. et al. (2015) Analyzing waste problems in developing countries: Lessons
for Kathmandu, Nepal throught analysis of the waste system in Tsukuba City Japan.
Journal of Scientific Research and Reports, 8 (6), pp. 1-13.
SRETENOVIĆ, B. (1998) Report on the geoelectrical survey conducted at the former
waste dump site ar Karaburma. Faculty of Mining and Geology, Geotechnical Institute,
Belgrade.
SUPAWEE, M. and WANLOP, H. (2014) Rheological and mechanical properties of
recycled PET modified by reactive extrusion. Energy Procedia, 56, pp. 547-554.
ŠPERL, J. and TROČKOVA, J. (2008) Permeability and porosity of rocks and their
relationship based on laboratory testing. Acta Geodynamica et Geomaterialia, 5 (1), pp.
41-47.
THEMELIS, J. N. and PRISCILLA, A. U. (2006) Methane generation in landfills.
Renewable Energy, 32, pp. 1243-1257.
WEBB, H.K. et al. (2013) Plastic degradation and its environmental implications with
special reference to Poly(ethylene terephthalate). Polymers, 5, pp. 1-18.
YUE, D. et al. (2013) Composition and Distribution of Non-Methane Organic
Compounds at Municipal Solid Waste Landfill Surfaces. Semanticscholar. [Online]
Available from: pdfs.semanticscholar.org/82a1/fb621d96c57c62874fc693b9b783862
68d7e.pdf [Accessed 13/04/19]