Embed Size (px)
Citation preview
29 September 2017
Financial results for the six months ended 30 June 2017 Strategic and operational review update
Carillion plc (“Carillion”, the “Group” or the “Company”) announces its H1 results and an update on its strategic review.
H1 financial performance weaker
• Total revenue flat at £2.5bn
• Underlying pre-tax profit down 40% due to:
- The phasing of PPP equity disposals; and
- The trading of contracts with H1 provisions at zero margin
• Contracts review finalised:
- No change to previously announced provision of £845m for construction contracts
- Further £200m provision for support services contracts, but minimal impact on cash
• Goodwill impairment charge of £134m in respect of UK and Canadian construction businesses
• Average net debt in H1 £694m
• New H1 orders plus probable orders of £2.6bn, with total orders plus probables stable at £16bn
H1 2017 H1 2016
Total Underlying Revenue £2,498m £2,487m Underlying profit from operations
1 £82m £112m
Underlying operating margin1
3.5% 4.9%
Underlying profit before taxation1 £50m £85m
Underlying earnings per share1
9.6p 16.0p (Loss)/profit before taxation £(1,153)m £84m Basic (loss)/earnings per share (261.2)p 15.8p Net debt £571m £291m
Strategic review and balance sheet update
• Business refocused on core strengths and markets - support services, infrastructure and building
• New leadership team and operating model - delayered structure, greater accountability and transparency
• Initial cost reduction target of £75m by mid-2019
• Actions underway to improve cash flow and strengthen balance sheet
• Expected proceeds from non-core business disposals increased to £300m from £125m
• Discussions ongoing regarding sales of Carillion’s business in Canada and the UK Healthcare business
• Pension deficit reduction of £80m, potential to reduce further by £120m
• Agreed further £140m committed facility with a number of banks
Revised full-year outlook
• Full-year results to be lower than current market expectations
• Total revenue expected to be between £4.6bn and £4.8bn (previously £4.8bn to £5.0bn)
• 2017 H1/H2 profit split similar to recent years, before £10m of cost savings and business disposals
• Full-year average net debt expected to be between £825m and £850m
1 Alternative performance measures are defined in note 17 on page 37
CARILLION PLC – ANNOUNCEMENT OF HALF-YEARLY RESULTS FOR THE SIX MONTHS ENDED 30 JUNE 2017
2
• Estimated further restructuring costs of £75m to £100m in H2.
Commenting Keith Cochrane, Interim Chief Executive, said:
“This is a disappointing set of results which reflects the issues we flagged in July and the additional £200m provision for our Support Services business that we have announced today. We now expect results for the full year to be lower than current market expectations. “The Strategic Review that we launched in July has enabled us to get a firm handle on the Group’s problems and we have implemented a clear plan to address them. Our objective is to be a lower risk, lower cost, higher quality business generating sustainable cash backed earnings. In the immediate short term, our focus is to complete the disposal programme, accelerate our action to take cost out of the business and get our balance sheet back to a place where it can support Carillion going forward.
“No one is in any doubt of the challenge that lies ahead. We have made an encouraging start and the ambition is there to build on that progress. At the heart of this company, there is a strong core. Supported by an operating model that manages risk much more effectively and led by a fresh management team with a mandate to drive cultural change, I am confident that a strong business can emerge.” A presentation for institutional investors and analysts will be held today starting at 09:00. The presentation will be webcast live on www.carillionplc.com and subsequently available on demand. A dial-in facility is also available on 0808 109 0700 (UK Toll Free) or +44 (0) 20 3003 2666 (Standard International Access) with a participant pin code of 1209521# and a password of ‘ Carillion'. A replay facility will be available for 7 days on +44 (0) 20 8196 1998 with an access code of 1209521#, password ‘Carillion’. This announcement contains inside information. For further information contact: Institutional Investors and Analysts John Denning, Group Corporate Affairs Director Kellie McAvoy, Head of Investor Relations
tel: +44 (0) 1902 906333
Media Charlie Armitstead/Haya Herbert-Burns Teneo Blue Rubicon
tel: +44 (0) 207 420 3197
29 September 2017 This and other Carillion news releases can be found at www.carillionplc.com. Cautionary statement This announcement may contain indications of likely future developments and other forward-looking statements that are subject to risk factors associated with, among other things, the economic and business circumstances occurring from time to time in the countries, sectors and business segments in which the Group operates. These and other factors could adversely affect the Group's results, strategy and prospects. Forward-looking statements involve risks, uncertainties and assumptions. They relate to events and/or depend on circumstances in the future which could cause actual results and outcomes to differ materially from those currently anticipated. No obligation is assumed to update any forward-looking statements, whether as a result of new information, future events or otherwise.
CARILLION PLC – ANNOUNCEMENT OF HALF-YEARLY RESULTS FOR THE SIX MONTHS ENDED 30 JUNE 2017
3
2017 2016
Change
Income statement
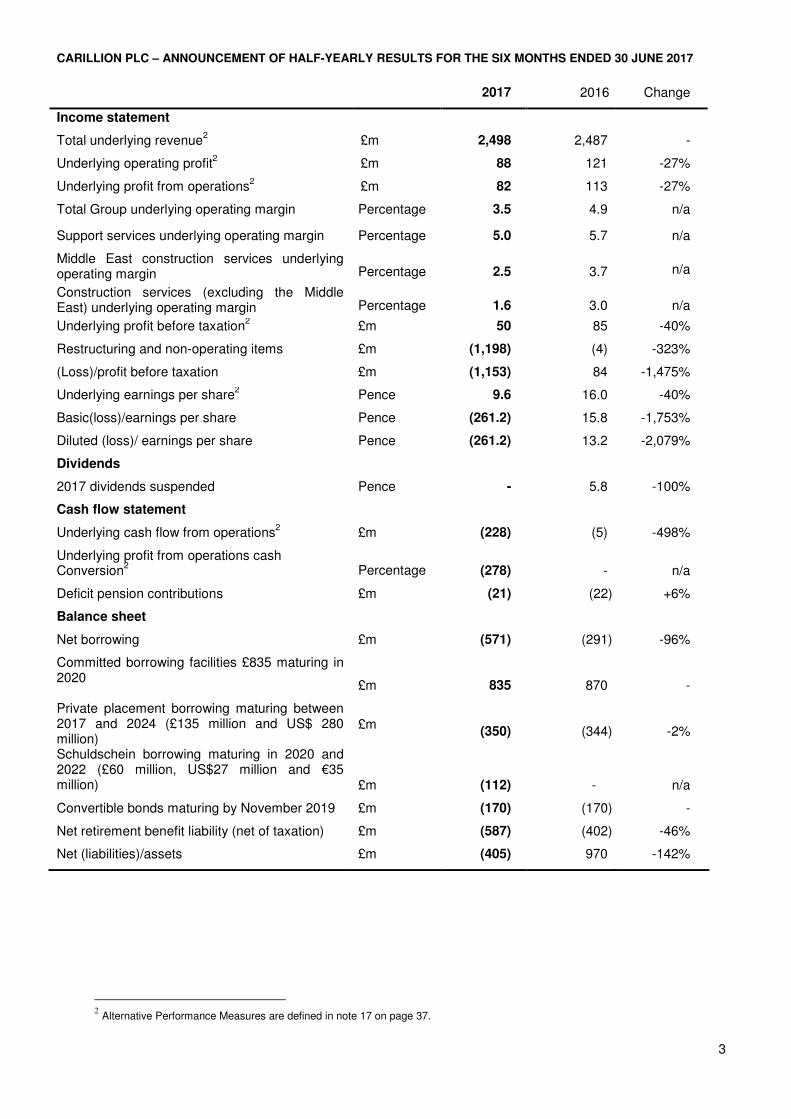
Total underlying revenue2 £m 2,498 2,487 -
Underlying operating profit2
£m 88 121 -27%
Underlying profit from operations2
£m 82 113 -27%
Total Group underlying operating margin Percentage 3.5 4.9 n/a
Support services underlying operating margin Percentage 5.0 5.7 n/a
Middle East construction services underlying operating margin Percentage 2.5 3.7 n/a
Construction services (excluding the Middle East) underlying operating margin Percentage 1.6 3.0 n/a
Underlying profit before taxation2
£m 50 85 -40%
Restructuring and non-operating items £m (1,198) (4) -323%
(Loss)/profit before taxation £m (1,153) 84 -1,475%
Underlying earnings per share2
Pence 9.6 16.0 -40%
Basic(loss)/earnings per share Pence (261.2) 15.8 -1,753%
Diluted (loss)/ earnings per share Pence (261.2) 13.2 -2,079%
Dividends
2017 dividends suspended Pence - 5.8 -100%
Cash flow statement
Underlying cash flow from operations2
£m (228) (5) -498%
Underlying profit from operations cash Conversion
2 Percentage (278) - n/a
Deficit pension contributions £m (21) (22) +6%
Balance sheet
Net borrowing £m (571) (291) -96%
Committed borrowing facilities £835 maturing in 2020
£m 835 870
-
Private placement borrowing maturing between 2017 and 2024 (£135 million and US$ 280 million)
£m (350) (344) -2%
Schuldschein borrowing maturing in 2020 and 2022 (£60 million, US$27 million and €35 million) £m (112) - n/a
Convertible bonds maturing by November 2019 £m (170) (170) -
Net retirement benefit liability (net of taxation) £m (587) (402) -46%
Net (liabilities)/assets £m (405) 970 -142%
2 Alternative Performance Measures are defined in note 17 on page 37.
CARILLION PLC – ANNOUNCEMENT OF HALF-YEARLY RESULTS FOR THE SIX MONTHS ENDED 30 JUNE 2017
4
Introduction Carillion’s first-half performance was weaker than expected with underlying profit from operations to reducing by 27% to £82m and underlying pre-tax profit reduced by 41% to £50m. This reduction is due to the lower contribution to profit from PPP equity disposals and the impact of not recognising a margin on some £400m of revenue on contracts impacted by the exceptional contract provision. Average and spot net borrowing in the first half was in line with expectations. The new management team has been working hard to complete the strategic review and good progress has been made on the actions identified by the review. The Group has also continued to enjoy the support of its major customers, notably the UK Government, and has continued to win significant new contracts. The review of all the Group’s contracts has been completed and the £845m provision for construction contracts that was announced on 10 July remains unchanged and covers all the Group’s construction contracts. However, a further provision of £200m has been taken at the half year in respect of a small number of support services contracts, as described in more detail below. Revenue in 2017 is expected to be between £4.6bn and £4.8bn. The first-half/second half split of profit is
expected to be similar to that in recent years, before factoring in the benefit of cost savings of £10m in 2017 and
the effects of non-core business disposals. Full-year average net borrowing in 2017 is expected to be between
£825m and £850m.
Strategic review The strategic review was designed to objectively assess all areas of the business, focusing on: � Balance sheet and cash – strengthening the balance sheet and reducing net debt through a range of self-
help measures � The shape of the Group – refocusing the Group on its core strengths and markets � Leadership and operating model – creating a simpler, more cost effective operating model, implemented by
a new leadership team
Balance sheet and cash Contracts and portfolio review Since the Group’s trading update on 10 July 2017, the contract review has been completed across all contracts. The assumptions underlying the estimated contracts provision of £845m, have been revisited as part of a review of all the Group’s contracts, based on the latest balance sheet and on contract settlements achieved to date. This review concluded that there is no change required to the £845m provision in respect of all the Group’s construction contracts, albeit that there have been some modest adjustments between how this provision is allocated between the Group’s geographies. The extension of the review across all contracts also identified the need for an additonal provision of £200m in respect of 23 support services contracts out over 600 support services contracts. This provision, which has also been taken at 30 June 2017, has minimal cash impact of between £10m and £15m and comprises the following: � £91m for underperforming contracts that the Group has decided to exit. � £56m for underperforming contracts for which expectations have been re-based. � £53m in respect of contracts for which a more prudent view of receivables has been taken. In addition, a goodwill impairment charge of £134m has been taken in respect of the UK and Canadian Construction businesses, a provision of £11m in respect of restructuring costs in the first-half of 2017 and a charge of £8m relating to impairment of assets held for sale. An assessment has also been made of the potential impact of IFRS 15, which will be adopted in 2018 retrospectively with the cumulative effect recognised in equity on 1 January 2018. Based on this preliminary assessment, the Group expects a reduction in reserves of between £125m and £150m, but more detailed guidance will be provided on this when Carillion reports its 2017 full-year results. Cost reduction - £75m by mid-2019
CARILLION PLC – ANNOUNCEMENT OF HALF-YEARLY RESULTS FOR THE SIX MONTHS ENDED 30 JUNE 2017
5
Focus on core markets, the new leadership structure and implementation of the new operating model, will enable significant cost reduction. The Group’s current total addressable overhead is £336m, of which £267m is in the UK, which as a percentage of revenue greatly exceeds industry benchmarks provided by EY. The new operating model will generate savings through removal of layers and duplication of management, optimisation of contract delivery and reporting systems, increased professionalisation and efficiency of shared services. There are also significant opportunities to reduce third-party and discretionary expenditure. Total savings are expected to reach a run rate of £75m by the end of 2019, almost all of which is delivered from the UK, with £10m being achieved in 2017 and £50m in 2018. The total cost of delivering these savings is expected to be £75m, of which £20m is expected in 2017, £50m in 2018 and £5m in 2019.
Non-core disposals target increased to £300m A key outcome of the strategic review has been to refocus the business on its core strengths. As a result we are raising our target for non-core disposal proceeds to over £300m by the end of 2018 from our initial target announced in July of £125m. In particular, discussions regarding the sale of the Group’s UK Healthcare business and the business in Canada are both ongoing. Pensions Carillion’s pension deficit (net of taxation) reduced by £76m to £587m (31 December 2016: £663m), due to an increase in asset values and a reduction in inflation rates. Since the half year, Carillion has given notice to the pensions trustee that discretionary increases in pension payments will be withdrawn and this will reduce the Group’s pension deficit by a further £80m. Carillion is also in positive discussions with its principal pensions trustee with a view to agreeing a number of changes, including basing any future pension increases on CPI rather than RPI which could potentially reduce the deficit by a further £120m. Liquidity and covenants A term sheet for further committed credit facilities of £140m have been agreed with five of the Group’s core lenders with £40m maturing on 30 April 2018 and the remainder on 31 December 2018. The Group is compliant with its covenants at 30 June 2017 and is forecast to be in compliance with covenants as at 31 December 2017 and 30 June 2018, before accounting for the positive impact of the disposal of its Canadian operations. Compliance with the leverage covenant is dependent on achieving the underlying forecasts which assume that the normal pattern of receipts and payments continue alongside the completion of a number of PPP disposals and settlement receipts on contracts. The Group has identified mitigating actions, which it could take if
the forecasts are not achieved. Target leverage Deleveraging the balance sheet is a key priority and a major focus of our strategic review. Going forward our target is to move towards an average net debt to EBITDA ratio of between 1.0 and 1.5 by the end of 2018, which the Board believes is appropriate for the nature and composition of Carillion’s business. Early Payment Facility The Group’s Early Payment Facility (EPF) continues to be very attractive to suppliers and has significant benefits to Carillion, in terms of forging long-term relationships with reliable, high-quality suppliers. Carillion therefore intends to retain an EPF, but over the medium term work towards reducing the period within which it pays its partner banks which will reduce the cost of the facility. Equity While self-help measures will lead to a material reduction in our average net debt, these along will not be enough to achieve our target. The Board is therefore considering other available options, including raising equity to repair and strengthen the balance sheet in due course. Future shape of the Group The Group retains strong positions in its core markets. These include infrastructure services, particularly in UK rail and highways; support services, notably for UK Central Government, local public authorities and corporate customers, and the UK telecommunications network; and in selected sectors of the UK building market. Under the new structure from 1 October, the Group will comprise four UK businesses: � Infrastructure – support services and construction primarily for transport infrastructure. Proforma annual revenue
is expected to be approximately £800m, with a medium-term target margin of 3% to 4%.
CARILLION PLC – ANNOUNCEMENT OF HALF-YEARLY RESULTS FOR THE SIX MONTHS ENDED 30 JUNE 2017
6
� Central Government – support services for the Ministry of Defence and other Central Government Departments. Proforma annual revenue is expected to be approximately £800m, with a medium term target marginof 5% to 6%.
� Corporate and Regions – support services for corporate customers and regional public authorities. Proforma annual revenue is expected to be approximately £800m, with a medium-term target margin of 6.5% to 7.5%.
� Building – construction for select public and private sector customers. Proforma annual revenue is expected to be approximately £600m, with a medium-term target margin of 2% to 3%.
The medium term target margins above are adjusted for IFRS 15, and include the full benefit of the cost savings programme asit is delivered. In addition, there will be a new International business, comprising the Group’s activities in the Middle East. The Group will continue to look at ways in which it can de-risk its operations in the Middle East, working closely with our partners across the region to secure the future of this business. The Group will continue to exit activities outside these core areas of expertise. Focus remains on exiting the construction markets in the Caribbean, Canada, Qatar, the Kingdom of Saudi Arabia and Egypt; on exiting all PPP construction markets following completion of existing contracts; and on selective pursuit of construction contracts via lower-risk procurement routes.
Leadership and operating model Operating model The strategic review sets a number of key principles to underpin the new operating model - simple, transparent, fit-for-purpose, professional, flexible and selective. The model, effective from 1 October 2017, comprises a simpler, delayered organisation, led by a smaller, more effective Group Executive, comprising the Chief Executive, Chief Financial Officer, Chief Operating Officer, Chief Transformation Officer, Legal Director and Company Secretary and Chief Human Resources Officer. The new model creates shorter, direct lines of authority, with increased transparency and line-of-sight accountability. In addition, reward will be aligned to performance. The UK businesses will be supported by newly created common centres of excellence for bid management, contract mobilisation, margin and cash improvement, and claims management. This is where problems have arisen in the past and previously, these activities sat within each business unit, creating significant amounts of duplication. Consolidating these activities into the centres of excellence improves efficiency, risk management, consistency and professionalisation across the whole contract lifecycle. Back-office shared services will be more cost effective, with improved balance between in-house and outsourced service delivery. Risk management The new operating model and centres of excellence will also improve risk management and create direct lines of accountability and transparency between each business and the Group Executive. This will fundamentally change our approach to managing contracts. The centres of excellence will comprise small, specialist teams, supporting the four businesses with a consistent and professional approach across all stages of the contract lifecycle. The leader of each centre of excellence will rank equally with the Managing Directors of each business and will have authority over all decisions relevant to their areas of expertise. Alongside strengthened risk management, this model will support improved balance between continued focus on delivery for customers and effective commercial management. Conclusions The strategic review process has enabled the new leadership team to fully understand the Group’s challenges, and to identify a route map to significantly improving the balance sheet, risk profile and performance of the business. A number of actions are being undertaken urgently to address liquidity and rebuild the balance sheet, with which progress to date is positive. Nevertheless, transformation of the business, including a radical change in culture, will take three to five years. It reaffirms a number of the Group’s strengths, including its strong brand and history, reputation for quality and delivery, and the commitment of its people. The outlook for the Group is underpinned by a sizeable order book. These strengths need to be combined with a stronger commercial aptitude, better line-of-sight accountability and an overhead structure that the business can afford, in order to create a lower risk, higher-quality business that
CARILLION PLC – ANNOUNCEMENT OF HALF-YEARLY RESULTS FOR THE SIX MONTHS ENDED 30 JUNE 2017
7
generates sustainable cash-backed earnings. A good start has been made, and the Group will update on progress in due course. H1 financial performance Total underlying revenue remained broadly unchanged at £2.5bn with growth of 7% in support services offset by lower revenues in Middle East construction services as contracts near completion. The Group’s total operating margin reduced to 3.5% (2016: 4.9%), mainly due to trading contracts that we have provisioned against in H1 at zero margin, and the phasing of PPP equity disposals. Consequently underlying operating profit reduced by 27% to £88m (2016: £121m). The movements in the revenue and profit in each business segment are explained in more detail later in this statement in the commentaries on each financial reporting segment. Underlying pre-tax profit reduced by 40% to £50m reflecting the underlying operating profit reduction and an increase in the Group’s net financial expense to £32m (2016: £28m), which mainly reflected an increase in the non-cash pension interest charge and higher net borrowing. The Group’s underlying effective tax rate remained at 15% (2016: 15%) leaving underlying profit after tax at £44m. Non-controlling interests were £2m and underlying earnings per share were 9.6p. The underlying cash outflow from operations was £228m, reflecting a £323m outflow of working capital, primarily due to the previously announced deterioration in cash flows on problem construction contracts. As a result, net borrowing at 30 June 2017 increased substantially to £571m (31 December 2016: £219m) with average net borrowing also increasing to £694m (31 December 2016: £586m). Work winning in the first half remained strong. The Group secured new and probable orders of £2.6bn, of which £2.1bn derives from long-term support services contracts with key customers including the Defence Infrastructure Organisation and BT Openreach. The total value of the Group’s order book plus probable orders remains stable at £16bn (31 December 2016: £16bn). In addition, the Group is a supplier on framework agreements with a total value of up to £23bn, none of which is included in the order book. The strategic review has identified increasingly stringent selectivity criteria to support focus on core markets, leading to the removal of more than £14bn from the Group’s opportunity pipeline. A number of major contracts have also been secured since 30 June 2017, including two packages for HS2 potentially worth up to £446m to Carillion and further support services contracts for the UK Defence Infrastructure Organisation worth over £300m. Outlook Group revenue is now expected to be in the range of £4.6bn to £4.8bn. The weighting of profit in the second-half of
the year is expected to be similar to recent years before factoring in planned disposals and the benefit of cost
savings. Full-year average net borrowing in 2017 is expected to be between £825m and £850m, as we continue to
manage the effect on working capital of a number of contracts completing by the year end.
CARILLION PLC – ANNOUNCEMENT OF HALF-YEARLY RESULTS FOR THE SIX MONTHS ENDED 30 JUNE 2017
8
Business segments
Revenue and operating profit by business segment
Change from
2017 2016 2016 £m £m % Total revenue Support services 1,423.5 1,336.0 +7 Public Private Partnership projects 132.6 143.8 -8 Middle East construction services 267.3 320.3 -17 Construction services (excluding the Middle East) 674.5 687.0 -2 2,497.9 2,487.1 - Underlying operating profit Support services 71.3 75.9 -6 Public Private Partnership projects 6.3 19.7 -68 Middle East construction services 6.6 11.7 -44 Construction services (excluding the Middle East) 10.6 20.7 -49 94.8 128.0 -26 Group eliminations and unallocated items (6.7) (6.7) - Underlying profit from operations before Joint Ventures net financial expense and taxation 88.1 121.3 -27 Share of Joint Ventures net financial expense (4.6) (6.9) -33 Share of Joint Ventures taxation (1.2) (1.7) -29 Underlying profit from operations 82.3 112.7 -27 Underlying Group net financial expense (32.0) (28.2) -13 Underlying profit before taxation 50.3 84.5 -40
Intangible amortisation arising from business combinations (7.4) (6.8) -9
Non-recurring operating items (1,189.5) (10.5) -1,133
Non-operating items (8.7) - n/a
Fair value movements in derivative financial instruments 2.0 9.9 -80
Changes in contingent consideration relating to acquisitions - 6.8 -100
Reported profit before taxation (1,153.3) 83.9 -1,475
Support services
2017
£m
2016
£m
Change from 2016
% Revenue - Group - Share of Joint Ventures
1,296.9
126.6 1,203.1
132.9
1,423.5 1,336.0 +7 Underlying operating profit
- Group - Share of Joint Ventures
64.9 6.4
65.610.3
71.3 75.9 -6
In this segment we report the results of our facilities management, facilities services, energy services, rail services, road maintenance services, utilities services, remote site accommodation services and consultancy businesses in the UK, Canada and the Middle East. The increase in support services revenue was largely due to foreign exchange (in particular a weakening of sterling against the Canadian dollar) and the first-time consolidation of the facilities management business acquired from a subsidiary of Compass Group Canada Limited. Underlying operating profit reduced to £71m (2016: £76m), primarily as a result of recognising no margin on certain contracts subject to provisions in the first half, with a corresponding reduction in the underlying operating margin to 5% (2016: 6%). Work winning in support services remained strong, with total new orders and probable orders in the first half worth £2.1bn, compared with £1.6bn in the first half of 2016. This was an encouraging performance given the continuing impact of Brexit on the pace of contract awards, particularly public sector organisations. At 30 June
CARILLION PLC – ANNOUNCEMENT OF HALF-YEARLY RESULTS FOR THE SIX MONTHS ENDED 30 JUNE 2017
9
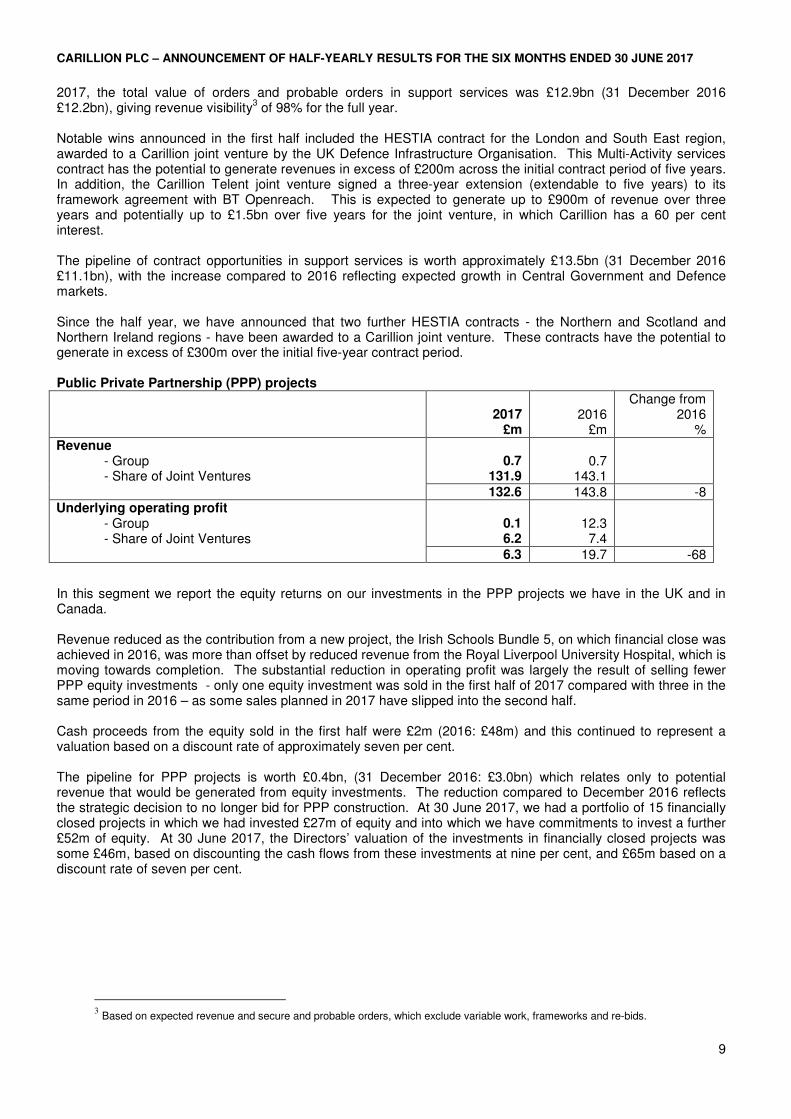
2017, the total value of orders and probable orders in support services was £12.9bn (31 December 2016 £12.2bn), giving revenue visibility
3 of 98% for the full year.
Notable wins announced in the first half included the HESTIA contract for the London and South East region, awarded to a Carillion joint venture by the UK Defence Infrastructure Organisation. This Multi-Activity services contract has the potential to generate revenues in excess of £200m across the initial contract period of five years. In addition, the Carillion Telent joint venture signed a three-year extension (extendable to five years) to its framework agreement with BT Openreach. This is expected to generate up to £900m of revenue over three years and potentially up to £1.5bn over five years for the joint venture, in which Carillion has a 60 per cent interest. The pipeline of contract opportunities in support services is worth approximately £13.5bn (31 December 2016 £11.1bn), with the increase compared to 2016 reflecting expected growth in Central Government and Defence markets. Since the half year, we have announced that two further HESTIA contracts - the Northern and Scotland and Northern Ireland regions - have been awarded to a Carillion joint venture. These contracts have the potential to generate in excess of £300m over the initial five-year contract period. Public Private Partnership (PPP) projects
2017
£m
2016
£m
Change from 2016
% Revenue - Group - Share of Joint Ventures
0.7
131.9
0.7
143.1
132.6 143.8 -8 Underlying operating profit
- Group - Share of Joint Ventures
0.1 6.2
12.3 7.4
6.3 19.7 -68
In this segment we report the equity returns on our investments in the PPP projects we have in the UK and in Canada. Revenue reduced as the contribution from a new project, the Irish Schools Bundle 5, on which financial close was achieved in 2016, was more than offset by reduced revenue from the Royal Liverpool University Hospital, which is moving towards completion. The substantial reduction in operating profit was largely the result of selling fewer PPP equity investments - only one equity investment was sold in the first half of 2017 compared with three in the same period in 2016 – as some sales planned in 2017 have slipped into the second half. Cash proceeds from the equity sold in the first half were £2m (2016: £48m) and this continued to represent a valuation based on a discount rate of approximately seven per cent. The pipeline for PPP projects is worth £0.4bn, (31 December 2016: £3.0bn) which relates only to potential revenue that would be generated from equity investments. The reduction compared to December 2016 reflects the strategic decision to no longer bid for PPP construction. At 30 June 2017, we had a portfolio of 15 financially closed projects in which we had invested £27m of equity and into which we have commitments to invest a further £52m of equity. At 30 June 2017, the Directors’ valuation of the investments in financially closed projects was some £46m, based on discounting the cash flows from these investments at nine per cent, and £65m based on a discount rate of seven per cent.
3 Based on expected revenue and secure and probable orders, which exclude variable work, frameworks and re-bids.
CARILLION PLC – ANNOUNCEMENT OF HALF-YEARLY RESULTS FOR THE SIX MONTHS ENDED 30 JUNE 2017
10
Middle East construction services
2017 £m
2016 £m
Change from 2016
% Revenue - Group - Share of Joint Ventures
147.5 119.8
200.1 120.2
267.3 320.3 -17 Underlying operating profit
- Group - Share of Joint Ventures
4.0 2.6
4.5 7.2
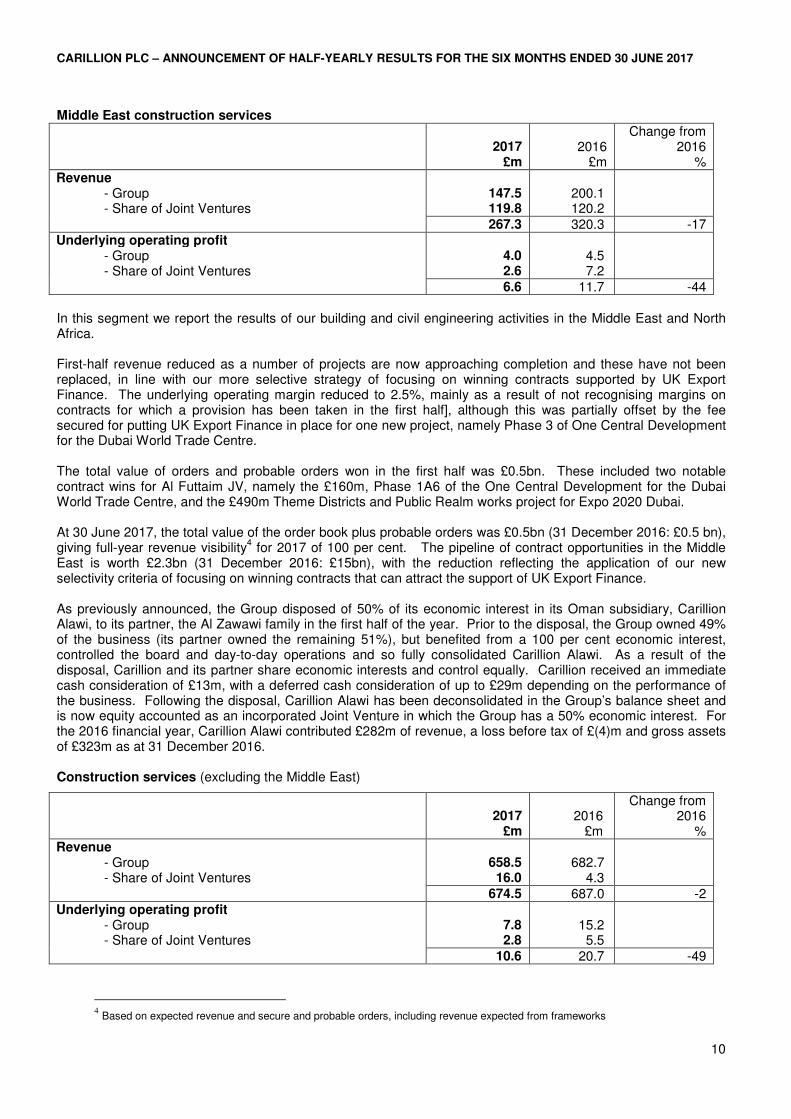
6.6 11.7 -44 In this segment we report the results of our building and civil engineering activities in the Middle East and North Africa.
First-half revenue reduced as a number of projects are now approaching completion and these have not been replaced, in line with our more selective strategy of focusing on winning contracts supported by UK Export Finance. The underlying operating margin reduced to 2.5%, mainly as a result of not recognising margins on contracts for which a provision has been taken in the first half], although this was partially offset by the fee secured for putting UK Export Finance in place for one new project, namely Phase 3 of One Central Development for the Dubai World Trade Centre. The total value of orders and probable orders won in the first half was £0.5bn. These included two notable contract wins for Al Futtaim JV, namely the £160m, Phase 1A6 of the One Central Development for the Dubai World Trade Centre, and the £490m Theme Districts and Public Realm works project for Expo 2020 Dubai.
At 30 June 2017, the total value of the order book plus probable orders was £0.5bn (31 December 2016: £0.5 bn), giving full-year revenue visibility
4 for 2017 of 100 per cent. The pipeline of contract opportunities in the Middle
East is worth £2.3bn (31 December 2016: £15bn), with the reduction reflecting the application of our new selectivity criteria of focusing on winning contracts that can attract the support of UK Export Finance.
As previously announced, the Group disposed of 50% of its economic interest in its Oman subsidiary, Carillion Alawi, to its partner, the Al Zawawi family in the first half of the year. Prior to the disposal, the Group owned 49% of the business (its partner owned the remaining 51%), but benefited from a 100 per cent economic interest, controlled the board and day-to-day operations and so fully consolidated Carillion Alawi. As a result of the disposal, Carillion and its partner share economic interests and control equally. Carillion received an immediate cash consideration of £13m, with a deferred cash consideration of up to £29m depending on the performance of the business. Following the disposal, Carillion Alawi has been deconsolidated in the Group’s balance sheet and is now equity accounted as an incorporated Joint Venture in which the Group has a 50% economic interest. For the 2016 financial year, Carillion Alawi contributed £282m of revenue, a loss before tax of £(4)m and gross assets of £323m as at 31 December 2016. Construction services (excluding the Middle East)
2017
£m
2016 £m
Change from 2016
% Revenue - Group - Share of Joint Ventures
658.5 16.0
682.7
4.3
674.5 687.0 -2 Underlying operating profit
- Group - Share of Joint Ventures
7.8 2.8
15.2 5.5
10.6 20.7 -49
4 Based on expected revenue and secure and probable orders, including revenue expected from frameworks
CARILLION PLC – ANNOUNCEMENT OF HALF-YEARLY RESULTS FOR THE SIX MONTHS ENDED 30 JUNE 2017
11
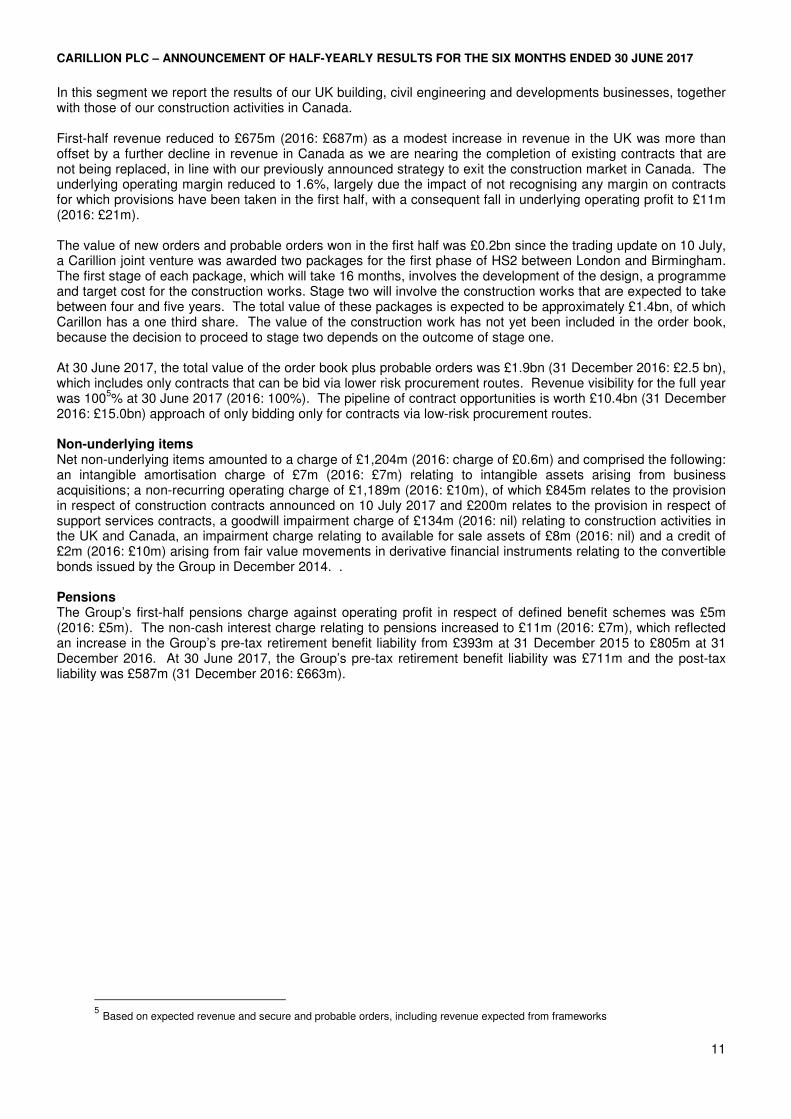
In this segment we report the results of our UK building, civil engineering and developments businesses, together with those of our construction activities in Canada. First-half revenue reduced to £675m (2016: £687m) as a modest increase in revenue in the UK was more than offset by a further decline in revenue in Canada as we are nearing the completion of existing contracts that are not being replaced, in line with our previously announced strategy to exit the construction market in Canada. The underlying operating margin reduced to 1.6%, largely due the impact of not recognising any margin on contracts for which provisions have been taken in the first half, with a consequent fall in underlying operating profit to £11m (2016: £21m).
The value of new orders and probable orders won in the first half was £0.2bn since the trading update on 10 July, a Carillion joint venture was awarded two packages for the first phase of HS2 between London and Birmingham. The first stage of each package, which will take 16 months, involves the development of the design, a programme and target cost for the construction works. Stage two will involve the construction works that are expected to take between four and five years. The total value of these packages is expected to be approximately £1.4bn, of which Carillon has a one third share. The value of the construction work has not yet been included in the order book, because the decision to proceed to stage two depends on the outcome of stage one. At 30 June 2017, the total value of the order book plus probable orders was £1.9bn (31 December 2016: £2.5 bn), which includes only contracts that can be bid via lower risk procurement routes. Revenue visibility for the full year was 100
5% at 30 June 2017 (2016: 100%). The pipeline of contract opportunities is worth £10.4bn (31 December
2016: £15.0bn) approach of only bidding only for contracts via low-risk procurement routes.
Non-underlying items Net non-underlying items amounted to a charge of £1,204m (2016: charge of £0.6m) and comprised the following: an intangible amortisation charge of £7m (2016: £7m) relating to intangible assets arising from business acquisitions; a non-recurring operating charge of £1,189m (2016: £10m), of which £845m relates to the provision in respect of construction contracts announced on 10 July 2017 and £200m relates to the provision in respect of support services contracts, a goodwill impairment charge of £134m (2016: nil) relating to construction activities in the UK and Canada, an impairment charge relating to available for sale assets of £8m (2016: nil) and a credit of £2m (2016: £10m) arising from fair value movements in derivative financial instruments relating to the convertible bonds issued by the Group in December 2014. .
Pensions The Group’s first-half pensions charge against operating profit in respect of defined benefit schemes was £5m (2016: £5m). The non-cash interest charge relating to pensions increased to £11m (2016: £7m), which reflected an increase in the Group’s pre-tax retirement benefit liability from £393m at 31 December 2015 to £805m at 31 December 2016. At 30 June 2017, the Group’s pre-tax retirement benefit liability was £711m and the post-tax liability was £587m (31 December 2016: £663m).
5 Based on expected revenue and secure and probable orders, including revenue expected from frameworks
CARILLION PLC – ANNOUNCEMENT OF HALF-YEARLY RESULTS FOR THE SIX MONTHS ENDED 30 JUNE 2017
12
Cash flow
2017 £m
2016 £m
Underlying Group operating profit 70.1 90.9
Depreciation and other non-cash items 20.3 4.8
Working capital (323.4) (105.9)
Dividends received from Joint Ventures 4.6 5.7
Underlying cash flow from operations (228.4) (4.5)
Deficit pension contributions (21.0) (22.3)
Non-recurring operating items (9.8) (5.9)
Interest and tax (18.8) (24.2)
Net capital expenditure (19.0) (14.8)
Other (2.7) (4.5)
(299.7) (76.2)
Foreign exchange movements 4.4 (19.4)
Acquisitions and disposals (1.6) 30.0
Dividends (55.0) (55.2)
Change in net borrowing (351.9) (120.8)
Net borrowing at 1 January (218.9) (169.8)
Net borrowing at 30 June (570.8) (290.6)
Average net borrowing (694.3) (541.4)
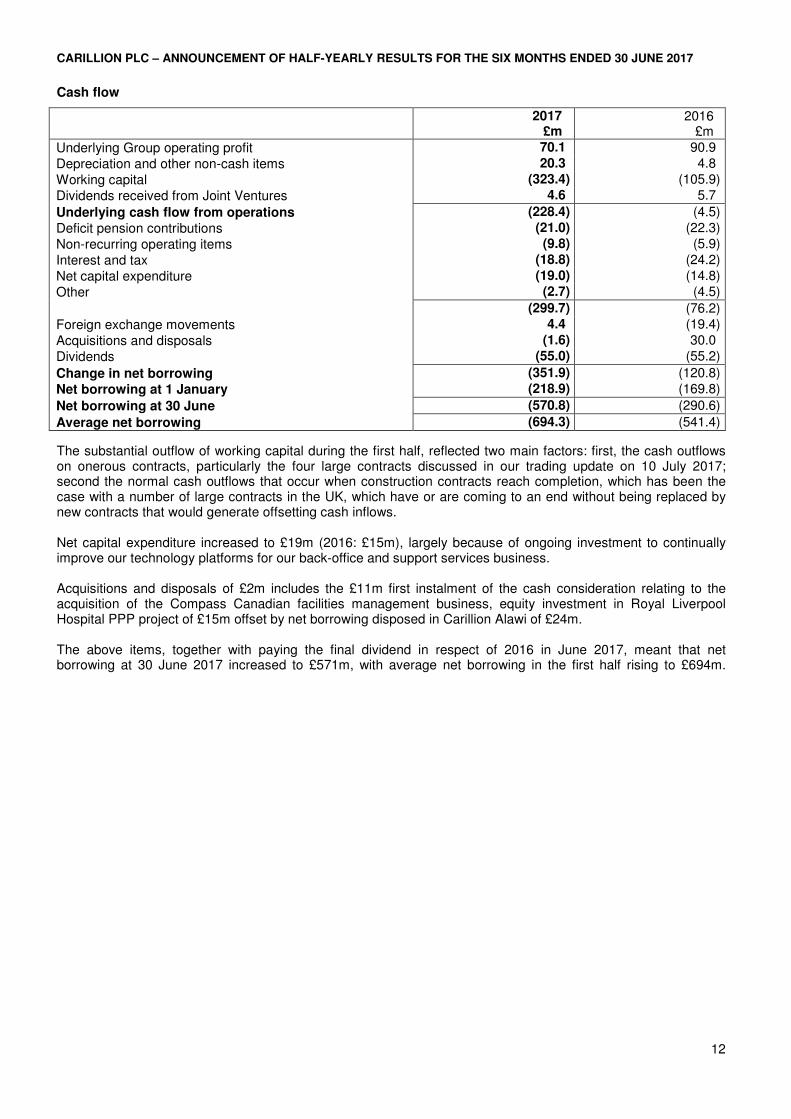
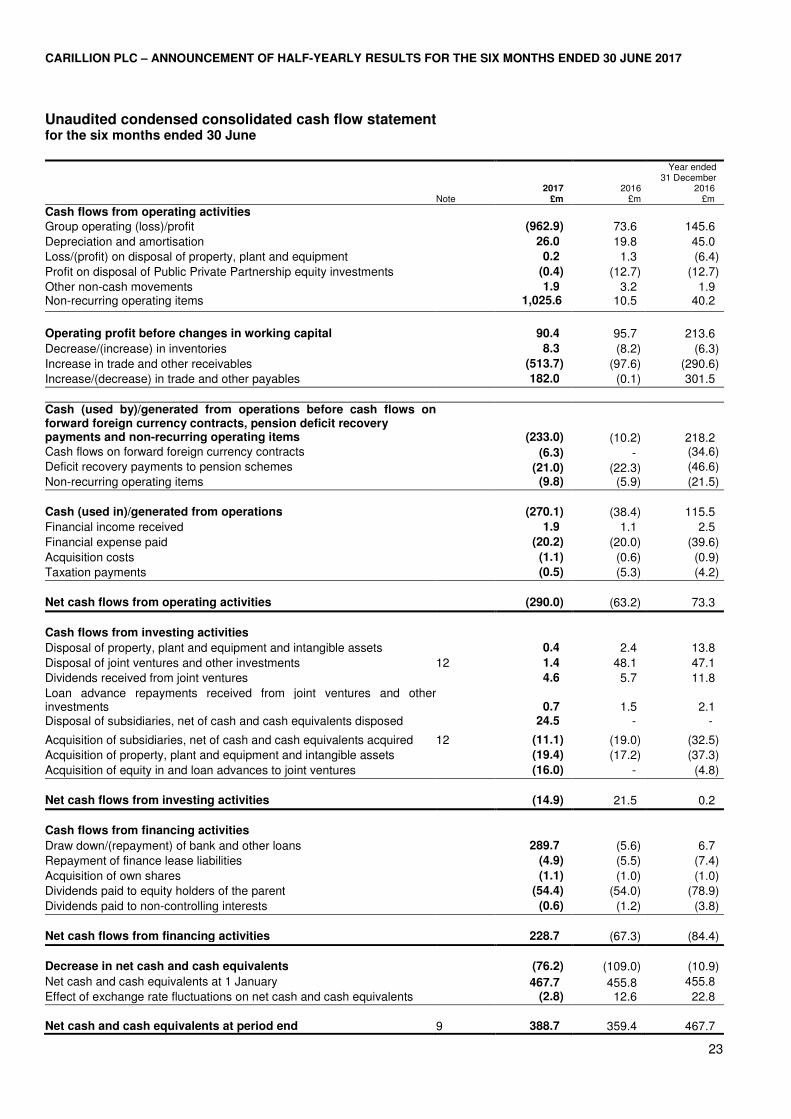
The substantial outflow of working capital during the first half, reflected two main factors: first, the cash outflows on onerous contracts, particularly the four large contracts discussed in our trading update on 10 July 2017; second the normal cash outflows that occur when construction contracts reach completion, which has been the case with a number of large contracts in the UK, which have or are coming to an end without being replaced by new contracts that would generate offsetting cash inflows. Net capital expenditure increased to £19m (2016: £15m), largely because of ongoing investment to continually improve our technology platforms for our back-office and support services business. Acquisitions and disposals of £2m includes the £11m first instalment of the cash consideration relating to the acquisition of the Compass Canadian facilities management business, equity investment in Royal Liverpool Hospital PPP project of £15m offset by net borrowing disposed in Carillion Alawi of £24m. The above items, together with paying the final dividend in respect of 2016 in June 2017, meant that net borrowing at 30 June 2017 increased to £571m, with average net borrowing in the first half rising to £694m.
CARILLION PLC – ANNOUNCEMENT OF HALF-YEARLY RESULTS FOR THE SIX MONTHS ENDED 30 JUNE 2017
13
Balance Sheet 30 June
2017 £m
31 December 2016
£m Property, plant and equipment 138.2 144.1 Intangible assets 1,551.2 1,669.3 Investments 103.4 180.3 1,792.8 1,993.7 Inventories, receivables and payables (757.2) (347.3) Net retirement benefit liability (net of tax) (587.0) (663.2) Other (283.0) (34.4) Net operating assets 165.6 948.8 Net borrowing (570.8) (218.9) Net (liabilities)/assets (405.2) 729.9
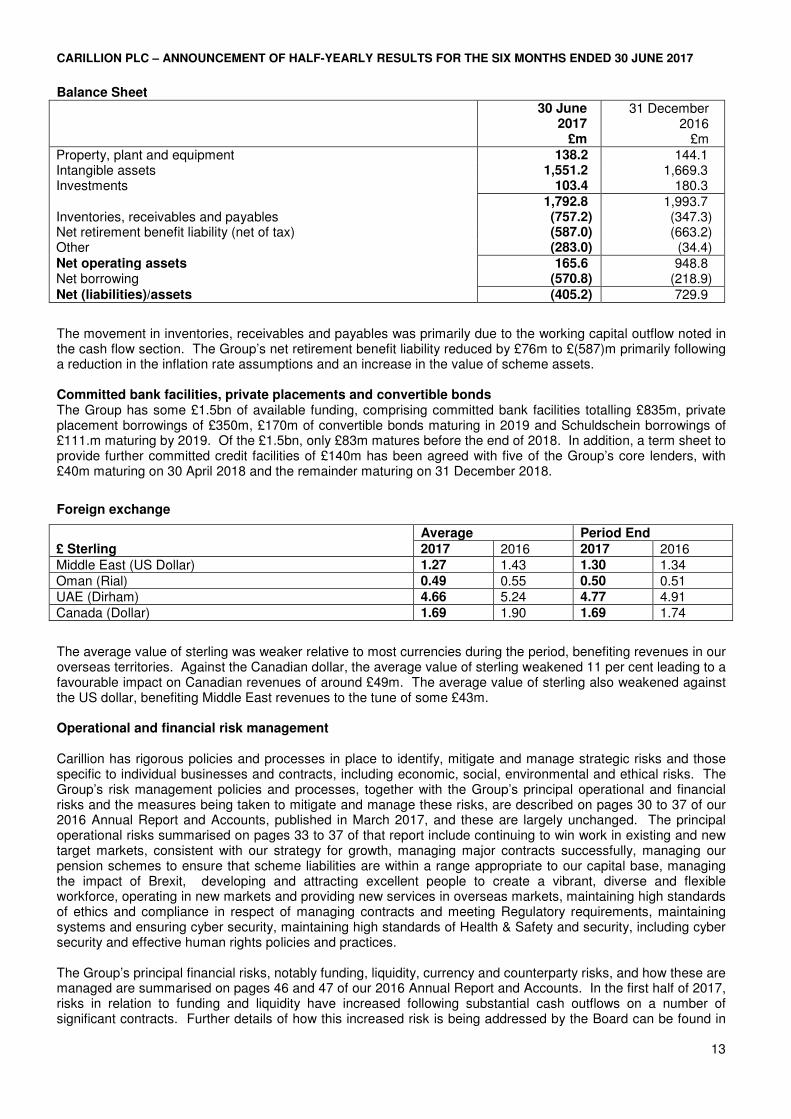
The movement in inventories, receivables and payables was primarily due to the working capital outflow noted in the cash flow section. The Group’s net retirement benefit liability reduced by £76m to £(587)m primarily following a reduction in the inflation rate assumptions and an increase in the value of scheme assets.
Committed bank facilities, private placements and convertible bonds The Group has some £1.5bn of available funding, comprising committed bank facilities totalling £835m, private placement borrowings of £350m, £170m of convertible bonds maturing in 2019 and Schuldschein borrowings of £111.m maturing by 2019. Of the £1.5bn, only £83m matures before the end of 2018. In addition, a term sheet to provide further committed credit facilities of £140m has been agreed with five of the Group’s core lenders, with £40m maturing on 30 April 2018 and the remainder maturing on 31 December 2018.
Foreign exchange
Average Period End
£ Sterling 2017 2016 2017 2016 Middle East (US Dollar) 1.27 1.43 1.30 1.34 Oman (Rial) 0.49 0.55 0.50 0.51 UAE (Dirham) 4.66 5.24 4.77 4.91 Canada (Dollar) 1.69 1.90 1.69 1.74
The average value of sterling was weaker relative to most currencies during the period, benefiting revenues in our overseas territories. Against the Canadian dollar, the average value of sterling weakened 11 per cent leading to a favourable impact on Canadian revenues of around £49m. The average value of sterling also weakened against the US dollar, benefiting Middle East revenues to the tune of some £43m. Operational and financial risk management Carillion has rigorous policies and processes in place to identify, mitigate and manage strategic risks and those specific to individual businesses and contracts, including economic, social, environmental and ethical risks. The Group’s risk management policies and processes, together with the Group’s principal operational and financial risks and the measures being taken to mitigate and manage these risks, are described on pages 30 to 37 of our 2016 Annual Report and Accounts, published in March 2017, and these are largely unchanged. The principal operational risks summarised on pages 33 to 37 of that report include continuing to win work in existing and new target markets, consistent with our strategy for growth, managing major contracts successfully, managing our pension schemes to ensure that scheme liabilities are within a range appropriate to our capital base, managing the impact of Brexit, developing and attracting excellent people to create a vibrant, diverse and flexible workforce, operating in new markets and providing new services in overseas markets, maintaining high standards of ethics and compliance in respect of managing contracts and meeting Regulatory requirements, maintaining systems and ensuring cyber security, maintaining high standards of Health & Safety and security, including cyber security and effective human rights policies and practices.
The Group’s principal financial risks, notably funding, liquidity, currency and counterparty risks, and how these are managed are summarised on pages 46 and 47 of our 2016 Annual Report and Accounts. In the first half of 2017, risks in relation to funding and liquidity have increased following substantial cash outflows on a number of significant contracts. Further details of how this increased risk is being addressed by the Board can be found in

CARILLION PLC – ANNOUNCEMENT OF HALF-YEARLY RESULTS FOR THE SIX MONTHS ENDED 30 JUNE 2017
14
the Basis of preparation on page 23. In addition, following a strategic review, we have recognised the need for a significant transformation of our operating model. This commenced in September 2017 and is expected to take 18 months to implement. The transformation will simplify the organisation, strengthen our financial, commercial and operational controls and greatly improve transparency. It will also enable us to increase customer, supplier and shareholder trust and confidence. Any major transformation programme carries risk of financial and operational control issues as processes and people are changed. To mitigate this risk, the programme Steering Committee, set up to design and implement the transformation, is subject to close monitoring by the Group Board which will approve all changes.
CARILLION PLC – ANNOUNCEMENT OF HALF-YEARLY RESULTS FOR THE SIX MONTHS ENDED 30 JUNE 2017
15
Unaudited condensed consolidated income statement for the six months ended 30 June
2017 2016
Note
Before non- underlying
items £m
Non- underlying items £m
Total £m
Before non-underlying
items £m
Non- underlying
items £m
Total £m
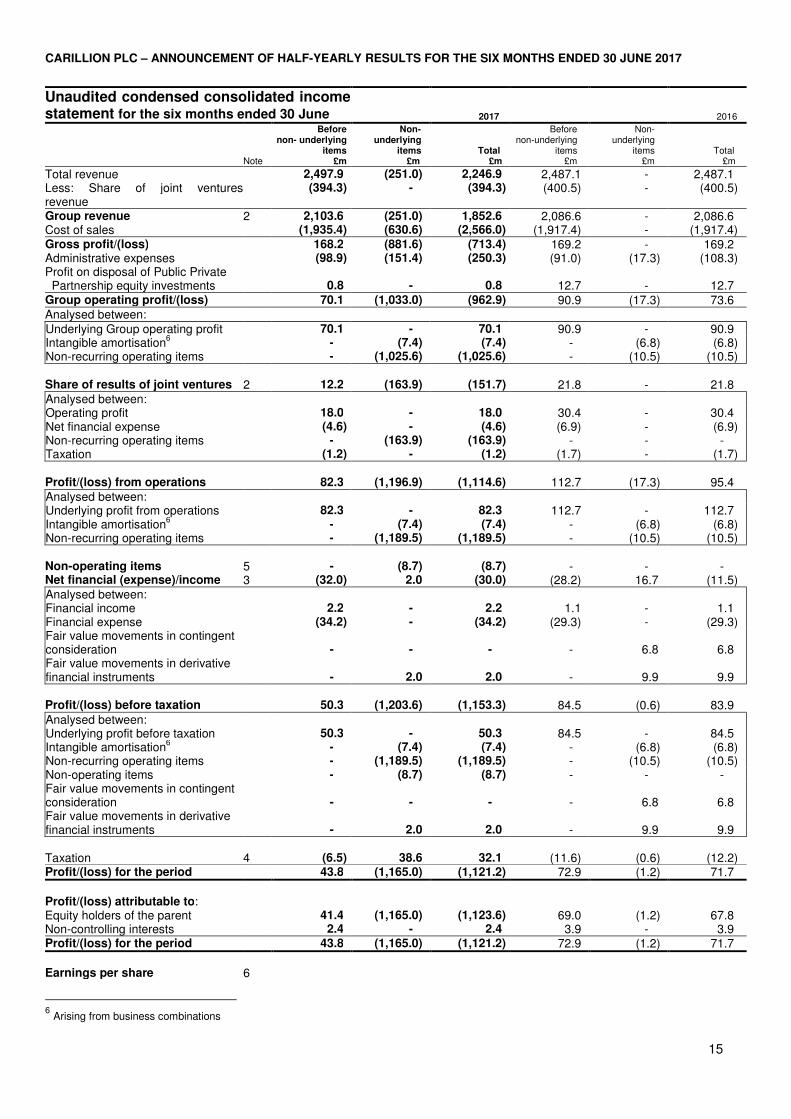
Total revenue 2,497.9 (251.0) 2,246.9 2,487.1 - 2,487.1 Less: Share of joint ventures revenue
(394.3) - (394.3) (400.5) - (400.5)
Group revenue 2 2,103.6 (251.0) 1,852.6 2,086.6 - 2,086.6 Cost of sales (1,935.4) (630.6) (2,566.0) (1,917.4) - (1,917.4) Gross profit/(loss) 168.2 (881.6) (713.4) 169.2 - 169.2 Administrative expenses (98.9) (151.4) (250.3) (91.0) (17.3) (108.3) Profit on disposal of Public Private Partnership equity investments
0.8
-
0.8
12.7
-
12.7
Group operating profit/(loss) 70.1 (1,033.0) (962.9) 90.9 (17.3) 73.6 Analysed between: Underlying Group operating profit 70.1 - 70.1 90.9 - 90.9 Intangible amortisation
6 - (7.4) (7.4) - (6.8) (6.8)
Non-recurring operating items - (1,025.6) (1,025.6) - (10.5) (10.5) Share of results of joint ventures 2 12.2 (163.9) (151.7) 21.8 - 21.8 Analysed between: Operating profit 18.0 - 18.0 30.4 - 30.4 Net financial expense (4.6) - (4.6) (6.9) - (6.9) Non-recurring operating items - (163.9) (163.9) - - - Taxation (1.2) - (1.2) (1.7) - (1.7) Profit/(loss) from operations 82.3 (1,196.9) (1,114.6) 112.7 (17.3) 95.4 Analysed between: Underlying profit from operations 82.3 - 82.3 112.7 - 112.7 Intangible amortisation
6 - (7.4) (7.4) - (6.8) (6.8)
Non-recurring operating items - (1,189.5) (1,189.5) - (10.5) (10.5) Non-operating items
5
-
(8.7)
(8.7)
-
-
-
Net financial (expense)/income 3 (32.0) 2.0 (30.0) (28.2) 16.7 (11.5) Analysed between: Financial income 2.2 - 2.2 1.1 - 1.1 Financial expense (34.2) - (34.2) (29.3) - (29.3) Fair value movements in contingent consideration
-
-
-
-
6.8
6.8
Fair value movements in derivative financial instruments
-
2.0
2.0
-
9.9
9.9
Profit/(loss) before taxation 50.3 (1,203.6) (1,153.3) 84.5 (0.6) 83.9 Analysed between: Underlying profit before taxation 50.3 - 50.3 84.5 - 84.5 Intangible amortisation
6 - (7.4) (7.4) - (6.8) (6.8)
Non-recurring operating items - (1,189.5) (1,189.5) - (10.5) (10.5) Non-operating items - (8.7) (8.7) - - - Fair value movements in contingent consideration
-
-
-
-
6.8
6.8
Fair value movements in derivative financial instruments
-
2.0
2.0
-
9.9
9.9
Taxation 4 (6.5) 38.6 32.1 (11.6) (0.6) (12.2) Profit/(loss) for the period 43.8 (1,165.0) (1,121.2) 72.9 (1.2) 71.7
Profit/(loss) attributable to: Equity holders of the parent 41.4 (1,165.0) (1,123.6) 69.0 (1.2) 67.8 Non-controlling interests 2.4 - 2.4 3.9 - 3.9 Profit/(loss) for the period 43.8 (1,165.0) (1,121.2) 72.9 (1.2) 71.7
Earnings per share 6
6 Arising from business combinations
CARILLION PLC – ANNOUNCEMENT OF HALF-YEARLY RESULTS FOR THE SIX MONTHS ENDED 30 JUNE 2017
16
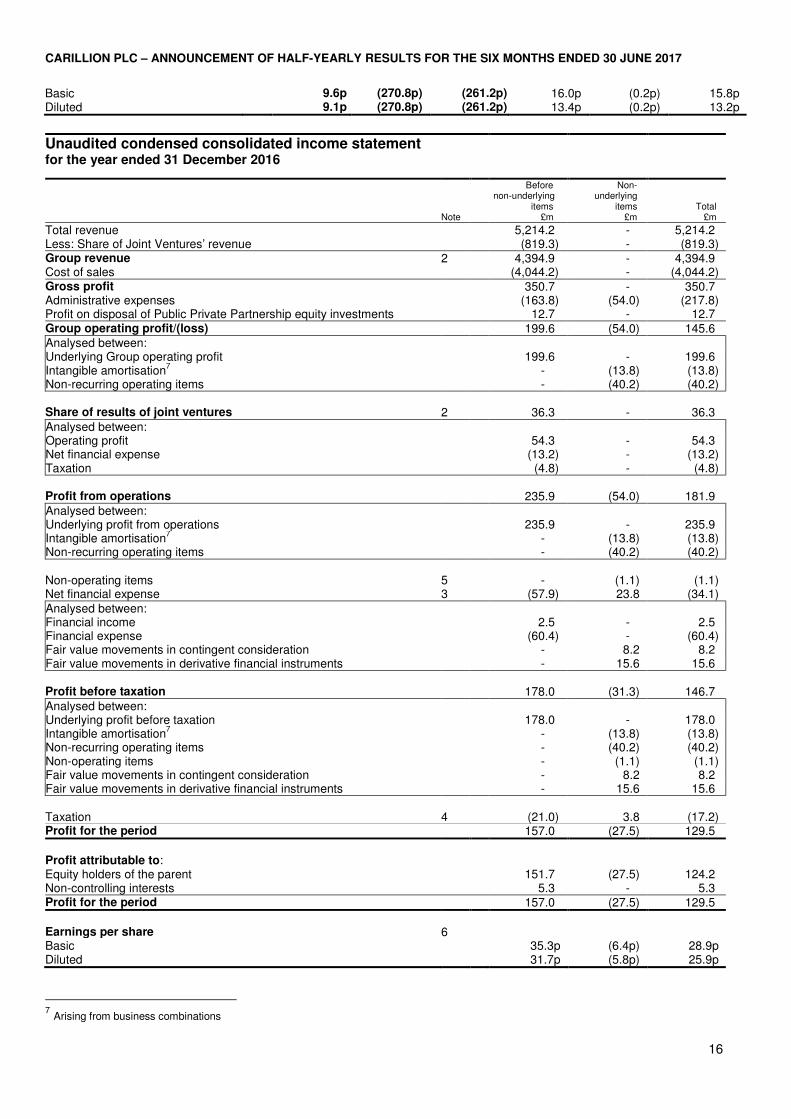
Basic 9.6p (270.8p) (261.2p) 16.0p (0.2p) 15.8p Diluted 9.1p (270.8p) (261.2p) 13.4p (0.2p) 13.2p
Unaudited condensed consolidated income statement for the year ended 31 December 2016
Note
Before non-underlying items £m
Non- underlying
items £m
Total £m
Total revenue 5,214.2 - 5,214.2 Less: Share of Joint Ventures’ revenue (819.3) - (819.3) Group revenue 2 4,394.9 - 4,394.9 Cost of sales (4,044.2) - (4,044.2) Gross profit 350.7 - 350.7 Administrative expenses (163.8) (54.0) (217.8) Profit on disposal of Public Private Partnership equity investments 12.7 - 12.7 Group operating profit/(loss) 199.6 (54.0) 145.6 Analysed between: Underlying Group operating profit 199.6 - 199.6 Intangible amortisation
7 - (13.8) (13.8)
Non-recurring operating items - (40.2) (40.2) Share of results of joint ventures 2 36.3 - 36.3 Analysed between: Operating profit 54.3 - 54.3 Net financial expense (13.2) - (13.2) Taxation (4.8) - (4.8) Profit from operations 235.9 (54.0) 181.9 Analysed between: Underlying profit from operations 235.9 - 235.9 Intangible amortisation
7 - (13.8) (13.8)
Non-recurring operating items - (40.2) (40.2) Non-operating items 5 - (1.1) (1.1) Net financial expense 3 (57.9) 23.8 (34.1) Analysed between: Financial income 2.5 - 2.5 Financial expense (60.4) - (60.4) Fair value movements in contingent consideration - 8.2 8.2 Fair value movements in derivative financial instruments - 15.6 15.6 Profit before taxation 178.0 (31.3) 146.7 Analysed between: Underlying profit before taxation 178.0 - 178.0 Intangible amortisation
7 - (13.8) (13.8)
Non-recurring operating items - (40.2) (40.2) Non-operating items - (1.1) (1.1) Fair value movements in contingent consideration - 8.2 8.2 Fair value movements in derivative financial instruments - 15.6 15.6 Taxation 4 (21.0) 3.8 (17.2) Profit for the period 157.0 (27.5) 129.5
Profit attributable to: Equity holders of the parent 151.7 (27.5) 124.2 Non-controlling interests 5.3 - 5.3 Profit for the period 157.0 (27.5) 129.5
Earnings per share 6 Basic 35.3p (6.4p) 28.9p Diluted 31.7p (5.8p) 25.9p
7 Arising from business combinations

CARILLION PLC – ANNOUNCEMENT OF HALF-YEARLY RESULTS FOR THE SIX MONTHS ENDED 30 JUNE 2017
17
CARILLION PLC – ANNOUNCEMENT OF HALF-YEARLY RESULTS FOR THE SIX MONTHS ENDED 30 JUNE 2017
18
Unaudited condensed consolidated statement of comprehensive income for the six months ended 30 June 2017
2017
2016
Year ended 31 December 2016
£m £m £m £m £m £m
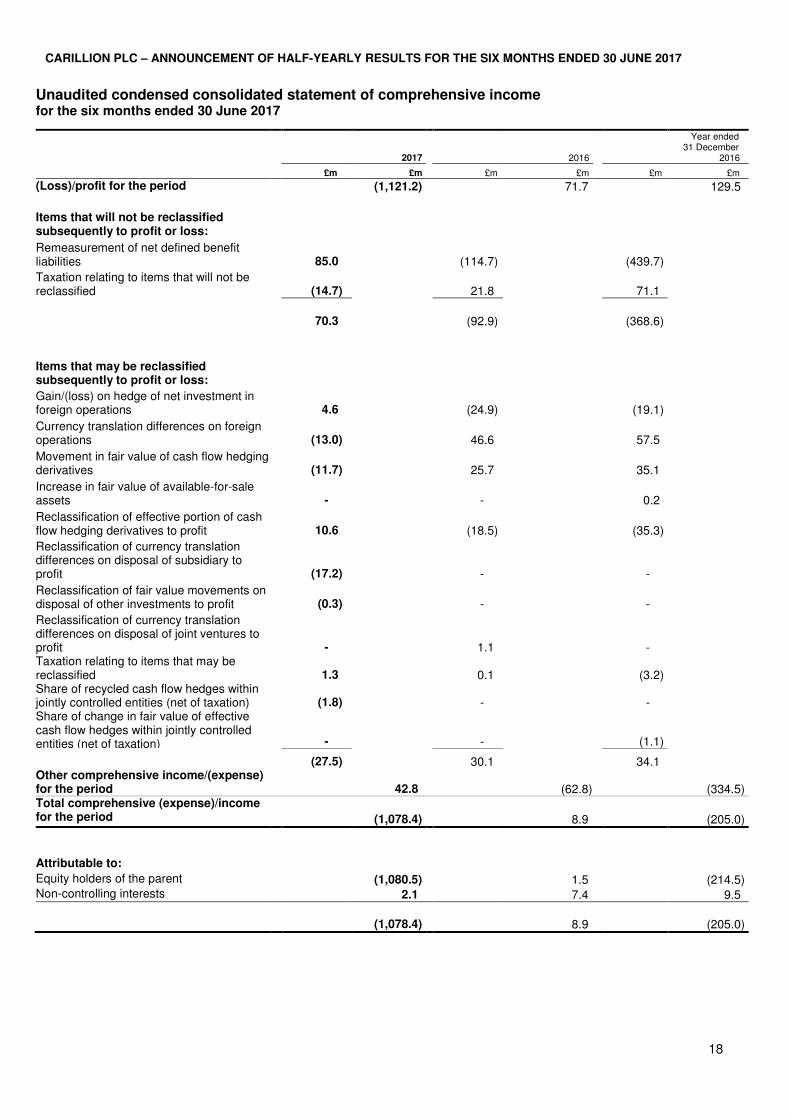
(Loss)/profit for the period (1,121.2) 71.7 129.5
Items that will not be reclassified subsequently to profit or loss:
Remeasurement of net defined benefit liabilities
85.0 (114.7) (439.7)
Taxation relating to items that will not be reclassified
(14.7) 21.8 71.1
70.3 (92.9) (368.6)
Items that may be reclassified subsequently to profit or loss:
Gain/(loss) on hedge of net investment in foreign operations
4.6 (24.9) (19.1)
Currency translation differences on foreign operations
(13.0) 46.6 57.5
Movement in fair value of cash flow hedging derivatives
(11.7) 25.7 35.1
Increase in fair value of available-for-sale assets
- - 0.2
Reclassification of effective portion of cash flow hedging derivatives to profit
10.6 (18.5) (35.3)
Reclassification of currency translation differences on disposal of subsidiary to profit
(17.2) - -
Reclassification of fair value movements on disposal of other investments to profit
(0.3) - -
Reclassification of currency translation differences on disposal of joint ventures to profit
- 1.1 - Taxation relating to items that may be reclassified
1.3 0.1 (3.2)
Share of recycled cash flow hedges within jointly controlled entities (net of taxation)
(1.8) - -
Share of change in fair value of effective cash flow hedges within jointly controlled entities (net of taxation)
- - (1.1) (27.5) 30.1 34.1 Other comprehensive income/(expense) for the period
42.8 (62.8) (334.5)
Total comprehensive (expense)/income for the period
(1,078.4) 8.9 (205.0)
Attributable to: Equity holders of the parent (1,080.5) 1.5 (214.5) Non-controlling interests 2.1 7.4 9.5
(1,078.4) 8.9 (205.0)
CARILLION PLC – ANNOUNCEMENT OF HALF-YEARLY RESULTS FOR THE SIX MONTHS ENDED 30 JUNE 2017
19
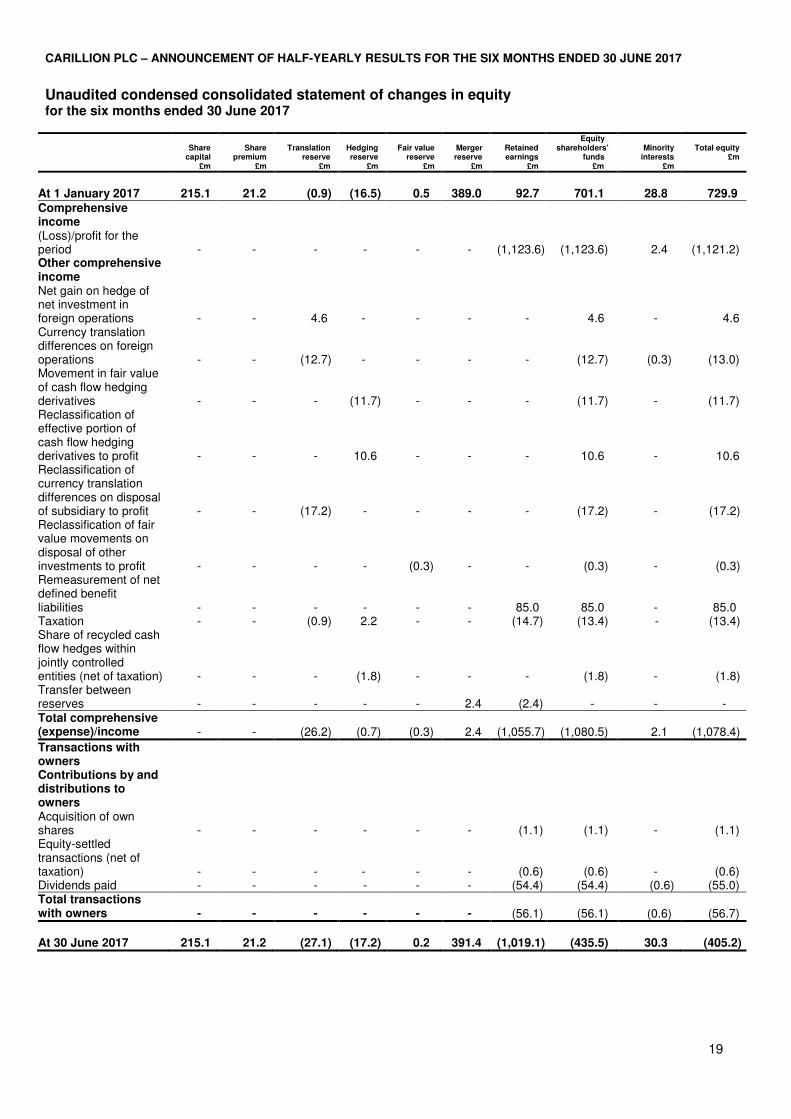
Unaudited condensed consolidated statement of changes in equity for the six months ended 30 June 2017
Share
capital £m
Share
premium £m
Translation
reserve £m
Hedging reserve
£m
Fair value
reserve £m
Merger reserve
£m
Retained earnings
£m
Equity shareholders’ funds £m
Minority
interests £m
Total equity
£m
At 1 January 2017 215.1 21.2 (0.9) (16.5) 0.5 389.0 92.7 701.1 28.8 729.9
Comprehensive income
(Loss)/profit for the period
-
-
-
-
-
-
(1,123.6)
(1,123.6)
2.4
(1,121.2)
Other comprehensive income
Net gain on hedge of net investment in foreign operations - -
4.6 - - - -
4.6 -
4.6 Currency translation differences on foreign operations - -
(12.7) - - - -
(12.7) (0.3)
(13.0) Movement in fair value of cash flow hedging derivatives - - -
(11.7) - - -
(11.7) -
(11.7) Reclassification of effective portion of cash flow hedging derivatives to profit - - -
10.6 - - -
10.6 -
10.6 Reclassification of currency translation differences on disposal of subsidiary to profit - -
(17.2) - - - -
(17.2) -
(17.2) Reclassification of fair value movements on disposal of other investments to profit - -
- - (0.3) - -
(0.3) -
(0.3) Remeasurement of net defined benefit liabilities - -
- - - -
85.0
85.0 -
85.0 Taxation - - (0.9) 2.2 - - (14.7) (13.4) - (13.4) Share of recycled cash flow hedges within jointly controlled entities (net of taxation)
-
-
-
(1.8)
-
-
-
(1.8)
-
(1.8) Transfer between reserves
-
-
-
-
-
2.4
(2.4)
-
-
-
Total comprehensive (expense)/income - - (26.2) (0.7) (0.3)
2.4
(1,055.7)
(1,080.5)
2.1
(1,078.4)
Transactions with owners
Contributions by and distributions to owners
Acquisition of own shares
-
-
-
-
-
-
(1.1)
(1.1)
-
(1.1)
Equity-settled transactions (net of taxation) - - - - - -
(0.6)
(0.6) - (0.6) Dividends paid - - - - - - (54.4) (54.4) (0.6) (55.0) Total transactions with owners - - - - - -
(56.1)
(56.1)
(0.6)
(56.7)
At 30 June 2017 215.1 21.2 (27.1) (17.2) 0.2 391.4 (1,019.1) (435.5) 30.3 (405.2)
CARILLION PLC – ANNOUNCEMENT OF HALF-YEARLY RESULTS FOR THE SIX MONTHS ENDED 30 JUNE 2017
20
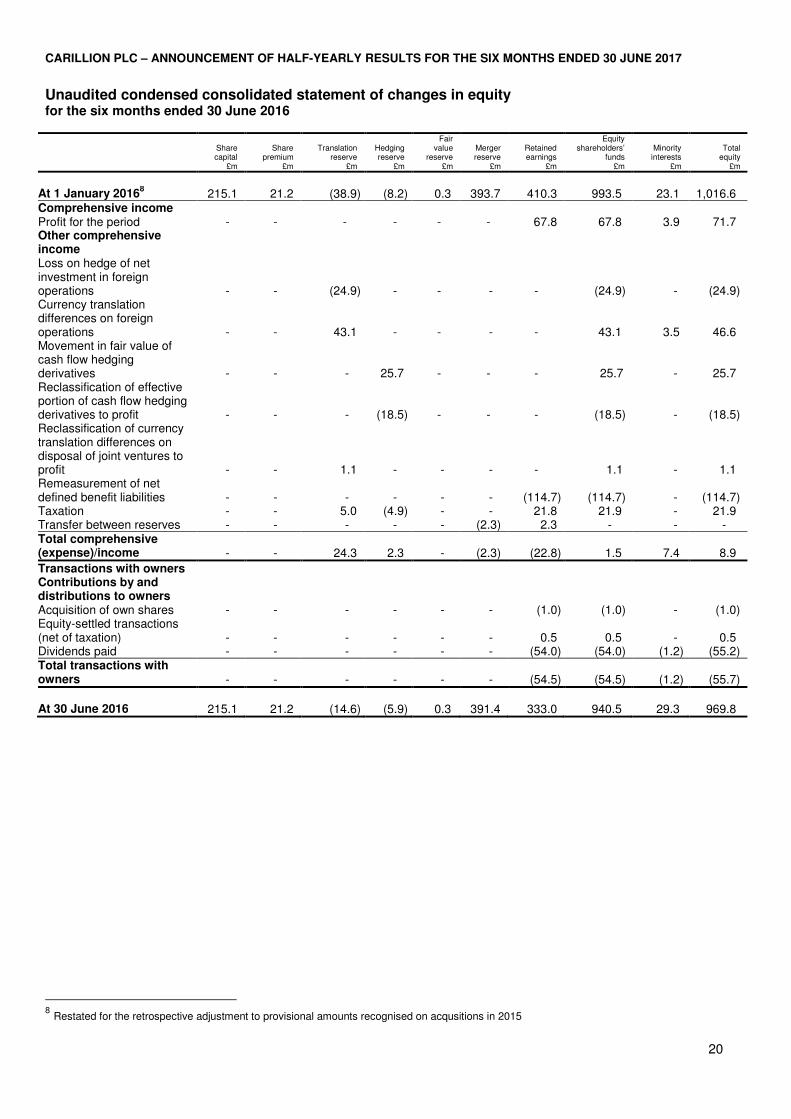
Unaudited condensed consolidated statement of changes in equity for the six months ended 30 June 2016
Share capital
£m
Share
premium £m
Translation
reserve £m
Hedging reserve
£m
Fair value
reserve £m
Merger reserve
£m
Retained earnings
£m
Equity shareholders’
funds
£m
Minority
interests £m
Total
equity
£m
At 1 January 2016
8 215.1 21.2 (38.9) (8.2) 0.3 393.7 410.3 993.5 23.1 1,016.6
Comprehensive income Profit for the period - - - - - - 67.8 67.8 3.9 71.7 Other comprehensive income
Loss on hedge of net investment in foreign operations - -
(24.9) -
-
- -
(24.9)
-
(24.9) Currency translation differences on foreign operations - -
43.1 -
-
- - 43.1
3.5
46.6 Movement in fair value of cash flow hedging derivatives - - - 25.7 - - - 25.7 - 25.7 Reclassification of effective portion of cash flow hedging derivatives to profit - - - (18.5) - - - (18.5) - (18.5) Reclassification of currency translation differences on disposal of joint ventures to profit - - 1.1 - - - -
1.1 -
1.1
Remeasurement of net defined benefit liabilities - - - - - -
(114.7)
(114.7) -
(114.7)
Taxation - - 5.0 (4.9) - - 21.8 21.9 - 21.9 Transfer between reserves - - - - - (2.3) 2.3 - - - Total comprehensive (expense)/income - -
24.3
2.3 -
(2.3)
(22.8)
1.5 7.4
8.9
Transactions with owners Contributions by and distributions to owners
Acquisition of own shares - - - - - - (1.0) (1.0) - (1.0) Equity-settled transactions (net of taxation) - - - - - -
0.5 0.5 - 0.5
Dividends paid - - - - - - (54.0) (54.0) (1.2) (55.2) Total transactions with owners - - - - - -
(54.5)
(54.5) (1.2) (55.7)
At 30 June 2016 215.1 21.2 (14.6) (5.9) 0.3 391.4 333.0 940.5 29.3 969.8
8 Restated for the retrospective adjustment to provisional amounts recognised on acqusitions in 2015
CARILLION PLC – ANNOUNCEMENT OF HALF-YEARLY RESULTS FOR THE SIX MONTHS ENDED 30 JUNE 2017
21
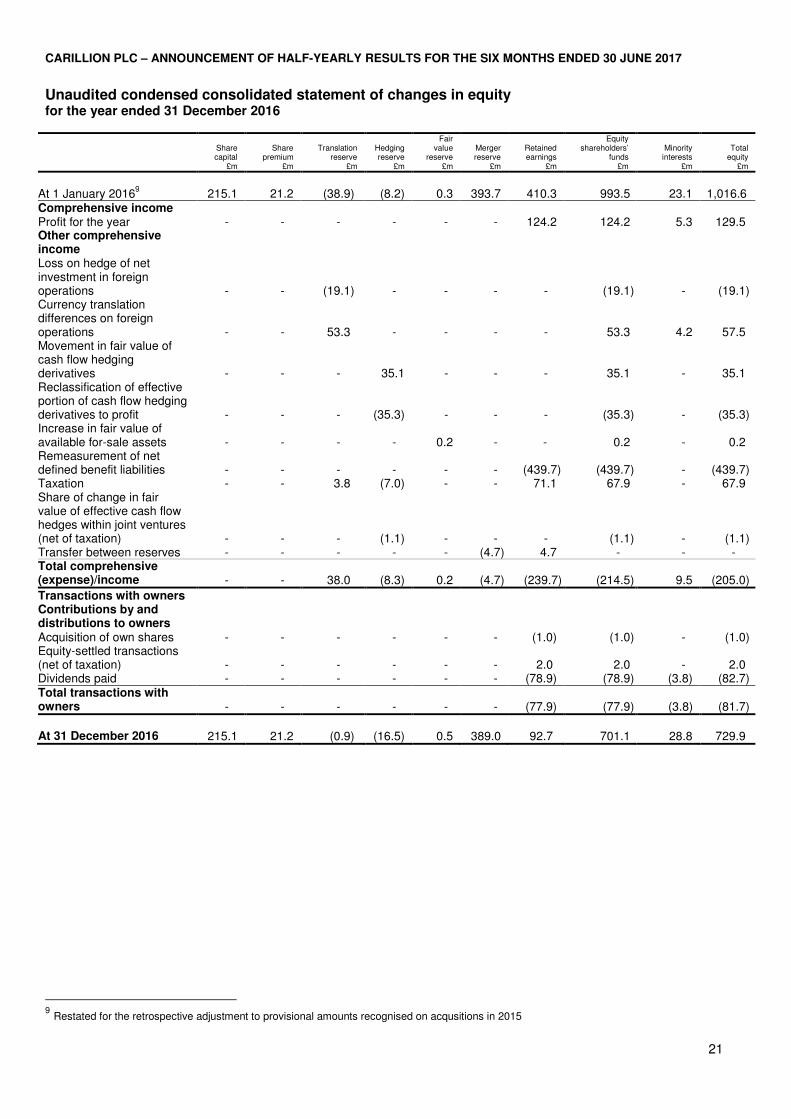
Unaudited condensed consolidated statement of changes in equity for the year ended 31 December 2016
Share capital
£m
Share
premium £m
Translation reserve
£m
Hedging reserve £m
Fair value
reserve £m
Merger reserve
£m
Retained earnings
£m
Equity shareholders’
funds £m
Minority
interests £m
Total
equity £m
At 1 January 2016
9 215.1 21.2 (38.9) (8.2) 0.3 393.7 410.3 993.5 23.1 1,016.6
Comprehensive income Profit for the year
- - - - - - 124.2 124.2 5.3 129.5
Other comprehensive income
Loss on hedge of net investment in foreign operations - - (19.1) - - - - (19.1) - (19.1) Currency translation differences on foreign operations - - 53.3 - - - - 53.3 4.2 57.5 Movement in fair value of cash flow hedging derivatives - - - 35.1 - - - 35.1 - 35.1 Reclassification of effective portion of cash flow hedging derivatives to profit - - - (35.3) - - - (35.3) - (35.3) Increase in fair value of available for-sale assets - - - - 0.2 - - 0.2 - 0.2 Remeasurement of net defined benefit liabilities
- - - - - - (439.7) (439.7) - (439.7)
Taxation
- - 3.8 (7.0) - - 71.1 67.9 - 67.9 Share of change in fair value of effective cash flow hedges within joint ventures (net of taxation) - - - (1.1) - - - (1.1) - (1.1) Transfer between reserves - - - - - (4.7) 4.7 - - - Total comprehensive (expense)/income - - 38.0 (8.3) 0.2 (4.7) (239.7) (214.5) 9.5 (205.0)
Transactions with owners Contributions by and distributions to owners
Acquisition of own shares - - - - - - (1.0) (1.0) - (1.0) Equity-settled transactions (net of taxation) - - - - - - 2.0 2.0 - 2.0 Dividends paid - - - - - - (78.9) (78.9) (3.8) (82.7) Total transactions with owners - - - - - - (77.9) (77.9)) (3.8) (81.7)
At 31 December 2016 215.1 21.2 (0.9) (16.5) 0.5 389.0 92.7 701.1 28.8 729.9
9 Restated for the retrospective adjustment to provisional amounts recognised on acqusitions in 2015
CARILLION PLC – ANNOUNCEMENT OF HALF-YEARLY RESULTS FOR THE SIX MONTHS ENDED 30 JUNE 2017
22
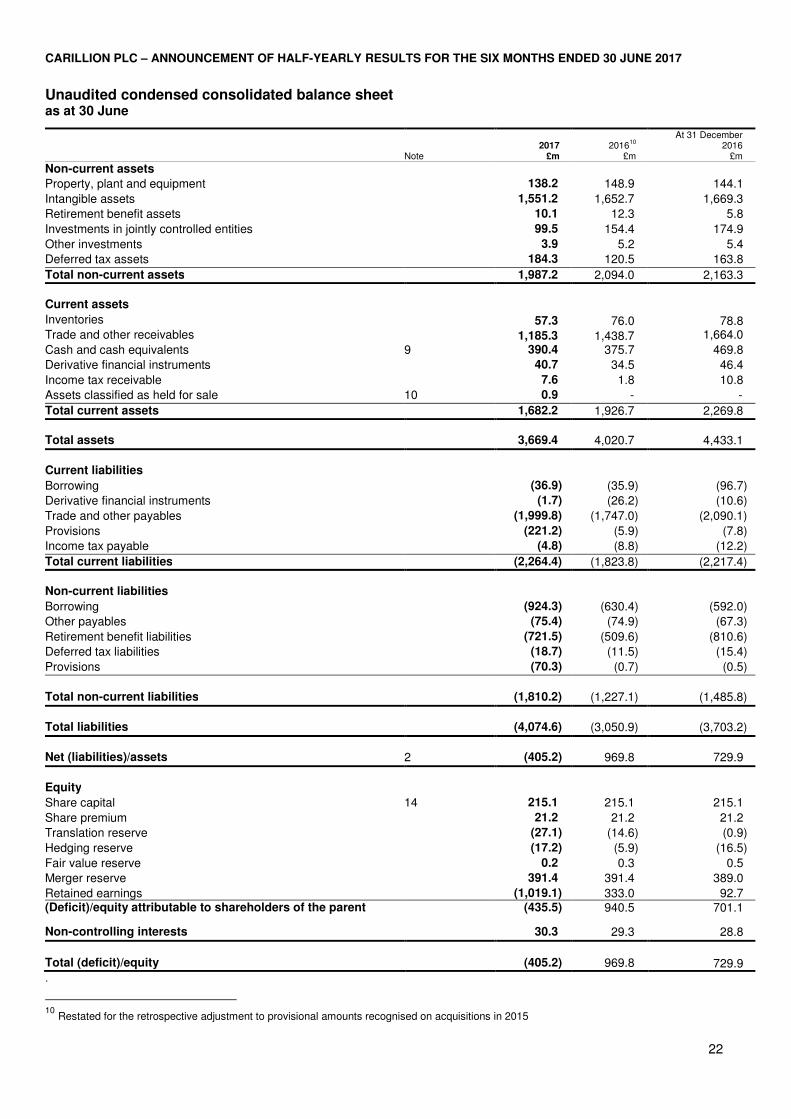
Unaudited condensed consolidated balance sheet as at 30 June
Note 2017
£m 2016
10
£m
At 31 December 2016
£m
Non-current assets
Property, plant and equipment 138.2 148.9 144.1
Intangible assets 1,551.2 1,652.7 1,669.3
Retirement benefit assets 10.1 12.3 5.8
Investments in jointly controlled entities 99.5 154.4 174.9
Other investments 3.9 5.2 5.4
Deferred tax assets 184.3 120.5 163.8
Total non-current assets 1,987.2 2,094.0 2,163.3
Current assets
Inventories 57.3 76.0 78.8 Trade and other receivables 1,185.3 1,438.7 1,664.0
Cash and cash equivalents 9 390.4 375.7 469.8
Derivative financial instruments 40.7 34.5 46.4
Income tax receivable
7.6 0.9
1.8 10.8
Assets classified as held for sale 10 0.9 - -
Total current assets 1,682.2 1,926.7 2,269.8
Total assets 3,669.4 4,020.7 4,433.1
Current liabilities
Borrowing (36.9) (35.9) (96.7)
Derivative financial instruments (1.7) (26.2) (10.6)
Trade and other payables (1,999.8) (1,747.0) (2,090.1)
Provisions (221.2) (5.9) (7.8)
Income tax payable (4.8) (8.8) (12.2)
Total current liabilities (2,264.4) (1,823.8) (2,217.4)
Non-current liabilities
Borrowing (924.3) (630.4) (592.0)
Other payables (75.4) (74.9) (67.3)
Retirement benefit liabilities (721.5) (509.6) (810.6)
Deferred tax liabilities (18.7) (11.5) (15.4)
Provisions (70.3) (0.7) (0.5)
Total non-current liabilities (1,810.2) (1,227.1) (1,485.8)
Total liabilities (4,074.6) (3,050.9) (3,703.2)
Net (liabilities)/assets 2 (405.2) 969.8 729.9
Equity
Share capital 14 215.1 215.1 215.1
Share premium 21.2 21.2 21.2
Translation reserve (27.1) (14.6) (0.9)
Hedging reserve (17.2) (5.9) (16.5)
Fair value reserve 0.2 0.3 0.5
Merger reserve 391.4 391.4 389.0
Retained earnings (1,019.1) 333.0 92.7 (Deficit)/equity attributable to shareholders of the parent (435.5) 940.5 701.1
Non-controlling interests 30.3 29.3 28.8
Total (deficit)/equity
(405.2)
969.8
729.9
.
10
Restated for the retrospective adjustment to provisional amounts recognised on acquisitions in 2015
CARILLION PLC – ANNOUNCEMENT OF HALF-YEARLY RESULTS FOR THE SIX MONTHS ENDED 30 JUNE 2017
23
Unaudited condensed consolidated cash flow statement for the six months ended 30 June
Note 2017 £m
2016 £m
Year ended 31 December 2016 £m
Cash flows from operating activities Group operating (loss)/profit (962.9) 73.6 145.6
Depreciation and amortisation 26.0 19.8 45.0
Loss/(profit) on disposal of property, plant and equipment 0.2 1.3 (6.4)
Profit on disposal of Public Private Partnership equity investments (0.4) (12.7) (12.7)
Other non-cash movements Non-recurring operating items
1.9 1,025.6
3.2 10.5
1.9 40.2
Operating profit before changes in working capital 90.4 95.7 213.6
Decrease/(increase) in inventories 8.3 (8.2) (6.3)
Increase in trade and other receivables (513.7) (97.6) (290.6)
Increase/(decrease) in trade and other payables 182.0 (0.1) 301.5
Cash (used by)/generated from operations before cash flows on forward foreign currency contracts, pension deficit recovery payments and non-recurring operating items
(233.0) (10.2) 218.2 Cash flows on forward foreign currency contracts (6.3) - (34.6)
Deficit recovery payments to pension schemes (21.0) (22.3) (46.6)
Non-recurring operating items (9.8) (5.9) (21.5)
Cash (used in)/generated from operations (270.1) (38.4) 115.5
Financial income received 1.9 1.1 2.5
Financial expense paid (20.2) (20.0) (39.6)
Acquisition costs (1.1) (0.6) (0.9)
Taxation payments (0.5) (5.3) (4.2)
Net cash flows from operating activities (290.0) (63.2) 73.3
Cash flows from investing activities
Disposal of property, plant and equipment and intangible assets 0.4 2.4 13.8
Disposal of joint ventures and other investments 12 1.4 48.1 47.1
Dividends received from joint ventures 4.6 5.7 11.8
Loan advance repayments received from joint ventures and other investments
0.7
1.5
2.1
Disposal of subsidiaries, net of cash and cash equivalents disposed
24.5 - -
Acquisition of subsidiaries, net of cash and cash equivalents acquired 12 (11.1) (19.0) (32.5)
Acquisition of property, plant and equipment and intangible assets (19.4) (17.2) (37.3)
Acquisition of equity in and loan advances to joint ventures (16.0) - (4.8)
Net cash flows from investing activities (14.9) 21.5 0.2
Cash flows from financing activities
Draw down/(repayment) of bank and other loans 289.7 (5.6) 6.7
Repayment of finance lease liabilities (4.9) (5.5) (7.4)
Acquisition of own shares (1.1) (1.0) (1.0)
Dividends paid to equity holders of the parent (54.4) (54.0) (78.9)
Dividends paid to non-controlling interests (0.6) (1.2) (3.8)
Net cash flows from financing activities 228.7 (67.3) (84.4)
Decrease in net cash and cash equivalents (76.2) (109.0) (10.9)
Net cash and cash equivalents at 1 January 467.7 455.8 455.8
Effect of exchange rate fluctuations on net cash and cash equivalents (2.8) 12.6 22.8
Net cash and cash equivalents at period end
9
388.7 359.4 467.7
CARILLION PLC – ANNOUNCEMENT OF HALF-YEARLY RESULTS FOR THE SIX MONTHS ENDED 30 JUNE 2017 Notes to the audited condensed interim financial statements
24
1 Significant accounting policies
Basis of preparation
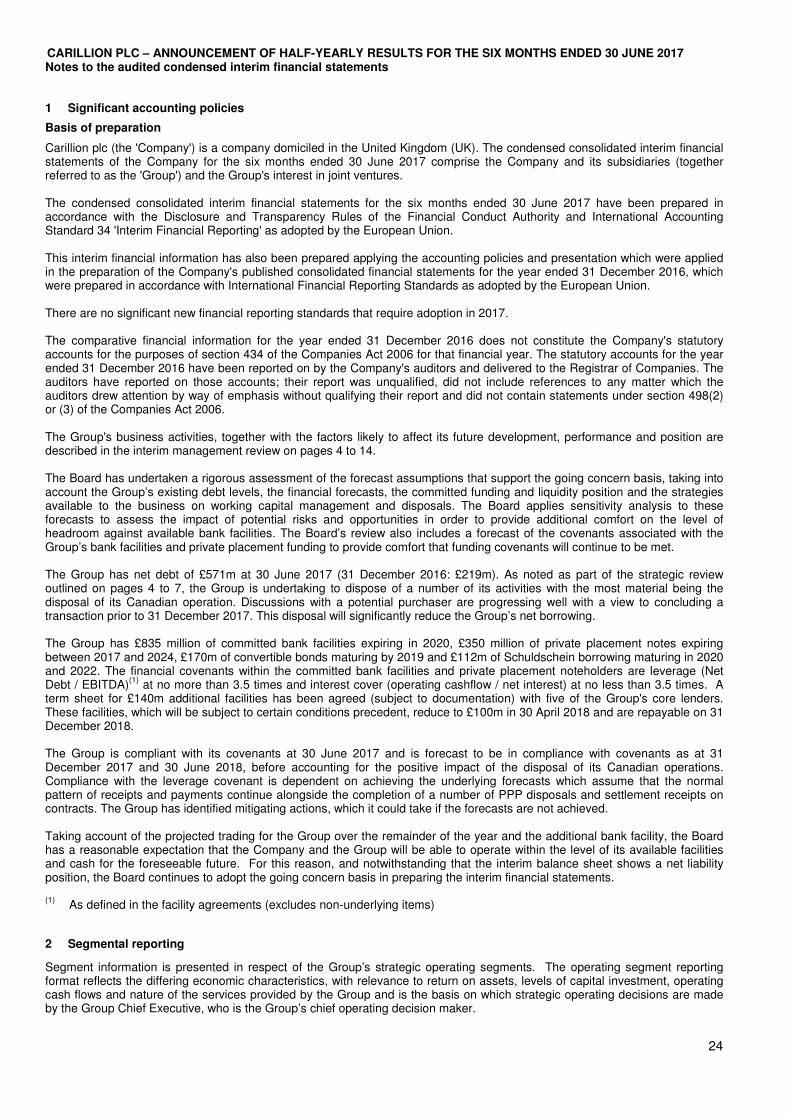
Carillion plc (the 'Company') is a company domiciled in the United Kingdom (UK). The condensed consolidated interim financial statements of the Company for the six months ended 30 June 2017 comprise the Company and its subsidiaries (together referred to as the 'Group') and the Group's interest in joint ventures. The condensed consolidated interim financial statements for the six months ended 30 June 2017 have been prepared in accordance with the Disclosure and Transparency Rules of the Financial Conduct Authority and International Accounting Standard 34 'Interim Financial Reporting' as adopted by the European Union. This interim financial information has also been prepared applying the accounting policies and presentation which were applied in the preparation of the Company's published consolidated financial statements for the year ended 31 December 2016, which were prepared in accordance with International Financial Reporting Standards as adopted by the European Union. There are no significant new financial reporting standards that require adoption in 2017. The comparative financial information for the year ended 31 December 2016 does not constitute the Company's statutory accounts for the purposes of section 434 of the Companies Act 2006 for that financial year. The statutory accounts for the year ended 31 December 2016 have been reported on by the Company's auditors and delivered to the Registrar of Companies. The auditors have reported on those accounts; their report was unqualified, did not include references to any matter which the auditors drew attention by way of emphasis without qualifying their report and did not contain statements under section 498(2) or (3) of the Companies Act 2006. The Group's business activities, together with the factors likely to affect its future development, performance and position are described in the interim management review on pages 4 to 14. The Board has undertaken a rigorous assessment of the forecast assumptions that support the going concern basis, taking into account the Group’s existing debt levels, the financial forecasts, the committed funding and liquidity position and the strategies available to the business on working capital management and disposals. The Board applies sensitivity analysis to these forecasts to assess the impact of potential risks and opportunities in order to provide additional comfort on the level of headroom against available bank facilities. The Board’s review also includes a forecast of the covenants associated with the Group’s bank facilities and private placement funding to provide comfort that funding covenants will continue to be met. The Group has net debt of £571m at 30 June 2017 (31 December 2016: £219m). As noted as part of the strategic review outlined on pages 4 to 7, the Group is undertaking to dispose of a number of its activities with the most material being the disposal of its Canadian operation. Discussions with a potential purchaser are progressing well with a view to concluding a transaction prior to 31 December 2017. This disposal will significantly reduce the Group’s net borrowing. The Group has £835 million of committed bank facilities expiring in 2020, £350 million of private placement notes expiring between 2017 and 2024, £170m of convertible bonds maturing by 2019 and £112m of Schuldschein borrowing maturing in 2020 and 2022. The financial covenants within the committed bank facilities and private placement noteholders are leverage (Net Debt / EBITDA)
(1) at no more than 3.5 times and interest cover (operating cashflow / net interest) at no less than 3.5 times. A
term sheet for £140m additional facilities has been agreed (subject to documentation) with five of the Group's core lenders. These facilities, which will be subject to certain conditions precedent, reduce to £100m in 30 April 2018 and are repayable on 31 December 2018. The Group is compliant with its covenants at 30 June 2017 and is forecast to be in compliance with covenants as at 31 December 2017 and 30 June 2018, before accounting for the positive impact of the disposal of its Canadian operations. Compliance with the leverage covenant is dependent on achieving the underlying forecasts which assume that the normal pattern of receipts and payments continue alongside the completion of a number of PPP disposals and settlement receipts on contracts. The Group has identified mitigating actions, which it could take if the forecasts are not achieved. Taking account of the projected trading for the Group over the remainder of the year and the additional bank facility, the Board has a reasonable expectation that the Company and the Group will be able to operate within the level of its available facilities and cash for the foreseeable future. For this reason, and notwithstanding that the interim balance sheet shows a net liability position, the Board continues to adopt the going concern basis in preparing the interim financial statements. (1)
As defined in the facility agreements (excludes non-underlying items)
2 Segmental reporting
Segment information is presented in respect of the Group’s strategic operating segments. The operating segment reporting format reflects the differing economic characteristics, with relevance to return on assets, levels of capital investment, operating cash flows and nature of the services provided by the Group and is the basis on which strategic operating decisions are made by the Group Chief Executive, who is the Group’s chief operating decision maker.
CARILLION PLC – ANNOUNCEMENT OF HALF-YEARLY RESULTS FOR THE SIX MONTHS ENDED 30 JUNE 2017 Notes to the audited condensed interim financial statements
25
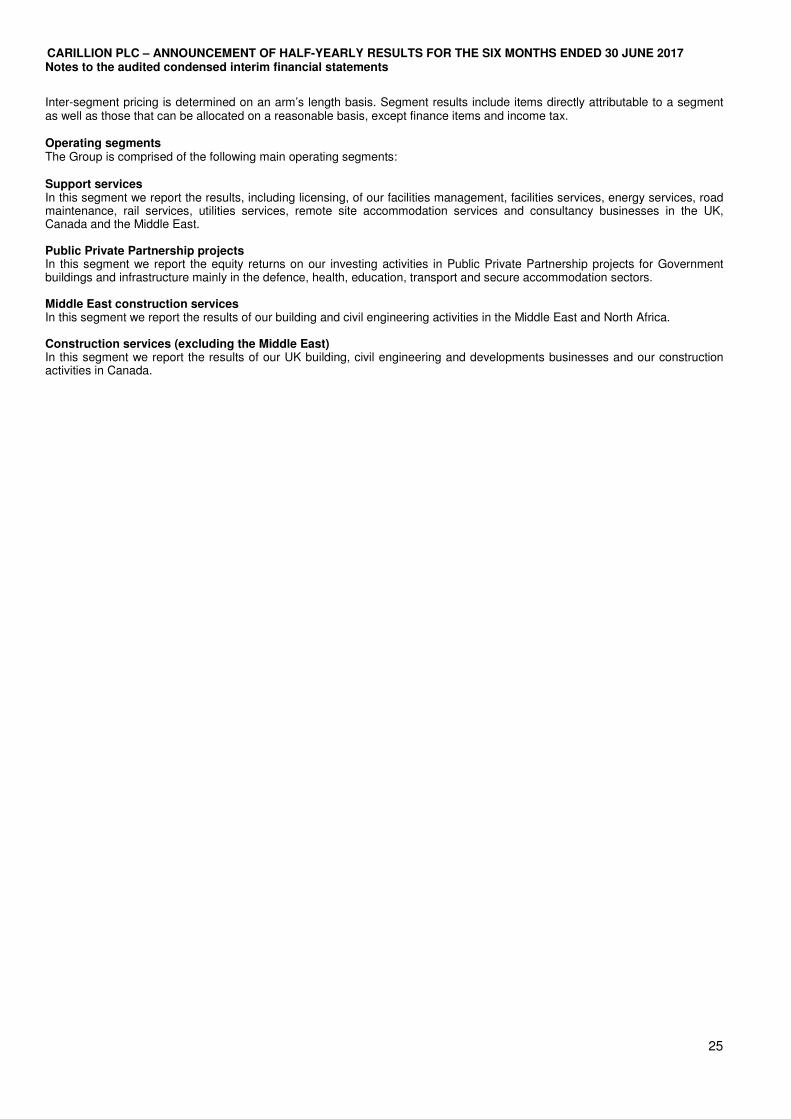
Inter-segment pricing is determined on an arm’s length basis. Segment results include items directly attributable to a segment as well as those that can be allocated on a reasonable basis, except finance items and income tax. Operating segments The Group is comprised of the following main operating segments: Support services In this segment we report the results, including licensing, of our facilities management, facilities services, energy services, road maintenance, rail services, utilities services, remote site accommodation services and consultancy businesses in the UK, Canada and the Middle East. Public Private Partnership projects In this segment we report the equity returns on our investing activities in Public Private Partnership projects for Government buildings and infrastructure mainly in the defence, health, education, transport and secure accommodation sectors. Middle East construction services In this segment we report the results of our building and civil engineering activities in the Middle East and North Africa. Construction services (excluding the Middle East) In this segment we report the results of our UK building, civil engineering and developments businesses and our construction activities in Canada.
CARILLION PLC – ANNOUNCEMENT OF HALF-YEARLY RESULTS FOR THE SIX MONTHS ENDED 30 JUNE 2017 Notes to the audited condensed interim financial statements
26
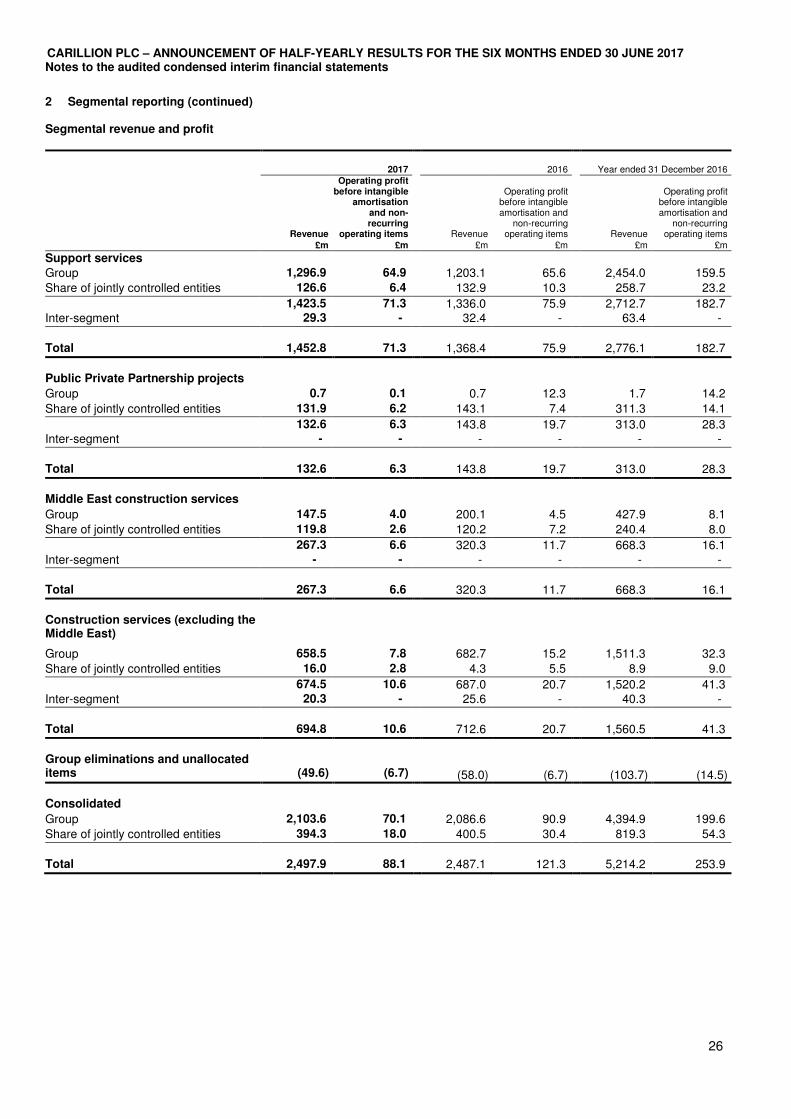
2 Segmental reporting (continued) Segmental revenue and profit
2017
2016
Year ended 31 December 2016
Revenue
Operating profit before intangible
amortisation and non-recurring
operating items Revenue
Operating profit before intangible amortisation and
non-recurring operating items Revenue
Operating profit before intangible amortisation and
non-recurring operating items
£m £m £m £m £m £m
Support services
Group 1,296.9 64.9 1,203.1 65.6 2,454.0 159.5
Share of jointly controlled entities ventures
126.6 6.4 132.9 10.3 258.7 23.2
1,423.5 71.3 1,336.0 75.9 2,712.7 182.7 Inter-segment 29.3 - 32.4 - 63.4 -
Total 1,452.8 71.3 1,368.4 75.9 2,776.1 182.7
Public Private Partnership projects
Group 0.7 0.1 0.7 12.3 1.7 14.2
Share of jointly controlled entities 131.9 6.2 143.1 7.4 311.3 14.1
132.6 6.3 143.8 19.7 313.0 28.3 Inter-segment - - - - - -
Total 132.6 6.3 143.8 19.7 313.0 28.3
Middle East construction services
Group 147.5 4.0 200.1 4.5 427.9 8.1
Share of jointly controlled entities 119.8 2.6 120.2 7.2 240.4 8.0
267.3 6.6 320.3 11.7 668.3 16.1 Inter-segment - - - - - -
Total 267.3 6.6 320.3 11.7 668.3 16.1
Construction services (excluding the Middle East)
Group 658.5 7.8 682.7 15.2 1,511.3 32.3
Share of jointly controlled entities 16.0 2.8 4.3 5.5 8.9 9.0
674.5 10.6 687.0 20.7 1,520.2 41.3 Inter-segment 20.3 - 25.6 - 40.3 -
Total 694.8 10.6 712.6 20.7 1,560.5 41.3
Group eliminations and unallocated items
(49.6)
(6.7)
(58.0) (6.7)
(103.7) (14.5)
Consolidated
Group 2,103.6 70.1 2,086.6 90.9 4,394.9 199.6
Share of jointly controlled entities 394.3 18.0 400.5 30.4 819.3 54.3
Total 2,497.9 88.1
2,487.1 121.3 5,214.2 253.9
CARILLION PLC – ANNOUNCEMENT OF HALF-YEARLY RESULTS FOR THE SIX MONTHS ENDED 30 JUNE 2017 Notes to the audited condensed interim financial statements
27
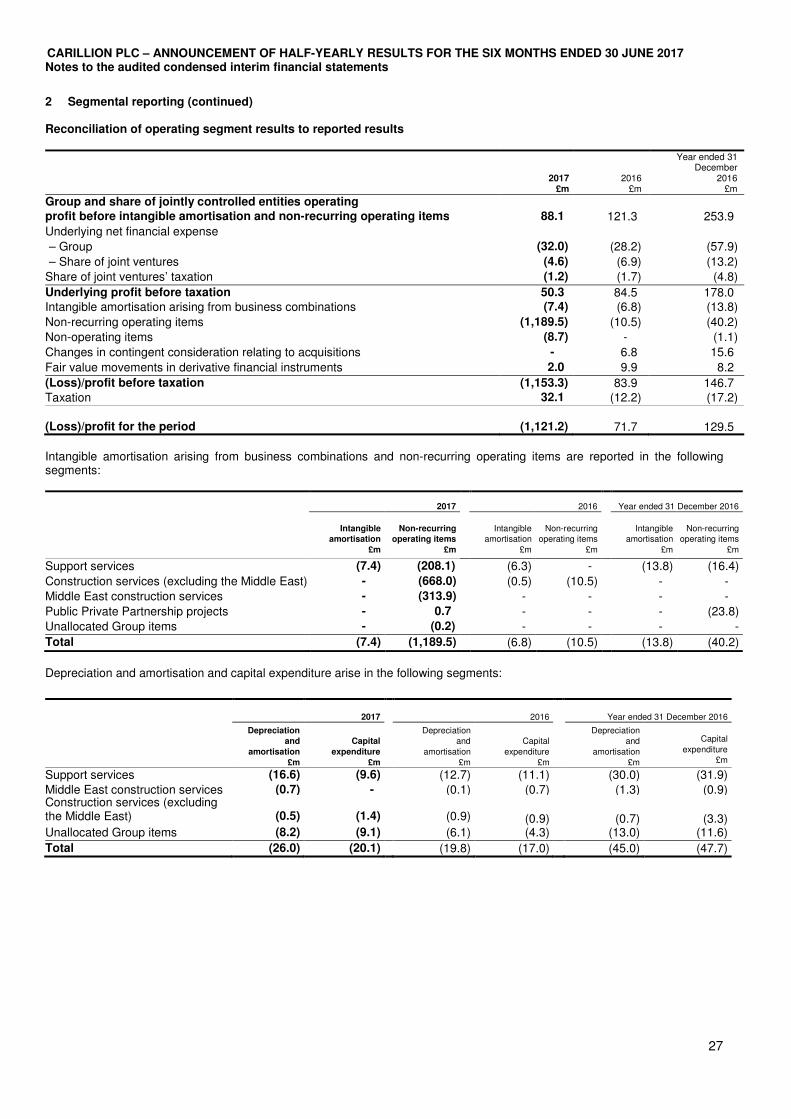
2 Segmental reporting (continued) Reconciliation of operating segment results to reported results
2017
£m 2016
£m
Year ended 31 December
2016 £m
Group and share of jointly controlled entities operating profit before intangible amortisation and non-recurring operating items 88.1 121.3 253.9
Underlying net financial expense
– Group (32.0) (28.2) (57.9)
– Share of joint ventures (4.6) (6.9) (13.2)
Share of joint ventures’ taxation (1.2) (1.7) (4.8)
Underlying profit before taxation 50.3 84.5 178.0 Intangible amortisation arising from business combinations
(7.4) (6.8) (13.8)
Non-recurring operating items (1,189.5) (10.5) (40.2)
Non-operating items
(8.7) - (1.1)
Changes in contingent consideration relating to acquisitions - 6.8 15.6
Fair value movements in derivative financial instruments 2.0 9.9 8.2
(Loss)/profit before taxation (1,153.3) 83.9 146.7 Taxation 32.1 (12.2) (17.2)
(Loss)/profit for the period
(1,121.2) 71.7 129.5
Intangible amortisation arising from business combinations and non-recurring operating items are reported in the following segments:
2017
2016
Year ended 31 December 2016
Intangible
amortisation
£m
Non-recurring
operating items
£m
Intangible amortisation
£m
Non-recurring operating items
£m
Intangible amortisation
£m
Non-recurring operating items
£m
Support services (7.4) (208.1) (6.3) - (13.8) (16.4)
Construction services (excluding the Middle East) - (668.0) (0.5) (10.5) - -
Middle East construction services - (313.9) - - - -
Public Private Partnership projects - 0.7 - - - (23.8)
Unallocated Group items - (0.2) - - - -
Total (7.4) (1,189.5) (6.8) (10.5) (13.8) (40.2)
Depreciation and amortisation and capital expenditure arise in the following segments:
2017
2016
Year ended 31 December 2016
Depreciation
and
amortisation
£m
Capital
expenditure
£m
Depreciation and
amortisation
£m
Capital
expenditure
£m
Depreciation and
amortisation
£m
Capital
expenditure £m
Support services (16.6) (9.6) (12.7) (11.1) (30.0) (31.9)
Middle East construction services (0.7) - (0.1) (0.7) (1.3) (0.9) Construction services (excluding the Middle East)
(0.5)
(1.4)
(0.9) (0.9)
(0.7) (3.3) Unallocated Group items
(8.2) (9.1) (6.1) (4.3) (13.0) (11.6)
Total (26.0) (20.1) (19.8) (17.0) (45.0) (47.7)
CARILLION PLC – ANNOUNCEMENT OF HALF-YEARLY RESULTS FOR THE SIX MONTHS ENDED 30 JUNE 2017 Notes to the audited condensed interim financial statements
28
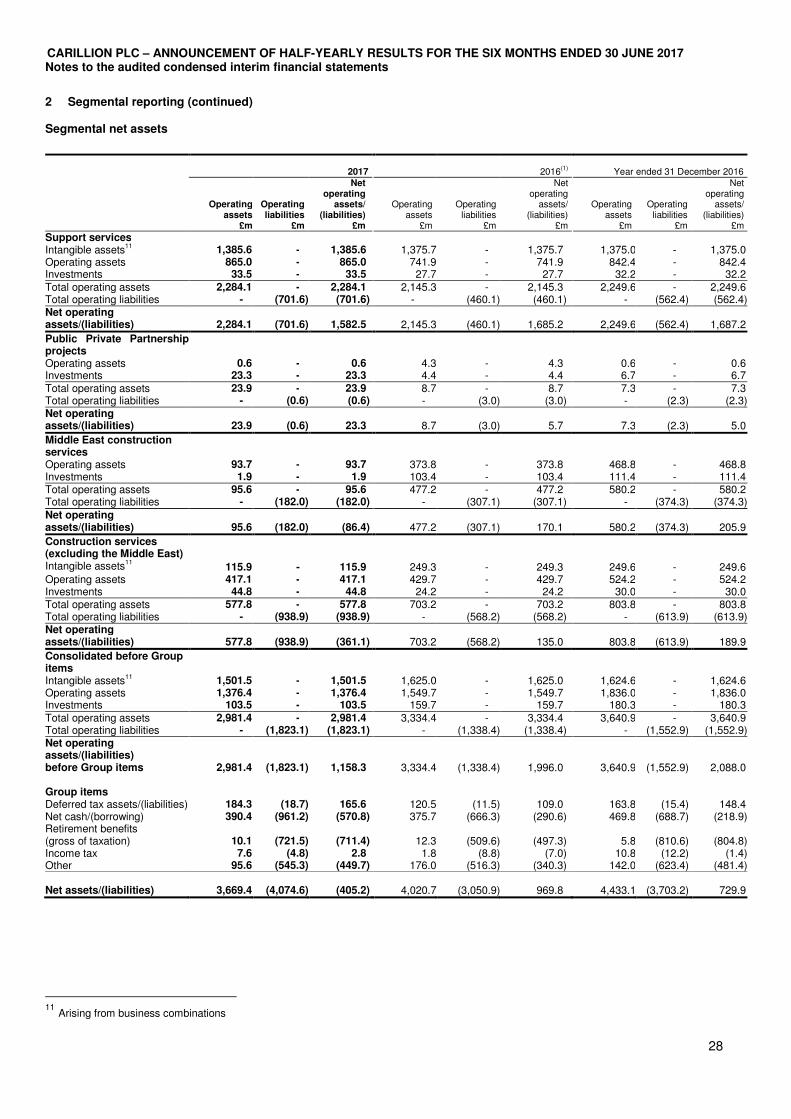
2 Segmental reporting (continued) Segmental net assets
2017 2016(1)
Year ended 31 December 2016
Operating assets
£m
Operating liabilities
£m
Net operating
assets/ (liabilities)
£m
Operating assets
£m
Operating liabilities
£m
Net operating
assets/ (liabilities)
£m
Operating assets
£m
Operating liabilities
£m
Net operating
assets/ (liabilities)
£m
Support services Intangible assets11 1,385.6 - 1,385.6 1,375.7 - 1,375.7 1,375.0 - 1,375.0 Operating assets 865.0 - 865.0 741.9 - 741.9 842.4 - 842.4 Investments 33.5 - 33.5 27.7 - 27.7 32.2 - 32.2 Total operating assets 2,284.1 - 2,284.1 2,145.3 - 2,145.3 2,249.6 - 2,249.6 Total operating liabilities - (701.6) (701.6) - (460.1) (460.1) - (562.4) (562.4)Net operating assets/(liabilities) 2,284.1 (701.6) 1,582.5
2,145.3 (460.1) 1,685.2
2,249.6 (562.4) 1,687.2
Public Private Partnership projects
Operating assets 0.6 - 0.6 4.3 - 4.3 0.6 - 0.6 Investments 23.3 - 23.3 4.4 - 4.4 6.7 - 6.7 Total operating assets 23.9 - 23.9 8.7 - 8.7 7.3 - 7.3 Total operating liabilities - (0.6) (0.6) - (3.0) (3.0) - (2.3) (2.3)Net operating assets/(liabilities) 23.9 (0.6) 23.3
8.7 (3.0) 5.7
7.3 (2.3) 5.0
Middle East construction services
Operating assets 93.7 - 93.7 373.8 - 373.8 468.8 - 468.8 Investments 1.9 - 1.9 103.4 - 103.4 111.4 - 111.4 Total operating assets 95.6 - 95.6 477.2 - 477.2 580.2 - 580.2 Total operating liabilities - (182.0) (182.0) - (307.1) (307.1) - (374.3) (374.3)Net operating assets/(liabilities) 95.6 (182.0) (86.4)
477.2 (307.1) 170.1
580.2 (374.3) 205.9
Construction services (excluding the Middle East)
Intangible assets11 115.9 - 115.9 249.3 - 249.3 249.6 - 249.6
Operating assets 417.1 - 417.1 429.7 - 429.7 524.2 - 524.2 Investments 44.8 - 44.8 24.2 - 24.2 30.0 - 30.0 Total operating assets 577.8 - 577.8 703.2 - 703.2 803.8 - 803.8 Total operating liabilities - (938.9) (938.9) - (568.2) (568.2) - (613.9) (613.9)Net operating assets/(liabilities) 577.8 (938.9) (361.1)
703.2 (568.2) 135.0
803.8 (613.9) 189.9
Consolidated before Group items
Intangible assets11 1,501.5 - 1,501.5 1,625.0 - 1,625.0 1,624.6 - 1,624.6 Operating assets 1,376.4 - 1,376.4 1,549.7 - 1,549.7 1,836.0 - 1,836.0 Investments 103.5 - 103.5 159.7 - 159.7 180.3 - 180.3 Total operating assets 2,981.4 - 2,981.4 3,334.4 - 3,334.4 3,640.9 - 3,640.9 Total operating liabilities - (1,823.1) (1,823.1) - (1,338.4) (1,338.4) - (1,552.9) (1,552.9)Net operating assets/(liabilities) before Group items 2,981.4 (1,823.1) 1,158.3
3,334.4 (1,338.4) 1,996.0
3,640.9 (1,552.9) 2,088.0 Group items Deferred tax assets/(liabilities) 184.3 (18.7) 165.6 120.5 (11.5) 109.0 163.8 (15.4) 148.4 Net cash/(borrowing) 390.4 (961.2) (570.8) 375.7 (666.3) (290.6) 469.8 (688.7) (218.9)Retirement benefits (gross of taxation) 10.1 (721.5) (711.4)
12.3 (509.6) (497.3)
5.8 (810.6) (804.8)
Income tax 7.6 (4.8) 2.8 1.8 (8.8) (7.0) 10.8 (12.2) (1.4)Other 95.6 (545.3) (449.7) 176.0 (516.3) (340.3) 142.0 (623.4) (481.4) Net assets/(liabilities) 3,669.4 (4,074.6) (405.2) 4,020.7 (3,050.9) 969.8 4,433.1 (3,703.2) 729.9
11
Arising from business combinations
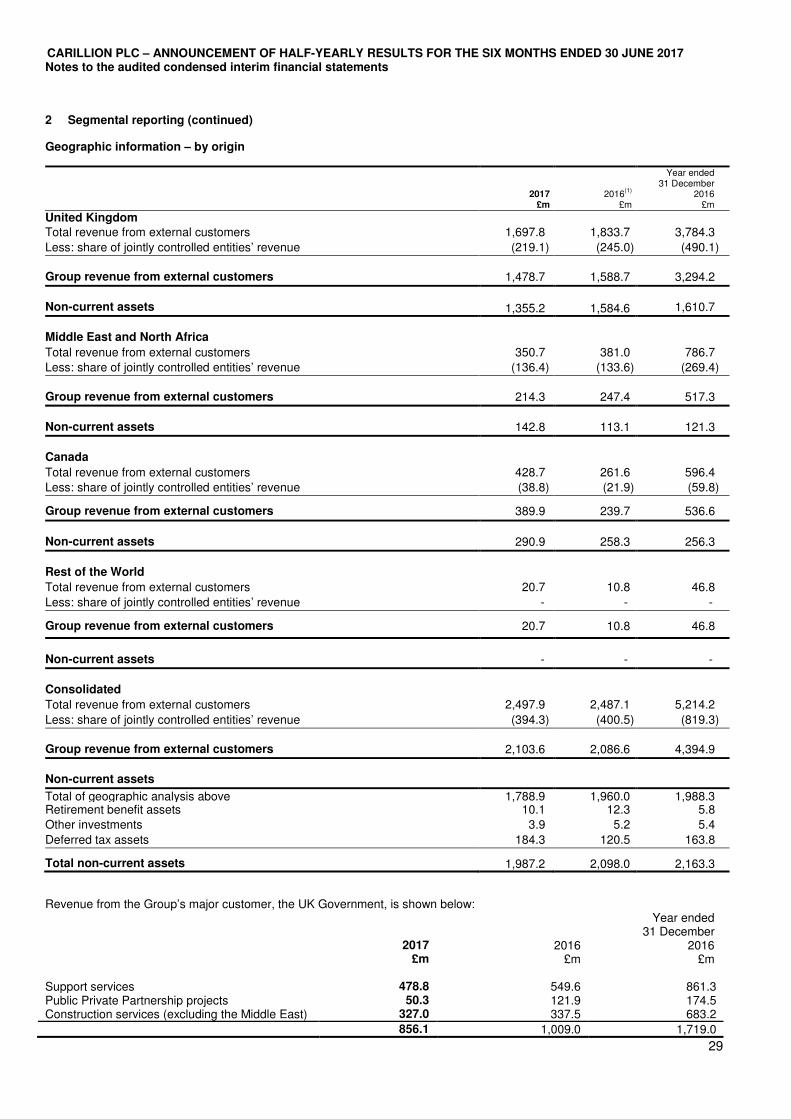
CARILLION PLC – ANNOUNCEMENT OF HALF-YEARLY RESULTS FOR THE SIX MONTHS ENDED 30 JUNE 2017 Notes to the audited condensed interim financial statements
29
2 Segmental reporting (continued) Geographic information – by origin
2017
£m
2016
(1)
£m
Year ended 31 December
2016 £m
United Kingdom Total revenue from external customers 1,697.8 1,833.7 3,784.3
Less: share of jointly controlled entities’ revenue (219.1) (245.0) (490.1)
Group revenue from external customers
1,478.7
1,588.7
3,294.2
Non-current assets 1,355.2 1,584.6 1,610.7
Middle East and North Africa
Total revenue from external customers 350.7 381.0 786.7
Less: share of jointly controlled entities’ revenue (136.4) (133.6) (269.4)
Group revenue from external customers
214.3
247.4
517.3
Non-current assets 142.8 113.1 121.3
Canada
Total revenue from external customers 428.7 261.6 596.4
Less: share of jointly controlled entities’ revenue (38.8) (21.9) (59.8)
Group revenue from external customers 389.9 239.7 536.6
Non-current assets 290.9 258.3 256.3
Rest of the World Total revenue from external customers 20.7 10.8 46.8
Less: share of jointly controlled entities’ revenue - - -
Group revenue from external customers 20.7 10.8 46.8
Non-current assets - - -
Consolidated
Total revenue from external customers 2,497.9 2,487.1 5,214.2
Less: share of jointly controlled entities’ revenue (394.3) (400.5) (819.3)
Group revenue from external customers
2,103.6
2,086.6
4,394.9
Non-current assets
Total of geographic analysis above 1,788.9 1,960.0 1,988.3 Retirement benefit assets 10.1 12.3 5.8
Other investments 3.9 5.2 5.4
Deferred tax assets 184.3 120.5 163.8
Total non-current assets 1,987.2 2,098.0 2,163.3
Revenue from the Group’s major customer, the UK Government, is shown below:
2017
£m
2016 £m
Year ended 31 December
2016 £m
Support services 478.8 549.6 861.3 Public Private Partnership projects 50.3 121.9 174.5 Construction services (excluding the Middle East) 327.0 337.5 683.2
856.1 1,009.0 1,719.0
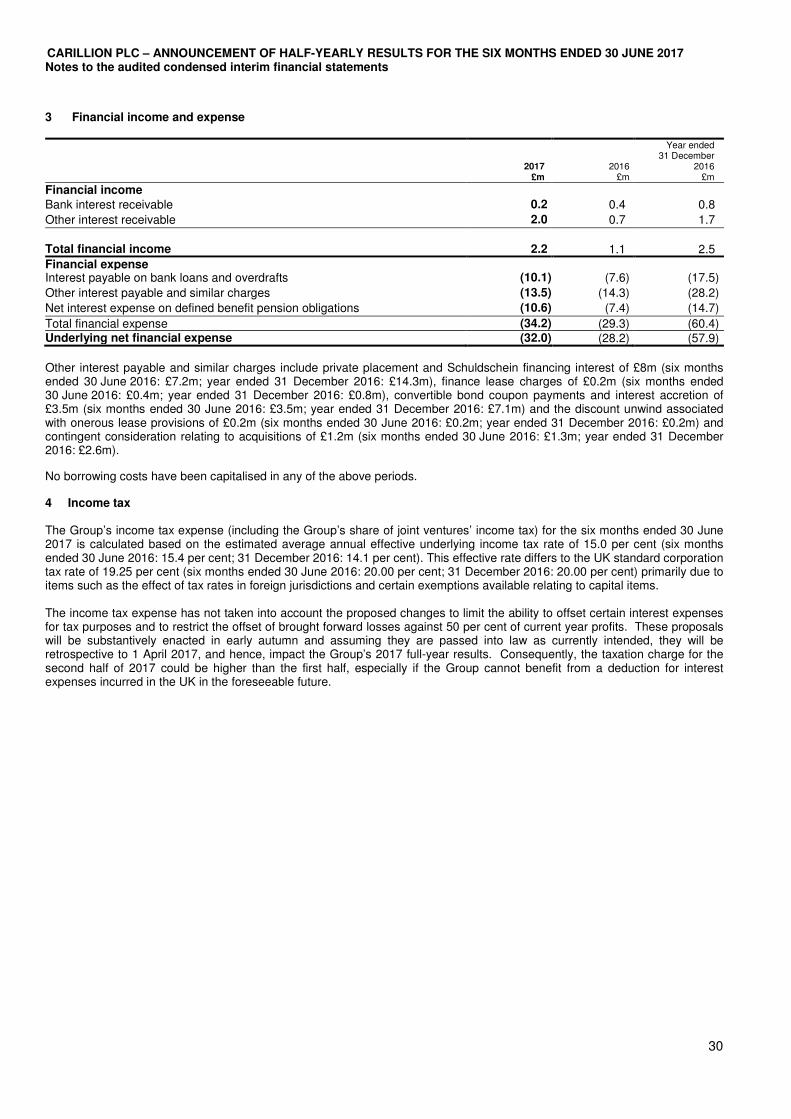
CARILLION PLC – ANNOUNCEMENT OF HALF-YEARLY RESULTS FOR THE SIX MONTHS ENDED 30 JUNE 2017 Notes to the audited condensed interim financial statements
30
3 Financial income and expense
2017
£m 2016
£m
Year ended 31 December
2016 £m
Financial income Bank interest receivable 0.2 0.4 0.8
Other interest receivable 2.0 0.7 1.7
Total financial income
2.2
1.1
2.5
Financial expense Interest payable on bank loans and overdrafts (10.1) (7.6) (17.5)
Other interest payable and similar charges (13.5) (14.3) (28.2)
Net interest expense on defined benefit pension obligations (10.6) (7.4) (14.7)
Total financial expense (34.2) (29.3) (60.4) Underlying net financial expense (32.0) (28.2) (57.9)
Other interest payable and similar charges include private placement and Schuldschein financing interest of £8m (six months ended 30 June 2016: £7.2m; year ended 31 December 2016: £14.3m), finance lease charges of £0.2m (six months ended 30 June 2016: £0.4m; year ended 31 December 2016: £0.8m), convertible bond coupon payments and interest accretion of £3.5m (six months ended 30 June 2016: £3.5m; year ended 31 December 2016: £7.1m) and the discount unwind associated with onerous lease provisions of £0.2m (six months ended 30 June 2016: £0.2m; year ended 31 December 2016: £0.2m) and contingent consideration relating to acquisitions of £1.2m (six months ended 30 June 2016: £1.3m; year ended 31 December 2016: £2.6m).
No borrowing costs have been capitalised in any of the above periods. 4 Income tax The Group’s income tax expense (including the Group’s share of joint ventures’ income tax) for the six months ended 30 June 2017 is calculated based on the estimated average annual effective underlying income tax rate of 15.0 per cent (six months ended 30 June 2016: 15.4 per cent; 31 December 2016: 14.1 per cent). This effective rate differs to the UK standard corporation tax rate of 19.25 per cent (six months ended 30 June 2016: 20.00 per cent; 31 December 2016: 20.00 per cent) primarily due to items such as the effect of tax rates in foreign jurisdictions and certain exemptions available relating to capital items. The income tax expense has not taken into account the proposed changes to limit the ability to offset certain interest expenses for tax purposes and to restrict the offset of brought forward losses against 50 per cent of current year profits. These proposals will be substantively enacted in early autumn and assuming they are passed into law as currently intended, they will be retrospective to 1 April 2017, and hence, impact the Group’s 2017 full-year results. Consequently, the taxation charge for the second half of 2017 could be higher than the first half, especially if the Group cannot benefit from a deduction for interest expenses incurred in the UK in the foreseeable future.
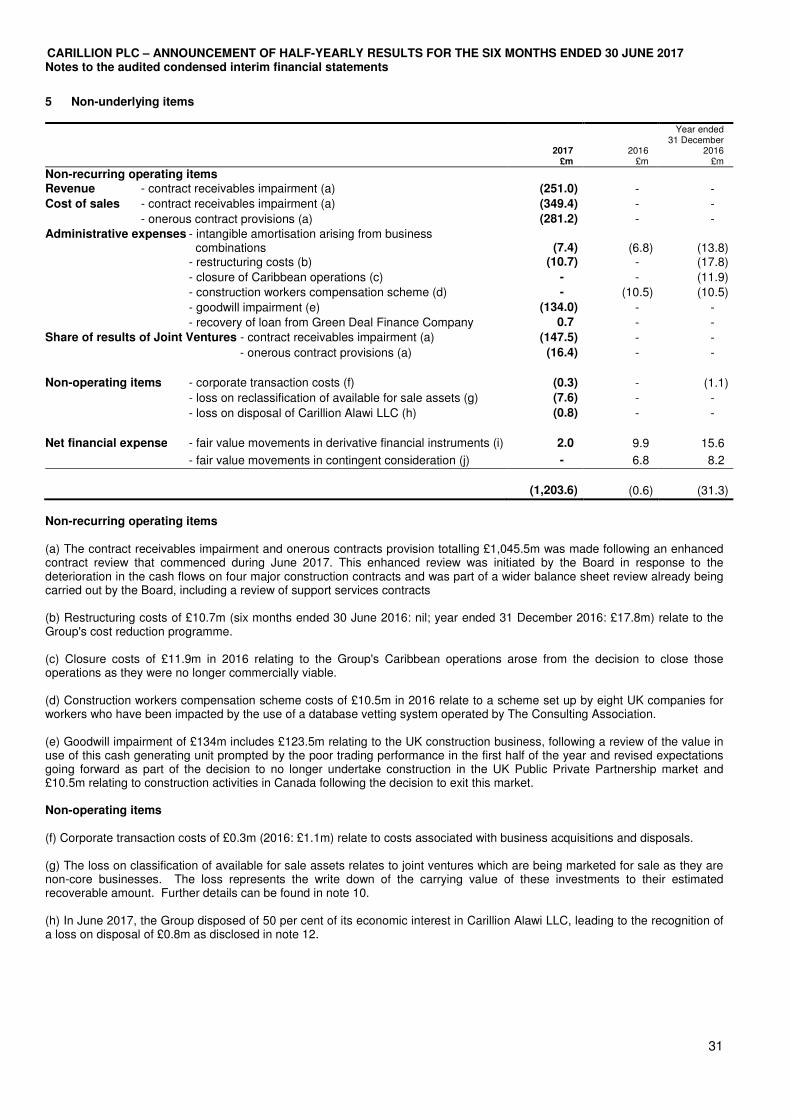
CARILLION PLC – ANNOUNCEMENT OF HALF-YEARLY RESULTS FOR THE SIX MONTHS ENDED 30 JUNE 2017 Notes to the audited condensed interim financial statements
31
5 Non-underlying items
2017 £m
2016 £m
Year ended 31 December
2016 £m
Non-recurring operating items Revenue - contract receivables impairment (a) (251.0) - -
Cost of sales - contract receivables impairment (a) (349.4) - -
- onerous contract provisions (a) (281.2) - -
Administrative expenses - intangible amortisation arising from business combinations
(7.4)
(6.8)
(13.8)
- restructuring costs (b) (10.7) - (17.8)
- closure of Caribbean operations (c) - - (11.9)
- construction workers compensation scheme (d) - (10.5) (10.5)
- goodwill impairment (e) (134.0) - -
- recovery of loan from Green Deal Finance Company 0.7 - -
Share of results of Joint Ventures - contract receivables impairment (a) (147.5) - -
- onerous contract provisions (a) (16.4) - -
Non-operating items - corporate transaction costs (f) (0.3) - (1.1)
- loss on reclassification of available for sale assets (g) (7.6) - -
- loss on disposal of Carillion Alawi LLC (h) (0.8) - -
Net financial expense - fair value movements in derivative financial instruments (i) 2.0 9.9 15.6
- fair value movements in contingent consideration (j) - 6.8 8.2
(1,203.6) (0.6) (31.3)
Non-recurring operating items (a) The contract receivables impairment and onerous contracts provision totalling £1,045.5m was made following an enhanced contract review that commenced during June 2017. This enhanced review was initiated by the Board in response to the deterioration in the cash flows on four major construction contracts and was part of a wider balance sheet review already being carried out by the Board, including a review of support services contracts (b) Restructuring costs of £10.7m (six months ended 30 June 2016: nil; year ended 31 December 2016: £17.8m) relate to the Group's cost reduction programme. (c) Closure costs of £11.9m in 2016 relating to the Group's Caribbean operations arose from the decision to close those operations as they were no longer commercially viable. (d) Construction workers compensation scheme costs of £10.5m in 2016 relate to a scheme set up by eight UK companies for workers who have been impacted by the use of a database vetting system operated by The Consulting Association. (e) Goodwill impairment of £134m includes £123.5m relating to the UK construction business, following a review of the value in use of this cash generating unit prompted by the poor trading performance in the first half of the year and revised expectations going forward as part of the decision to no longer undertake construction in the UK Public Private Partnership market and £10.5m relating to construction activities in Canada following the decision to exit this market. Non-operating items (f) Corporate transaction costs of £0.3m (2016: £1.1m) relate to costs associated with business acquisitions and disposals. (g) The loss on classification of available for sale assets relates to joint ventures which are being marketed for sale as they are non-core businesses. The loss represents the write down of the carrying value of these investments to their estimated recoverable amount. Further details can be found in note 10. (h) In June 2017, the Group disposed of 50 per cent of its economic interest in Carillion Alawi LLC, leading to the recognition of a loss on disposal of £0.8m as disclosed in note 12.
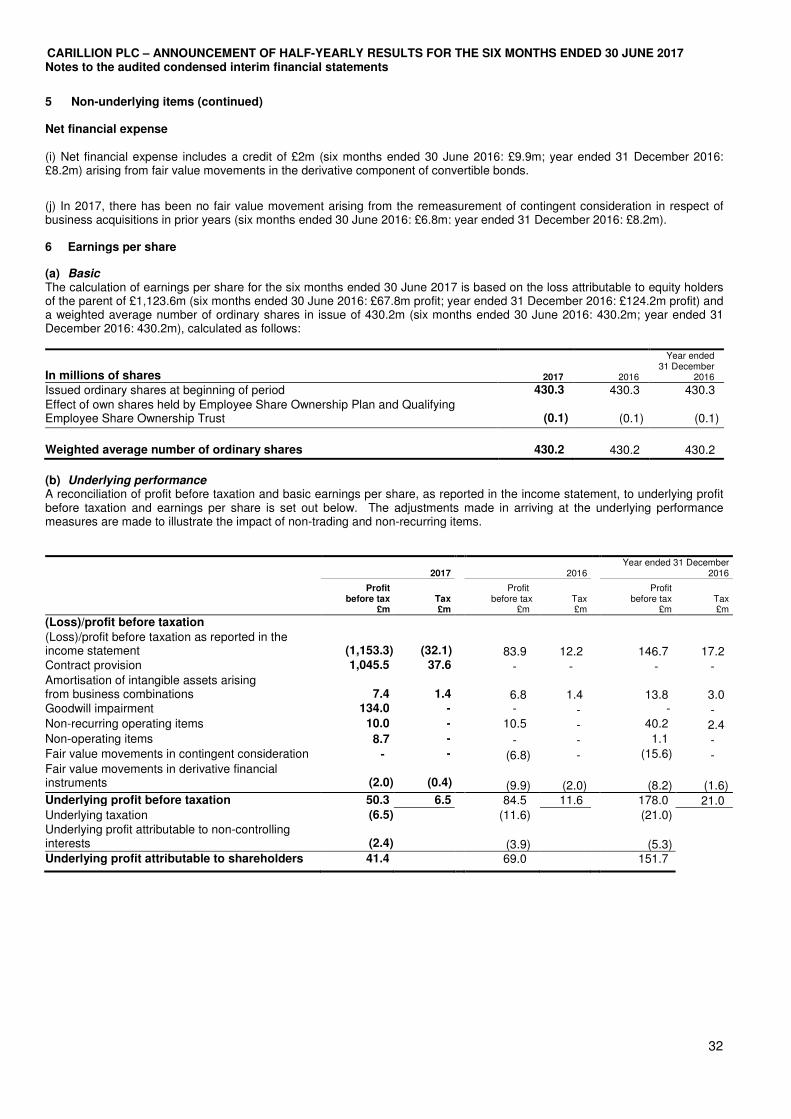
CARILLION PLC – ANNOUNCEMENT OF HALF-YEARLY RESULTS FOR THE SIX MONTHS ENDED 30 JUNE 2017 Notes to the audited condensed interim financial statements
32
5 Non-underlying items (continued) Net financial expense (i) Net financial expense includes a credit of £2m (six months ended 30 June 2016: £9.9m; year ended 31 December 2016: £8.2m) arising from fair value movements in the derivative component of convertible bonds.
(j) In 2017, there has been no fair value movement arising from the remeasurement of contingent consideration in respect of business acquisitions in prior years (six months ended 30 June 2016: £6.8m: year ended 31 December 2016: £8.2m). 6 Earnings per share (a) Basic The calculation of earnings per share for the six months ended 30 June 2017 is based on the loss attributable to equity holders of the parent of £1,123.6m (six months ended 30 June 2016: £67.8m profit; year ended 31 December 2016: £124.2m profit) and a weighted average number of ordinary shares in issue of 430.2m (six months ended 30 June 2016: 430.2m; year ended 31 December 2016: 430.2m), calculated as follows:
In millions of shares
2017 2016
Year ended 31 December
2016
Issued ordinary shares at beginning of period 430.3 430.3 430.3 Effect of own shares held by Employee Share Ownership Plan and Qualifying Employee Share Ownership Trust
(0.1)
(0.1)
(0.1)
Weighted average number of ordinary shares 430.2 430.2 430.2
(b) Underlying performance A reconciliation of profit before taxation and basic earnings per share, as reported in the income statement, to underlying profit before taxation and earnings per share is set out below. The adjustments made in arriving at the underlying performance measures are made to illustrate the impact of non-trading and non-recurring items.
2017
2016 Year ended 31 December
2016
Profit before tax
£m
Tax £m
Profit before tax £m
Tax £m
Profit before tax
£m
Tax £m
(Loss)/profit before taxation (Loss)/profit before taxation as reported in the income statement
(1,153.3)
(32.1)
83.9 12.2
146.7 17.2
Contract provision 1,045.5 37.6 - - - - Amortisation of intangible assets arising from business combinations
7.4
1.4
6.8 1.4
13.8 3.0
Goodwill impairment 134.0 - - - - - Non-recurring operating items 10.0 -
10.5 - 40.2 2.4 Non-operating items 8.7 - - - 1.1 - Fair value movements in contingent consideration - - (6.8) - (15.6) - Fair value movements in derivative financial instruments
(2.0)
(0.4)
(9.9) (2.0)
(8.2) (1.6) Underlying profit before taxation 50.3 6.5 84.5 11.6 178.0 21.0 Underlying taxation (6.5) (11.6) (21.0) Underlying profit attributable to non-controlling interests
(2.4)
(3.9)
(5.3)
Underlying profit attributable to shareholders 41.4 69.0 151.7
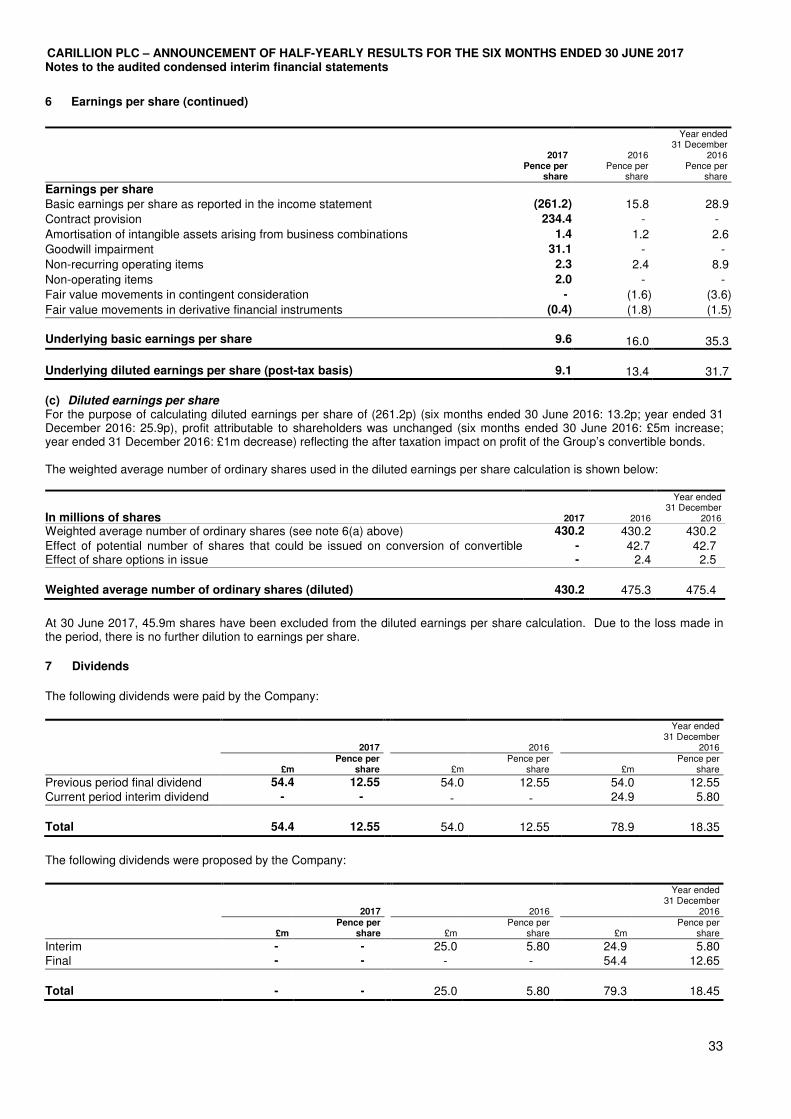
CARILLION PLC – ANNOUNCEMENT OF HALF-YEARLY RESULTS FOR THE SIX MONTHS ENDED 30 JUNE 2017 Notes to the audited condensed interim financial statements
33
6 Earnings per share (continued)
2017 Pence per
share
2016 Pence per
share
Year ended 31 December
2016 Pence per
share
Earnings per share Basic earnings per share as reported in the income statement (261.2) 15.8 28.9
Contract provision 234.4 - -
Amortisation of intangible assets arising from business combinations 1.4 1.2 2.6
Goodwill impairment 31.1 - -
Non-recurring operating items 2.3 2.4 8.9
Non-operating items 2.0 - -
Fair value movements in contingent consideration - (1.6) (3.6)
Fair value movements in derivative financial instruments (0.4) (1.8) (1.5)
Underlying basic earnings per share
9.6 16.0 35.3
Underlying diluted earnings per share (post-tax basis)
9.1 13.4 31.7
(c) Diluted earnings per share For the purpose of calculating diluted earnings per share of (261.2p) (six months ended 30 June 2016: 13.2p; year ended 31 December 2016: 25.9p), profit attributable to shareholders was unchanged (six months ended 30 June 2016: £5m increase; year ended 31 December 2016: £1m decrease) reflecting the after taxation impact on profit of the Group’s convertible bonds. The weighted average number of ordinary shares used in the diluted earnings per share calculation is shown below:
In millions of shares 2017 2016
Year ended 31 December
2016
Weighted average number of ordinary shares (see note 6(a) above) 430.2 430.2 430.2 Effect of potential number of shares that could be issued on conversion of convertible - 42.7 42.7 Effect of share options in issue - 2.4 2.5
Weighted average number of ordinary shares (diluted) 430.2 475.3 475.4
At 30 June 2017, 45.9m shares have been excluded from the diluted earnings per share calculation. Due to the loss made in the period, there is no further dilution to earnings per share.
7 Dividends
The following dividends were paid by the Company:
2017
2016
Year ended 31 December
2016
£m Pence per
share
£m Pence per
share
£m Pence per
share
Previous period final dividend 54.4 12.55 54.0 12.55 54.0 12.55 Current period interim dividend - - - - 24.9 5.80
52.3
Total 54.4 12.55 54.0 12.55 78.9 18.35
The following dividends were proposed by the Company:
2017
2016
Year ended 31 December
2016
£m Pence per
share
£m Pence per
share
£m Pence per
share
Interim - - -
25.0 5.80 24.9 5.80 Final - - - - 54.4 12.65
Total - - 25.0 5.80 79.3 18.45
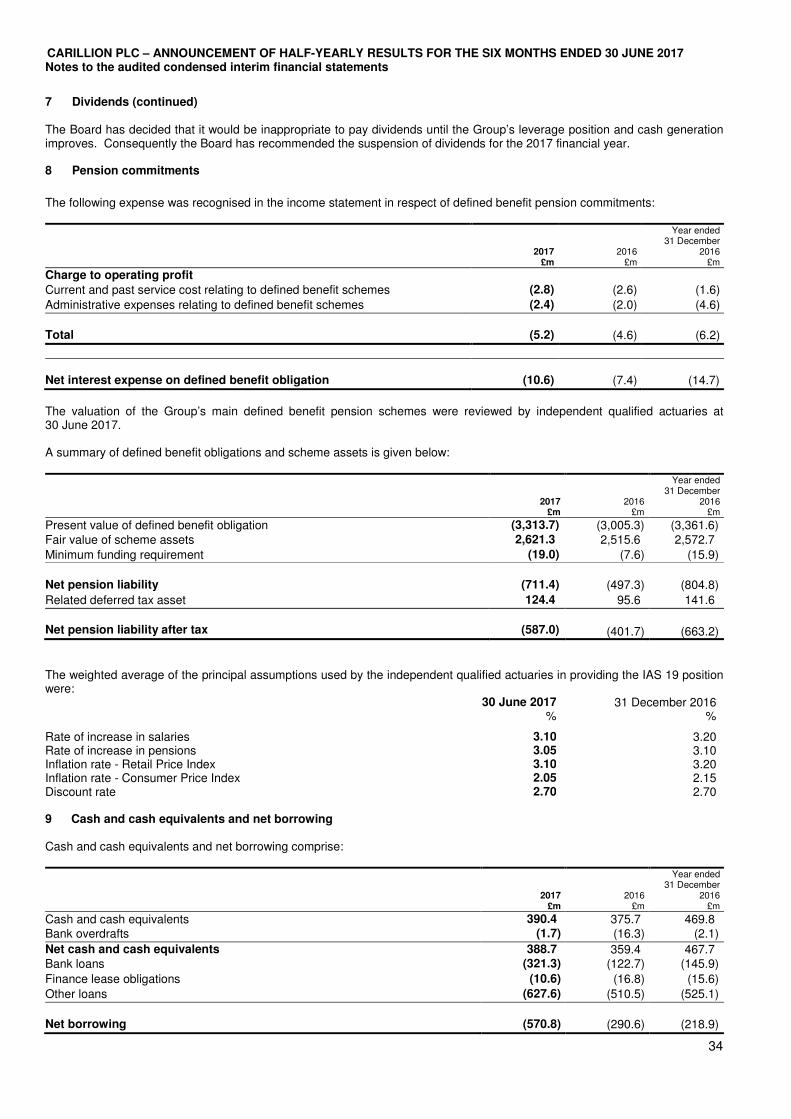
CARILLION PLC – ANNOUNCEMENT OF HALF-YEARLY RESULTS FOR THE SIX MONTHS ENDED 30 JUNE 2017 Notes to the audited condensed interim financial statements
34
7 Dividends (continued) The Board has decided that it would be inappropriate to pay dividends until the Group’s leverage position and cash generation improves. Consequently the Board has recommended the suspension of dividends for the 2017 financial year. 8 Pension commitments
The following expense was recognised in the income statement in respect of defined benefit pension commitments:
2017
£m 2016
£m
Year ended 31 December
2016 £m
Charge to operating profit Current and past service cost relating to defined benefit schemes (2.8) (2.6) (1.6)
Administrative expenses relating to defined benefit schemes
(2.4) (2.0) (4.6)
Total (5.2) (4.6) (6.2)
Net interest expense on defined benefit obligation (10.6) (7.4) (14.7)
The valuation of the Group’s main defined benefit pension schemes were reviewed by independent qualified actuaries at 30 June 2017. A summary of defined benefit obligations and scheme assets is given below:
2017
£m 2016
£m
Year ended 31 December
2016 £m
Present value of defined benefit obligation (3,313.7) (3,005.3) (3,361.6) Fair value of scheme assets 2,621.3 2,515.6 2,572.7
Minimum funding requirement (19.0) (7.6) (15.9)
Net pension liability (711.4) (497.3) (804.8)
Related deferred tax asset 124.4 95.6 141.6
Net pension liability after tax
(587.0) (401.7) (663.2)
The weighted average of the principal assumptions used by the independent qualified actuaries in providing the IAS 19 position were: 30 June 2017 31 December 2016 % %
Rate of increase in salaries 3.10 3.20 Rate of increase in pensions 3.05 3.10 Inflation rate - Retail Price Index 3.10 3.20 Inflation rate - Consumer Price Index 2.05 2.15 Discount rate 2.70 2.70 9 Cash and cash equivalents and net borrowing Cash and cash equivalents and net borrowing comprise:
2017
£m 2016
£m
Year ended 31 December
2016 £m
Cash and cash equivalents 390.4 375.7 469.8 Bank overdrafts (1.7) (16.3) (2.1)
Net cash and cash equivalents 388.7 359.4 467.7 Bank loans (321.3) (122.7) (145.9)
Finance lease obligations (10.6) (16.8) (15.6)
Other loans (627.6) (510.5) (525.1)
Net borrowing (570.8) (290.6) (218.9)
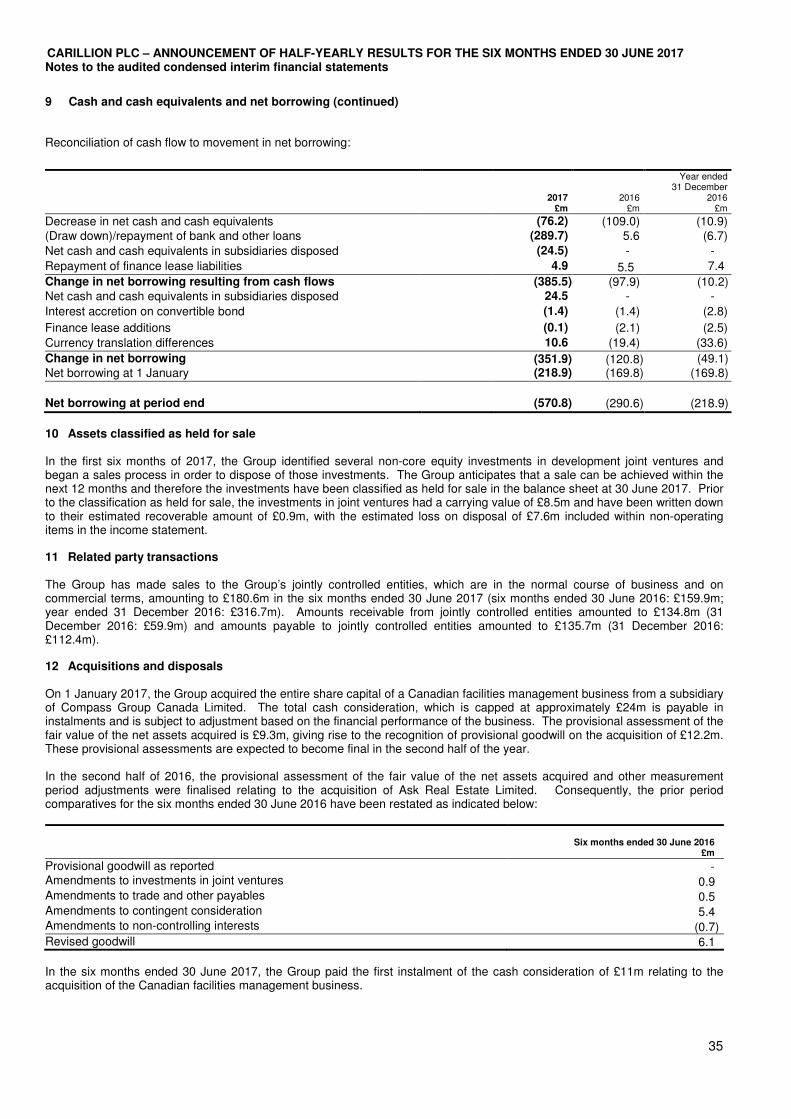
CARILLION PLC – ANNOUNCEMENT OF HALF-YEARLY RESULTS FOR THE SIX MONTHS ENDED 30 JUNE 2017 Notes to the audited condensed interim financial statements
35
9 Cash and cash equivalents and net borrowing (continued) Reconciliation of cash flow to movement in net borrowing:
2017 £m
2016
£m
Year ended 31 December
2016 £m
Decrease in net cash and cash equivalents (76.2) (109.0) (10.9) (Draw down)/repayment of bank and other loans (289.7) 5.6 (6.7)
Net cash and cash equivalents in subsidiaries disposed (24.5) - -
Repayment of finance lease liabilities 4.9 5.5 7.4
Change in net borrowing resulting from cash flows (385.5) (97.9) (10.2) Net cash and cash equivalents in subsidiaries disposed 24.5 - -
Interest accretion on convertible bond (1.4) (1.4) (2.8)
Finance lease additions (0.1) (2.1) (2.5)
Currency translation differences 10.6 (19.4) (33.6)
Change in net borrowing (351.9) (120.8) (49.1) Net borrowing at 1 January (218.9) (169.8) (169.8)
Net borrowing at period end (570.8) (290.6) (218.9)
10 Assets classified as held for sale In the first six months of 2017, the Group identified several non-core equity investments in development joint ventures and began a sales process in order to dispose of those investments. The Group anticipates that a sale can be achieved within the next 12 months and therefore the investments have been classified as held for sale in the balance sheet at 30 June 2017. Prior to the classification as held for sale, the investments in joint ventures had a carrying value of £8.5m and have been written down to their estimated recoverable amount of £0.9m, with the estimated loss on disposal of £7.6m included within non-operating items in the income statement. 11 Related party transactions The Group has made sales to the Group’s jointly controlled entities, which are in the normal course of business and on commercial terms, amounting to £180.6m in the six months ended 30 June 2017 (six months ended 30 June 2016: £159.9m; year ended 31 December 2016: £316.7m). Amounts receivable from jointly controlled entities amounted to £134.8m (31 December 2016: £59.9m) and amounts payable to jointly controlled entities amounted to £135.7m (31 December 2016: £112.4m). 12 Acquisitions and disposals On 1 January 2017, the Group acquired the entire share capital of a Canadian facilities management business from a subsidiary of Compass Group Canada Limited. The total cash consideration, which is capped at approximately £24m is payable in instalments and is subject to adjustment based on the financial performance of the business. The provisional assessment of the fair value of the net assets acquired is £9.3m, giving rise to the recognition of provisional goodwill on the acquisition of £12.2m. These provisional assessments are expected to become final in the second half of the year. In the second half of 2016, the provisional assessment of the fair value of the net assets acquired and other measurement period adjustments were finalised relating to the acquisition of Ask Real Estate Limited. Consequently, the prior period comparatives for the six months ended 30 June 2016 have been restated as indicated below:
Six months ended 30 June 2016
£m
Provisional goodwill as reported - Amendments to investments in joint ventures 0.9 Amendments to trade and other payables 0.5 Amendments to contingent consideration 5.4 Amendments to non-controlling interests (0.7) Revised goodwill
6.1
In the six months ended 30 June 2017, the Group paid the first instalment of the cash consideration of £11m relating to the acquisition of the Canadian facilities management business.
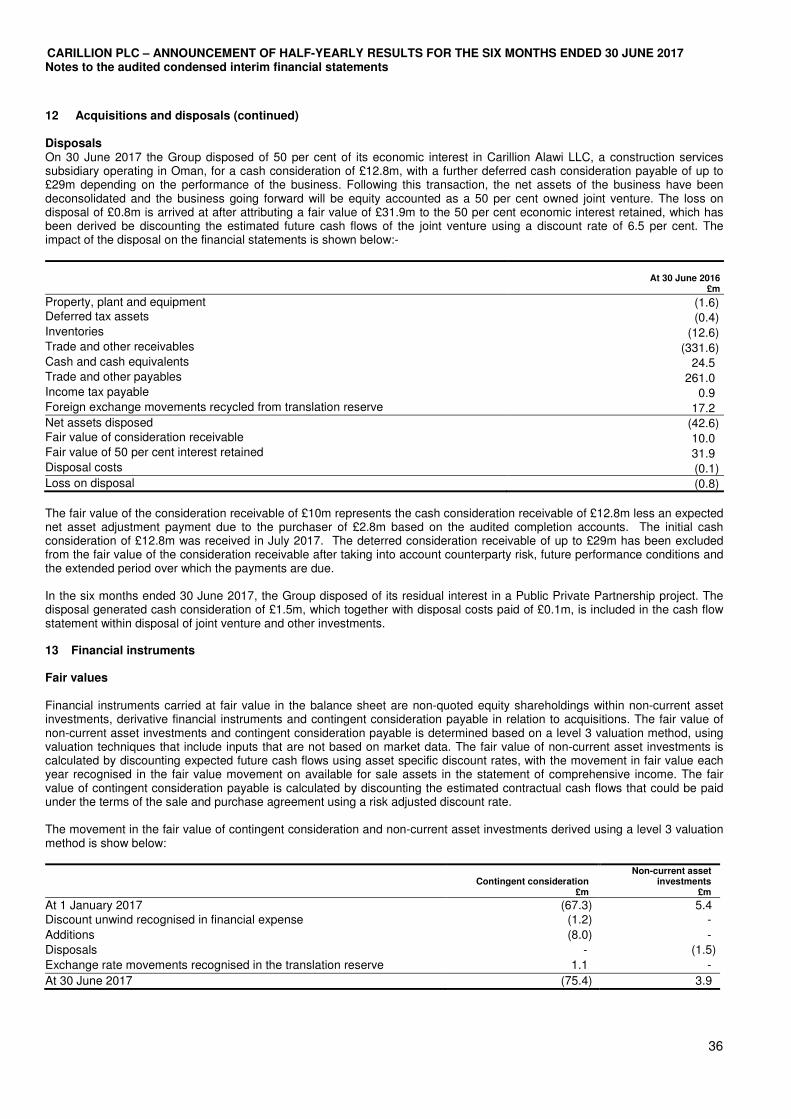
CARILLION PLC – ANNOUNCEMENT OF HALF-YEARLY RESULTS FOR THE SIX MONTHS ENDED 30 JUNE 2017 Notes to the audited condensed interim financial statements
36
12 Acquisitions and disposals (continued) Disposals On 30 June 2017 the Group disposed of 50 per cent of its economic interest in Carillion Alawi LLC, a construction services subsidiary operating in Oman, for a cash consideration of £12.8m, with a further deferred cash consideration payable of up to £29m depending on the performance of the business. Following this transaction, the net assets of the business have been deconsolidated and the business going forward will be equity accounted as a 50 per cent owned joint venture. The loss on disposal of £0.8m is arrived at after attributing a fair value of £31.9m to the 50 per cent economic interest retained, which has been derived be discounting the estimated future cash flows of the joint venture using a discount rate of 6.5 per cent. The impact of the disposal on the financial statements is shown below:-
At 30 June 2016
£m
Property, plant and equipment (1.6) Deferred tax assets (0.4) Inventories (12.6) Trade and other receivables (331.6) Cash and cash equivalents 24.5 Trade and other payables 261.0 Income tax payable 0.9 Foreign exchange movements recycled from translation reserve 17.2 Net assets disposed (42.6) Fair value of consideration receivable 10.0 Fair value of 50 per cent interest retained 31.9 Disposal costs (0.1) Loss on disposal
(0.8)
The fair value of the consideration receivable of £10m represents the cash consideration receivable of £12.8m less an expected net asset adjustment payment due to the purchaser of £2.8m based on the audited completion accounts. The initial cash consideration of £12.8m was received in July 2017. The deterred consideration receivable of up to £29m has been excluded from the fair value of the consideration receivable after taking into account counterparty risk, future performance conditions and the extended period over which the payments are due. In the six months ended 30 June 2017, the Group disposed of its residual interest in a Public Private Partnership project. The disposal generated cash consideration of £1.5m, which together with disposal costs paid of £0.1m, is included in the cash flow statement within disposal of joint venture and other investments. 13 Financial instruments Fair values Financial instruments carried at fair value in the balance sheet are non-quoted equity shareholdings within non-current asset investments, derivative financial instruments and contingent consideration payable in relation to acquisitions. The fair value of non-current asset investments and contingent consideration payable is determined based on a level 3 valuation method, using valuation techniques that include inputs that are not based on market data. The fair value of non-current asset investments is calculated by discounting expected future cash flows using asset specific discount rates, with the movement in fair value each year recognised in the fair value movement on available for sale assets in the statement of comprehensive income. The fair value of contingent consideration payable is calculated by discounting the estimated contractual cash flows that could be paid under the terms of the sale and purchase agreement using a risk adjusted discount rate. The movement in the fair value of contingent consideration and non-current asset investments derived using a level 3 valuation method is show below:
Contingent consideration
£m
Non-current asset investments
£m
At 1 January 2017 (67.3)
5.4 Discount unwind recognised in financial expense (1.2) -
Additions (8.0) -
Disposals - (1.5)
Exchange rate movements recognised in the translation reserve 1.1 -
At 30 June 2017 (75.4) 3.9
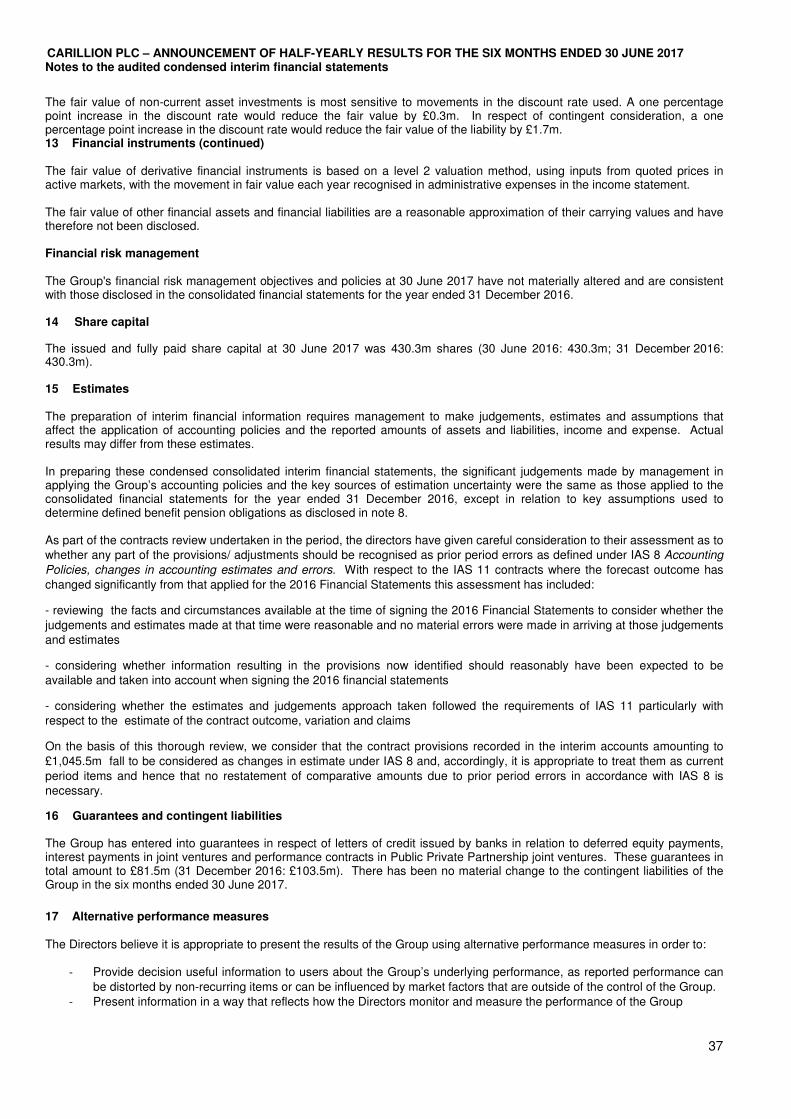
CARILLION PLC – ANNOUNCEMENT OF HALF-YEARLY RESULTS FOR THE SIX MONTHS ENDED 30 JUNE 2017 Notes to the audited condensed interim financial statements
37
The fair value of non-current asset investments is most sensitive to movements in the discount rate used. A one percentage point increase in the discount rate would reduce the fair value by £0.3m. In respect of contingent consideration, a one percentage point increase in the discount rate would reduce the fair value of the liability by £1.7m. 13 Financial instruments (continued) The fair value of derivative financial instruments is based on a level 2 valuation method, using inputs from quoted prices in active markets, with the movement in fair value each year recognised in administrative expenses in the income statement. The fair value of other financial assets and financial liabilities are a reasonable approximation of their carrying values and have therefore not been disclosed. Financial risk management The Group's financial risk management objectives and policies at 30 June 2017 have not materially altered and are consistent with those disclosed in the consolidated financial statements for the year ended 31 December 2016. 14 Share capital The issued and fully paid share capital at 30 June 2017 was 430.3m shares (30 June 2016: 430.3m; 31 December 2016: 430.3m). 15 Estimates The preparation of interim financial information requires management to make judgements, estimates and assumptions that affect the application of accounting policies and the reported amounts of assets and liabilities, income and expense. Actual results may differ from these estimates. In preparing these condensed consolidated interim financial statements, the significant judgements made by management in applying the Group’s accounting policies and the key sources of estimation uncertainty were the same as those applied to the consolidated financial statements for the year ended 31 December 2016, except in relation to key assumptions used to determine defined benefit pension obligations as disclosed in note 8. As part of the contracts review undertaken in the period, the directors have given careful consideration to their assessment as to whether any part of the provisions/ adjustments should be recognised as prior period errors as defined under IAS 8 Accounting
Policies, changes in accounting estimates and errors. With respect to the IAS 11 contracts where the forecast outcome has
changed significantly from that applied for the 2016 Financial Statements this assessment has included:
- reviewing the facts and circumstances available at the time of signing the 2016 Financial Statements to consider whether the
judgements and estimates made at that time were reasonable and no material errors were made in arriving at those judgements and estimates
- considering whether information resulting in the provisions now identified should reasonably have been expected to be available and taken into account when signing the 2016 financial statements
- considering whether the estimates and judgements approach taken followed the requirements of IAS 11 particularly with respect to the estimate of the contract outcome, variation and claims
On the basis of this thorough review, we consider that the contract provisions recorded in the interim accounts amounting to
£1,045.5m fall to be considered as changes in estimate under IAS 8 and, accordingly, it is appropriate to treat them as current
period items and hence that no restatement of comparative amounts due to prior period errors in accordance with IAS 8 is necessary.
16 Guarantees and contingent liabilities The Group has entered into guarantees in respect of letters of credit issued by banks in relation to deferred equity payments, interest payments in joint ventures and performance contracts in Public Private Partnership joint ventures. These guarantees in total amount to £81.5m (31 December 2016: £103.5m). There has been no material change to the contingent liabilities of the Group in the six months ended 30 June 2017.
17 Alternative performance measures The Directors believe it is appropriate to present the results of the Group using alternative performance measures in order to:
- Provide decision useful information to users about the Group’s underlying performance, as reported performance can
be distorted by non-recurring items or can be influenced by market factors that are outside of the control of the Group.
- Present information in a way that reflects how the Directors monitor and measure the performance of the Group
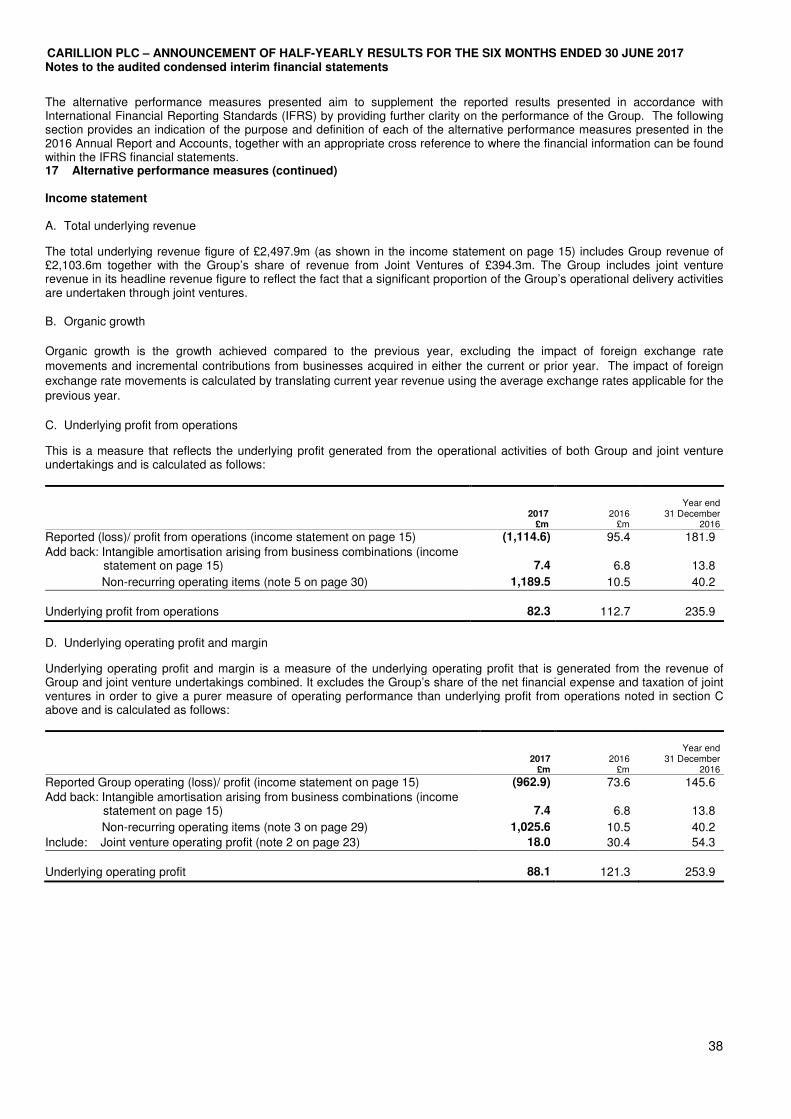
CARILLION PLC – ANNOUNCEMENT OF HALF-YEARLY RESULTS FOR THE SIX MONTHS ENDED 30 JUNE 2017 Notes to the audited condensed interim financial statements
38
The alternative performance measures presented aim to supplement the reported results presented in accordance with International Financial Reporting Standards (IFRS) by providing further clarity on the performance of the Group. The following section provides an indication of the purpose and definition of each of the alternative performance measures presented in the 2016 Annual Report and Accounts, together with an appropriate cross reference to where the financial information can be found within the IFRS financial statements. 17 Alternative performance measures (continued) Income statement A. Total underlying revenue
The total underlying revenue figure of £2,497.9m (as shown in the income statement on page 15) includes Group revenue of £2,103.6m together with the Group’s share of revenue from Joint Ventures of £394.3m. The Group includes joint venture revenue in its headline revenue figure to reflect the fact that a significant proportion of the Group’s operational delivery activities are undertaken through joint ventures.
B. Organic growth
Organic growth is the growth achieved compared to the previous year, excluding the impact of foreign exchange rate
movements and incremental contributions from businesses acquired in either the current or prior year. The impact of foreign
exchange rate movements is calculated by translating current year revenue using the average exchange rates applicable for the
previous year.
C. Underlying profit from operations
This is a measure that reflects the underlying profit generated from the operational activities of both Group and joint venture undertakings and is calculated as follows:
2017 £m
2016 £m
Year end
31 December 2016
Reported (loss)/ profit from operations (income statement on page 15) (1,114.6) 95.4 181.9
Add back: Intangible amortisation arising from business combinations (income statement on page 15)
7.4
6.8
13.8
Non-recurring operating items (note 5 on page 30) 1,189.5 10.5 40.2
Underlying profit from operations
82.3
112.7
235.9
D. Underlying operating profit and margin
Underlying operating profit and margin is a measure of the underlying operating profit that is generated from the revenue of Group and joint venture undertakings combined. It excludes the Group’s share of the net financial expense and taxation of joint ventures in order to give a purer measure of operating performance than underlying profit from operations noted in section C above and is calculated as follows:
2017 £m
2016 £m
Year end
31 December 2016
Reported Group operating (loss)/ profit (income statement on page 15) (962.9) 73.6 145.6 Add back: Intangible amortisation arising from business combinations (income statement on page 15)
7.4
6.8
13.8
Non-recurring operating items (note 3 on page 29) 1,025.6 10.5 40.2
Include: Joint venture operating profit (note 2 on page 23) 18.0 30.4 54.3
Underlying operating profit
88.1
121.3
253.9
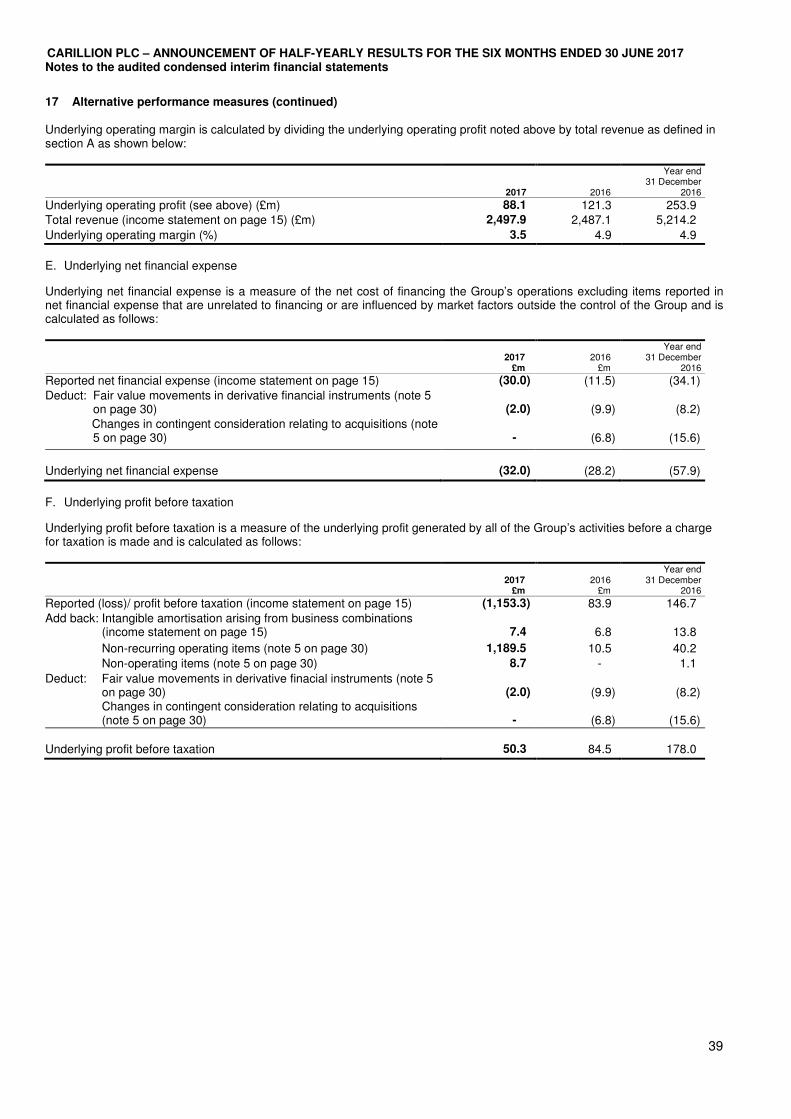
CARILLION PLC – ANNOUNCEMENT OF HALF-YEARLY RESULTS FOR THE SIX MONTHS ENDED 30 JUNE 2017 Notes to the audited condensed interim financial statements
39
17 Alternative performance measures (continued) Underlying operating margin is calculated by dividing the underlying operating profit noted above by total revenue as defined in section A as shown below:
2017 2016
Year end 31 December
2016
Underlying operating profit (see above) (£m) 88.1 121.3 253.9 Total revenue (income statement on page 15) (£m) 2,497.9 2,487.1 5,214.2
Underlying operating margin (%) 3.5 4.9 4.9
E. Underlying net financial expense
Underlying net financial expense is a measure of the net cost of financing the Group’s operations excluding items reported in net financial expense that are unrelated to financing or are influenced by market factors outside the control of the Group and is calculated as follows:
2017 £m
2016 £m
Year end 31 December
2016
Reported net financial expense (income statement on page 15) (30.0) (11.5) (34.1)
Deduct: Fair value movements in derivative financial instruments (note 5 on page 30)
(2.0)
(9.9)
(8.2)
Changes in contingent consideration relating to acquisitions (note 5 on page 30)
-
(6.8)
(15.6)
Underlying net financial expense
(32.0)
(28.2)
(57.9)
F. Underlying profit before taxation
Underlying profit before taxation is a measure of the underlying profit generated by all of the Group’s activities before a charge for taxation is made and is calculated as follows:
2017 £m
2016 £m
Year end 31 December
2016
Reported (loss)/ profit before taxation (income statement on page 15) (1,153.3) 83.9 146.7
Add back: Intangible amortisation arising from business combinations (income statement on page 15)
7.4
6.8
13.8
Non-recurring operating items (note 5 on page 30) 1,189.5 10.5 40.2
Non-operating items (note 5 on page 30) 8.7 - 1.1
Deduct: Fair value movements in derivative finacial instruments (note 5 on page 30)
(2.0)
(9.9)
(8.2)
Changes in contingent consideration relating to acquisitions (note 5 on page 30)
-
(6.8)
(15.6)
Underlying profit before taxation
50.3
84.5
178.0
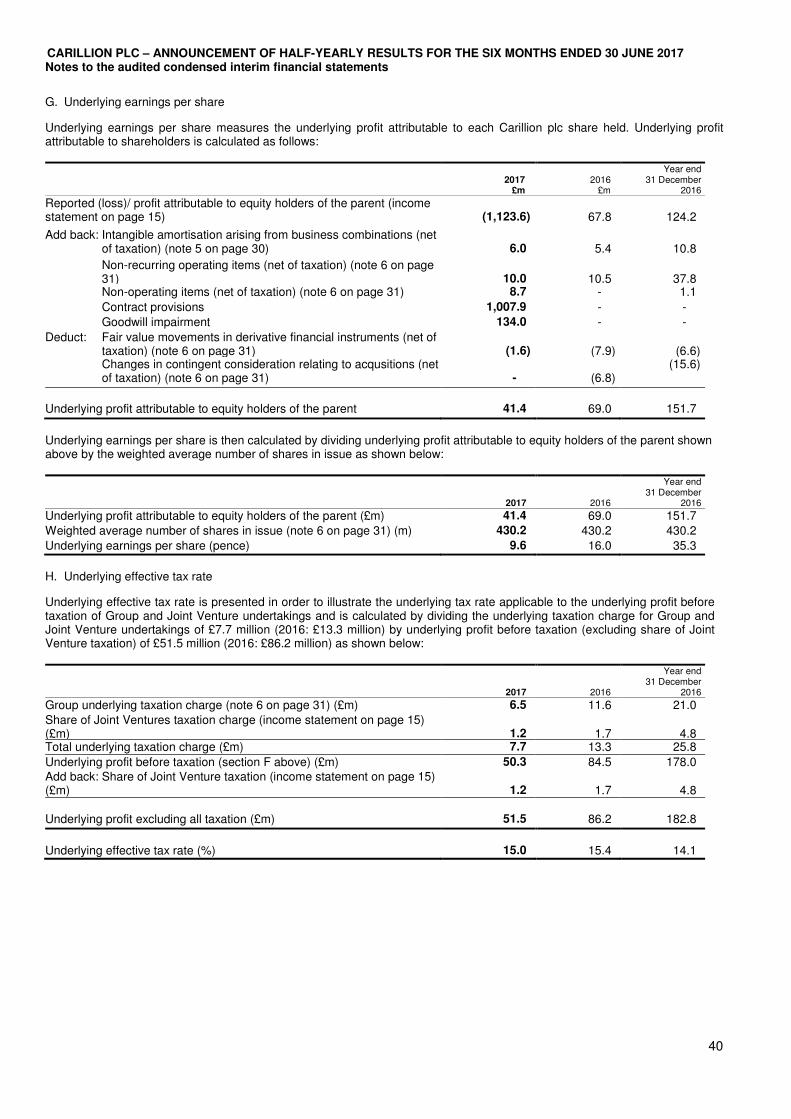
CARILLION PLC – ANNOUNCEMENT OF HALF-YEARLY RESULTS FOR THE SIX MONTHS ENDED 30 JUNE 2017 Notes to the audited condensed interim financial statements
40
G. Underlying earnings per share
Underlying earnings per share measures the underlying profit attributable to each Carillion plc share held. Underlying profit attributable to shareholders is calculated as follows:
2017 £m
2016 £m
Year end 31 December
2016
Reported (loss)/ profit attributable to equity holders of the parent (income statement on page 15)
(1,123.6)
67.8
124.2
Add back: Intangible amortisation arising from business combinations (net of taxation) (note 5 on page 30)
6.0
5.4
10.8
Non-recurring operating items (net of taxation) (note 6 on page 31)
10.0
10.5
37.8
Non-operating items (net of taxation) (note 6 on page 31) 8.7 - 1.1
Contract provisions 1,007.9 - -
Goodwill impairment 134.0 - -
Deduct: Fair value movements in derivative financial instruments (net of taxation) (note 6 on page 31)
(1.6)
(7.9)
(6.6)
Changes in contingent consideration relating to acqusitions (net of taxation) (note 6 on page 31)
-
(6.8)
(15.6)
Underlying profit attributable to equity holders of the parent
41.4
69.0
151.7
Underlying earnings per share is then calculated by dividing underlying profit attributable to equity holders of the parent shown above by the weighted average number of shares in issue as shown below:
2017 2016
Year end 31 December
2016
Underlying profit attributable to equity holders of the parent (£m) 41.4 69.0 151.7
Weighted average number of shares in issue (note 6 on page 31) (m) 430.2 430.2 430.2
Underlying earnings per share (pence) 9.6 16.0 35.3
H. Underlying effective tax rate
Underlying effective tax rate is presented in order to illustrate the underlying tax rate applicable to the underlying profit before taxation of Group and Joint Venture undertakings and is calculated by dividing the underlying taxation charge for Group and Joint Venture undertakings of £7.7 million (2016: £13.3 million) by underlying profit before taxation (excluding share of Joint Venture taxation) of £51.5 million (2016: £86.2 million) as shown below:
2017 2016
Year end 31 December
2016
Group underlying taxation charge (note 6 on page 31) (£m) 6.5 11.6 21.0
Share of Joint Ventures taxation charge (income statement on page 15) (£m)
1.2
1.7
4.8
Total underlying taxation charge (£m)
7.7 13.3 25.8
Underlying profit before taxation (section F above) (£m) 50.3 84.5 178.0 Add back: Share of Joint Venture taxation (income statement on page 15) (£m)
1.2
1.7
4.8
Underlying profit excluding all taxation (£m)
51.5
86.2
182.8
Underlying effective tax rate (%)
15.0
15.4
14.1
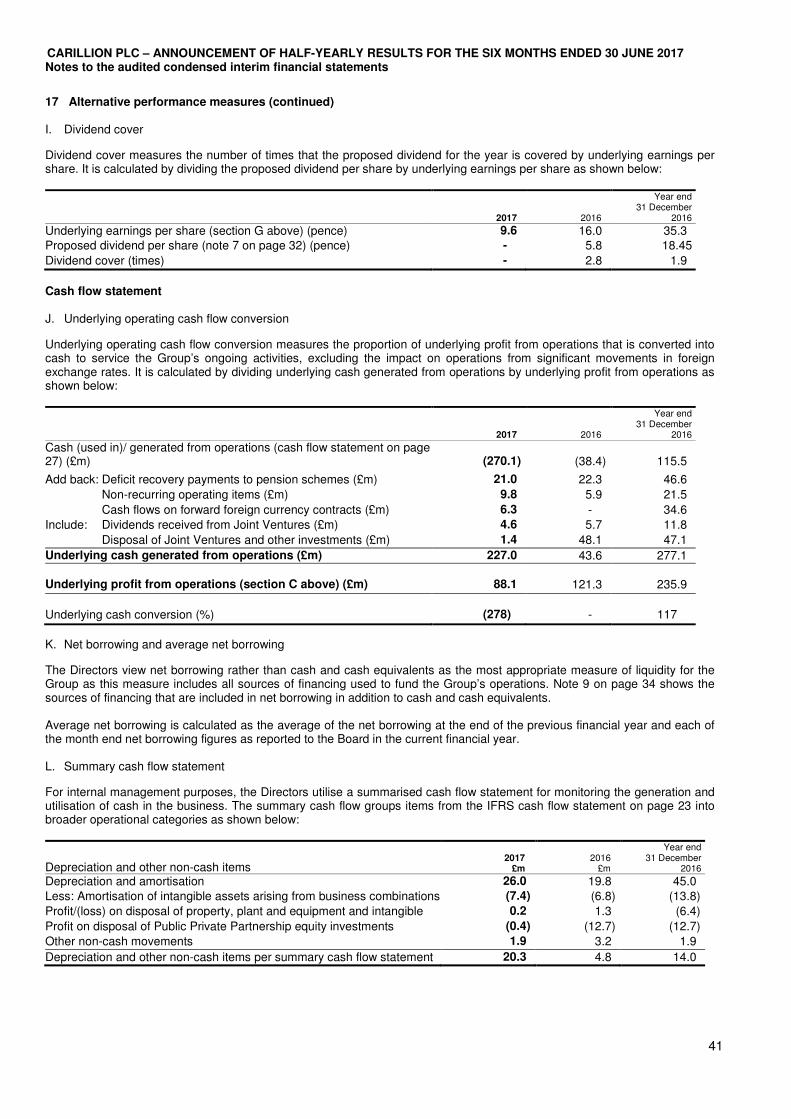
CARILLION PLC – ANNOUNCEMENT OF HALF-YEARLY RESULTS FOR THE SIX MONTHS ENDED 30 JUNE 2017 Notes to the audited condensed interim financial statements
41
17 Alternative performance measures (continued) I. Dividend cover
Dividend cover measures the number of times that the proposed dividend for the year is covered by underlying earnings per share. It is calculated by dividing the proposed dividend per share by underlying earnings per share as shown below:
2017 2016
Year end 31 December
2016
Underlying earnings per share (section G above) (pence) 9.6 16.0 35.3 Proposed dividend per share (note 7 on page 32) (pence) - 5.8 18.45
Dividend cover (times) - 2.8 1.9
Cash flow statement J. Underlying operating cash flow conversion
Underlying operating cash flow conversion measures the proportion of underlying profit from operations that is converted into cash to service the Group’s ongoing activities, excluding the impact on operations from significant movements in foreign exchange rates. It is calculated by dividing underlying cash generated from operations by underlying profit from operations as shown below:
2017 2016
Year end 31 December
2016
Cash (used in)/ generated from operations (cash flow statement on page 27) (£m)
(270.1)
(38.4)
115.5
Add back: Deficit recovery payments to pension schemes (£m) 21.0 22.3 46.6
Non-recurring operating items (£m) 9.8 5.9 21.5
Cash flows on forward foreign currency contracts (£m) 6.3 - 34.6
Include: Dividends received from Joint Ventures (£m) 4.6 5.7 11.8
Disposal of Joint Ventures and other investments (£m) 1.4 48.1 47.1
Underlying cash generated from operations (£m) 227.0 43.6 277.1
Underlying profit from operations (section C above) (£m)
88.1
121.3
235.9
Underlying cash conversion (%)
(278)
-
117
K. Net borrowing and average net borrowing
The Directors view net borrowing rather than cash and cash equivalents as the most appropriate measure of liquidity for the Group as this measure includes all sources of financing used to fund the Group’s operations. Note 9 on page 34 shows the sources of financing that are included in net borrowing in addition to cash and cash equivalents. Average net borrowing is calculated as the average of the net borrowing at the end of the previous financial year and each of the month end net borrowing figures as reported to the Board in the current financial year. L. Summary cash flow statement
For internal management purposes, the Directors utilise a summarised cash flow statement for monitoring the generation and utilisation of cash in the business. The summary cash flow groups items from the IFRS cash flow statement on page 23 into broader operational categories as shown below:
Depreciation and other non-cash items
2017 £m
2016 £m
Year end 31 December
2016
Depreciation and amortisation
26.0 19.8 45.0
Less: Amortisation of intangible assets arising from business combinations
(7.4) (6.8) (13.8)
Profit/(loss) on disposal of property, plant and equipment and intangible assets
0.2 1.3 (6.4)
Profit on disposal of Public Private Partnership equity investments (0.4) (12.7) (12.7)
Other non-cash movements 1.9 3.2 1.9
Depreciation and other non-cash items per summary cash flow statement 20.3 4.8 14.0
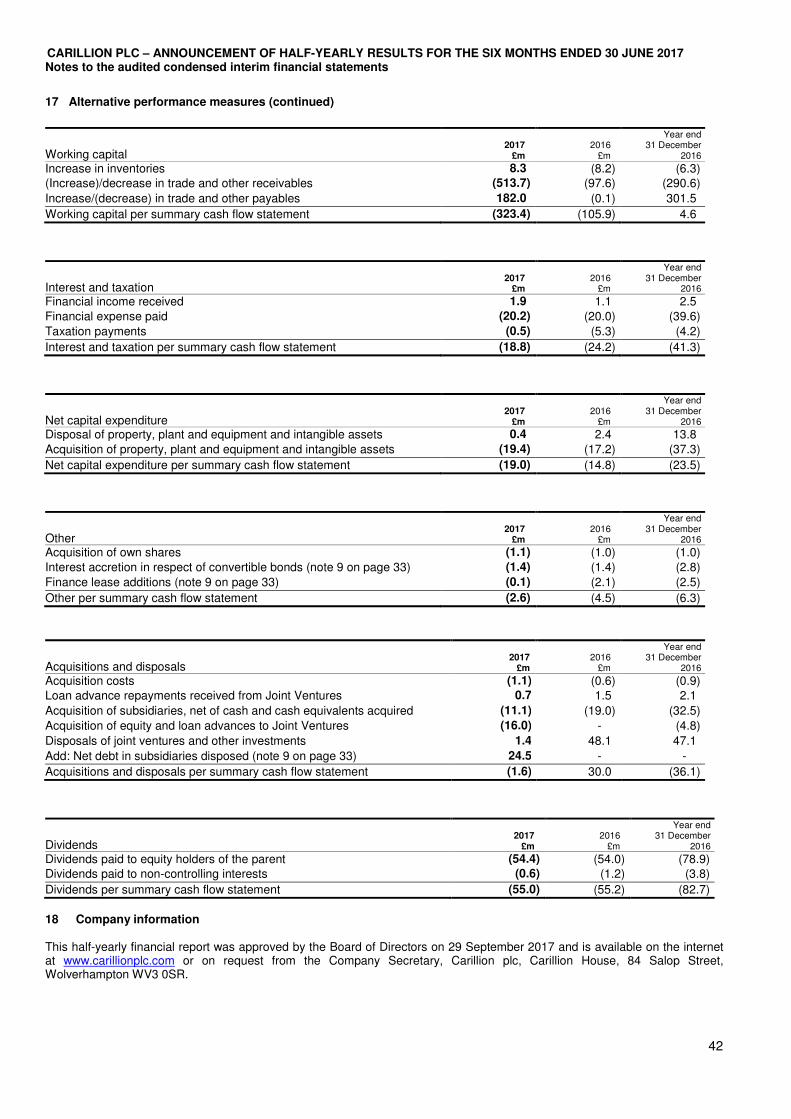
CARILLION PLC – ANNOUNCEMENT OF HALF-YEARLY RESULTS FOR THE SIX MONTHS ENDED 30 JUNE 2017 Notes to the audited condensed interim financial statements
42
17 Alternative performance measures (continued)
Working capital
2017 £m
2016 £m
Year end 31 December
2016
Increase in inventories 8.3 (8.2) (6.3) (Increase)/decrease in trade and other receivables (513.7) (97.6) (290.6)
Increase/(decrease) in trade and other payables 182.0 (0.1) 301.5
Working capital per summary cash flow statement (323.4) (105.9) 4.6
Interest and taxation
2017 £m
2016 £m
Year end 31 December
2016
Financial income received 1.9 1.1 2.5
Financial expense paid (20.2) (20.0) (39.6)
Taxation payments (0.5) (5.3) (4.2)
Interest and taxation per summary cash flow statement (18.8) (24.2) (41.3)
Net capital expenditure
2017 £m
2016 £m
Year end 31 December
2016
Disposal of property, plant and equipment and intangible assets 0.4 2.4 13.8
Acquisition of property, plant and equipment and intangible assets (19.4) (17.2) (37.3)
Net capital expenditure per summary cash flow statement (19.0) (14.8) (23.5)
Other
2017 £m
2016 £m
Year end 31 December
2016
Acquisition of own shares (1.1) (1.0) (1.0)
Interest accretion in respect of convertible bonds (note 9 on page 33) (1.4) (1.4) (2.8)
Finance lease additions (note 9 on page 33) (0.1) (2.1) (2.5)
Other per summary cash flow statement (2.6) (4.5) (6.3)
Acquisitions and disposals
2017 £m
2016 £m
Year end 31 December
2016
Acquisition costs (1.1) (0.6) (0.9) Loan advance repayments received from Joint Ventures 0.7 1.5 2.1
Acquisition of subsidiaries, net of cash and cash equivalents acquired (11.1) (19.0) (32.5)
Acquisition of equity and loan advances to Joint Ventures (16.0) - (4.8)
Disposals of joint ventures and other investments 1.4 48.1 47.1
Add: Net debt in subsidiaries disposed (note 9 on page 33) 24.5 - -
Acquisitions and disposals per summary cash flow statement (1.6) 30.0 (36.1)
Dividends
2017 £m
2016 £m
Year end 31 December
2016
Dividends paid to equity holders of the parent (54.4) (54.0) (78.9) Dividends paid to non-controlling interests (0.6) (1.2) (3.8)
Dividends per summary cash flow statement (55.0) (55.2) (82.7)
18 Company information This half-yearly financial report was approved by the Board of Directors on 29 September 2017 and is available on the internet at www.carillionplc.com or on request from the Company Secretary, Carillion plc, Carillion House, 84 Salop Street, Wolverhampton WV3 0SR.
CARILLION PLC – ANNOUNCEMENT OF HALF-YEARLY RESULTS FOR THE SIX MONTHS ENDED 30 JUNE 2017 Notes to the audited condensed interim financial statements
43
Directors’ responsibilities This half-yearly financial report complies with the Disclosure and Transparency Rules (DTR) of the United Kingdom’s Financial Conduct Authority in respect of the requirements to produce a half-yearly financial report. The half-yearly financial report is the responsibility of, and has been approved by, the Directors of Carillion plc. The Directors of Carillion plc confirm that to the best of their knowledge:
• the condensed set of financial statements has been prepared in accordance with IAS 34 as adopted by the European Union
• the half-yearly financial report includes a fair review of the information required by DTR 4.2.7R (indication of important events during the first six months of 2016 and description of principal risks and uncertainties for the remaining six months)
• the half-yearly financial report includes a fair review of the information required by DTR 4.2.8R (disclosure of any material related party transactions during the first six months of 2017 that have materially affected the financial position or performance of the Group and any changes in the related party transactions described in the 2015 Annual Report that could do so).
Forward-looking statements This report may contain certain statements about the future outlook for Carillion plc. Although the Directors believe their expectations are based on reasonable assumptions, any statements about future outlook may be influenced by factors that could cause actual outcomes and results to be materially different. Governing law This report of Carillion plc for the six months ended 30 June 2017 has been drawn up and presented for the purposes of complying with English law. Any liability arising out of or in connection with the report for the six months ended 30 June 2017 will be determined in accordance with English law.
On behalf of the Board
Keith Cochrane Interim Chief Executive Officer 29 September 2017
CARILLION PLC – ANNOUNCEMENT OF HALF-YEARLY RESULTS FOR THE SIX MONTHS ENDED 30 JUNE 2017 Notes to the audited condensed interim financial statements
44
Independent review report to Carillion plc
Conclusion
We have been engaged by the company to review the condensed set of financial statements in the half-yearly financial report for the six months ended 30 June 2017 which comprises the condensed consolidated income statement, the condensed consolidated statement of comprehensive income, the condensed consolidated statement of changes in equity, the condensed consolidated balance sheet, the condensed consolidated cash flow statement and the related explanatory notes. Based on our review, nothing has come to our attention that causes us to believe that the condensed set of financial statements in the half-yearly financial report for the six months ended 30 June 2017 is not prepared, in all material respects, in accordance with IAS 34 Interim Financial Reporting as adopted by the EU and the Disclosure Guidance and Transparency Rules (“the DTR”) of the UK’s Financial Conduct Authority (“the UK FCA”).
Scope of review
We conducted our review in accordance with International Standard on Review Engagements (UK and Ireland) 2410 Review of Interim Financial Information Performed by the Independent Auditor of the Entity issued by the Auditing Practices Board for use in the UK. A review of interim financial information consists of making enquiries, primarily of persons responsible for financial and accounting matters, and applying analytical and other review procedures. We read the other information contained in the half-yearly financial report and consider whether it contains any apparent misstatements or material inconsistencies with the information in the condensed set of financial statements.
A review is substantially less in scope than an audit conducted in accordance with International Standards on Auditing (UK) and consequently does not enable us to obtain assurance that we would become aware of all significant matters that might be identified in an audit. Accordingly, we do not express an audit opinion.
Directors’ responsibilities
The half-yearly financial report is the responsibility of, and has been approved by, the directors. The directors are responsible for preparing the half-yearly financial report in accordance with the DTR of the UK FCA.
As disclosed in note 1, the annual financial statements of the group are prepared in accordance with International Financial Reporting Standards as adopted by the EU. The directors are responsible for preparing the condensed set of financial statements included in the half-yearly financial report in accordance with IAS 34 as adopted by the EU.
Our responsibility
Our responsibility is to express to the company a conclusion on the condensed set of financial statements in the half-yearly financial report based on our review.
The purpose of our review work and to whom we owe our responsibilities
This report is made solely to the company in accordance with the terms of our engagement to assist the company in meeting the requirements of the DTR of the UK FCA. Our review has been undertaken so that we might state to the company those matters we are required to state to it in this report and for no other purpose. To the fullest extent permitted by law, we do not accept or assume responsibility to anyone other than the company for our review work, for this report, or for the conclusions we have reached.
Peter Meehan For and on behalf of KPMG LLP Chartered Accountants One Snowhill Snow Hill Queensway Birmingham B4 6GH 29 September 2017