Embed Size (px)
Citation preview

29 July 2020 HSIE Results Daily
HSIE Results Daily
HSIE Research is also available on Bloomberg ERH HDF <GO> & Thomson Reuters
Contents
Result Reviews
Maruti Suzuki: Maruti’s Q1FY22 PAT, at INR 4.4bn (-62% QoQ), was adversely
impacted by the second wave of COVID. We believe that demand will improve
from here on, as supplies for the high demand CNG variant resumes (this
segment now accounts for over 10% of volumes). The OEM has an order backlog
of 170,000 units. Further, Maruti is addressing white spaces in its SUV portfolio
(new model launches are expected in this segment over the next 12 months). We
reiterate BUY with a target price of INR 8,190 (at 27x Jun-23E EPS). We lower
our estimates by ~5% over FY23-24E, to factor in weak Q1FY22 results.
Nestle India: Nestle’s Q2CY21 revenue was slightly ahead of our estimate, but
the EBITDA margin was lower than the estimate. Domestic revenue growth was
up by 14% (+8% 2-year CAGR, +10% HSIE), driven by volume and mix, albeit on
a low base. Key products (in-home consumption) sustained traction and posted
strong double-digit growth. The e‐commerce channel grew by 105% and
contributed towards 6% of sales. The contribution of innovative products has
been rising, now at 5%. Exports were up 18% YoY (15% HSIE), on a favourable
base, but were flat QoQ. Gross margin expanded 67/-152bps YoY/QoQ to 57%,
lower-than-expected due to rising raw material cost. EBITDA was up 11% YoY
(+9% 2-year CAGR, HSIE 16%). Capex was at INR 10bn in H1CY21, out of the
committed INR 26bn over the next 3-4 years. We expect the company to
continue its growth in in-home products, aided by its ecommerce and hyper-
local channels and, with markets opening up, we expect to see recovery in the
OOH segments. We maintain our EPS estimates for CY21E/CY22E/CY23E and
value Nestle at 55x P/E on Jun-23E EPS to derive a TP of INR 17,108. With rich
valuation, the absolute upside is limited in the medium term, making the risk-
reward unattractive. Maintain REDUCE.
Dalmia Bharat: We maintain ADD rating on Dalmia Bharat (DBEL) with an
unchanged target price of INR 2,210/share (13x Jun’23E consolidated EBITDA).
In Q1FY22, its net sales/EBITDA fell 18/8% QoQ (up 36/14% YoY on a low base)
to INR 25.9/7.0bn due to a sharp volume loss (mainly in the south). Robust
pricing across markets, fuel mix optimisation, and continued productivity gains,
however, moderated the impact of profits. DBEL outlined major Capex plans to
increase its capacity by ~58% to 48mn MT by FY24E. It will also increase the
share of low-cost green power to ~20% in FY24E vs 5% in FY21.
Teamlease Services: We maintain BUY on Teamlease, following a better-than-
expected revenue (+2.7% QoQ) and margin performance. The core staffing
revenue growth was soft (+1.3% QoQ), impacted by the second wave, but an
uptick in the IT sector hiring led to strong growth in specialised staffing (+17%
QoQ). Gradual improvements in hiring activity across key verticals (e-
commerce, telecom, consumer, healthcare, BFSI and industrial) and addition of
47 new logos will aid growth in the core staffing segment (90% of revenue). The
specialised staffing (8% of revenue) will continue to grow, led by 27 new client
additions, an increase in open positions/hiring across domains, and
improvement in realisations. Margin performance was better than expected
(2.1%, +20bps QoQ). We expect gradual margin expansion with recovery in
growth (2HFY22E), higher productivity, improving business mix (higher-margin
specialised staffing), and lower cost of hiring. We increase our EPS estimate by
7.4/3.9% for FY22/23E to factor in margin expansion. Our target price of INR
4,240 is based on 38x June-23E EPS (five-year average PE of ~35x). The stock is
trading at a PE of 51/36x FY22/23E.
HSIE Research Team

Page | 2
HSIE Results Daily
Maruti Suzuki
A weak quarter, CNG variants to ramp up in Q2FY22
Maruti’s Q1FY22 PAT, at INR 4.4bn (-62% QoQ), was adversely impacted by
the second wave of COVID. We believe that demand will improve from here
on, as supplies for the high demand CNG variant resumes (this segment now
accounts for over 10% of volumes). The OEM has an order backlog of 170,000
units. Further, Maruti is addressing white spaces in its SUV portfolio (new
model launches are expected in this segment over the next 12 months). We
reiterate BUY with a target price of INR 8,190 (at 27x Jun-23E EPS). We lower
our estimates by ~5% over FY23-24E, to factor in weak Q1FY22 results.
Q1FY22 financials: Volumes, at 353k units, declined 28% QoQ, impacted by
the second wave of COVID. The average realisation grew 3% on the back of
price hikes taken. Revenue declined 26% QoQ to INR 177.7bn. EBITDA
margin, disappointed, at 4.6% (-370bps QoQ), owing to commodity cost
pressures (RM ratio at 74.8% was up 330/90bps YoY/QoQ) and negative
operating leverage. PAT declined 62% QoQ to INR 4.4bn.
Key takeaways: (1) near-term outlook is encouraging: The demand in Jul-
21 has picked up along with enquiries (similar to Q4FY21) and bookings
(~80% of Q4FY21). The recovery this time around is across rural and urban
markets. The company’s order book currently stands at 170k units (27 days).
(2) Production in Q1FY22 was constrained for CNG variants: The supplies
for the high demand variants were impacted by oxygen-related shortages,
which impacted the retail market share by ~500bps. As CNG supplies
normalise, Maruti will benefit as customers are incrementally preferring the
lower cost option amidst rising diesel prices. (3) Commodity cost pressures:
The management highlighted that the input cost inflation affected margins
by 3.5%, whereas another 4% impact was due to negative leverage
(production was impacted by the lockdown). Incremental price hikes will
partially offset the sharp commodity increases. (3) SUVs in focus: The
management is expected to launch new SUVs to address this growing white
space.
Financial Summary
YE March
(INR bn)
1Q
FY22
1Q
FY21
YoY
(%)
4Q
FY21
QoQ
(%) FY20 FY21 FY22E FY23E FY24E
Net Sales 177.7 41.1 333 240.2 (26) 756.1 703.3 865.7 1,022.9 1,201.6
EBITDA 8.2 (8.6) NA 19.9 (59) 73.0 53.5 70.6 107.7 140.6
APAT 4.4 (2.5) NA 11.7 (62) 56.5 42.3 53.5 84.8 112.0
Adj. EPS (Rs) 14.6 (8.3) NA 38.6 (62) 187.1 140.1 177.1 280.8 370.7
APAT Gr (%)
(24.7) (25.1) 26.4 58.6 32.0
P/E (x)
38.3 51.2 40.5 25.5 19.3
RoE (%)
11.9 8.5 10.1 14.6 17.3
Source: Company, HSIE Research
Change in Estimates
INR bn New Old Change (%)
FY22E FY23E FY24E FY22E FY23E FY24E FY22E FY23E FY24E
Net Sales 865.7 1,022.9 1,201.6 858.0 1,013.8 1,191.0 1 1 1
EBITDA 70.6 107.7 140.6 82.9 109.8 140.5 (15) (2) 0
EBITDA
margin (%) 8.2 10.5 11.7 9.7 10.8 11.8 -150 bps -30 bps
-10
bps
Adj PAT 53.5 84.8 112.0 66.7 90.5 116.6 (20) (6) (4)
Adj EPS(Rs) 177.1 280.8 370.7 220.9 299.7 386.2 (20) (6) (4)
Source: Company, HSIE Research
BUY
CMP (as on 28 July 2021) INR 7,165
Target Price INR 8,190
NIFTY 15,709
KEY
CHANGES OLD NEW
Rating BUY BUY
Price Target Rs 8,680 Rs 8,190
EPS % FY22E FY23E
-20% -6%
KEY STOCK DATA
Bloomberg code MSIL IN
No. of Shares (mn) 302
MCap (Rs bn) / ($ mn) 2,164/29,101
6m avg traded value (Rs mn) 6,278
52 Week high / low Rs 8,400/6,031
STOCK PERFORMANCE (%)
3M 6M 12M
Absolute (%) 9.0 -5.6 14.0
Relative (%) 3.6 -18.9 -23.7
SHAREHOLDING PATTERN (%)
Mar-21 Jun-21
Promoters 56.4 56.4
FIs & Local MFs 15.1 15.8
FPIs 23.1 22.9
Public & Others 5.4 5.0
Pledged Shares 0.0 0.0
Source : BSE
Aditya Makharia
+91-22-6171-7316
Mansi Lall
+91-22-6171-7357

Page | 3
HSIE Results Daily
Nestle India Beat on revenue, a miss in margin Nestle’s Q2CY21 revenue was slightly ahead of our estimate, but the EBITDA
margin was lower than the estimate. Domestic revenue growth was up by 14%
(+8% 2-year CAGR, +10% HSIE), driven by volume and mix, albeit on a low
base. Key products (in-home consumption) sustained traction and posted
strong double-digit growth. The e‐commerce channel grew by 105% and
contributed towards 6% of sales. The contribution of innovative products has
been rising, now at 5%. Exports were up 18% YoY (15% HSIE), on a favourable
base, but were flat QoQ. Gross margin expanded 67/-152bps YoY/QoQ to 57%,
lower-than-expected due to rising raw material cost. EBITDA was up 11% YoY
(+9% 2-year CAGR, HSIE 16%). Capex was at INR 10bn in H1CY21, out of the
committed INR 26bn over the next 3-4 years. We expect the company to
continue its growth in in-home products, aided by its ecommerce and hyper-
local channels and, with markets opening up, we expect to see recovery in the
OOH segments. We maintain our EPS estimates for CY21E/CY22E/CY23E and
value Nestle at 55x P/E on Jun-23E EPS to derive a TP of INR 17,108. With rich
valuation, the absolute upside is limited in the medium term, making the risk-
reward unattractive. Maintain REDUCE.
▪ Revenue beat: Revenue grew by 14% YoY (+4% in Q2CY20 and +10% in
Q1CY21), a beat on our expectation of 10% YoY growth. Domestic revenue
grew by 14% YoY (+3% in Q2CY20 and +10% in Q1CY21, +10% HSIE) while
exports grew 18% YoY (15% HSIE). E-commerce more than doubled (+105%)
now, contributing 6.4% towards domestic revenue. Maggi noodles, Kitkat,
Nestlé Munch, Maggi sauces, Maggi Masala-AE-Magic clocked strong
double-digit growth.
▪ GM impacted by rising input cost: GM, impacted by rising raw material
costs of oils and packaging materials, expanded by 67bps YoY (-193bps in
Q2CY20 and +223bps in Q1CY21), vs. HSIE estimate of +216bps expansion.
Employee cost was up by 2% due to previous year’s high base. Other
expenses grew by 30% YoY on a low base. EBITDA margin saw a
contraction of 75bps YoY to 24.4% (+130bps in Q2CY20 and +150bps in
Q1CY21), vs. our estimate of 126bps YoY expansion. EBITDA grew by 11%
YoY (HSIE 16% YoY). PAT was up by 11%.
Press release takeaways: (1) Key products (in-home consumption) posted
strong double-digit growth. (2) Domestic and export sales were driven by
volume and mix. (3) E-commerce was up 105% YoY, contributing to 6.4% of
domestic sales in Q2CY21, while hyperlocal channels grew by 147% YoY in
H1CY21. (4) Contribution of innovations to domestic sales stood at 4.9% in
H1CY21. (5) Commodity prices is rising across oils and packaging materials.
(6) It has invested ~INR 10bn of its INR 26bn commitment made last year.
Quarterly/Annual Financial summary
YE Dec (INR mn) Q2CY21 Q2CY20 YoY (%) Q1CY21 QoQ (%) CY20 CY21E CY22E CY23E
Net Sales 34,767 30,505 14.0 36,108 (3.7) 133,500 149,250 165,424 182,908
EBITDA 8,490 7,677 10.6 9,340 (9.1) 32,619 37,146 41,766 46,966
APAT 5,386 4,866 10.7 6,029 (10.7) 20,928 24,598 28,363 31,620
Diluted EPS(INR) 55.9 50.5 10.7 62.5 (10.7) 217.0 255.1 294.2 327.9
P/E (x) 83.0 70.6 61.3 55.0
EV / EBITDA (x)
52.3 45.8 40.6 36.0
RoCE (%)
76.9 64.7 54.7 114.3
Source: Company, HSIE Research
REDUCE
CMP (as on 28 July 2021) INR 18,023
Target Price INR 17,108
NIFTY 15,709
KEY CHANGES OLD NEW
Rating REDUCE REDUCE
Price Target Rs 17,108 Rs 17,108
EPS % CY21E CY22E
0% 0%
KEY STOCK DATA
Bloomberg code NEST IN
No. of Shares (mn) 96
MCap (Rs bn) / ($ mn) 1,738/23,363
6m avg traded value (Rs mn) 1,639
52 Week high / low INR 18,844/15,100
STOCK PERFORMANCE (%)
3M 6M 12M
Absolute (%) 8.3 3.7 5.4
Relative (%) 3.0 (9.7) (32.3)
SHAREHOLDING PATTERN (%)
Mar-21 Jun-21
Promoters 62.76 62.76
FIs & Local MFs 7.90 7.92
FPIs 12.29 12.43
Public & Others 17.05 16.89
Pledged Shares 0.00 0.00
Source : BSE
Pledged shares as % of total shares
Varun Lohchab
+91-22-6171-7334
Naveen Trivedi
+91-22-6171-7324
Saras Singh
+91-22-6171-7336
Page | 4
HSIE Results Daily
Dalmia Bharat
Strong performance; embarks on major expansion
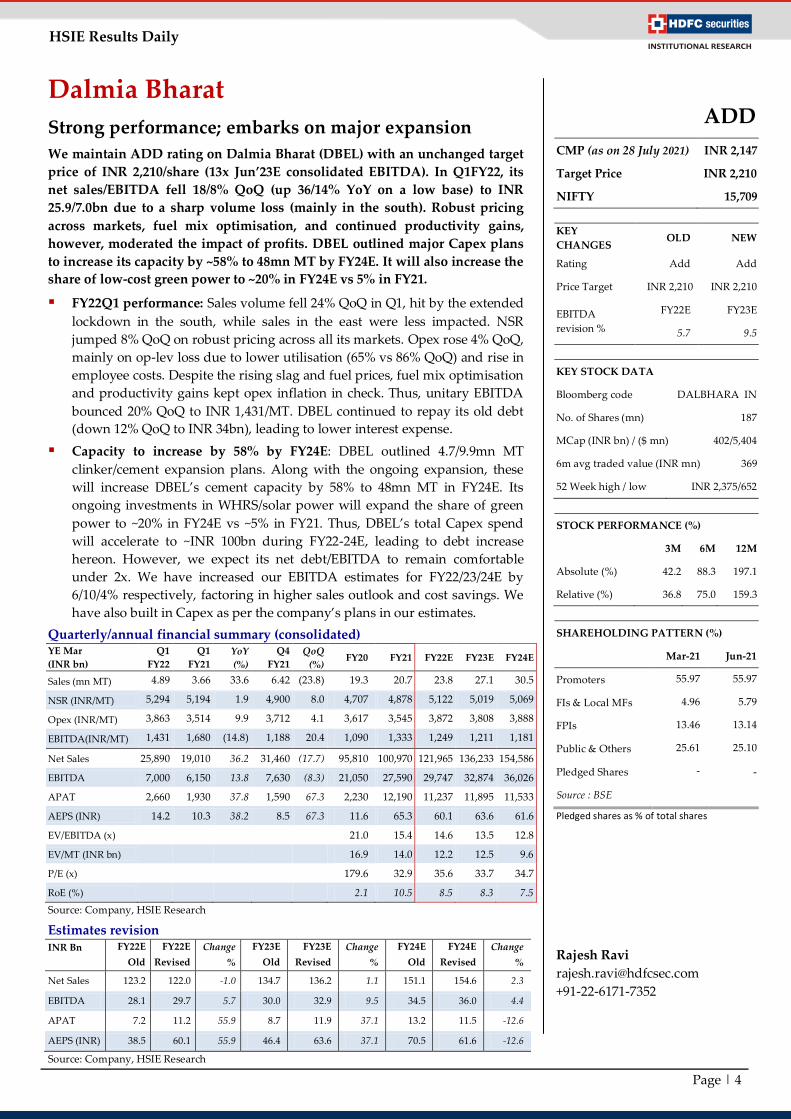
We maintain ADD rating on Dalmia Bharat (DBEL) with an unchanged target
price of INR 2,210/share (13x Jun’23E consolidated EBITDA). In Q1FY22, its
net sales/EBITDA fell 18/8% QoQ (up 36/14% YoY on a low base) to INR
25.9/7.0bn due to a sharp volume loss (mainly in the south). Robust pricing
across markets, fuel mix optimisation, and continued productivity gains,
however, moderated the impact of profits. DBEL outlined major Capex plans
to increase its capacity by ~58% to 48mn MT by FY24E. It will also increase the
share of low-cost green power to ~20% in FY24E vs 5% in FY21.
FY22Q1 performance: Sales volume fell 24% QoQ in Q1, hit by the extended
lockdown in the south, while sales in the east were less impacted. NSR
jumped 8% QoQ on robust pricing across all its markets. Opex rose 4% QoQ,
mainly on op-lev loss due to lower utilisation (65% vs 86% QoQ) and rise in
employee costs. Despite the rising slag and fuel prices, fuel mix optimisation
and productivity gains kept opex inflation in check. Thus, unitary EBITDA
bounced 20% QoQ to INR 1,431/MT. DBEL continued to repay its old debt
(down 12% QoQ to INR 34bn), leading to lower interest expense.
Capacity to increase by 58% by FY24E: DBEL outlined 4.7/9.9mn MT
clinker/cement expansion plans. Along with the ongoing expansion, these
will increase DBEL’s cement capacity by 58% to 48mn MT in FY24E. Its
ongoing investments in WHRS/solar power will expand the share of green
power to ~20% in FY24E vs ~5% in FY21. Thus, DBEL’s total Capex spend
will accelerate to ~INR 100bn during FY22-24E, leading to debt increase
hereon. However, we expect its net debt/EBITDA to remain comfortable
under 2x. We have increased our EBITDA estimates for FY22/23/24E by
6/10/4% respectively, factoring in higher sales outlook and cost savings. We
have also built in Capex as per the company’s plans in our estimates.
Quarterly/annual financial summary (consolidated) YE Mar
(INR bn)
Q1
FY22
Q1
FY21
YoY
(%)
Q4
FY21
QoQ
(%) FY20 FY21 FY22E FY23E FY24E
Sales (mn MT) 4.89 3.66 33.6 6.42 (23.8) 19.3 20.7 23.8 27.1 30.5
NSR (INR/MT) 5,294 5,194 1.9 4,900 8.0 4,707 4,878 5,122 5,019 5,069
Opex (INR/MT) 3,863 3,514 9.9 3,712 4.1 3,617 3,545 3,872 3,808 3,888
EBITDA(INR/MT) 1,431 1,680 (14.8) 1,188 20.4 1,090 1,333 1,249 1,211 1,181
Net Sales 25,890 19,010 36.2 31,460 (17.7) 95,810 100,970 121,965 136,233 154,586
EBITDA 7,000 6,150 13.8 7,630 (8.3) 21,050 27,590 29,747 32,874 36,026
APAT 2,660 1,930 37.8 1,590 67.3 2,230 12,190 11,237 11,895 11,533
AEPS (INR) 14.2 10.3 38.2 8.5 67.3 11.6 65.3 60.1 63.6 61.6
EV/EBITDA (x)
21.0 15.4 14.6 13.5 12.8
EV/MT (INR bn)
16.9 14.0 12.2 12.5 9.6
P/E (x)
179.6 32.9 35.6 33.7 34.7
RoE (%)
2.1 10.5 8.5 8.3 7.5
Source: Company, HSIE Research
Estimates revision INR Bn FY22E
Old
FY22E
Revised
Change
%
FY23E
Old
FY23E
Revised
Change
%
FY24E
Old
FY24E
Revised
Change
%
Net Sales 123.2 122.0 -1.0 134.7 136.2 1.1 151.1 154.6 2.3
EBITDA 28.1 29.7 5.7 30.0 32.9 9.5 34.5 36.0 4.4
APAT 7.2 11.2 55.9 8.7 11.9 37.1 13.2 11.5 -12.6
AEPS (INR) 38.5 60.1 55.9 46.4 63.6 37.1 70.5 61.6 -12.6
Source: Company, HSIE Research
ADD
CMP (as on 28 July 2021) INR 2,147
Target Price INR 2,210
NIFTY 15,709
KEY
CHANGES OLD NEW
Rating Add Add
Price Target INR 2,210 INR 2,210
EBITDA
revision %
FY22E FY23E
5.7 9.5
KEY STOCK DATA
Bloomberg code DALBHARA IN
No. of Shares (mn) 187
MCap (INR bn) / ($ mn) 402/5,404
6m avg traded value (INR mn) 369
52 Week high / low INR 2,375/652
STOCK PERFORMANCE (%)
3M 6M 12M
Absolute (%) 42.2 88.3 197.1
Relative (%) 36.8 75.0 159.3
SHAREHOLDING PATTERN (%)
Mar-21 Jun-21
Promoters 55.97 55.97
FIs & Local MFs 4.96 5.79
FPIs 13.46 13.14
Public & Others 25.61 25.10
Pledged Shares - -
Source : BSE
Pledged shares as % of total shares
Rajesh Ravi
+91-22-6171-7352

Page | 5
HSIE Results Daily
Teamlease Services
Future bright
We maintain BUY on Teamlease, following a better-than-expected revenue
(+2.7% QoQ) and margin performance. The core staffing revenue growth was
soft (+1.3% QoQ), impacted by the second wave, but an uptick in the IT sector
hiring led to strong growth in specialised staffing (+17% QoQ). Gradual
improvements in hiring activity across key verticals (e-commerce, telecom,
consumer, healthcare, BFSI and industrial) and addition of 47 new logos will
aid growth in the core staffing segment (90% of revenue). The specialised
staffing (8% of revenue) will continue to grow, led by 27 new client additions,
an increase in open positions/hiring across domains, and improvement in
realisations. Margin performance was better than expected (2.1%, +20bps
QoQ). We expect gradual margin expansion with recovery in growth
(2HFY22E), higher productivity, improving business mix (higher-margin
specialised staffing), and lower cost of hiring. We increase our EPS estimate
by 7.4/3.9% for FY22/23E to factor in margin expansion. Our target price of
INR 4,240 is based on 38x June-23E EPS (five-year average PE of ~35x). The
stock is trading at a PE of 51/36x FY22/23E.
Q1FY22 highlights: Revenue stood at INR 13.77bn, up 2.7% QoQ, vs. our
estimate of INR 13.48bn. Core/specialised/HR services revenue was up
+1.3/+17.0/+22.2% QoQ. The mark-up remained flat at INR 690 and the
associate to core ratio declined marginally to 345 (-2.0% QoQ). EBITDA
margin for core staffing/specialised staffing/HR services stood at 1.9/9.1/-
3.1%. Provision of INR 15mn in the government training business was
collected in Q1. The company has a free cash balance of INR 2bn, which it
may use for M&A activity. The cash collections continue to be robust
(OCF/EBITDA at 130%). NETAP associates declined by 4.8% but the
addition of 24 new logos indicate growth revival.
Outlook: We expect revenue growth of 24.6/26.9% in FY22/23E and EBITDA
margin of 2.2/2.4% respectively, leading to revenue and EPS CAGRs of 24%
and 40% over FY21-24E.
Quarterly Financial summary
YE March (INR bn) 1Q
FY22
1Q
FY21
YoY
(%)
4Q
FY21
QoQ
(%) FY20 FY21 FY22E FY23E FY24E
Net Revenue 13.77 11.36 21.1 13.41 2.7 52.01 48.81 60.83 77.17 93.89
EBITDA 0.30 0.25 20.0 0.26 13.0 0.95 0.98 1.37 1.85 2.36
APAT 0.24 0.17 40.1 0.20 24.0 0.85 0.81 1.26 1.78 2.28
Diluted EPS (INR) 14.2 10.2 40.1 11.5 24.0 49.5 47.6 73.5 104.2 133.6
P/E (x)
76.2 79.2 51.3 36.2 28.2
EV / EBITDA (x)
67.8 62.0 43.9 31.5 23.9
RoE (%)
15.2 13.3 17.6 20.5 21.3
Source: Company, HSIE Research, Consolidated Financials Change in Estimates YE March
(INR bn)
FY22E
Old
FY22E
Revised
Change
%
FY23E
Old
FY23E
Revised
Change
%
FY24E
Old
FY24E
Revised
Change
%
Revenue 59.82 60.83 1.7 76.12 77.17 1.4 92.57 93.89 1.4
EBITDA 1.25 1.37 9.4 1.79 1.85 3.6 2.25 2.36 4.6
EBITDA
margin (%) 2.1 2.2 16bps 2.3 2.4 5bps 2.4 2.5 8bps
APAT 1.17 1.26 7.4 1.71 1.78 3.9 2.18 2.28 4.9
EPS (INR) 68.5 73.5 7.4 100.3 104.2 3.9 127.3 133.6 4.9
Source: Company, HSIE Research
BUY
CMP (as on 28 July, 2021) INR 3,772
Target Price INR 4,240
NIFTY 15,709
KEY CHANGES OLD NEW
Rating BUY BUY
Price Target INR 4,070 INR 4,240
EPS % FY22E FY23E
+7.4 +3.9
KEY STOCK DATA
Bloomberg code TEAM IN
No. of Shares (mn) 17
MCap (INR bn) / ($ mn) 64/867
6m avg traded value (INR mn) 111
52 Week high / low INR 1,750/4,098
STOCK PERFORMANCE (%)
3M 6M 12M
Absolute (%) 16.4 33.8 104.1
Relative (%) 11.0 20.5 66.3
SHAREHOLDING PATTERN (%)
Mar-21 June-21
Promoters 34.01 34.01
FIs & Local MFs 12.29 12.61
FPIs 37.83 37.00
Public & Others 15.87 16.38
Pledged Shares 0.49 0.49
Source : BSE
Pledged shares as % of total shares
Amit Chandra
+91-22-6171-7345
Mohit Motwani
+91-22-6171-7332

Page | 6
HSIE Results Daily
Rating Criteria
BUY: >+15% return potential
ADD: +5% to +15% return potential
REDUCE: -10% to +5% return potential
SELL: > 10% Downside return potential
Disclosure:
Analyst Company Covered Qualification Any holding in the stock
Aditya Makharia Maruti Suzuki CA NO
Mansi Lall Maruti Suzuki MBA NO
Varun Lohchab Nestle India PGDM NO
Naveen Trivedi Nestle India MBA NO
Saras Singh Nestle India PGDM NO
Amit Chandra Teamlease Services PGDM NO
Mohit Motwani Teamlease Services MBA NO
Rajesh Ravi Dalmia Bharat PGPM NO

Page | 7
HSIE Results Daily
Disclosure:
Authors and the names subscribed to this report, hereby certify that all of the views expressed in this research report accurately reflect our views about the
subject issuer(s) or securities. HSL has no material adverse disciplinary history as on the date of publication of this report. We also certify that no part of our
compensation was, is, or will be directly or indirectly related to the specific recommendation(s) or view(s) in this report.
Research Analyst or his/her relative or HDFC Securities Ltd. does not have any financial interest in the subject company. Also Research Analyst or his relative
or HDFC Securities Ltd. or its Associate may have beneficial ownership of 1% or more in the subject company at the end of the month immediately preceding
the date of publication of the Research Report. Further Research Analyst or his relative or HDFC Securities Ltd. or its associate does not have any material
conflict of interest.
HDFC Securities Limited (HSL) is a SEBI Registered Research Analyst having registration no. INH000002475.
Disclaimer:
This report has been prepared by HDFC Securities Ltd and is solely for information of the recipient only. The report must not be used as a singular basis of any
investment decision. The views herein are of a general nature and do not consider the risk appetite or the particular circumstances of an individual investor;
readers are requested to take professional advice before investing. Nothing in this document should be construed as investment advice. Each recipient of this
document should make such investigations as they deem necessary to arrive at an independent evaluation of an investment in securities of the companies
referred to in this document (including merits and risks) and should consult their own advisors to determine merits and risks of such investment. The
information and opinions contained herein have been compiled or arrived at, based upon information obtained in good faith from sources believed to be
reliable. Such information has not been independently verified and no guaranty, representation of warranty, express or implied, is made as to its accuracy,
completeness or correctness. All such information and opinions are subject to change without notice. Descriptions of any company or companies or their
securities mentioned herein are not intended to be complete. HSL is not obliged to update this report for such changes. HSL has the right to make changes and
modifications at any time.
This report is not directed to, or intended for display, downloading, printing, reproducing or for distribution to or use by, any person or entity who is a citizen
or resident or located in any locality, state, country or other jurisdiction where such distribution, publication, reproduction, availability or use would be
contrary to law or regulation or what would subject HSL or its affiliates to any registration or licensing requirement within such jurisdiction.
If this report is inadvertently sent or has reached any person in such country, especially, United States of America, the same should be ignored and brought to
the attention of the sender. This document may not be reproduced, distributed or published in whole or in part, directly or indirectly, for any purposes or in
any manner.
Foreign currencies denominated securities, wherever mentioned, are subject to exchange rate fluctuations, which could have an adverse effect on their value or
price, or the income derived from them. In addition, investors in securities such as ADRs, the values of which are influenced by foreign currencies effectively
assume currency risk. It should not be considered to be taken as an offer to sell or a solicitation to buy any security.
This document is not, and should not, be construed as an offer or solicitation of an offer, to buy or sell any securities or other financial instruments. This report
should not be construed as an invitation or solicitation to do business with HSL. HSL may from time to time solicit from, or perform broking, or other services
for, any company mentioned in this mail and/or its attachments.
HSL and its affiliated company(ies), their directors and employees may; (a) from time to time, have a long or short position in, and buy or sell the securities of
the company(ies) mentioned herein or (b) be engaged in any other transaction involving such securities and earn brokerage or other compensation or act as a
market maker in the financial instruments of the company(ies) discussed herein or act as an advisor or lender/borrower to such company(ies) or may have any
other potential conflict of interests with respect to any recommendation and other related information and opinions.
HSL, its directors, analysts or employees do not take any responsibility, financial or otherwise, of the losses or the damages sustained due to the investments
made or any action taken on basis of this report, including but not restricted to, fluctuation in the prices of shares and bonds, changes in the currency rates,
diminution in the NAVs, reduction in the dividend or income, etc.
HSL and other group companies, its directors, associates, employees may have various positions in any of the stocks, securities and financial instruments dealt
in the report, or may make sell or purchase or other deals in these securities from time to time or may deal in other securit ies of the companies / organizations
described in this report.
HSL or its associates might have managed or co-managed public offering of securities for the subject company or might have been mandated by the subject
company for any other assignment in the past twelve months.
HSL or its associates might have received any compensation from the companies mentioned in the report during the period preceding twelve months from t
date of this report for services in respect of managing or co-managing public offerings, corporate finance, investment banking or merchant banking, brokerage
services or other advisory service in a merger or specific transaction in the normal course of business.
HSL or its analysts did not receive any compensation or other benefits from the companies mentioned in the report or third party in connection with
preparation of the research report. Accordingly, neither HSL nor Research Analysts have any material conflict of interest at the time of publication of this
report. Compensation of our Research Analysts is not based on any specific merchant banking, investment banking or brokerage service transactions. HSL may
have issued other reports that are inconsistent with and reach different conclusion from the information presented in this report.
Research entity has not been engaged in market making activity for the subject company. Research analyst has not served as an officer, director or employee of
the subject company. We have not received any compensation/benefits from the subject company or third party in connection with the Research Report.
HDFC securities Limited, I Think Techno Campus, Building - B, "Alpha", Office Floor 8, Near Kanjurmarg Station, Opp. Crompton Greaves, Kanjurmarg
(East), Mumbai 400 042 Phone: (022) 3075 3400 Fax: (022) 2496 5066 Compliance Officer: Binkle R. Oza Email: [email protected] Phone: (022)
3045 3600
HDFC Securities Limited, SEBI Reg. No.: NSE, BSE, MSEI, MCX: INZ000186937; AMFI Reg. No. ARN: 13549; PFRDA Reg. No. POP: 11092018; IRDA
Corporate Agent License No.: CA0062; SEBI Research Analyst Reg. No.: INH000002475; SEBI Investment Adviser Reg. No.: INA000011538; CIN -
U67120MH2000PLC152193
HDFC securities
Institutional Equities
Unit No. 1602, 16th Floor, Tower A, Peninsula Business Park,
Senapati Bapat Marg, Lower Parel, Mumbai - 400 013
Board: +91-22-6171-7330 www.hdfcsec.com