Embed Size (px)
Citation preview

the background. Then the chemist places the compound (sample) into the beam and obtains thespectrum resulting from the Fourier transform of the interferogram. This spectrum contains absorp-tion bands for both the compound and the background. The computer software automatically sub-tracts the spectrum of the background from the sample spectrum, yielding the spectrum of thecompound being analyzed. The subtracted spectrum is essentially identical to that obtained from atraditional double-beam dispersive instrument. See Section 2.22 for more detailed informationabout the background spectrum.
26 Infrared Spectroscopy
2.6 PREPARATION OF SAMPLES FOR INFRARED SPECTROSCOPY
To determine the infrared spectrum of a compound, one must place the compound in a sample holder,or cell. In infrared spectroscopy, this immediately poses a problem. Glass and plastics absorb stronglythroughout the infrared region of the spectrum. Cells must be constructed of ionic substances—typically sodium chloride or potassium bromide. Potassium bromide plates are more expensive thansodium chloride plates but have the advantage of usefulness in the range of 4000 to 400 cm−1. Sodiumchloride plates are used widely because of their relatively low cost. The practical range for their use inspectroscopy extends from 4000 to 650 cm−1. Sodium chloride begins to absorb at 650 cm−1, and anybands with frequencies less than this value will not be observed. Since few important bands appearbelow 650 cm−1, sodium chloride plates are in most common use for routine infrared spectroscopy.
Liquids. A drop of a liquid organic compound is placed between a pair of polished sodium chlorideor potassium bromide plates, referred to as salt plates. When the plates are squeezed gently, a thinliquid film forms between them. A spectrum determined by this method is referred to as a neatspectrum since no solvent is used. Salt plates break easily and are water soluble. Organic com-pounds analyzed by this technique must be free of water. The pair of plates is inserted into a holderthat fits into the spectrometer.
Solids. There are at least three common methods for preparing a solid sample for spectroscopy. Thefirst method involves mixing the finely ground solid sample with powdered potassium bromide andpressing the mixture under high pressure. Under pressure, the potassium bromide melts and sealsthe compound into a matrix. The result is a KBr pellet that can be inserted into a holder in the spec-trometer. The main disadvantage of this method is that potassium bromide absorbs water, whichmay interfere with the spectrum that is obtained. If a good pellet is prepared, the spectrum obtainedwill have no interfering bands since potassium bromide is transparent down to 400 cm−1.
The second method, a Nujol mull, involves grinding the compound with mineral oil (Nujol) to cre-ate a suspension of the finely ground sample dispersed in the mineral oil. The thick suspension is placedbetween salt plates. The main disadvantage of this method is that the mineral oil obscures bands thatmay be present in the analyzed compound. Nujol bands appear at 2924, 1462, and 1377 cm−1 (p. 32).
The third common method used with solids is to dissolve the organic compound in a solvent, mostcommonly carbon tetrachloride (CCl4). Again, as was the case with mineral oil, some regions of thespectrum are obscured by bands in the solvent. Although it is possible to cancel out the solvent fromthe spectrum by computer or instrumental techniques, the region around 785 cm−1 is often obscuredby the strong CICl stretch that occurs there.
2.7 WHAT TO LOOK FOR WHEN EXAMINING INFRARED SPECTRA
An infrared spectrometer determines the positions and relative sizes of all the absorptions, or peaks,in the infrared region and plots them on a piece of paper. This plot of absorption intensity versuswavenumber (or sometimes wavelength) is referred to as the infrared spectrum of the compound.
14782_02_Ch2_p015-104.pp2.qxd 1/25/08 10:27 AM Page 26

2.7 What to Look for When Examining Infrared Spectra 27
Figure 2.4 shows a typical infrared spectrum, that of 3-methyl-2-butanone. The spectrum exhibits atleast two strongly absorbing peaks at about 3000 and 1715 cm−1 for the CIH and CJO stretchingfrequencies, respectively.
The strong absorption at 1715 cm−1 that corresponds to the carbonyl group (CJO) is quite in-tense. In addition to the characteristic position of absorption, the shape and intensity of this peak arealso unique to the CJO bond. This is true for almost every type of absorption peak; both shape andintensity characteristics can be described, and these characteristics often enable the chemist to dis-tinguish the peak in potentially confusing situations. For instance, to some extent CJO and CJCbonds absorb in the same region of the infrared spectrum:
CJO 1850–1630 cm−1
CJC 1680–1620 cm−1
However, the CJO bond is a strong absorber, whereas the CJC bond generally absorbs onlyweakly (Fig. 2.5). Hence, trained observers would not interpret a strong peak at 1670 cm−1 to be aCJC double bond or a weak absorption at this frequency to be due to a carbonyl group.
The shape and fine structure of a peak often give clues to its identity as well. Thus, although theNIH and OIH regions overlap,
OIH 3650–3200 cm−1
NIH 3500–3300 cm−1
4000 3600 3200 2800 2400 2000 1800 1600 1400 1200 1000 800 600 400WAVENUMBERS (CM–1)
2.5 3 4 5 6 7 8 9 10 11 12 13 14 15 16 19 25100
90
80
70
60
50
40
30
20
10
0
MICRONS
% T
RA
NS
MIT
TAN
CE
CH3–C–CH–CH3
CH3
O
–– –
sp3 C–H stretchC O stretch––
F I G U R E 2 . 4 The infrared spectrum of 3-methyl-2-butanone (neat liquid, KBr plates).
MICRONS
100
90
80
70
60
50
40
30
20
10
0
% T
RA
NS
MIT
TAN
CE
WAVENUMBERS (CM–1)2000 1800 1600 1400 1200 1000
5 6 7 8 9 10
C O
––
C
––C
F I G U R E 2 . 5 A comparison of the intensities of the CJO and CJC absorption bands.
14782_02_Ch2_p015-104.pp2.qxd 1/25/08 10:27 AM Page 27

28 Infrared Spectroscopy
the NIH absorption usually has one or two sharp absorption bands of lower intensity, whereasOIH, when it is in the NIH region, usually gives a broad absorption peak. Also, primary aminesgive two absorptions in this region, whereas alcohols as pure liquids give only one (Fig. 2.6). Figure2.6 also shows typical patterns for the CIH stretching frequencies at about 3000 cm−1.
Therefore, while you study the sample spectra in the pages that follow, take notice of shapes andintensities. They are as important as the frequency at which an absorption occurs, and the eye mustbe trained to recognize these features. Often, when reading the literature of organic chemistry, youwill find absorptions referred to as strong (s), medium (m), weak (w), broad, or sharp. The author istrying to convey some idea of what the peak looks like without actually drawing the spectrum.
WAVENUMBERS (CM–1)
MICRONS
100
90
80
70
60
50
40
30
20
10
0
% T
RA
NS
MIT
TAN
CE
4000 3600 3200 2800 2400
2.5 3 4
C–H
O–H
WAVENUMBERS (CM–1)
MICRONS
100
90
80
70
60
50
40
30
20
10
0
% T
RA
NS
MIT
TAN
CE
4000 3600 3200 2800 2400
2.5 3 4
NH2
C–H
F I G U R E 2 . 6 A comparison of the shapes of the absorption bands for the OIH and NIH groups.
To extract structural information from infrared spectra, you must be familiar with the frequenciesat which various functional groups absorb. You may consult infrared correlation tables, whichprovide as much information as is known about where the various functional groups absorb. Thereferences listed at the end of this chapter contain extensive series of correlation tables. Sometimes,the absorption information is presented in the form of a chart called a correlation chart. Table 2.3is a simplified correlation table; a more detailed chart appears in Appendix 1.
The volume of data in Table 2.3 looks as though it may be difficult to assimilate. However, itis really quite easy if you start simply and then slowly increase your familiarity with and abilityto interpret the finer details of an infrared spectrum. You can do this most easily by first establish-ing the broad visual patterns of Figure 2.2 quite firmly in mind. Then, as a second step, memorizea “typical absorption value”—a single number that can be used as a pivotal value—for each of thefunctional groups in this pattern. For example, start with a simple aliphatic ketone as a model forall typical carbonyl compounds. The typical aliphatic ketone has a carbonyl absorption of about1715 ± 10 cm−1. Without worrying about the variation, memorize 1715 cm−1 as the base value forcarbonyl absorption. Then, more slowly, familiarize yourself with the extent of the carbonylrange and the visual pattern showing where the different kinds of carbonyl groups appearthroughout this region. See, for instance, Section 2.14 (p. 52), which gives typical values for thevarious types of carbonyl compounds. Also, learn how factors such as ring strain and conjugationaffect the base values (i.e., in which direction the values are shifted). Learn the trends, alwayskeeping the memorized base value (1715 cm−1) in mind. As a beginning, it might prove usefulto memorize the base values for this approach given in Table 2.4. Notice that there are only eightof them.
2.8 CORRELATION CHARTS AND TABLES
14782_02_Ch2_p015-104.pp2.qxd 1/25/08 10:27 AM Page 28

TA B L E 2 . 3A SIMPLIFIED CORRELATION CHART
Type of Vibration Frequency Intensity Page(cm–1) Reference
CIH Alkanes (stretch) 3000–2850 s 31
ICH3 (bend) 1450 and 1375 m
ICH2I (bend) 1465 m
Alkenes (stretch) 3100–3000 m 33
(out-of-plane bend) 1000–650 s
Aromatics (stretch) 3150–3050 s 43
(out-of-plane bend) 900–690 s
Alkyne (stretch) ca. 3300 s 35
Aldehyde 2900–2800 w 56
2800–2700 w
CIC Alkane Not interpretatively useful
CJC Alkene 1680–1600 m–w 33
Aromatic 1600 and 1475 m–w 43
CKC Alkyne 2250–2100 m–w 35
CJO Aldehyde 1740–1720 s 56
Ketone 1725–1705 s 58
Carboxylic acid 1725–1700 s 62
Ester 1750–1730 s 64
Amide 1680–1630 s 70
Anhydride 1810 and 1760 s 73
Acid chloride 1800 s 72
CIO Alcohols, ethers, esters, carboxylic acids, anhydrides 1300–1000 s 47, 50,62, 64,and 73
OIH Alcohols, phenols
Free 3650–3600 m 47
H-bonded 3400–3200 m 47
Carboxylic acids 3400–2400 m 62
NIH Primary and secondary amines and amides
(stretch) 3500–3100 m 74
(bend) 1640–1550 m–s 74
CIN Amines 1350–1000 m–s 74
CJN Imines and oximes 1690–1640 w–s 77
CKN Nitriles 2260–2240 m 77
XJCJY Allenes, ketenes, isocyanates, isothiocyanates 2270–1940 m–s 77
NJO Nitro (RINO2) 1550 and 1350 s 79
SIH Mercaptans 2550 w 81
SJO Sulfoxides 1050 s 81
Sulfones, sulfonyl chlorides, sulfates, sulfonamides 1375–1300 and s 821350–1140
CIX Fluoride 1400–1000 s 85
Chloride 785–540 s 85
Bromide, iodide < 667 s 85
14782_02_Ch2_p015-104.pp2.qxd 1/25/08 10:27 AM Page 29

TA B L E 2 . 4BASE VALUES FOR ABSORPTIONS OF BONDS
OIH 3400 cm−1 CKC 2150 cm−1
NIH 3400 CJO 1715
CIH 3000 CJC 1650
CKN 2250 CIO 1100
2.9 HOW TO APPROACH THE ANALYSIS OF A SPECTRUM (OR WHAT YOU CANTELL AT A GLANCE)
When analyzing the spectrum of an unknown, concentrate your first efforts on determining thepresence (or absence) of a few major functional groups. The CJO, OIH, NIH, CIO, CJC,CKC, CKN, and NO2 peaks are the most conspicuous and give immediate structural information ifthey are present. Do not try to make a detailed analysis of the CIH absorptions near 3000 cm−1;almost all compounds have these absorptions. Do not worry about subtleties of the exact environ-ment in which the functional group is found. Following is a major checklist of the important grossfeatures.
1. Is a carbonyl group present? The CJO group gives rise to a strong absorption in the region1820–1660 cm−1. The peak is often the strongest in the spectrum and of medium width. Youcan’t miss it.
2. If CJO is present, check the following types (if it is absent, go to step 3):
ACIDS Is OIH also present?
• Broad absorption near 3400–2400 cm−1 (usually overlapsCIH).
AMIDES Is NIH also present?
• Medium absorption near 3400 cm−1; sometimes a doublepeak with equivalent halves.
ESTERS Is CIO also present?
• Strong-intensity absorptions near 1300–1000 cm−1.
ANHYDRIDES Two CJO absorptions near 1810 and 1760 cm−1.
ALDEHYDES Is aldehyde CIH present?
• Two weak absorptions near 2850 and 2750 cm−1 on rightside of the aliphatic CIH absorptions.
KETONES The preceding five choices have been eliminated.
3. If CJO is absent:
ALCOHOLS, PHENOLS Check for OIH.
• Broad absorption near 3400–3300 cm−1.
• Confirm this by finding CIO near 1300–1000 cm−1.
AMINES Check for NIH.
• Medium absorption(s) near 3400 cm−1.
ETHERS Check for CIO near 1300–1000 cm−1 (and absence ofOIH near 3400 cm−1).
30 Infrared Spectroscopy
14782_02_Ch2_p015-104.pp2.qxd 1/25/08 10:27 AM Page 30

4. Double bonds and/or aromatic rings
• CJC is a weak absorption near 1650 cm.
• Medium-to-strong absorptions in the region 1600–1450 cm−1; these often imply an aromatic ring.
• Confirm the double bond or aromatic ring by consulting theCIH region; aromatic and vinyl CIH occur to the left of3000 cm−1 (aliphatic CIH occurs to the right of this value).
5. Triple bonds
• CKN is a medium, sharp absorption near 2250 cm−1.
• CKC is a weak, sharp absorption near 2150 cm−1.
• Check also for acetylenic CIH near 3300 cm−1.
6. Nitro groups
• Two strong absorptions at 1600–1530 cm−1 and1390–1300 cm−1.
7. Hydrocarbons
• None of the preceding is found.
• Major absorptions are in CIH region near 3000−1.
• Very simple spectrum; the only other absorptions appearnear 1460 and 1375 cm−1.
The beginning student should resist the idea of trying to assign or interpret every peak in thespectrum. You simply will not be able to do it. Concentrate first on learning these major peaks andrecognizing their presence or absence. This is best done by carefully studying the illustrative spectrain the sections that follow.
A SURVEY OF THE IMPORTANT FUNCTIONAL GROUPS, WITH EXAMPLES
The following sections describe the behaviors of important functional groups toward infrared radiation.These sections are organized as follows:
1. The basic information about the functional group or type of vibration is abstracted andplaced in a Spectral Analysis Box, where it may be consulted easily.
2. Examples of spectra follow the basic section. The major absorptions of diagnostic value areindicated on each spectrum.
3. Following the spectral examples, a discussion section provides details about the functionalgroups and other information that may be of use in identifying organic compounds.
2.10 HYDROCARBONS: ALKANES, ALKENES, AND ALKYNES
Alkanes show very few absorption bands in the infrared spectrum. They yield four or more CIHstretching peaks near 3000 cm−1 plus CH2 and CH3 bending peaks in the range 1475–1365 cm−1.
A. Alkanes
2.10 Hydrocarbons: Alkanes, Alkenes, and Alkynes 31
14782_02_Ch2_p015-104.pp2.qxd 1/25/08 10:27 AM Page 31

32 Infrared Spectroscopy
S P E C T R A L A N A L Y S I S B O X
ALKANES
The spectrum is usually simple, with few peaks.
CIH Stretch occurs around 3000 cm−1.
In alkanes (except strained ring compounds), sp3 CIH absorption always occurs atfrequencies less than 3000 cm−1 (3000–2840 cm−1).
If a compound has vinylic, aromatic, acetylenic, or cyclopropyl hydrogens, the CIHabsorption is greater than 3000 cm−1. These compounds have sp2 and sp hybridizations(see Sections 2.10B and 2.10C).
CH2 Methylene groups have a characteristic bending absorption of approximately 1465 cm−1.
CH3 Methyl groups have a characteristic bending absorption of approximately 1375 cm−1.
CH2 The bending (rocking) motion associated with four or more CH2 groups in an openchain occurs at about 720 cm−1 (called a long-chain band).
CIC Stretch not interpretatively useful; many weak peaks.
Examples: decane (Fig. 2.7), mineral oil (Fig. 2.8), and cyclohexane (Fig. 2.9).
4000 3600 3200 2800 2400 2000 1800 1600 1400 1200 1000 800 600 400WAVENUMBERS (CM–1)
2.5 3 4 5 6 7 8 9 10 11 12 13 14 15 16 19 25100
90
80
70
60
50
40
30
20
10
0
MICRONS
% T
RA
NS
MIT
TAN
CE
CH3 bend
CH2 bend
long-chainband
sp3 C–H stretch
Nujol(mineral oil)
F I G U R E 2 . 8 The infrared spectrum of mineral oil (neat liquid, KBr plates).
4000 3600 3200 2800 2400 2000 1800 1600 1400 1200 1000 800 600 400WAVENUMBERS (CM–1)
2.5 3 4 5 6 7 8 9 10 11 12 13 14 15 16 19 25100
90
80
70
60
50
40
30
20
10
0
MICRONS
% T
RA
NS
MIT
TAN
CE
CH3(CH2)8CH3CH3 bend
CH2 bend
long-chainband
sp3 C–H stretch
F I G U R E 2 . 7 The infrared spectrum of decane (neat liquid, KBr plates).
14782_02_Ch2_p015-104.pp2.qxd 1/25/08 10:27 AM Page 32

2.10 Hydrocarbons: Alkanes, Alkenes, and Alkynes 33
B. Alkenes
Alkenes show many more peaks than alkanes. The principal peaks of diagnostic value are the CIHstretching peaks for the sp2 carbon at values greater than 3000 cm−1, along with CIH peaks for thesp3 carbon atoms appearing below that value. Also prominent are the out-of-plane bending peaksthat appear in the range 1000–650 cm−1. For unsymmetrical compounds, you should expect to seethe CJC stretching peak near 1650 cm−1.
4000 3600 3200 2800 2400 2000 1800 1600 1400 1200 1000 800 600 400WAVENUMBERS (CM–1)
2.5 3 4 5 6 7 8 9 10 11 12 13 14 15 16 19 25100
90
80
70
60
50
40
30
20
10
0
MICRONS
% T
RA
NS
MIT
TAN
CE
CH2 bend
sp3 C–H stretch
no long-chainband
F I G U R E 2 . 9 The infrared spectrum of cyclohexane (neat liquid, KBr plates).
S P E C T R A L A N A L Y S I S B O X
ALKENES
JCIH Stretch for sp2 CIH occurs at values greater than 3000 cm−1 (3095–3010 cm−1).
JCIH Out-of-plane (oop) bending occurs in the range 1000–650 cm−1.
These bands can be used to determine the degree of substitution on the double bond (see discussion).
CJC Stretch occurs at 1660–1600 cm−1; conjugation moves CJC stretch to lower fre-quencies and increases the intensity.
Symmetrically substituted bonds (e.g., 2,3-dimethyl-2-butene) do not absorb in theinfrared (no dipole change).
Symmetrically disubstituted (trans) double bonds are often vanishingly weak inabsorption; cis are stronger.
Examples: 1-hexene (Fig. 2.10), cyclohexene (Fig. 2.11), cis-2-pentene (Fig. 2.12), and trans-2-pentene (Fig. 2.13).
14782_02_Ch2_p015-104.pp2.qxd 1/25/08 10:27 AM Page 33
4000 3600 3200 2800 2400 2000 1800 1600 1400 1200 1000 800 600 400WAVENUMBERS (CM–1)
2.5 3 4 5 6 7 8 9 10 11 12 13 14 15 16 19 25100
90
80
70
60
50
40
30
20
10
0
MICRONS
% T
RA
NS
MIT
TAN
CE
sp2
C–Hstretch vinyl oop
overtoneof 910 cm–1
C C––(CH2)3CH3
––––
H H
H
sp3 C–Hstretch
C C stretch
––
F I G U R E 2 . 1 0 The infrared spectrum of 1-hexene (neat liquid, KBr plates).
4000 3600 3200 2800 2400 2000 1800 1600 1400 1200 1000 800 600 400WAVENUMBERS (CM–1)
2.5 3 4 5 6 7 8 9 10 11 12 13 14 15 16 19 25100
90
80
70
60
50
40
30
20
10
0
MICRONS
% T
RA
NS
MIT
TAN
CE
CH2bend
sp2 C–Hstretch
sp3 C–Hstretch
cisoop
cis C Cstretch
––
F I G U R E 2 . 1 1 The infrared spectrum of cyclohexene (neat liquid, KBr plates).
4000 3600 3200 2800 2400 2000 1800 1600 1400 1200 1000 800 600 400WAVENUMBERS (CM–1)
2.5 3 4 5 6 7 8 9 10 11 12 13 14 15 16 19 25100
90
80
70
60
50
40
30
20
10
0
MICRONS
% T
RA
NS
MIT
TAN
CE
cis oop
cis C Cstretch
––
C C–– ––––
CH3
H
CH2CH3
H
sp2 C–Hstretch
sp3 C–Hstretch
F I G U R E 2 . 1 2 The infrared spectrum of cis-2-pentene (neat liquid, KBr plates).
14782_02_Ch2_p015-104.pp2.qxd 1/25/08 10:27 AM Page 34
2.10 Hydrocarbons: Alkanes, Alkenes, and Alkynes 35
4000 3600 3200 2800 2400 2000 1800 1600 1400 1200 1000 800 600 400WAVENUMBERS (CM–1)
2.5 3 4 5 6 7 8 9 10 11 12 13 14 15 16 19 25100
90
80
70
60
50
40
30
20
10
0
MICRONS
% T
RA
NS
MIT
TAN
CE
C C––CH2CH3
––––
CH3 H
H
trans oopsp3 C–Hstretch
sp2 C–Hstretch
VeryweaktransC C
stretch
–––
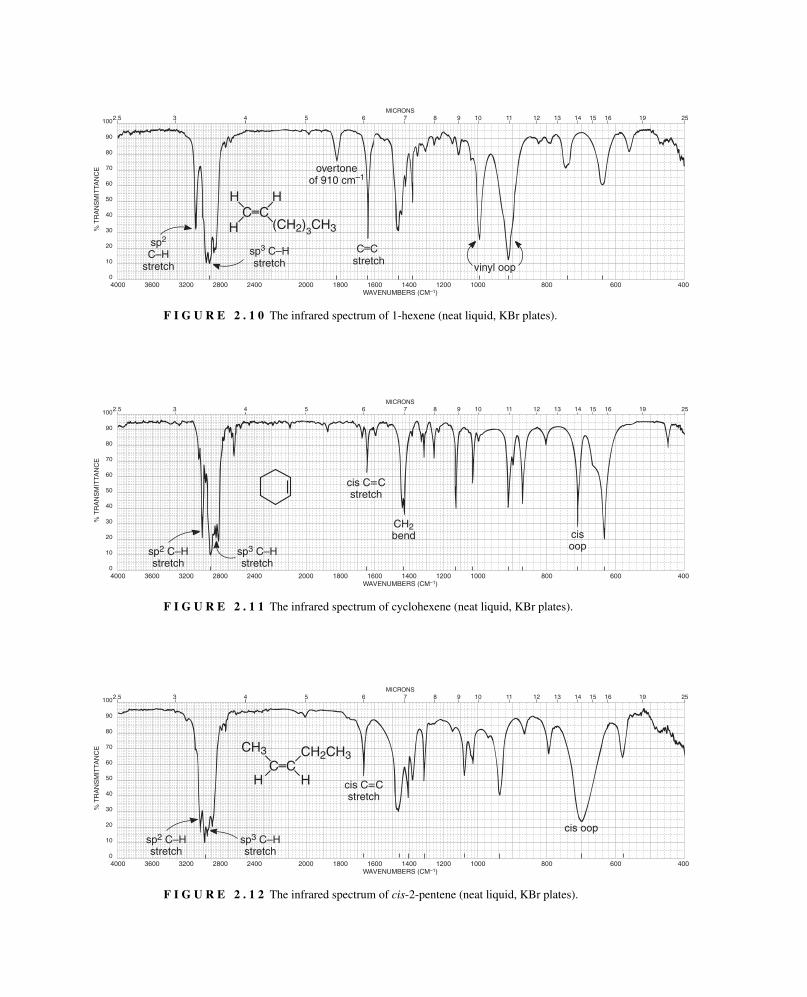
F I G U R E 2 . 1 3 The infrared spectrum of trans-2-pentene (neat liquid, KBr plates).
Terminal alkynes will show a prominent peak at about 3300 cm−1 for the sp-hybridized CIH. ACKC will also be a prominent feature in the spectrum for the terminal alkyne, appearing at about2150 cm−1. The alkyl chain will show CIH stretching frequencies for the sp3 carbon atoms. Otherfeatures include the bending bands for CH2 and CH3 groups. Nonterminal alkynes will not show theCIH band at 3300 cm−1. The CKC at 2150 cm−1 will be very weak or absent from the spectrum.
C. Alkynes
S P E C T R A L A N A L Y S I S B O X
ALKYNES
KCIH Stretch for sp CIH usually occurs near 3300 cm−1.
CKC Stretch occurs near 2150 cm−1; conjugation moves stretch to lower frequency.Disubstituted or symmetrically substituted triple bonds give either no absorptionor weak absorption.
Examples: 1-octyne (Fig. 2.14) and 4-octyne (Fig. 2.15).
4000 3600 3200 2800 2400 2000 1800 1600 1400 1200 1000 800 600 400WAVENUMBERS (CM–1)
2.5 3 4 5 6 7 8 9 10 11 12 13 14 15 16 19 25100
90
80
70
60
50
40
30
20
10
0
MICRONS
% T
RA
NS
MIT
TAN
CE
H–C C(CH2)5CH3–––sp C–Hstretch sp3 C–H stretch
C C stretch
C–H bend
–––
–––
F I G U R E 2 . 1 4 The infrared spectrum of 1-octyne (neat liquid, KBr plates).
14782_02_Ch2_p015-104.pp2.qxd 1/25/08 10:27 AM Page 35
36 Infrared Spectroscopy
4000 3600 3200 2800 2400 2000 1800 1600 1400 1200 1000 800 600 400WAVENUMBERS (CM–1)
2.5 3 4 5 6 7 8 9 10 11 12 13 14 15 16 19 25100
90
80
70
60
50
40
30
20
10
0
MICRONS
% T
RA
NS
MIT
TAN
CE
CH3CH2CH2–C C–CH2CH2CH3–––
No C Cstretch
sp3 C–Hstretch
–––
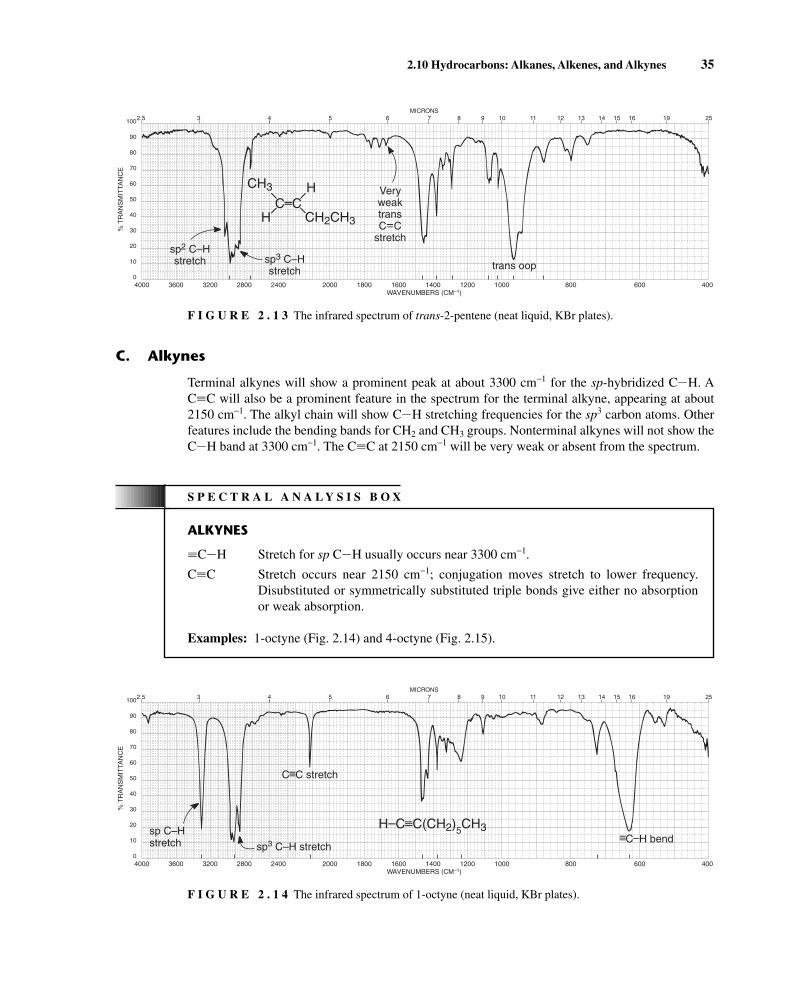
F I G U R E 2 . 1 5 The infrared spectrum of 4-octyne (neat liquid, KBr plates).
D I S C U S S I O N S E C T I O N
CIH Stretch Region
The CIH stretching and bending regions are two of the most difficult regions to interpret in infraredspectra. The CIH stretching region, which ranges from 3300 to 2750 cm−1, is generally the moreuseful of the two. As discussed in Section 2.4, the frequency of the absorption of CIH bonds isa function mostly of the type of hybridization that is attributed to the bond. The sp-1s CIH bondpresent in acetylenic compounds is stronger than the sp2-1s bond present in CJC double-bond com-pounds (vinyl compounds). This strength results in a larger vibrational force constant and a higherfrequency of vibration. Likewise, the sp2-1s CIH absorption in vinyl compounds occurs at a higherfrequency than the sp3-1s CIH absorption in saturated aliphatic compounds. Table 2.5 gives somephysical constants for various CIH bonds involving sp-, sp2-, and sp3-hybridized carbon.
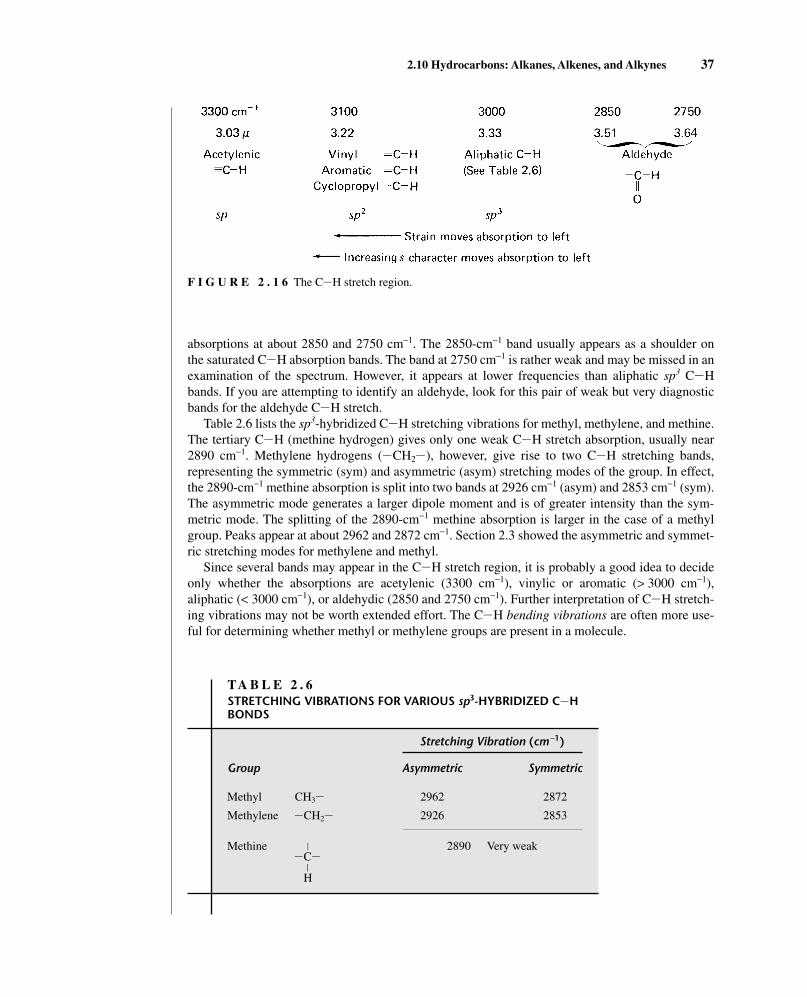
As Table 2.5 demonstrates, the frequency at which the CIH absorption occurs indicates the typeof carbon to which the hydrogen is attached. Figure 2.16 shows the entire CIH stretching region.Except for the aldehyde hydrogen, an absorption frequency of less than 3000 cm−1 usually implies asaturated compound (only sp3-1s hydrogens). An absorption frequency higher than 3000 cm−1 butnot above about 3150 cm−1 usually implies aromatic or vinyl hydrogens. However, cyclopropylCIH bonds, which have extra s character because of the need to put more p character into the ringCIC bonds to reduce angle distortion, also give rise to absorption in the region of 3100 cm−1.Cyclopropyl hydrogens can easily be distinguished from aromatic hydrogens or vinyl hydrogensby cross-reference to the CJC and CIH out-of-plane regions. The aldehyde CIH stretch appearsat lower frequencies than the saturated CIH absorptions and normally consists of two weak
TA B L E 2 . 5PHYSICAL CONSTANTS FOR sp-, sp2-, AND sp3-HYBRIDIZEDCARBON AND THE RESULTING CIH ABSORPTION VALUES
Bond KCIH JCIH ICIH
Type sp-1s sp2-1s sp3-1s
Length 1.08 Å 1.10 Å 1.12 Å
Strength 506 kJ 444 kJ 422 kJ
IR frequency 3300 cm−1 ∼3100 cm−1 ∼2900 cm−1
14782_02_Ch2_p015-104.pp2.qxd 1/25/08 10:27 AM Page 36
2.10 Hydrocarbons: Alkanes, Alkenes, and Alkynes 37
absorptions at about 2850 and 2750 cm−1. The 2850-cm−1 band usually appears as a shoulder onthe saturated CIH absorption bands. The band at 2750 cm−1 is rather weak and may be missed in anexamination of the spectrum. However, it appears at lower frequencies than aliphatic sp3 CIHbands. If you are attempting to identify an aldehyde, look for this pair of weak but very diagnosticbands for the aldehyde CIH stretch.
Table 2.6 lists the sp3-hybridized CIH stretching vibrations for methyl, methylene, and methine.The tertiary CIH (methine hydrogen) gives only one weak CIH stretch absorption, usually near2890 cm−1. Methylene hydrogens (ICH2I), however, give rise to two CIH stretching bands,representing the symmetric (sym) and asymmetric (asym) stretching modes of the group. In effect,the 2890-cm−1 methine absorption is split into two bands at 2926 cm−1 (asym) and 2853 cm−1 (sym).The asymmetric mode generates a larger dipole moment and is of greater intensity than the sym-metric mode. The splitting of the 2890-cm−1 methine absorption is larger in the case of a methylgroup. Peaks appear at about 2962 and 2872 cm−1. Section 2.3 showed the asymmetric and symmet-ric stretching modes for methylene and methyl.
Since several bands may appear in the CIH stretch region, it is probably a good idea to decideonly whether the absorptions are acetylenic (3300 cm−1), vinylic or aromatic (> 3000 cm−1),aliphatic (< 3000 cm−1), or aldehydic (2850 and 2750 cm−1). Further interpretation of CIH stretch-ing vibrations may not be worth extended effort. The CIH bending vibrations are often more use-ful for determining whether methyl or methylene groups are present in a molecule.
F I G U R E 2 . 1 6 The CIH stretch region.
TA B L E 2 . 6STRETCHING VIBRATIONS FOR VARIOUS sp3-HYBRIDIZED CIHBONDS
Stretching Vibration (cm−1)
Group Asymmetric Symmetric
Methyl CH3I 2962 2872
Methylene ICH2I 2926 2853
Methine L 2890 Very weakICIL
H
14782_02_Ch2_p015-104.pp2.qxd 1/25/08 10:27 AM Page 37

38 Infrared Spectroscopy
CIH Bending Vibrations for Methyl and Methylene
The presence of methyl and methylene groups, when not obscured by other absorptions, may bedetermined by analyzing the region from 1465 to 1370 cm−1. As shown in Figure 2.17, the band dueto CH2 scissoring usually occurs at 1465 cm−1. One of the bending modes for CH3 usually absorbsstrongly near 1375 cm−1. These two bands can often be used to detect methylene and methyl groups,respectively. Furthermore, the 1375-cm−1 methyl band is usually split into two peaks of nearly equalintensity (symmetric and asymmetric modes) if a geminal dimethyl group is present. This doublet isoften observed in compounds with isopropyl groups. A tert-butyl group results in an even widersplitting of the 1375-cm−1 band into two peaks. The 1370-cm−1 band is more intense than the 1390-cm−1 one. Figure 2.18 shows the expected patterns for the isopropyl and tert-butyl groups. Note thatsome variation from these idealized patterns may occur. Nuclear magnetic resonance spectroscopymay be used to confirm the presence of these groups. In cyclic hydrocarbons, which do not have at-tached methyl groups, the 1375-cm−1 band is missing, as can be seen in the spectrum of cyclo-hexane (Fig. 2.9). Finally, a rocking band (Section 2.3) appears near 720 cm−1 for long-chainalkanes of four carbons or more (see Fig. 2.7).
CJC Stretching Vibrations
Simple Alkyl-Substituted Alkenes. The CJC stretching frequency usually appears between 1670and 1640 cm−1 for simple noncyclic (acyclic) alkenes. The CJC frequencies increase as alkylgroups are added to a double bond. For example, simple monosubstituted alkenes yield values near1640 cm−1, 1,1-disubstituted alkenes absorb at about 1650 cm−1, and tri- and tetrasubstitutedalkenes absorb near 1670 cm−1. Trans-Disubstituted alkenes absorb at higher frequencies (1670 cm−1)
1500 1400 1300
CH3–C–
CH3
CH3––
(CM–1)1500 1400 1300
(CM–1)
CH––CH3
CH3–
F I G U R E 2 . 1 8 CIH bending patterns for the isopropyl and tert-butyl groups.
F I G U R E 2 . 1 7 The CIH bending vibrations for methyl and methylene groups.
14782_02_Ch2_p015-104.pp2.qxd 1/25/08 10:27 AM Page 38

2.10 Hydrocarbons: Alkanes, Alkenes, and Alkynes 39
than cis-disubstituted alkenes (1658 cm−1). Unfortunately, the CJC group has a rather weak inten-sity, certainly much weaker than a typical CJO group. In many cases, such as in tetrasubstitutedalkenes, the double bond absorption may be so weak that it is not observed at all. Recall fromSection 2.1 that if the attached groups are arranged symmetrically, no change in dipole moment oc-curs during stretching, and hence no infrared absorption is observed. Cis-Alkenes, which have lesssymmetry than trans-alkenes, generally absorb more strongly than the latter. Double bonds in rings,because they are often symmetric or nearly so, absorb more weakly than those not contained inrings. Terminal double bonds in monosubstituted alkenes generally have stronger absorption.
Conjugation Effects. Conjugation of a CJC double bond with either a carbonyl group or anotherdouble bond provides the multiple bond with more single-bond character (through resonance, as thefollowing example shows), a lower force constant K, and thus a lower frequency of vibration. Forexample, the vinyl double bond in styrene gives an absorption at 1630 cm−1.
With several double bonds, the number of CJC absorptions often corresponds to the number ofconjugated double bonds. An example of this correspondence is found in 1,3-pentadiene, whereabsorptions are observed at 1600 and 1650 cm−1. In the exception to the rule, butadiene gives onlyone band near 1600 cm−1. If the double bond is conjugated with a carbonyl group, the CJC absorp-tion shifts to a lower frequency and is also intensified by the strong dipole of the carbonyl group.Often, two closely spaced CJC absorption peaks are observed for these conjugated systems, result-ing from two possible conformations.
Ring-Size Effects with Internal Double Bonds. The absorption frequency of internal (endo)double bonds in cyclic compounds is very sensitive to ring size. As shown in Figure 2.19, theabsorption frequency decreases as the internal angle decreases, until it reaches a minimum at 90°in cyclobutene. The frequency increases again for cyclopropene when the angle drops to 60°.This initially unexpected increase in frequency occurs because the CJC vibration in cyclo-propene is strongly coupled to the attached CIC single-bond vibration. When the attached CICbonds are perpendicular to the CJC axis, as in cyclobutene, their vibrational mode is orthogonalto that of the CJC bond (i.e., on a different axis) and does not couple. When the angle is greaterthan 90° (120° in the following example), the CIC single-bond stretching vibration can beresolved into two components, one of which is coincident with the direction of the CJC stretch.In the diagram, components a and b of the CIC stretching vector are shown. Since component ais in line with the CJC stretching vector, the CIC and CJC bonds are coupled, leading to ahigher frequency of absorption. A similar pattern exists for cyclopropene, which has an angle lessthan 90°.
C CC C+ –
C CC C
C
CC C
C
C
a
b
120°90°
14782_02_Ch2_p015-104.pp2.qxd 1/25/08 10:27 AM Page 39

40 Infrared Spectroscopy
Significant increases in the frequency of the absorption of a double bond contained in a ringare observed when one or two alkyl groups are attached directly to the double bond. The increasesare most dramatic for small rings, especially cyclopropenes. For example, Figure 2.20 shows thatthe base value of 1656 cm−1 for cyclopropene increases to about 1788 cm−1 when one alkyl groupis attached to the double bond; with two alkyl groups the value increases to about 1883 cm−1.
1656 cm–1
1675 cm–1
R
R
1641 cm–1
R
1566 cm–1
1788 cm–1R
1883 cm–1R R
1679 cm–1
R
R
1681 cm–1
R
R
1675 cm–1
R
1650 cm–1
R
1611 cm–1
1646 cm–1F I G U R E 2 . 2 0 The effect of alkyl substitutionon the frequency of a CJC bond in a ring.
F I G U R E 2 . 1 9 CJC stretching vibrations in endocyclic systems.
14782_02_Ch2_p015-104.pp2.qxd 1/25/08 10:27 AM Page 40
2.10 Hydrocarbons: Alkanes, Alkenes, and Alkynes 41
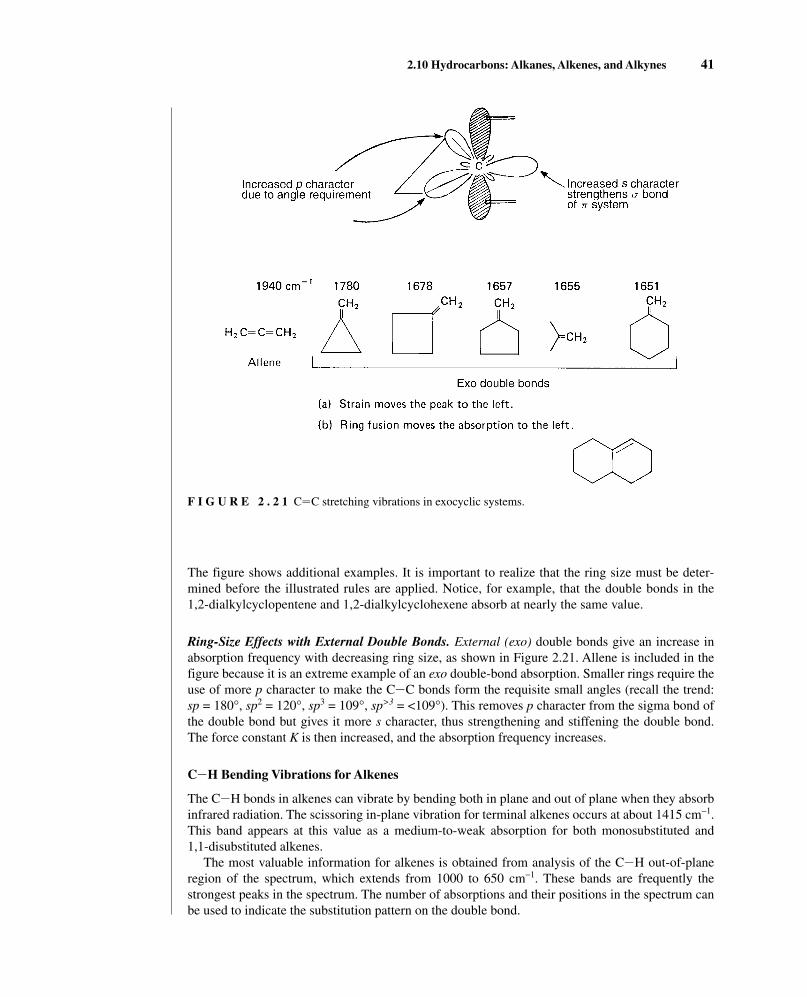
The figure shows additional examples. It is important to realize that the ring size must be deter-mined before the illustrated rules are applied. Notice, for example, that the double bonds in the1,2-dialkylcyclopentene and 1,2-dialkylcyclohexene absorb at nearly the same value.
Ring-Size Effects with External Double Bonds. External (exo) double bonds give an increase inabsorption frequency with decreasing ring size, as shown in Figure 2.21. Allene is included in thefigure because it is an extreme example of an exo double-bond absorption. Smaller rings require theuse of more p character to make the CIC bonds form the requisite small angles (recall the trend:sp = 180°, sp2 = 120°, sp3 = 109°, sp>3 = <109°). This removes p character from the sigma bond ofthe double bond but gives it more s character, thus strengthening and stiffening the double bond.The force constant K is then increased, and the absorption frequency increases.
CIH Bending Vibrations for Alkenes
The CIH bonds in alkenes can vibrate by bending both in plane and out of plane when they absorbinfrared radiation. The scissoring in-plane vibration for terminal alkenes occurs at about 1415 cm−1.This band appears at this value as a medium-to-weak absorption for both monosubstituted and 1,1-disubstituted alkenes.
The most valuable information for alkenes is obtained from analysis of the CIH out-of-planeregion of the spectrum, which extends from 1000 to 650 cm−1. These bands are frequently thestrongest peaks in the spectrum. The number of absorptions and their positions in the spectrum canbe used to indicate the substitution pattern on the double bond.
F I G U R E 2 . 2 1 CJC stretching vibrations in exocyclic systems.
14782_02_Ch2_p015-104.pp2.qxd 1/25/08 10:27 AM Page 41
42 Infrared Spectroscopy
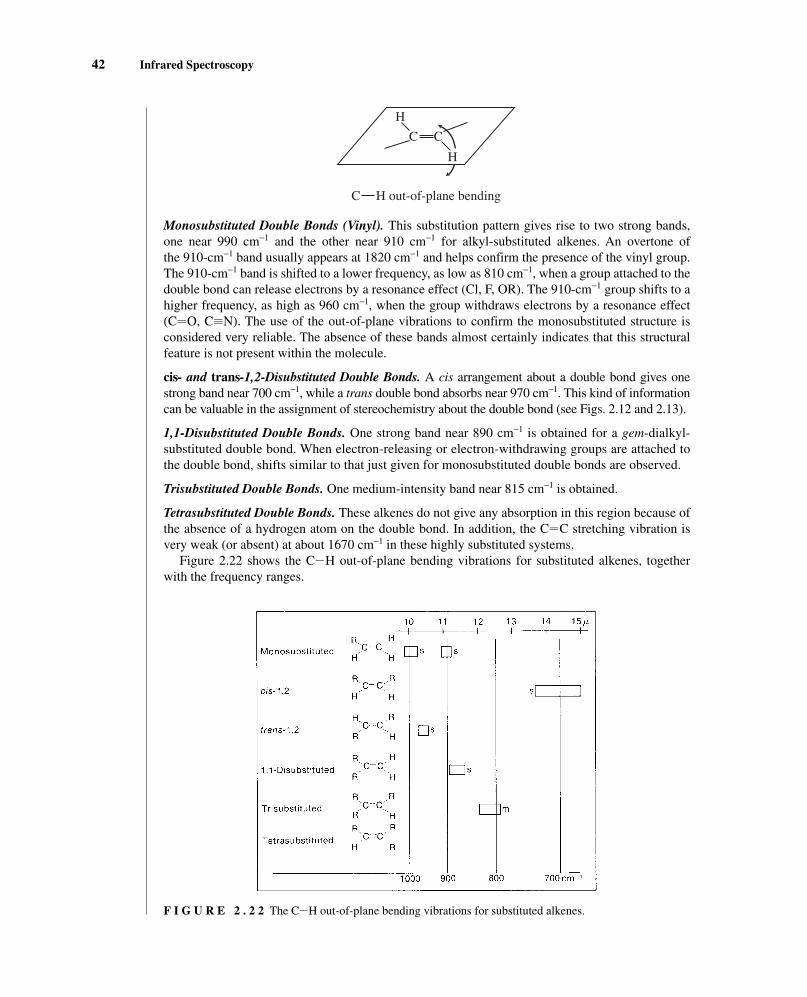
Monosubstituted Double Bonds (Vinyl). This substitution pattern gives rise to two strong bands,one near 990 cm−1 and the other near 910 cm−1 for alkyl-substituted alkenes. An overtone ofthe 910-cm−1 band usually appears at 1820 cm−1 and helps confirm the presence of the vinyl group.The 910-cm−1 band is shifted to a lower frequency, as low as 810 cm−1, when a group attached to thedouble bond can release electrons by a resonance effect (Cl, F, OR). The 910-cm−1 group shifts to ahigher frequency, as high as 960 cm−1, when the group withdraws electrons by a resonance effect(CJO, CKN). The use of the out-of-plane vibrations to confirm the monosubstituted structure isconsidered very reliable. The absence of these bands almost certainly indicates that this structuralfeature is not present within the molecule.
cis- and trans-1,2-Disubstituted Double Bonds. A cis arrangement about a double bond gives onestrong band near 700 cm−1, while a trans double bond absorbs near 970 cm−1. This kind of informationcan be valuable in the assignment of stereochemistry about the double bond (see Figs. 2.12 and 2.13).
1,1-Disubstituted Double Bonds. One strong band near 890 cm−1 is obtained for a gem-dialkyl-substituted double bond. When electron-releasing or electron-withdrawing groups are attached tothe double bond, shifts similar to that just given for monosubstituted double bonds are observed.
Trisubstituted Double Bonds. One medium-intensity band near 815 cm−1 is obtained.
Tetrasubstituted Double Bonds. These alkenes do not give any absorption in this region because ofthe absence of a hydrogen atom on the double bond. In addition, the CJC stretching vibration isvery weak (or absent) at about 1670 cm−1 in these highly substituted systems.
Figure 2.22 shows the CIH out-of-plane bending vibrations for substituted alkenes, togetherwith the frequency ranges.
C
C
C
H
H
H out-of-plane bending
F I G U R E 2 . 2 2 The CIH out-of-plane bending vibrations for substituted alkenes.
14782_02_Ch2_p015-104.pp2.qxd 1/25/08 10:27 AM Page 42

2.11 Aromatic Rings 43
2.11 AROMATIC RINGS
Aromatic compounds show a number of absorption bands in the infrared spectrum, many of whichare not of diagnostic value. The CIH stretching peaks for the sp2 carbon appear at values greaterthan 3000 cm−1. Since CIH stretching bands for alkenes appear in the same range, it may be difficultto use the CIH stretching bands to differentiate between alkenes and aromatic compounds.However, the CJC stretching bands for aromatic rings usually appear between 1600 and 1450 cm−1
outside the usual range where the CJC appears for alkenes (1650 cm−1). Also prominent are the out-of-plane bending peaks that appear in the range 900–690 cm−1, which, along with weak overtonebands at 2000–1667 cm−1, can be used to assign substitution on the ring.
S P E C T R A L A N A L Y S I S B O X
AROMATIC RINGS
JCIH Stretch for sp2 CIH occurs at values greater than 3000 cm−1 (3050–3010 cm−1).
JCIH Out-of-plane (oop) bending occurs at 900–690 cm−1. These bands can be used withgreat utility to assign the ring substitution pattern (see discussion).
CJC Ring stretch absorptions often occur in pairs at 1600 cm−1 and 1475 cm−1.
Overtone/combination bands appear between 2000 and 1667 cm−1. These weak absorptions canbe used to assign the ring substitution pattern (see discussion).
Examples: toluene (Fig. 2.23), ortho-diethylbenzene (Fig. 2.24), meta-diethylbenzene (Fig.2.25), para-diethylbenzene (Fig. 2.26), and styrene (Fig. 2.27).
4000 3600 3200 2800 2400 2000 1800 1600 1400 1200 1000 800 600 400WAVENUMBERS (CM–1)
2.5 3 4 5 6 7 8 9 10 11 12 13 14 15 16 19 25100
90
80
70
60
50
40
30
20
10
0
MICRONS
% T
RA
NS
MIT
TAN
CE
CH3
mono subst.oop
mono subst.
aromatic C C stretch
sp2C–Hstretch sp3C–H
stretch––
F I G U R E 2 . 2 3 The infrared spectrum of toluene (neat liquid, KBr plates).
14782_02_Ch2_p015-104.pp2.qxd 1/25/08 10:27 AM Page 43

4000 3600 3200 2800 2400 2000 1800 1600 1400 1200 1000 800 600 400WAVENUMBERS (CM–1)
2.5 3 4 5 6 7 8 9 10 11 12 13 14 15 16 19 25100
90
80
70
60
50
40
30
20
10
0
MICRONS
% T
RA
NS
MIT
TAN
CE
CH2CH3CH2CH3
ortho subst.oop
orthosubst.
sp3 C–Hstretch
sp2 C–Hstretch
aromaticC C stretch––
F I G U R E 2 . 2 4 The infrared spectrum of ortho-diethylbenzene (neat liquid, KBr plates).
4000 3600 3200 2800 2400 2000 1800 1600 1400 1200 1000 800 600 400WAVENUMBERS (CM–1)
2.5 3 4 5 6 7 8 9 10 11 12 13 14 15 16 19 25100
90
80
70
60
50
40
30
20
10
0
MICRONS
% T
RA
NS
MIT
TAN
CE
meta subst. oop
CH2CH3
CH2CH3
metasubst.
sp2 C–Hstretch
sp3 C–Hstretch
aromaticC C stretch––
F I G U R E 2 . 2 5 The infrared spectrum of meta-diethylbenzene (neat liquid, KBr plates).
4000 3600 3200 2800 2400 2000 1800 1600 1400 1200 1000 800 600 400WAVENUMBERS (CM–1)
2.5 3 4 5 6 7 8 9 10 11 12 13 14 15 16 19 25100
90
80
70
60
50
40
30
20
10
0
MICRONS
% T
RA
NS
MIT
TAN
CE
sp2 C–Hstretch
para subst.oop
parasubst.
sp3 C–Hstretch
aromaticC C stretch––
CH2CH3
CH2CH3
F I G U R E 2 . 2 6 The infrared spectrum of para-diethylbenzene (neat liquid, KBr plates).
14782_02_Ch2_p015-104.pp2.qxd 1/25/08 10:27 AM Page 44
2.11 Aromatic Rings 45
4000 3600 3200 2800 2400 2000 1800 1600 1400 1200 1000 800 600 400WAVENUMBERS (CM–1)
2.5 3 4 5 6 7 8 9 10 11 12 13 14 15 16 19 25100
90
80
70
60
50
40
30
20
10
0
MICRONS
% T
RA
NS
MIT
TAN
CE
sp2 C–Hstretch
CH CH2
––
monosubst.
mono subst. oop
C Cstretchvinyl
––
aromatic C C
––
C–H vinyl
––
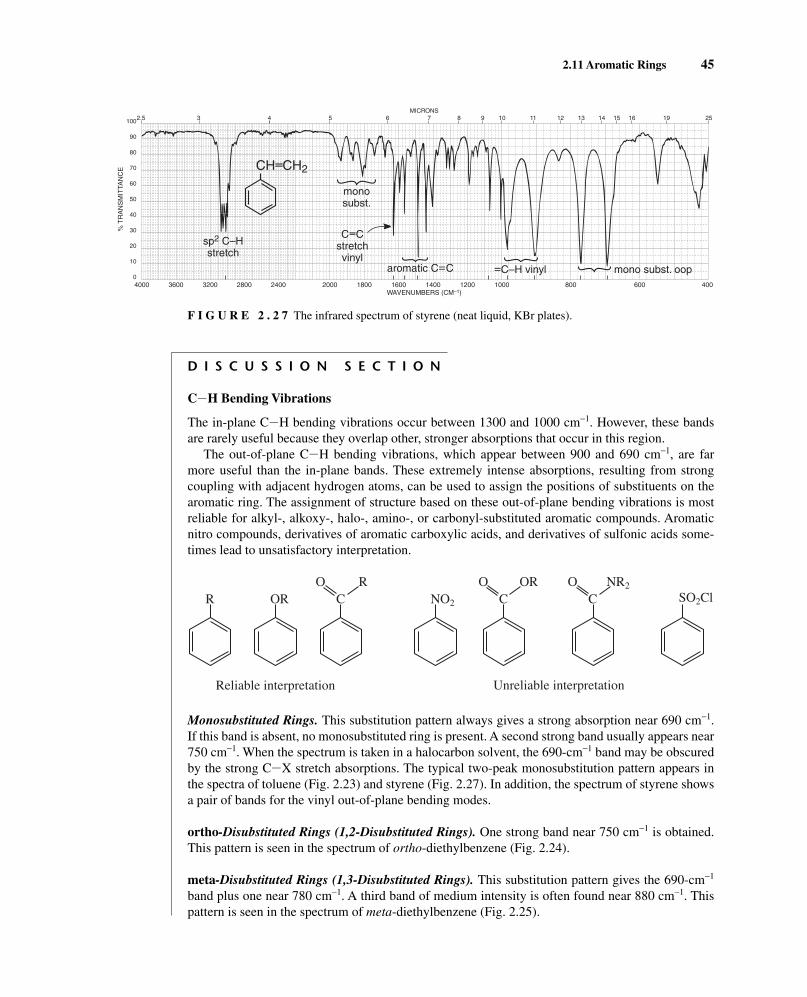
F I G U R E 2 . 2 7 The infrared spectrum of styrene (neat liquid, KBr plates).
D I S C U S S I O N S E C T I O N
CIH Bending Vibrations
The in-plane CIH bending vibrations occur between 1300 and 1000 cm−1. However, these bandsare rarely useful because they overlap other, stronger absorptions that occur in this region.
The out-of-plane CIH bending vibrations, which appear between 900 and 690 cm−1, are farmore useful than the in-plane bands. These extremely intense absorptions, resulting from strongcoupling with adjacent hydrogen atoms, can be used to assign the positions of substituents on thearomatic ring. The assignment of structure based on these out-of-plane bending vibrations is mostreliable for alkyl-, alkoxy-, halo-, amino-, or carbonyl-substituted aromatic compounds. Aromaticnitro compounds, derivatives of aromatic carboxylic acids, and derivatives of sulfonic acids some-times lead to unsatisfactory interpretation.
Monosubstituted Rings. This substitution pattern always gives a strong absorption near 690 cm−1.If this band is absent, no monosubstituted ring is present. A second strong band usually appears near750 cm−1. When the spectrum is taken in a halocarbon solvent, the 690-cm−1 band may be obscuredby the strong CIX stretch absorptions. The typical two-peak monosubstitution pattern appears inthe spectra of toluene (Fig. 2.23) and styrene (Fig. 2.27). In addition, the spectrum of styrene showsa pair of bands for the vinyl out-of-plane bending modes.
ortho-Disubstituted Rings (1,2-Disubstituted Rings). One strong band near 750 cm−1 is obtained.This pattern is seen in the spectrum of ortho-diethylbenzene (Fig. 2.24).
meta-Disubstituted Rings (1,3-Disubstituted Rings). This substitution pattern gives the 690-cm−1
band plus one near 780 cm−1. A third band of medium intensity is often found near 880 cm−1. Thispattern is seen in the spectrum of meta-diethylbenzene (Fig. 2.25).
R CORO R
CNO2
O ORC
O NR2
SO2Cl
Reliable interpretation Unreliable interpretation
14782_02_Ch2_p015-104.pp2.qxd 1/25/08 10:27 AM Page 45
46 Infrared Spectroscopy
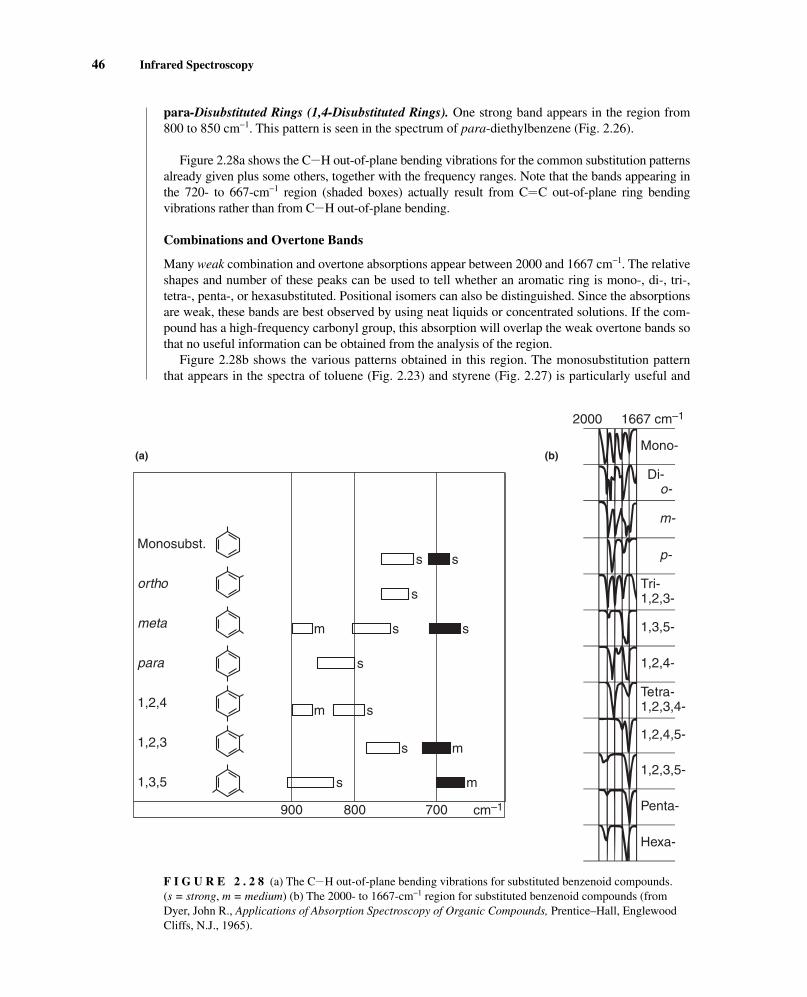
para-Disubstituted Rings (1,4-Disubstituted Rings). One strong band appears in the region from800 to 850 cm−1. This pattern is seen in the spectrum of para-diethylbenzene (Fig. 2.26).
Figure 2.28a shows the CIH out-of-plane bending vibrations for the common substitution patternsalready given plus some others, together with the frequency ranges. Note that the bands appearing inthe 720- to 667-cm−1 region (shaded boxes) actually result from CJC out-of-plane ring bendingvibrations rather than from CIH out-of-plane bending.
Combinations and Overtone Bands
Many weak combination and overtone absorptions appear between 2000 and 1667 cm−1. The relativeshapes and number of these peaks can be used to tell whether an aromatic ring is mono-, di-, tri-,tetra-, penta-, or hexasubstituted. Positional isomers can also be distinguished. Since the absorptionsare weak, these bands are best observed by using neat liquids or concentrated solutions. If the com-pound has a high-frequency carbonyl group, this absorption will overlap the weak overtone bands sothat no useful information can be obtained from the analysis of the region.
Figure 2.28b shows the various patterns obtained in this region. The monosubstitution patternthat appears in the spectra of toluene (Fig. 2.23) and styrene (Fig. 2.27) is particularly useful and
(b)
2000 1667 cm–1
Mono-
m-
p-
1,3,5-
1,2,4-
1,2,3,5-
Penta-
Hexa-
Tri-1,2,3-
Tetra-1,2,3,4-
1,2,4,5-
Di-o-
900 800 700 cm–1
(a)
Monosubst.
ortho
meta
para
1,2,4
1,2,3
1,3,5 ms
ms
m s
s
s s
s
m s s
F I G U R E 2 . 2 8 (a) The CIH out-of-plane bending vibrations for substituted benzenoid compounds. (s = strong, m = medium) (b) The 2000- to 1667-cm−1 region for substituted benzenoid compounds (fromDyer, John R., Applications of Absorption Spectroscopy of Organic Compounds, Prentice–Hall, EnglewoodCliffs, N.J., 1965).
14782_02_Ch2_p015-104.pp2.qxd 1/25/08 10:27 AM Page 46

2.12 Alcohols and Phenols 47
helps to confirm the out-of-plane data given in the preceding section. Likewise, the ortho-, meta-,and para-disubstituted patterns may be consistent with the out-of-plane bending vibrations dis-cussed earlier. The spectra of ortho-diethylbenzene (Fig. 2.24), meta-diethylbenzene (Fig. 2.25),and para-diethylbenzene (Fig. 2.26) each show bands in both the 2000- to 1667-cm−1 and 900- to690-cm−1 regions, consistent with their structures. Note, however, that the out-of-plane vibrationsare generally more useful for diagnostic purposes.
2.12 ALCOHOLS AND PHENOLS
Alcohols and phenols will show strong and broad hydrogen-bonded OIH stretching bands centeredbetween 3400 and 3300 cm−1. In solution, it will also be possible to observe a “free” OIH (nonHIbonded) stretching band at about 3600 cm−1 (sharp and weaker) to the left of the hydrogen-bondedOIH peak. In addition, a CIO stretching band will appear in the spectrum at 1260–1000 cm−1.
S P E C T R A L A N A L Y S I S B O X
ALCOHOLS AND PHENOLS
OIH The free OIH stretch is a sharp peak at 3650–3600 cm−1. This band appears incombination with the hydrogen-bonded OIH peak when the alcohol is dissolvedin a solvent (see discussion).
The hydrogen-bonded OIH band is a broad peak at 3400–3300 cm−1. This bandis usually the only one present in an alcohol that has not been dissolved in a sol-vent (neat liquid). When the alcohol is dissolved in a solvent, the free OIH andhydrogen-bonded OIH bands are present together, with the relatively weak freeOIH on the left (see discussion).
CIOIH Bending appears as a broad and weak peak at 1440–1220 cm−1, often obscured bythe CH3 bendings.
CIO Stretching vibration usually occurs in the range 1260–1000 cm−1. This band canbe used to assign a primary, secondary, or tertiary structure to an alcohol (seediscussion).
Examples: The hydrogen-bonded OIH stretch is present in the pure liquid (neat) samples of1-hexanol (Fig. 2.29), 2-butanol (Fig. 2.30), and para-cresol (Fig. 2.31).
4000 3600 3200 2800 2400 2000 1800 1600 1400 1200 1000 800 600 400WAVENUMBERS (CM–1)
2.5 3 4 5 6 7 8 9 10 11 12 13 14 15 16 19 25100
90
80
70
60
50
40
30
20
10
0
MICRONS
% T
RA
NS
MIT
TAN
CE
CH3(CH2)4CH2OHCH3 bend
CH2 bend
sp3 C–H stretch
long-chainband
O–H stretchH-bonded
C–O stretch
F I G U R E 2 . 2 9 The infrared spectrum of 1-hexanol (neat liquid, KBr plates).
14782_02_Ch2_p015-104.pp2.qxd 1/25/08 10:27 AM Page 47

48 Infrared Spectroscopy
4000 3600 3200 2800 2400 2000 1800 1600 1400 1200 1000 800 600 400WAVENUMBERS (CM–1)
2.5 3 4 5 6 7 8 9 10 11 12 13 14 15 16 19 25100
90
80
70
60
50
40
30
20
10
0
MICRONS
% T
RA
NS
MIT
TAN
CE
O–H stretchH-bonded
C–O stretch
CH2 CH3bendssp3
C–Hstretch
CH3CH2CH CH3
OH
–F I G U R E 2 . 3 0 The infrared spectrum of 2-butanol (neat liquid, KBr plates).
4000 3600 3200 2800 2400 2000 1800 1600 1400 1200 1000 800 600 400WAVENUMBERS (CM–1)
2.5 3 4 5 6 7 8 9 10 11 12 13 14 15 16 19 25100
90
80
70
60
50
40
30
20
10
0
MICRONS
% T
RA
NS
MIT
TAN
CE
O–H stretchH-bonded
C–Hstretch
parasubst.
––arom.C C C–O stretch
para subst.oop
CH3
OH
F I G U R E 2 . 3 1 The infrared spectrum of para-cresol (neat liquid, KBr plates).
D I S C U S S I O N S E C T I O N
OIH Stretching Vibrations
When alcohols or phenols are determined as pure (neat) liquid films, as is common practice, a broadOIH stretching vibration is obtained for intermolecular hydrogen bonding in the range from 3400to 3300 cm−1. Figure 2.32a shows this band, which is observed in the spectra of 1-hexanol (Fig.2.29) and 2-butanol (Fig. 2.30). Phenols also show the hydrogen-bonded OIH (Fig. 2.31). As thealcohol is diluted with carbon tetrachloride, a sharp “free” (non-hydrogen-bonded) OIH stretchingband appears at about 3600 cm−1, to the left of the broad band (Fig. 2.32b). When the solution is fur-ther diluted, the broad intermolecular hydrogen-bonded band is reduced considerably, leaving asthe major band the free OIH stretching absorption (Fig. 2.32c). Intermolecular hydrogen bondingweakens the OIH bond, thereby shifting the band to lower frequency (lower energy).
Some workers have used the position of the free OIH stretching band to help assign a primary,secondary, or tertiary structure to an alcohol. For example, the free stretch occurs near 3640, 3630,3620, and 3610 cm−1 for primary, secondary, and tertiary alcohols and for phenols, respectively.These absorptions can be analyzed only if the OIH region is expanded and carefully calibrated.Under the usual routine laboratory conditions, these fine distinctions are of little use. Far more usefulinformation is obtained from the CIO stretching vibrations.
14782_02_Ch2_p015-104.pp2.qxd 1/25/08 10:27 AM Page 48

2.12 Alcohols and Phenols 49
Intramolecular hydrogen bonding, present in ortho-carbonyl-substituted phenols, usually shifts thebroad OIH band to a lower frequency. For example, the OIH band is centered at about 3200 cm−1
in the neat spectrum of methyl salicylate, while OIH bands from normal phenols are centered atabout 3350 cm−1. The intramolecular hydrogen-bonded band does not change its position signifi-cantly even at high dilution because the internal bonding is not altered by a change in concentration.
Although phenols often have broader OIH bands than alcohols, it is difficult to assign a structurebased on this absorption; use the aromatic CJC region and the CIO stretching vibration (to be dis-cussed shortly) to assign a phenolic structure. Finally, the OIH stretching vibrations in carboxylicacids also occur in this region. They may easily be distinguished from alcohols and phenols by thepresence of a very broad band extending from 3400 to 2400 cm−1 and the presence of a carbonylabsorption (see Section 2.14D).
CIOIH Bending Vibrations
This bending vibration is coupled to HICIH bending vibrations to yield some weak and broadpeaks in the 1440 to 1220-cm−1 region. These broad peaks are difficult to observe because they areusually located under the more strongly absorbing CH3 bending peaks at 1375 cm−1 (see Fig. 2.29).
CIO Stretching Vibrations
The strong CIO single-bond stretching vibrations are observed in the range from 1260 to 1000 cm−1.Since the CIO absorptions are coupled with the adjacent CIC stretching vibrations, the position of theband may be used to assign a primary, secondary, or tertiary structure to an alcohol or to determinewhether a phenolic compound is present. Table 2.7 gives the expected absorption bands for the CIOstretching vibrations in alcohols and phenols. For comparison, the OIH stretch values are also tabulated.
C
OCH3
O
HO
••• Methyl salicylate
4000 3600 3200 2800WAVENUMBERS (CM–1)
2.5 3 4100
90
80
70
60
50
40
30
20
10
0
MICRONS
% T
RA
NS
MIT
TAN
CE
4000 3600 3200 2800WAVENUMBERS (CM–1)
2.5 3 4100
90
80
70
60
50
40
30
20
10
0
MICRONS
% T
RA
NS
MIT
TAN
CE
4000 3600 3200 2800WAVENUMBERS (CM–1)
2.5 3 4100
90
80
70
60
50
40
30
20
10
0
MICRONS
% T
RA
NS
MIT
TAN
CE
FreeO–H
FreeOH
C–HH-bonded
O–HH-bonded
O–HC–H
C–H
(a) (b) (c)
F I G U R E 2 . 3 2 The OIH stretch region. (a) Hydrogen-bonded OIH only (neat liquid). (b) Free andhydrogen-bonded OIH (dilute solution). (c) Free and hydrogen-bonded OIH (very dilute solution).
14782_02_Ch2_p015-104.pp2.qxd 1/25/08 10:27 AM Page 49
50 Infrared Spectroscopy
2.13 ETHERS
Ethers show at least one CIO band in the range 1300–1000 cm−1. Simple aliphatic ethers can bedistinguished from alkanes by the presence of the CIO band. In all other respects, the spectraof simple ethers look very similar to those of alkanes. Aromatic ethers, epoxides, and acetals arediscussed in this section.
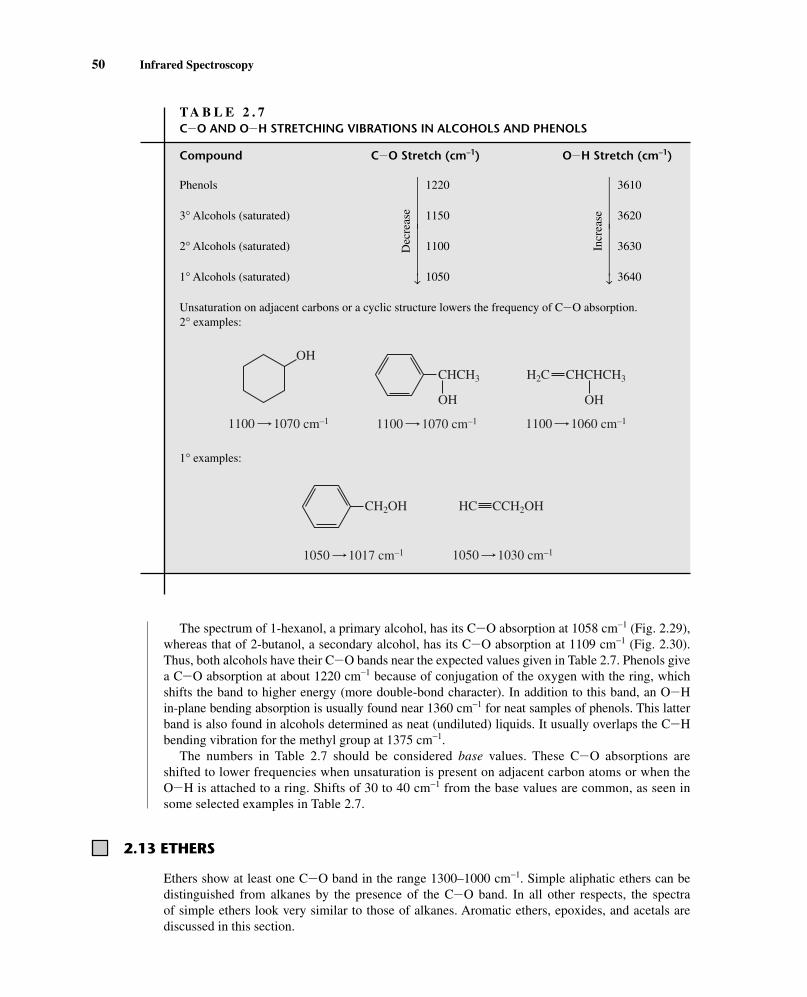
TA B L E 2 . 7CIO AND OIH STRETCHING VIBRATIONS IN ALCOHOLS AND PHENOLS
Compound CIO Stretch (cm–1) OIH Stretch (cm–1)
Phenols 1220 3610
3° Alcohols (saturated) 1150 3620
2° Alcohols (saturated) 1100 3630
1° Alcohols (saturated) 1050 3640
Unsaturation on adjacent carbons or a cyclic structure lowers the frequency of CIO absorption. 2° examples:
1° examples:
CH2OH HC CCH2OH
1050 1017 cm–1 1050 1030 cm–1
CHCH3
OH OH
OH
H2C CHCHCH3
1100 1070 cm–1 1100 1070 cm–1 1100 1060 cm–1
The spectrum of 1-hexanol, a primary alcohol, has its CIO absorption at 1058 cm−1 (Fig. 2.29),whereas that of 2-butanol, a secondary alcohol, has its CIO absorption at 1109 cm−1 (Fig. 2.30).Thus, both alcohols have their CIO bands near the expected values given in Table 2.7. Phenols givea CIO absorption at about 1220 cm−1 because of conjugation of the oxygen with the ring, whichshifts the band to higher energy (more double-bond character). In addition to this band, an OIH in-plane bending absorption is usually found near 1360 cm−1 for neat samples of phenols. This latterband is also found in alcohols determined as neat (undiluted) liquids. It usually overlaps the CIHbending vibration for the methyl group at 1375 cm−1.
The numbers in Table 2.7 should be considered base values. These CIO absorptions areshifted to lower frequencies when unsaturation is present on adjacent carbon atoms or when theOIH is attached to a ring. Shifts of 30 to 40 cm−1 from the base values are common, as seen insome selected examples in Table 2.7.
Dec
reas
e←⎯
⎯
Incr
ease
←⎯
⎯
14782_02_Ch2_p015-104.pp2.qxd 1/25/08 10:27 AM Page 50

2.13 Ethers 51
S P E C T R A L A N A L Y S I S B O X
ETHERS
CIO The most prominent band is that due to CIO stretch, 1300–1000 cm−1. Absence ofCJO and OIH is required to ensure that CIO stretch is not due to an ester or analcohol. Phenyl alkyl ethers give two strong bands at about 1250 and 1040 cm−1,while aliphatic ethers give one strong band at about 1120 cm−1.
Examples: dibutyl ether (Fig. 2.33) and anisole (Fig. 2.34).
4000 3600 3200 2800 2400 2000 1800 1600 1400 1200 1000 800 600 400WAVENUMBERS (CM–1)
2.5 3 4 5 6 7 8 9 10 11 12 13 14 15 16 19 25100
90
80
70
60
50
40
30
20
10
0
MICRONS
% T
RA
NS
MIT
TAN
CE
CH3(CH2)3–O–(CH2)
3CH3
sp3 C–H
stretch
CH2bends
CH3bends
C–O stretch
F I G U R E 2 . 3 3 The infrared spectrum of dibutyl ether (neat liquid, KBr plates).
4000 3600 3200 2800 2400 2000 1800 1600 1400 1200 1000 800 600 400WAVENUMBERS (CM–1)
2.5 3 4 5 6 7 8 9 10 11 12 13 14 15 16 19 25100
90
80
70
60
50
40
30
20
10
0
MICRONS
% T
RA
NS
MIT
TAN
CE
sp2 C–Hstretch
OCH3
aromatic C C
––
C–O stretchmono subst. oop
sp3 C–Hstretch
F I G U R E 2 . 3 4 The infrared spectrum of anisole (neat liquid, KBr plates).
D I S C U S S I O N S E C T I O N
Ethers and related compounds such as epoxides, acetals, and ketals give rise to CIOIC stretchingabsorptions in the range from 1300 to 1000 cm−1. Alcohols and esters also give strong CIOabsorptions in this region, and these latter possibilities must be eliminated by observing the absenceof bands in the OIH stretch region (Section 2.12) and in the CJO stretch region (Section 2.14),respectively. Ethers are generally encountered more often than epoxides, acetals, and ketals.
14782_02_Ch2_p015-104.pp2.qxd 1/25/08 10:27 AM Page 51
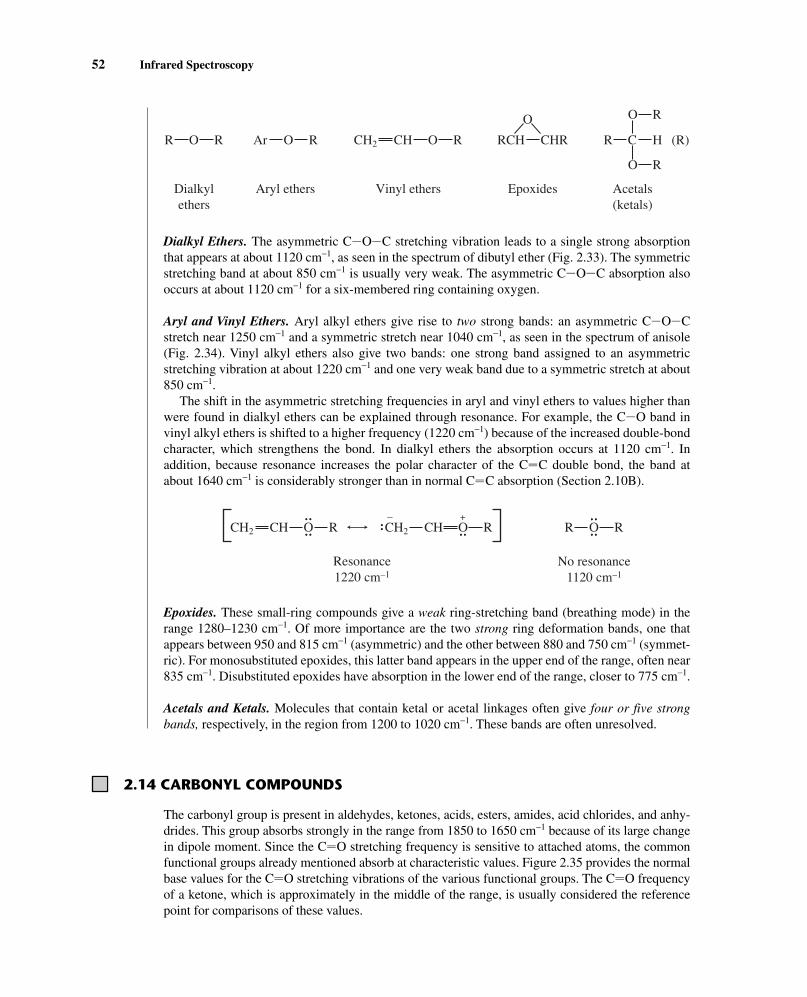
52 Infrared Spectroscopy
Dialkyl Ethers. The asymmetric CIOIC stretching vibration leads to a single strong absorptionthat appears at about 1120 cm−1, as seen in the spectrum of dibutyl ether (Fig. 2.33). The symmetricstretching band at about 850 cm−1 is usually very weak. The asymmetric CIOIC absorption alsooccurs at about 1120 cm−1 for a six-membered ring containing oxygen.
Aryl and Vinyl Ethers. Aryl alkyl ethers give rise to two strong bands: an asymmetric CIOICstretch near 1250 cm−1 and a symmetric stretch near 1040 cm−1, as seen in the spectrum of anisole(Fig. 2.34). Vinyl alkyl ethers also give two bands: one strong band assigned to an asymmetricstretching vibration at about 1220 cm−1 and one very weak band due to a symmetric stretch at about850 cm−1.
The shift in the asymmetric stretching frequencies in aryl and vinyl ethers to values higher thanwere found in dialkyl ethers can be explained through resonance. For example, the CIO band invinyl alkyl ethers is shifted to a higher frequency (1220 cm−1) because of the increased double-bondcharacter, which strengthens the bond. In dialkyl ethers the absorption occurs at 1120 cm−1. Inaddition, because resonance increases the polar character of the CJC double bond, the band atabout 1640 cm−1 is considerably stronger than in normal CJC absorption (Section 2.10B).
Epoxides. These small-ring compounds give a weak ring-stretching band (breathing mode) in therange 1280–1230 cm−1. Of more importance are the two strong ring deformation bands, one thatappears between 950 and 815 cm−1 (asymmetric) and the other between 880 and 750 cm−1 (symmet-ric). For monosubstituted epoxides, this latter band appears in the upper end of the range, often near835 cm−1. Disubstituted epoxides have absorption in the lower end of the range, closer to 775 cm−1.
Acetals and Ketals. Molecules that contain ketal or acetal linkages often give four or five strongbands, respectively, in the region from 1200 to 1020 cm−1. These bands are often unresolved.
+–O R•• ••
•• ••
••••CH2 CH O R
•• ••O RR•• ••
•• ••
CH2 CH
Resonance1220 cm–1
No resonance1120 cm–1
R RO Ar RO CH2 CH CHRRCHR R C
O R
O R
HO
O
(R)
Acetals(ketals)
EpoxidesVinyl ethersAryl ethersDialkylethers
2.14 CARBONYL COMPOUNDS
The carbonyl group is present in aldehydes, ketones, acids, esters, amides, acid chlorides, and anhy-drides. This group absorbs strongly in the range from 1850 to 1650 cm−1 because of its large changein dipole moment. Since the CJO stretching frequency is sensitive to attached atoms, the commonfunctional groups already mentioned absorb at characteristic values. Figure 2.35 provides the normalbase values for the CJO stretching vibrations of the various functional groups. The CJO frequencyof a ketone, which is approximately in the middle of the range, is usually considered the referencepoint for comparisons of these values.
14782_02_Ch2_p015-104.pp2.qxd 1/25/08 10:27 AM Page 52
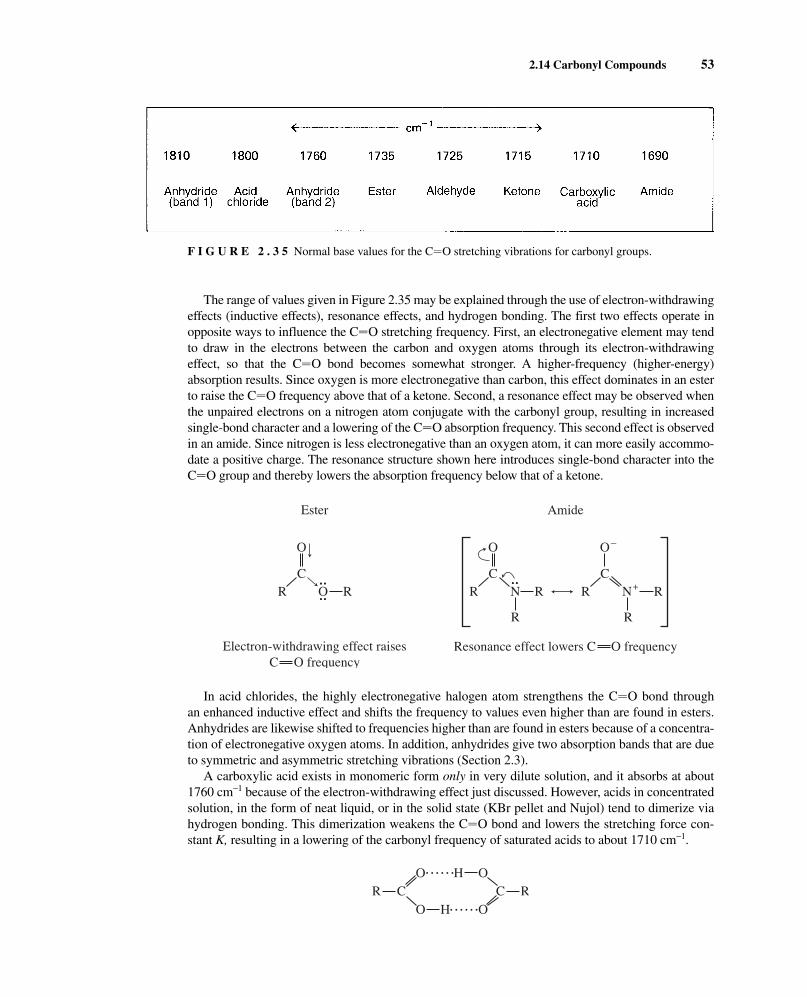
The range of values given in Figure 2.35 may be explained through the use of electron-withdrawingeffects (inductive effects), resonance effects, and hydrogen bonding. The first two effects operate inopposite ways to influence the CJO stretching frequency. First, an electronegative element may tendto draw in the electrons between the carbon and oxygen atoms through its electron-withdrawingeffect, so that the CJO bond becomes somewhat stronger. A higher-frequency (higher-energy)absorption results. Since oxygen is more electronegative than carbon, this effect dominates in an esterto raise the CJO frequency above that of a ketone. Second, a resonance effect may be observed whenthe unpaired electrons on a nitrogen atom conjugate with the carbonyl group, resulting in increasedsingle-bond character and a lowering of the CJO absorption frequency. This second effect is observedin an amide. Since nitrogen is less electronegative than an oxygen atom, it can more easily accommo-date a positive charge. The resonance structure shown here introduces single-bond character into theCJO group and thereby lowers the absorption frequency below that of a ketone.
In acid chlorides, the highly electronegative halogen atom strengthens the CJO bond throughan enhanced inductive effect and shifts the frequency to values even higher than are found in esters.Anhydrides are likewise shifted to frequencies higher than are found in esters because of a concentra-tion of electronegative oxygen atoms. In addition, anhydrides give two absorption bands that are dueto symmetric and asymmetric stretching vibrations (Section 2.3).
A carboxylic acid exists in monomeric form only in very dilute solution, and it absorbs at about1760 cm−1 because of the electron-withdrawing effect just discussed. However, acids in concentratedsolution, in the form of neat liquid, or in the solid state (KBr pellet and Nujol) tend to dimerize viahydrogen bonding. This dimerization weakens the CJO bond and lowers the stretching force con-stant K, resulting in a lowering of the carbonyl frequency of saturated acids to about 1710 cm−1.
O OH
O OHR RC C
• • • • • •
• • • • • •
O
R
R
CR N
•• ••
O
RC
R O•• ••
•• ••
+
–O
R
R
CR N
Ester Amide
Electron-withdrawing effect raisesC O frequency
Resonance effect lowers C O frequency
F I G U R E 2 . 3 5 Normal base values for the CJO stretching vibrations for carbonyl groups.
2.14 Carbonyl Compounds 53
14782_02_Ch2_p015-104.pp2.qxd 1/25/08 10:27 AM Page 53
54 Infrared Spectroscopy
Ketones absorb at a lower frequency than aldehydes because of their additional alkyl group, whichis electron donating (compared to H) and supplies electrons to the CJO bond. This electron-releasingeffect weakens the CJO bond in the ketone and lowers the force constant and the absorption frequency.
O
CR R
O
CR H
versus
Conjugation Effects. The introduction of a CJC bond adjacent to a carbonyl group results indelocalization of the p electrons in the CJO and CJC bonds. This conjugation increases thesingle-bond character of the CJO and CJC bonds in the resonance hybrid and hence lowers theirforce constants, resulting in a lowering of the frequencies of carbonyl and double-bond absorption.Conjugation with triple bonds also shows this effect.
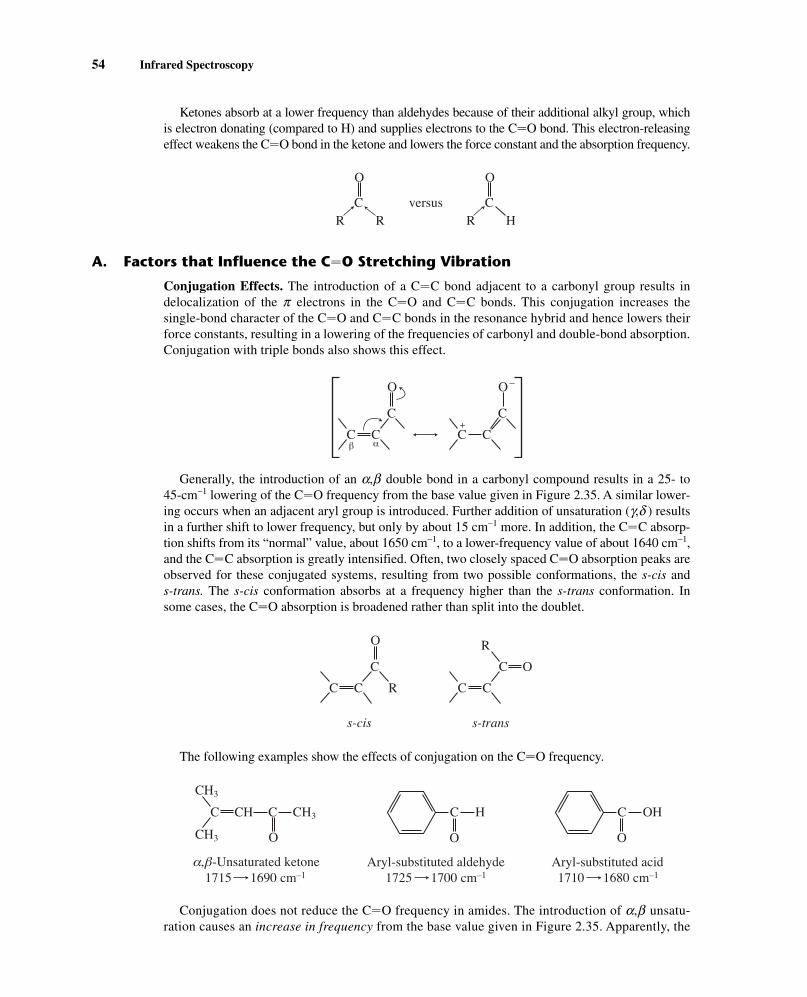
Generally, the introduction of an a,b double bond in a carbonyl compound results in a 25- to45-cm−1 lowering of the CJO frequency from the base value given in Figure 2.35. A similar lower-ing occurs when an adjacent aryl group is introduced. Further addition of unsaturation (g,d ) resultsin a further shift to lower frequency, but only by about 15 cm−1 more. In addition, the CJC absorp-tion shifts from its “normal” value, about 1650 cm−1, to a lower-frequency value of about 1640 cm−1,and the CJC absorption is greatly intensified. Often, two closely spaced CJO absorption peaks areobserved for these conjugated systems, resulting from two possible conformations, the s-cis ands-trans. The s-cis conformation absorbs at a frequency higher than the s-trans conformation. Insome cases, the CJO absorption is broadened rather than split into the doublet.
The following examples show the effects of conjugation on the CJO frequency.
Conjugation does not reduce the CJO frequency in amides. The introduction of a,b unsatu-ration causes an increase in frequency from the base value given in Figure 2.35. Apparently, the
C
O
H C
O
OH
O
C CCH CH3
CH3
CH3
1715 1690 cm–1 1725 1700 cm–1 1710 1680 cm–1α,β Aryl-substituted aldehyde Aryl-substituted acid-Unsaturated ketone
O
C C R
C
C C
R
C O
s-cis s-trans
O
C C
C+
–
β α
O
C C
C
A. Factors that Influence the CJO Stretching Vibration
14782_02_Ch2_p015-104.pp2.qxd 1/25/08 10:27 AM Page 54
introduction of sp2-hybridized carbon atoms removes electron density from the carbonyl groupand strengthens the bond instead of interacting by resonance as in other carbonyl examples. Sincethe parent amide group is already highly stabilized (see p. 53), the introduction of the CJC un-saturation does not overcome this resonance.
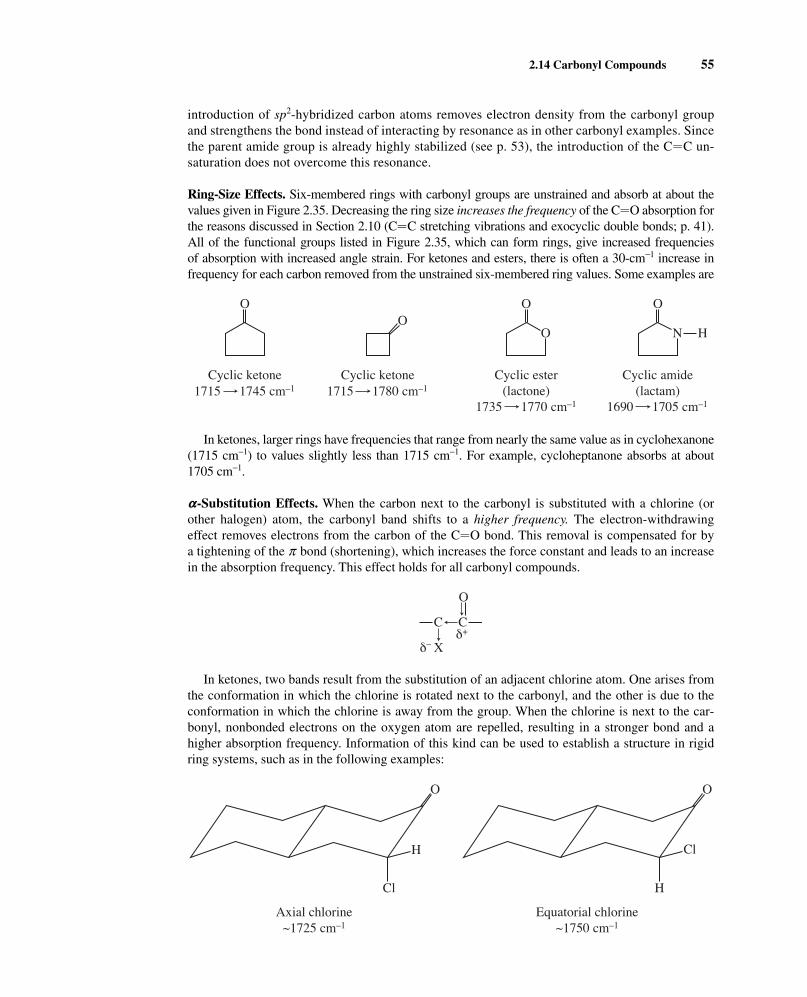
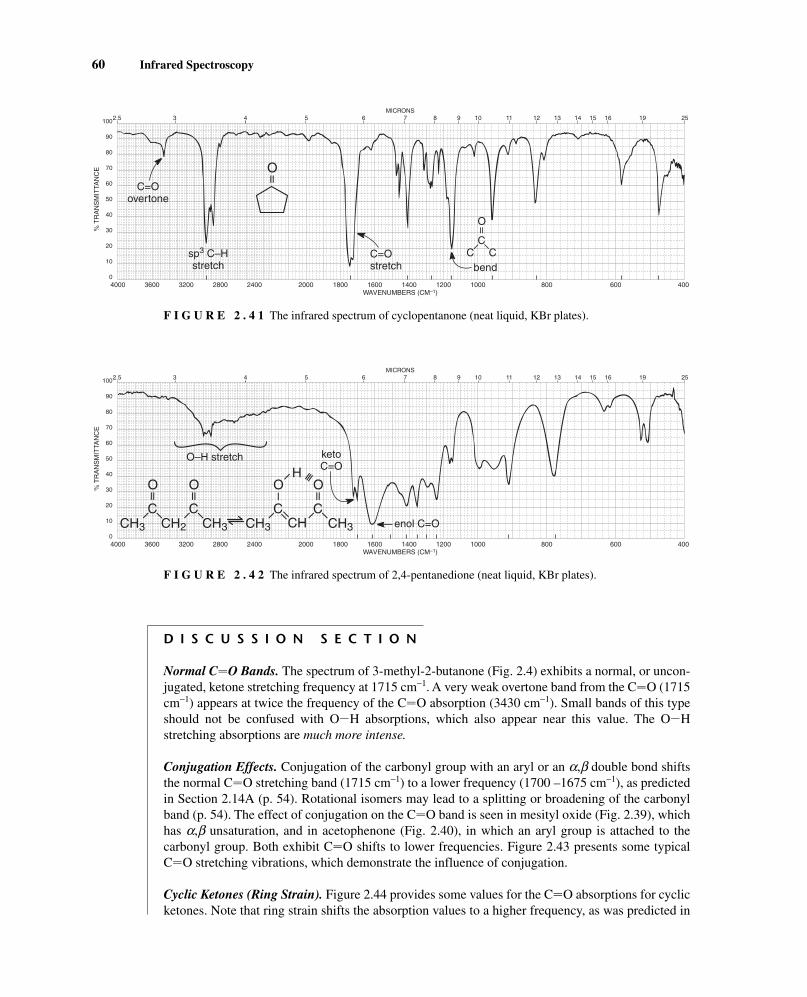
Ring-Size Effects. Six-membered rings with carbonyl groups are unstrained and absorb at about thevalues given in Figure 2.35. Decreasing the ring size increases the frequency of the CJO absorption forthe reasons discussed in Section 2.10 (CJC stretching vibrations and exocyclic double bonds; p. 41).All of the functional groups listed in Figure 2.35, which can form rings, give increased frequenciesof absorption with increased angle strain. For ketones and esters, there is often a 30-cm−1 increase infrequency for each carbon removed from the unstrained six-membered ring values. Some examples are
In ketones, larger rings have frequencies that range from nearly the same value as in cyclohexanone(1715 cm−1) to values slightly less than 1715 cm−1. For example, cycloheptanone absorbs at about1705 cm−1.
a-Substitution Effects. When the carbon next to the carbonyl is substituted with a chlorine (orother halogen) atom, the carbonyl band shifts to a higher frequency. The electron-withdrawingeffect removes electrons from the carbon of the CJO bond. This removal is compensated for bya tightening of the p bond (shortening), which increases the force constant and leads to an increasein the absorption frequency. This effect holds for all carbonyl compounds.
In ketones, two bands result from the substitution of an adjacent chlorine atom. One arises fromthe conformation in which the chlorine is rotated next to the carbonyl, and the other is due to theconformation in which the chlorine is away from the group. When the chlorine is next to the car-bonyl, nonbonded electrons on the oxygen atom are repelled, resulting in a stronger bond and ahigher absorption frequency. Information of this kind can be used to establish a structure in rigidring systems, such as in the following examples:
O
H
Cl
O
Cl
H
Axial chlorine~1725 cm–1
Equatorial chlorine~1750 cm–1
O
C
X
Cδ+
δ–
OO
O
O
O
N H
Cyclic ketone Cyclic ketone Cyclic ester(lactone)
Cyclic amide(lactam)1715 1745 cm–1 1715 1780 cm–1
1735 1770 cm–1 1690 1705 cm–1
2.14 Carbonyl Compounds 55
14782_02_Ch2_p015-104.pp2.qxd 1/25/08 10:27 AM Page 55

Hydrogen-Bonding Effects. Hydrogen bonding to a carbonyl group lengthens the CJO bond andlowers the stretching force constant K, resulting in a lowering of the absorption frequency. Examplesof this effect are the decrease in the CJO frequency of the carboxylic acid dimer (p. 53) and the low-ering of the ester CJO frequency in methyl salicylate caused by intramolecular hydrogen bonding:
C
OCH3
O
HO
•••
Methyl salicylate1680 cm–1
56 Infrared Spectroscopy
S P E C T R A L A N A L Y S I S B O X
ALDEHYDES
CJO
CJO stretch appears in the range 1740–1725 cm−1 for normal aliphaticaldehydes.
Conjugation of CJO with a,b CJC; 1700–1680 cm−1 for CJO and 1640 cm−1 for CJC.
Conjugation of CJO with phenyl; 1700–1660 cm−1 for CJO and1600–1450 cm−1 for ring.
Longer conjugated system; 1680 cm−1 for CJO.
CIH Stretch, aldehyde hydrogen (ICHO), consists of a pair of weak bands,one at 2860–2800 cm−1 and the other at 2760–2700 cm−1. It is easier tosee the band at the lower frequency because it is not obscured by theusual CIH bands from the alkyl chain. The higher-frequency aldehydeCIH stretch is often buried in the aliphatic CIH bands.
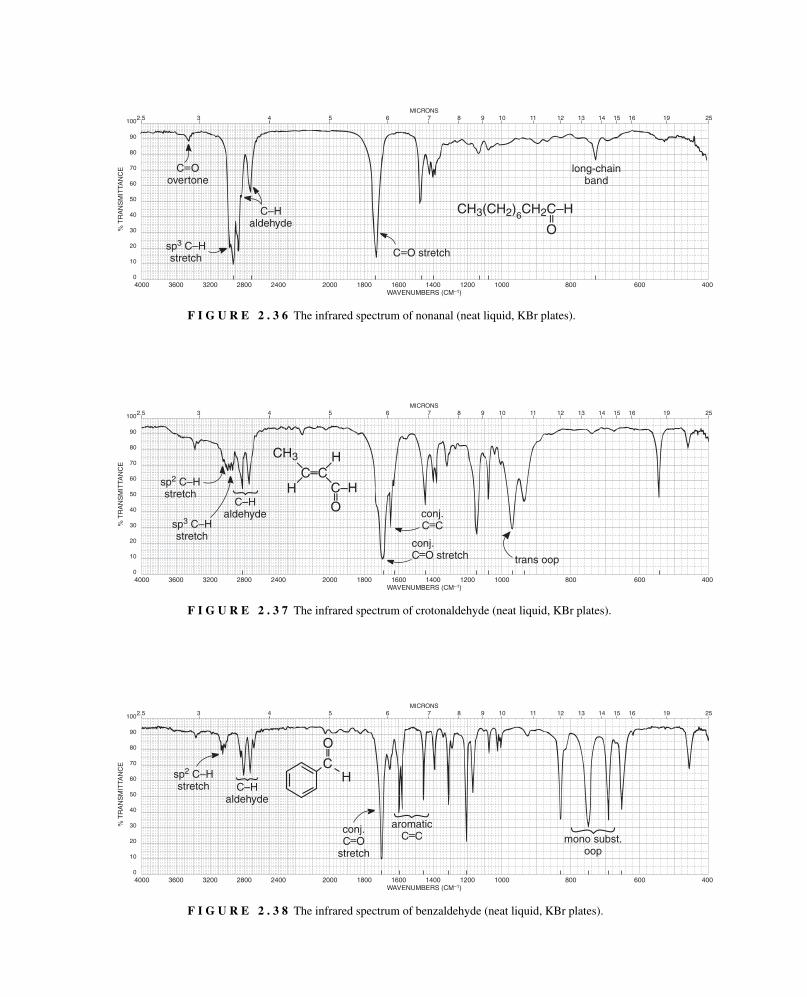
Examples: nonanal (Fig. 2.36), crotonaldehyde (Fig. 2.37), and benzaldehyde (Fig. 2.38).
O
CCCAr H
O
CAr H
O
CCC H
O
CR H
Aldehydes show a very strong band for the carbonyl group (CJO) that appears in the range of1740–1725 cm−1 for simple aliphatic aldehydes. This band is shifted to lower frequencies with con-jugation to a CJC or phenyl group. A very important doublet can be observed in the CIH stretchregion for the aldehyde CIH near 2850 and 2750 cm−1. The presence of this doublet allows alde-hydes to be distinguished from other carbonyl-containing compounds.
B. Aldehydes
14782_02_Ch2_p015-104.pp2.qxd 1/25/08 10:27 AM Page 56
4000 3600 3200 2800 2400 2000 1800 1600 1400 1200 1000 800 600 400WAVENUMBERS (CM–1)
2.5 3 4 5 6 7 8 9 10 11 12 13 14 15 16 19 25100
90
80
70
60
50
40
30
20
10
0
MICRONS
% T
RA
NS
MIT
TAN
CE
sp2 C–Hstretch
sp3 C–Hstretch
C–Haldehyde
trans oop
conj.C C
––
conj.C O stretch
––
C C––C–H
––––
H
H
CH3
O
– –
F I G U R E 2 . 3 7 The infrared spectrum of crotonaldehyde (neat liquid, KBr plates).
4000 3600 3200 2800 2400 2000 1800 1600 1400 1200 1000 800 600 400WAVENUMBERS (CM–1)
2.5 3 4 5 6 7 8 9 10 11 12 13 14 15 16 19 25100
90
80
70
60
50
40
30
20
10
0
MICRONS
% T
RA
NS
MIT
TAN
CE
mono subst.oop
C–Haldehyde
sp2 C–Hstretch
conj.C O
stretch––
aromaticC C––
C
O
––
H
F I G U R E 2 . 3 8 The infrared spectrum of benzaldehyde (neat liquid, KBr plates).
4000 3600 3200 2800 2400 2000 1800 1600 1400 1200 1000 800 600 400WAVENUMBERS (CM–1)
2.5 3 4 5 6 7 8 9 10 11 12 13 14 15 16 19 25100
90
80
70
60
50
40
30
20
10
0
MICRONS
% T
RA
NS
MIT
TAN
CE
sp3 C–Hstretch
CH3(CH2)6CH2C–H
O
– –C O stretch
––
C Oovertone
––
C–Haldehyde
long-chainband
F I G U R E 2 . 3 6 The infrared spectrum of nonanal (neat liquid, KBr plates).
14782_02_Ch2_p015-104.pp2.qxd 1/25/08 10:27 AM Page 57

58 Infrared Spectroscopy
D I S C U S S I O N S E C T I O N
The spectrum of nonanal (Fig. 2.36) exhibits the normal aldehyde stretching frequency at 1725 cm−1.Since the positions of these absorptions are not very different from those of ketones, it may not beeasy to distinguish between aldehydes and ketones on this basis. Conjugation of the carbonyl groupwith an aryl or an a,b double bond shifts the normal CJO stretching band to a lower frequency(1700–1680 cm−1), as predicted in Section 2.14A (Conjugation Effects). This effect is seen in cro-tonaldehyde (Fig. 2.37), which has a,b unsaturation, and in benzaldehyde (Fig. 2.38), in which anaryl group is attached directly to the carbonyl group. Halogenation on the a carbon leads to an in-creased frequency for the carbonyl group (p. 55).
The CIH stretching vibrations found in aldehydes (ICHO) at about 2750 and 2850 cm−1 are ex-tremely important for distinguishing between ketones and aldehydes. Typical ranges for the pairs ofCIH bands are 2860–2800 and 2760–2700 cm−1. The band at 2750 cm−1 is probably the more use-ful of the pair because it appears in a region where other CIH absorptions (CH3, CH2, and so on)are absent. The 2850-cm−1 band often overlaps other CIH bands and is not as easy to see (seenonanal, Fig. 2.36). If the 2750-cm−1 band is present together with the proper CJO absorptionvalue, an aldehyde functional group is almost certainly indicated.
The doublet that is observed in the range 2860–2700 cm−1 for an aldehyde is a result of Fermiresonance (p. 19). The second band appears when the aldehyde CIH stretching vibration is coupledwith the first overtone of the medium-intensity aldehyde CIH bending vibration appearing in therange 1400–1350 cm−1.
The medium-intensity absorption in nonanal (Fig. 2.36) at 1460 cm−1 is due to the scissoring(bending) vibration of the CH2 group next to the carbonyl group. Methylene groups often absorbmore strongly when they are attached directly to a carbonyl group.
Ketones show a very strong band for the CJO group that appears in the range of 1720–1708 cm−1
for simple aliphatic ketones. This band is shifted to lower frequencies with conjugation to a CJC orphenyl group. An a-halogen atom will shift the CJO frequency to a higher value. Ring strainmoves the absorption to a higher frequency in cyclic ketones.
C. Ketones
S P E C T R A L A N A L Y S I S B O X
KETONES
CJO
CJO stretch appears in the range 1720–1708 cm−1 for normalaliphatic ketones.
Conjugation of CJO with a,b CJC; 1700–1675 cm−1 for CJO and 1644–1617 cm−1 for CJC.
Conjugation of CJO with phenyl; 1700–1680 cm−1 for CJO and1600–1450 cm−1 for ring.
O
CAr R
O
CCC R
O
CR R
14782_02_Ch2_p015-104.pp2.qxd 1/25/08 10:27 AM Page 58

Conjugation with two aromatic rings; 1670–1600 cm−1 for CJO.
Cyclic ketones; CJO frequency increases with decreasing ring size.
Bending appears as a medium-intensity peak in the range 1300–1100 cm−1.
Examples: 3-methyl-2-butanone (Fig. 2.4), mesityl oxide (Fig. 2.39), acetophenone (Fig. 2.40),cyclopentanone (Fig. 2.41), and 2,4-pentanedione (Fig. 2.42).
O
CC C
C O
O
CAr Ar
4000 3600 3200 2800 2400 2000 1800 1600 1400 1200 1000 800 600 400WAVENUMBERS (CM–1)
2.5 3 4 5 6 7 8 9 10 11 12 13 14 15 16 19 25100
90
80
70
60
50
40
30
20
10
0
MICRONS
% T
RA
NS
MIT
TAN
CE C O
overtone
––
sp2 C–Hstretch
sp3 C–Hstretch conj.
C O––
tri subst.oop
CH3C–CH C
O– –
––CH3
––
CH3
conj.C C stretch––
F I G U R E 2 . 3 9 The infrared spectrum of mesityl oxide (neat liquid, KBr plates).
2.14 Carbonyl Compounds 59
4000 3600 3200 2800 2400 2000 1800 1600 1400 1200 1000 800 600 400WAVENUMBERS (CM–1)
2.5 3 4 5 6 7 8 9 10 11 12 13 14 15 16 19 25100
90
80
70
60
50
40
30
20
10
0
MICRONS
% T
RA
NS
MIT
TAN
CE
C–Hstretch
conj.C=O
aromaticC=C mono subst.
oopbend
O
C
––
CH3
O
–C
–
CC
––
F I G U R E 2 . 4 0 The infrared spectrum of acetophenone (neat liquid, KBr plates).
14782_02_Ch2_p015-104.pp2.qxd 1/25/08 10:27 AM Page 59
60 Infrared Spectroscopy
4000 3600 3200 2800 2400 2000 1800 1600 1400 1200 1000 800 600 400WAVENUMBERS (CM–1)
2.5 3 4 5 6 7 8 9 10 11 12 13 14 15 16 19 25100
90
80
70
60
50
40
30
20
10
0
MICRONS
% T
RA
NS
MIT
TAN
CE
C=Ostretch
C––
O– –
C Cbend
sp3 C–Hstretch
C=Oovertone
O– –
F I G U R E 2 . 4 1 The infrared spectrum of cyclopentanone (neat liquid, KBr plates).
4000 3600 3200 2800 2400 2000 1800 1600 1400 1200 1000 800 600 400WAVENUMBERS (CM–1)
2.5 3 4 5 6 7 8 9 10 11 12 13 14 15 16 19 25100
90
80
70
60
50
40
30
20
10
0
MICRONS
% T
RA
NS
MIT
TAN
CE
O–H stretch
O– –
C––CH3 CH2
O– –
C–– CH3
O–
C––CH3 CH
O– –
C–– CH3
–
–H
ketoC=O–––
enol C=O
F I G U R E 2 . 4 2 The infrared spectrum of 2,4-pentanedione (neat liquid, KBr plates).
D I S C U S S I O N S E C T I O N
Normal CJO Bands. The spectrum of 3-methyl-2-butanone (Fig. 2.4) exhibits a normal, or uncon-jugated, ketone stretching frequency at 1715 cm−1. A very weak overtone band from the CJO (1715cm−1) appears at twice the frequency of the CJO absorption (3430 cm−1). Small bands of this typeshould not be confused with OIH absorptions, which also appear near this value. The OIHstretching absorptions are much more intense.
Conjugation Effects. Conjugation of the carbonyl group with an aryl or an a,b double bond shiftsthe normal CJO stretching band (1715 cm−1) to a lower frequency (1700 –1675 cm−1), as predictedin Section 2.14A (p. 54). Rotational isomers may lead to a splitting or broadening of the carbonylband (p. 54). The effect of conjugation on the CJO band is seen in mesityl oxide (Fig. 2.39), whichhas a,b unsaturation, and in acetophenone (Fig. 2.40), in which an aryl group is attached to thecarbonyl group. Both exhibit CJO shifts to lower frequencies. Figure 2.43 presents some typicalCJO stretching vibrations, which demonstrate the influence of conjugation.
Cyclic Ketones (Ring Strain). Figure 2.44 provides some values for the CJO absorptions for cyclicketones. Note that ring strain shifts the absorption values to a higher frequency, as was predicted in
14782_02_Ch2_p015-104.pp2.qxd 1/25/08 10:27 AM Page 60

2.14 Carbonyl Compounds 61
Section 2.14A (p. 55). Ketene is included in Figure 2.44 because it is an extreme example of an exodouble-bond absorption (see p. 41). The s character in the CJO group increases as the ring sizedecreases, until it reaches a maximum value that is found in the sp-hybridized carbonyl carbon inketene. The spectrum of cyclopentanone (Fig. 2.41) shows how ring strain increases the frequencyof the carbonyl group.
a -Diketones (1,2-Diketones). Unconjugated diketones that have the two carbonyl groups adjacentto each other show one strong absorption peak at about 1716 cm−1. If the two carbonyl groups areconjugated with aromatic rings, the absorption is shifted to a lower-frequency value, about 1680cm−1. In the latter case, a narrowly spaced doublet rather than a single peak may be observed due tosymmetric and asymmetric absorptions.
b-Diketones (1,3-Diketones). Diketones with carbonyl groups located 1,3 with respect to each othermay yield a more complicated pattern than those observed for most ketones (2,4-pentanedione,Fig. 2.42). These b-diketones often exhibit tautomerization, which yields an equilibrium mixture ofenol and keto tautomers. Since many b-diketones contain large amounts of the enol form, you mayobserve carbonyl peaks for both the enol and keto tautomers.
C
O O
CC
O O
C CH3CH3
1680 cm–11716 cm–1
F I G U R E 2 . 4 3 The CJO stretching vibrations in conjugated ketones.
F I G U R E 2 . 4 4 The CJO stretching vibrations for cyclic ketones and ketene.
14782_02_Ch2_p015-104.pp2.qxd 1/25/08 10:27 AM Page 61

62 Infrared Spectroscopy
The carbonyl group in the enol form appearing at about 1622 cm−1 is substantially shifted and inten-sified in comparison to the normal ketone value, 1715 cm−1. The shift is a result of internal hydrogenbonding, as discussed in Section 2.14A (p. 56). Resonance, however, also contributes to the lowering ofthe carbonyl frequency in the enol form. This effect introduces single-bond character into the enol form.
A weak, broad OIH stretch is observed for the enol form at 3200–2400 cm−1. Since the ketoform is also present, a doublet for the asymmetric and symmetric stretching frequencies is observedfor the two carbonyl groups (Fig. 2.42). The relative intensities of the enol and keto carbonylabsorptions depend on the percentages present at equilibrium. Hydrogen-bonded carbonyl groupsin enol forms are often observed in the region 1640–1570 cm−1. The keto forms generally appear asdoublets in the range from 1730 to 1695 cm−1.
a -Haloketones. Substitution of a halogen atom on the a carbon shifts the carbonyl absorption peakto a higher frequency, as discussed in Section 2.14A (p. 55). Similar shifts occur with other electron-withdrawing groups, such as an alkoxy group (IOICH3). For example, the carbonyl group inchloroacetone appears at 1750 cm−1, whereas that in methoxyacetone appears at 1731 cm−1. Whenthe more electronegative fluorine atom is attached, the frequency shifts to an even higher value,1781 cm−1, in fluoroacetone.
Bending Modes. A medium-to-strong absorption occurs in the range from 1300 to 1100 cm−1 forcoupled stretching and bending vibrations in the CICOIC group of ketones. Aliphatic ketones absorbto the right in this range (1220 to 1100 cm−1), as seen in the spectrum of 3-methyl-2-butanone (Fig. 2.4),where a band appears at about 1180 cm−1. Aromatic ketones absorb to the left in this range (1300 to 1220cm−1), as seen in the spectrum of acetophenone (Fig. 2.40), where a band appears at about 1260 cm−1.
A medium-intensity band appears for a methyl group adjacent to a carbonyl at about 1370 cm−1
for the symmetric bending vibration. These methyl groups absorb with greater intensity than methylgroups found in hydrocarbons.
HOO
CCCH CH3CH3
••••
••••
••••
••••
HOO
CCCH CH3CH3
••••
••••
••••
•••• +–
HOOO O
CCCH CH3CH3
C CCH3 CH3CH2
• • •
Keto tautomer Enol tautomer
C O doublet C O (hydrogen bonded), 1622 cm–1
O H (hydrogen bonded), 3200–2400 cm–11723 cm–1 (symmetric stretch)1706 cm–1 (asymmetric stretch)
Carboxylic acids show a very strong band for the CJO group that appears in the range of 1730–1700cm−1 for simple aliphatic carboxylic acids in the dimeric form (p. 53). This band is shifted to lowerfrequencies with conjugation to a CJC or phenyl group. The OIH stretch appears in the spectrum asa very broad band extending from 3400 to 2400 cm−1. This broad band centers on about 3000 cm−1
and partially obscures the CIH stretching bands. If this very broad OIH stretch band is seen alongwith a CJO peak, it almost certainly indicates the compound is a carboxylic acid.
D. Carboxylic Acids
14782_02_Ch2_p015-104.pp2.qxd 1/25/08 10:27 AM Page 62
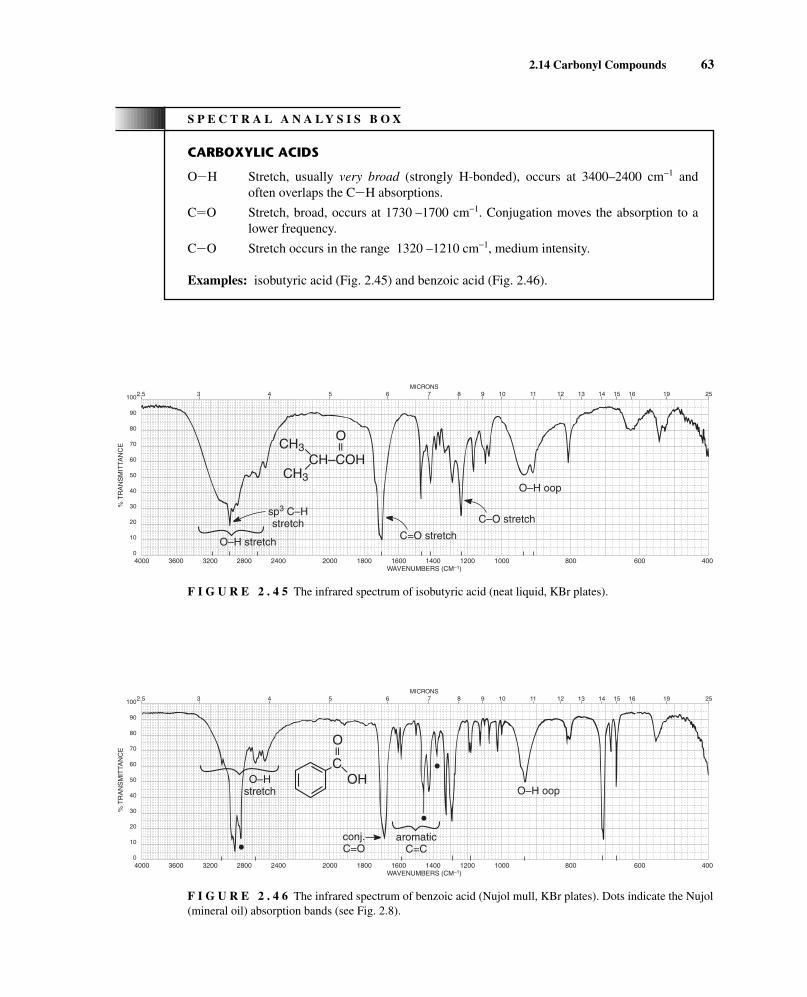
2.14 Carbonyl Compounds 63
S P E C T R A L A N A L Y S I S B O X
CARBOXYLIC ACIDS
OIH Stretch, usually very broad (strongly H-bonded), occurs at 3400–2400 cm−1 andoften overlaps the CIH absorptions.
CJO Stretch, broad, occurs at 1730 –1700 cm−1. Conjugation moves the absorption to alower frequency.
CIO Stretch occurs in the range 1320 –1210 cm−1, medium intensity.
Examples: isobutyric acid (Fig. 2.45) and benzoic acid (Fig. 2.46).
4000 3600 3200 2800 2400 2000 1800 1600 1400 1200 1000 800 600 400WAVENUMBERS (CM–1)
2.5 3 4 5 6 7 8 9 10 11 12 13 14 15 16 19 25100
90
80
70
60
50
40
30
20
10
0
MICRONS
% T
RA
NS
MIT
TAN
CE
CH–COH
O– ––
–
CH3
CH3
sp3 C–Hstretch
C=O stretch
C–O stretch
O–H oop
O–H stretch
F I G U R E 2 . 4 5 The infrared spectrum of isobutyric acid (neat liquid, KBr plates).
4000 3600 3200 2800 2400 2000 1800 1600 1400 1200 1000 800 600 400WAVENUMBERS (CM–1)
2.5 3 4 5 6 7 8 9 10 11 12 13 14 15 16 19 25100
90
80
70
60
50
40
30
20
10
0
MICRONS
% T
RA
NS
MIT
TAN
CE
O–Hstretch
conj.C=O
O–H oop
C
O– –
OH–
aromaticC=C
•
•
•
F I G U R E 2 . 4 6 The infrared spectrum of benzoic acid (Nujol mull, KBr plates). Dots indicate the Nujol(mineral oil) absorption bands (see Fig. 2.8).
14782_02_Ch2_p015-104.pp2.qxd 1/25/08 10:27 AM Page 63

64 Infrared Spectroscopy
D I S C U S S I O N S E C T I O N
The most characteristic feature in the spectrum of a carboxylic acid is the extremely broad OIHabsorption occurring in the region from 3400 to 2400 cm−1. This band is attributed to the stronghydrogen bonding present in the dimer, which was discussed in the introduction to Section 2.14 (p. 53). The absorption often obscures the CIH stretching vibrations that occur in the same region.If this broad hydrogen-bonded band is present together with the proper CJO absorption value, acarboxylic acid is almost certainly indicated. Figures 2.45 and 2.46 show the spectra of an aliphaticcarboxylic acid and an aromatic carboxylic acid, respectively.
The carbonyl stretching absorption, which occurs at about 1730 to 1700 cm−1 for the dimer, is usuallybroader and more intense than that present in an aldehyde or a ketone. For most acids, when the acid isdiluted with a solvent, the CJO absorption appears between 1760 and 1730 cm−1 for the monomer.However, the monomer is not often seen experimentally since it is usually easier to run the spectrum asa neat liquid. Under these conditions, as well as in a potassium bromide pellet or a Nujol mull, the dimerexists. It should be noted that some acids exist as dimers even at high dilution. Conjugation with a CJCor aryl group usually shifts the absorption band to a lower frequency, as predicted in Section 2.14A(p. 54) and as shown in the spectrum of benzoic acid (Fig. 2.46). Halogenation on the a carbon leads toan increase in the CJO frequency. Section 2.18 discusses salts of carboxylic acids.
The CIO stretching vibration for acids (dimer) appears near 1260 cm−1 as a medium-intensityband. A broad band, attributed to the hydrogen-bonded OIH out-of-plane bending vibration,appears at about 930 cm−1. This latter band is usually of low-to-medium intensity.
Esters show a very strong band for the CJO group that appears in the range of 1750–1735 cm−1 forsimple aliphatic esters. The CJO band is shifted to lower frequencies when it is conjugated to a CJCor phenyl group. On the other hand, conjugation of a CJC or phenyl group with the single-bondedoxygen of an ester leads to an increased frequency from the range given above. Ring strain moves theCJO absorption to a higher frequency in cyclic esters (lactones).
E. Esters
S P E C T R A L A N A L Y S I S B O X
ESTERS
CJO
CJO stretch appears in the range 1750–1735 cm−1 for normalaliphatic esters.
Conjugation of CJO with a,b CJC; 1740–1715 cm−1 for CJO and1640–1625 cm−1 for CJC (two bands for some CJC, cis and trans,p. 54).
Conjugation of CJO with phenyl; 1740–1715 cm−1 for CJO and1600–1450 cm−1 for ring.
O
CAr O R
O
CCC O R
O
CR RO
14782_02_Ch2_p015-104.pp2.qxd 1/25/08 10:27 AM Page 64

4000 3600 3200 2800 2400 2000 1800 1600 1400 1200 1000 800 600 400WAVENUMBERS (CM–1)
2.5 3 4 5 6 7 8 9 10 11 12 13 14 15 16 19 25100
90
80
70
60
50
40
30
20
10
0
MICRONS
% T
RA
NS
MIT
TAN
CE C O
overtone
C Ostretch
–– C–O stretchCH3CH2CH2COCH2CH3
––
Osp3 C–Hstretch
––
F I G U R E 2 . 4 7 The infrared spectrum of ethyl butyrate (neat liquid, KBr plates).
2.14 Carbonyl Compounds 65
Conjugation of a single-bonded oxygen atom with CJC or phenyl;1765–1762 cm−1 for CJO.
Cyclic esters (lactones); CJO frequency increases with decreasing ringsize.
CIO Stretch in two or more bands, one stronger and broader than theother, occurs in the range 1300–1000 cm−1.
Examples: ethyl butyrate (Fig. 2.47), methyl methacrylate (Fig. 2.48), vinyl acetate (Fig. 2.49),methyl benzoate (Fig. 2.50), and methyl salicylate (Fig. 2.51).
OO
C
O
C CCOR
4000 3600 3200 2800 2400 2000 1800 1600 1400 1200 1000 800 600 400WAVENUMBERS (CM–1)
2.5 3 4 5 6 7 8 9 10 11 12 13 14 15 16 19 25100
90
80
70
60
50
40
30
20
10
0
MICRONS
% T
RA
NS
MIT
TAN
CE
C–Hstretch
C–O stretch
1,1 - disubst. oop
––C C––––
H CH3
H C–OCH3––
O
conj.C C––
conj.C O––
F I G U R E 2 . 4 8 The infrared spectrum of methyl methacrylate (neat liquid, KBr plates).
14782_02_Ch2_p015-104.pp2.qxd 1/25/08 10:27 AM Page 65
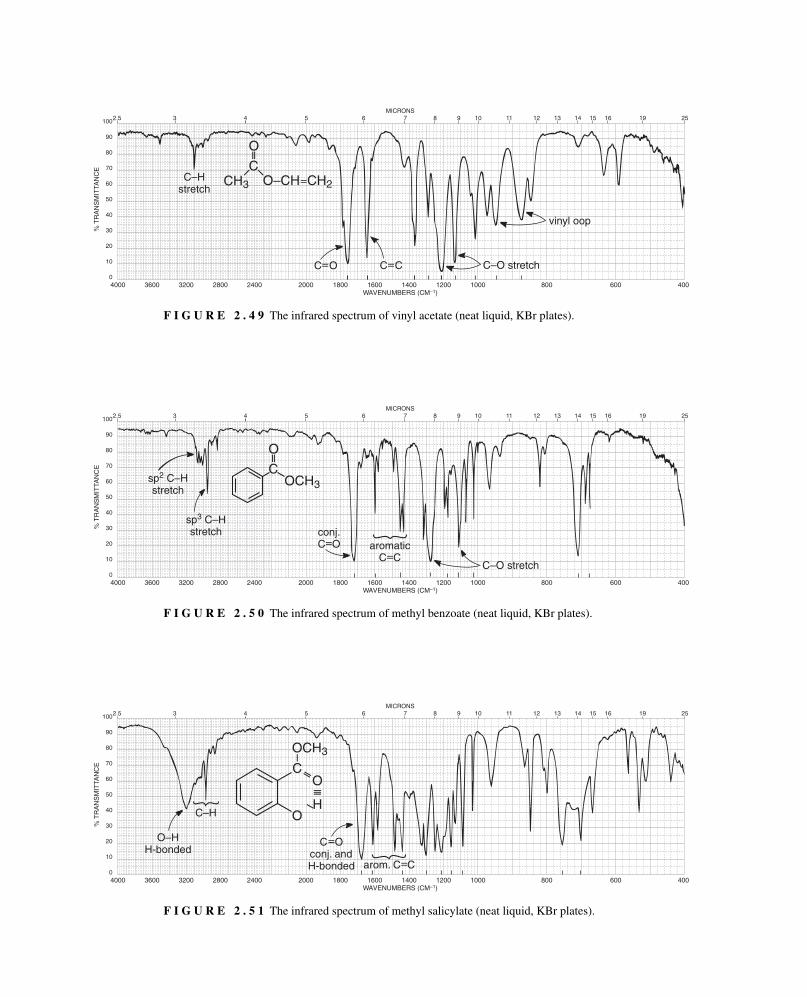
4000 3600 3200 2800 2400 2000 1800 1600 1400 1200 1000 800 600 400WAVENUMBERS (CM–1)
2.5 3 4 5 6 7 8 9 10 11 12 13 14 15 16 19 25100
90
80
70
60
50
40
30
20
10
0
MICRONS
% T
RA
NS
MIT
TAN
CE
C–Hstretch
C–O stretch
C
– –
––
O
CH3 O–CH CH2
––
C O
–– C C
––
vinyl oop
F I G U R E 2 . 4 9 The infrared spectrum of vinyl acetate (neat liquid, KBr plates).
4000 3600 3200 2800 2400 2000 1800 1600 1400 1200 1000 800 600 400WAVENUMBERS (CM–1)
2.5 3 4 5 6 7 8 9 10 11 12 13 14 15 16 19 25100
90
80
70
60
50
40
30
20
10
0
MICRONS
% T
RA
NS
MIT
TAN
CE
sp2 C–Hstretch
C–O stretch
sp3 C–Hstretch conj.
C O
––
aromaticC C
––
C
– –O
OCH3
F I G U R E 2 . 5 0 The infrared spectrum of methyl benzoate (neat liquid, KBr plates).
4000 3600 3200 2800 2400 2000 1800 1600 1400 1200 1000 800 600 400WAVENUMBERS (CM–1)
2.5 3 4 5 6 7 8 9 10 11 12 13 14 15 16 19 25100
90
80
70
60
50
40
30
20
10
0
MICRONS
% T
RA
NS
MIT
TAN
CE
O–HH-bonded
C–H
C Oconj. andH-bonded
––
arom. C C
––
O
–––––
OCH3
C
–
–
O
H
F I G U R E 2 . 5 1 The infrared spectrum of methyl salicylate (neat liquid, KBr plates).
14782_02_Ch2_p015-104.pp2.qxd 1/25/08 10:27 AM Page 66

2.14 Carbonyl Compounds 67
D I S C U S S I O N S E C T I O N
General Features of Esters. The two most characteristic features in the spectrum of a normal esterare the strong CJO, which appears in the range from 1750 to 1735 cm−1, and CIO stretchingabsorptions, which appear in the range from 1300 to 1000 cm−1. Although some ester carbonylgroups may appear in the same general area as ketones, one can usually eliminate ketones from con-sideration by observing the strong and broad CIO stretching vibrations that appear in a region(1300 to 1000 cm−1) where ketonic absorptions appear as weaker and narrower bands. For example,compare the spectrum of a ketone, mesityl oxide (Fig. 2.39) with that of an ester, ethyl butyrate(Fig. 2.47) in the 1300- to 1000-cm−1 region. Ethyl butyrate (Fig. 2.47) shows the typical CJOstretching vibration at about 1738 cm−1.
Conjugation with a Carbonyl Group (a,b Unsaturation or Aryl Substitution). The CJO stretchingvibrations are shifted by about 15 to 25 cm−1 to lower frequencies with a,b unsaturation or aryl sub-stitution, as predicted in Section 2.14A (Conjugation Effects, p. 54). The spectra of both methylmethacrylate (Fig. 2.48) and methyl benzoate (Fig. 2.50) show the CJO absorption shift from theposition in a normal ester, ethyl butyrate (Fig. 2.47). Also notice that the CJC absorption band at1630 cm−1 in methyl methacrylate has been intensified over what is obtained with a nonconjugateddouble bond (Section 2.10B).
Conjugation with the Ester Single-Bonded Oxygen. Conjugation involving the single-bonded oxy-gen shifts the CJO vibrations to higher frequencies. Apparently, the conjugation interferes withpossible resonance with the carbonyl group, leading to an increase in the absorption frequency forthe CJO band.
In the spectrum of vinyl acetate (Fig. 2.49), the CJO band appears at 1762 cm−1, an increase of25 cm−1 above a normal ester. Notice that the CJC absorption intensity is increased in a mannersimilar to the pattern obtained with vinyl ethers (Section 2.13). The substitution of an aryl group onthe oxygen would exhibit a similar pattern.
CH3CH2CH2C
O O O
O
Ethyl butyrate1738 cm–1
CH3C CH2OCH CH3C
Vinyl acetate1762 cm–1
Phenyl acetate1765 cm–1
OCH2CH3
O
O
C
CR
CH2
H•• ••
• •
O
O
C
CR
CH2
H•• ••
••••
+
–
CH3CH2CH2COCH2CH3
O O O
Ethyl butyrate1738 cm–1
CH2
CH3
C COCH3 C OCH3αβ
Methyl methacrylate1725 cm–1
Methyl benzoate1724 cm–1
14782_02_Ch2_p015-104.pp2.qxd 1/25/08 10:27 AM Page 67
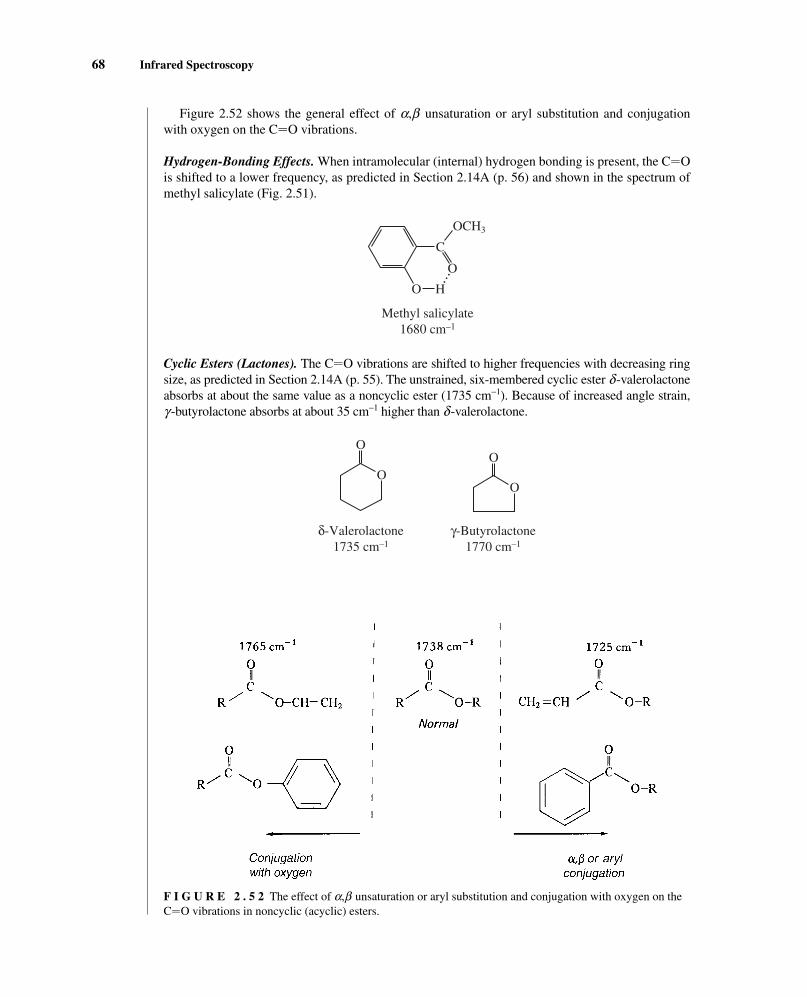
68 Infrared Spectroscopy
Figure 2.52 shows the general effect of a,b unsaturation or aryl substitution and conjugationwith oxygen on the CJO vibrations.
Hydrogen-Bonding Effects. When intramolecular (internal) hydrogen bonding is present, the CJOis shifted to a lower frequency, as predicted in Section 2.14A (p. 56) and shown in the spectrum ofmethyl salicylate (Fig. 2.51).
Cyclic Esters (Lactones). The CJO vibrations are shifted to higher frequencies with decreasing ringsize, as predicted in Section 2.14A (p. 55). The unstrained, six-membered cyclic ester d-valerolactoneabsorbs at about the same value as a noncyclic ester (1735 cm−1). Because of increased angle strain,g -butyrolactone absorbs at about 35 cm−1 higher than d-valerolactone.
δ-Valerolactone1735 cm–1
OO
OO
γ-Butyrolactone1770 cm–1
O
O
C
H
OCH3
Methyl salicylate1680 cm–1
•••
F I G U R E 2 . 5 2 The effect of a,b unsaturation or aryl substitution and conjugation with oxygen on theCJO vibrations in noncyclic (acyclic) esters.
14782_02_Ch2_p015-104.pp2.qxd 1/25/08 10:27 AM Page 68

2.14 Carbonyl Compounds 69
Table 2.8 presents some typical lactones together with their CJO stretching absorption values.Inspection of these values reveals the influence of ring size, conjugation with a carbonyl group, andconjugation with the single-bond oxygen.
a -Halo Effects. Halogenation on the a carbon leads to an increase in the CJO frequency.
a -Keto Esters. In principle, one should see two carbonyl groups for a compound with “ketone” and“ester” functional groups. Usually, one sees a shoulder on the main absorption band near 1735 cm−1
or a single broadened absorption band.
b -Keto Esters. Although this class of compounds exhibits tautomerization like that observed inb -diketones (p. 61), less evidence exists for the enol form because b -keto esters do not enolize to asgreat an extent. b -Keto esters exhibit a strong-intensity doublet for the two carbonyl groups at about1720 and 1740 cm−1 in the “keto” tautomer, presumably for the ketone and ester CJO groups.Evidence for the weak-intensity CJO band in the “enol” tautomer (often a doublet) appears at about1650 cm−1. Because of the low concentration of the enol tautomer, one generally cannot observe thebroad OIH stretch that was observed in b -diketones.
O O
C C OR Rα
TA B L E 2 . 8EFFECTS OF RING SIZE, a,b UNSATURATION, AND CONJUGATION WITH OXYGEN ON THE CJO VIBRATIONS IN LACTONES
Ring-Size Effects (cm–1) a,b Conjugation (cm–1) Conjugation with Oxygen (cm–1)
O
O
O
O
O
O
O
O
O
O
O
O
O
O
1735 1725 1760
1750 18001770
1820
14782_02_Ch2_p015-104.pp2.qxd 1/25/08 10:27 AM Page 69

CIO Stretching Vibrations in Esters. Two (or more) bands appear for the CIO stretching vibra-tions in esters in the range from 1300 to 1000 cm−1. Generally, the CIO stretch next to the carbonylgroup (the “acid” side) of the ester is one of the strongest and broadest bands in the spectrum. Thisabsorption appears between 1300 and 1150 cm−1 for most common esters; esters of aromatic acidsabsorb nearer the higher-frequency end of this range, and esters of saturated acids absorb nearer thelower-frequency end. The CIO stretch for the “alcohol” part of the ester may appear as a weakerband in the range from 1150 to 1000 cm−1. In analyzing the 1300- to 1000-cm−1 region to confirman ester functional group, do not worry about fine details. It is usually sufficient to find at least onevery strong and broad absorption to help identify the compound as an ester.
HOOO O
CCCH O RO R R
C CR CH2
•••
Keto tautomer Enol tautomer
αβ
αβ
70 Infrared Spectroscopy
S P E C T R A L A N A L Y S I S B O X
AMIDES
CJO Stretch occurs at approximately 1680 –1630 cm−1.
NIH Stretch in primary amides (INH2) gives two bands near 3350 and 3180 cm−1.Secondary amides have one band (INH) at about 3300 cm−1.
NIH Bending occurs around 1640 –1550 cm−1 for primary and secondary amides.
Examples: propionamide (Fig. 2.53) and N-methylacetamide (Fig. 2.54).
Amides show a very strong band for the CJO group that appears in the range of 1680–1630 cm−1. TheNIH stretch is observed in the range of 3475–3150 cm−1. Unsubstituted (primary) amides,RICOINH2, show two bands in the NIH region, while monosubstituted (secondary) amides,RICOINHIR, show only one band. The presence of NIH bands plus an unusually low value for the CJO would suggest the presence of an amide functional group. Disubstituted (tertiary) amides,RICOINR2, will show the CJO in the range of 1680–1630 cm−1, but will not show an NIH stretch.
F. Amides
4000 3600 3200 2800 2400 2000 1800 1600 1400 1200 1000 800 600 400WAVENUMBERS (CM–1)
2.5 3 4 5 6 7 8 9 10 11 12 13 14 15 16 19 25100
90
80
70
60
50
40
30
20
10
0
MICRONS
% T
RA
NS
MIT
TAN
CE
N–H oop
C–N stretchNH2stretch
CH3CH2CH2C–N–
–
H
H
O– –
overlapN–H bend
C O stretch
––• ••
F I G U R E 2 . 5 3 The infrared spectrum of propionamide (Nujol mull, KBr plates). Dots indicate theNujol (mineral oil) absorption bands (see Fig. 2.8).
14782_02_Ch2_p015-104.pp2.qxd 1/25/08 10:27 AM Page 70

2.14 Carbonyl Compounds 71
4000 3600 3200 2800 2400 2000 1800 1600 1400 1200 1000 800 600 400WAVENUMBERS (CM–1)
2.5 3 4 5 6 7 8 9 10 11 12 13 14 15 16 19 25100
90
80
70
60
50
40
30
20
10
0
MICRONS%
TR
AN
SM
ITTA
NC
E
CH3C–N–H
CH3
O
–– –
N–Hstretch
N–HoopC–H
stretch
overtone of1550 cm–1 C O
–– N–H bend
F I G U R E 2 . 5 4 The infrared spectrum of N-methylacetamide (neat liquid, KBr plates).
D I S C U S S I O N S E C T I O N
Carbonyl Absorption in Amides. Primary and secondary amides in the solid phase (potassium bro-mide pellet or Nujol) have broad CJO absorptions in the range from 1680 to 1630 cm−1. The CJOband partially overlaps the NIH bending band which appears in the range 1640–1620 cm−1, mak-ing the CJO band appear as a doublet. In very dilute solution, the band appears at about 1690 cm−1.This effect is similar to that observed for carboxylic acids, in which hydrogen bonding reduces thefrequency in the solid state or in concentrated solution. Tertiary amides, which cannot form hydro-gen bonds, have CJO frequencies that are not influenced by the physical state and absorb in aboutthe same range as do primary and secondary amides (1680 –1630 cm−1).
Cyclic amides (lactams) give the expected increase in CJO frequency for decreasing ring size, asshown for lactones in Table 2.8.
NIH and CIN Stretching Bands. A pair of fairly strong NIH stretching bands appears at about3350 cm−1 and 3180 cm−1 for a primary amide in the solid state (KBr or Nujol). The 3350- and3180-cm−1 bands result from the asymmetric and symmetric vibrations, respectively (Section 2.3).Figure 2.53 shows an example, the spectrum of propionamide. In the solid state, secondary amidesand lactams give one band at about 3300 cm−1. A weaker band may appear at about 3100 cm−1 insecondary amides; it is attributed to a Fermi resonance overtone of the 1550-cm−1 band. A CINstretching band appears at about 1400 cm−1 for primary amides.
OO
ON HN H
N H
~1660 cm–1 ~1705 cm–1 ~1745 cm–1
O
CR NH
H
O
CR NH
R
O
CR NR
R
Primary amide Secondary amide Tertiary amide
14782_02_Ch2_p015-104.pp2.qxd 1/25/08 10:27 AM Page 71

72 Infrared Spectroscopy
S P E C T R A L A N A L Y S I S B O X
ACID CHLORIDES
CJO Stretch occurs in the range 1810–1775 cm−1 in unconjugated chlorides. Conjugationlowers the frequency to 1780–1760 cm−1.
CICl Stretch occurs in the range 730–550 cm−1.
Examples: acetyl chloride (Fig. 2.55) and benzoyl chloride (Fig. 2.56).
NIH Bending Bands. In the solid state, primary amides give strong bending vibrational bands inthe range from 1640 to 1620 cm−1. They often nearly overlap the CJO stretching bands. Primaryamides give other bending bands at about 1125 cm−1 and a very broad band in the range from 750 to600 cm−1. Secondary amides give relatively strong bending bands at about 1550 cm−1; these are at-tributed to a combination of a CIN stretching band and an NIH bending band.
Acid chlorides show a very strong band for the CJO group that appears in the range of 1810–1775 cm−1
for aliphatic acid chlorides. Acid chloride and anhydrides are the most common functional groups thathave a CJO appearing at such a high frequency. Conjugation lowers the frequency.
G. Acid Chlorides
4000 3600 3200 2800 2400 2000 1800 1600 1400 1200 1000 800 600 400WAVENUMBERS (CM–1)
2.5 3 4 5 6 7 8 9 10 11 12 13 14 15 16 19 25100
90
80
70
60
50
40
30
20
10
0
MICRONS
% T
RA
NS
MIT
TAN
CE
CH3 C–Cl
O– –C–H
of C O
––
overtone
C O
––
C–Cl
F I G U R E 2 . 5 5 The infrared spectrum of acetyl chloride (neat liquid, KBr plates).
4000 3600 3200 2800 2400 2000 1800 1600 1400 1200 1000 800 600 400WAVENUMBERS (CM–1)
2.5 3 4 5 6 7 8 9 10 11 12 13 14 15 16 19 25100
90
80
70
60
50
40
30
20
10
0
MICRONS
% T
RA
NS
MIT
TAN
CE
CCl
O– –
Ar–C C–ClFermiresonance
C–H
conj.C O C C–– ––
F I G U R E 2 . 5 6 The infrared spectrum of benzoyl chloride (neat liquid, KBr plates).
14782_02_Ch2_p015-104.pp2.qxd 1/25/08 10:27 AM Page 72

2.14 Carbonyl Compounds 73
D I S C U S S I O N S E C T I O N
CJO Stretching Vibrations. By far the most common acid halides, and the only ones discussed inthis book, are acid chlorides. The strong carbonyl absorption appears at a characteristically high fre-quency of about 1800 cm−1 for saturated acid chlorides. Figure 2.55 shows the spectrum of acetylchloride. Conjugated acid chlorides absorb at a lower frequency (1780 to 1760 cm−1), as predictedin Section 2.14A (p. 54). Figure 2.56 shows an example of an aryl-substituted acid chloride,benzoyl chloride. In this spectrum, the main absorption occurs at 1774 cm−1, but a weak shoulderappears on the higher-frequency side of the CJO band (about 1810 cm−1). The shoulder is probablythe result of an overtone of a strong band in the 1000- to 900-cm−1 range. A weak band is also seenat about 1900 cm−1 in the spectrum of acetyl chloride (Fig. 2.55). Sometimes, this overtone band isrelatively strong.
In some aromatic acid chlorides, one may observe another rather strong band, often on the lower-frequency side of the CJO band, which makes the CJO appear as a doublet. This band, which ap-pears in the spectrum of benzoyl chloride (Fig. 2.56) at about 1730 cm−1, is probably a Fermiresonance band originating from an interaction of the CJO vibration, with an overtone of a strongband for aryl-C stretch often appearing in the range from 900 to 800 cm−1. When a fundamentalvibration couples with an overtone or combination band, the coupled vibration is called Fermi reso-nance. The Fermi resonance band may also appear on the higher-frequency side of the CJO in manyaromatic acid chlorides. This type of interaction can lead to splitting in other carbonyl compoundsas well.
CICl Stretching Vibrations. These bands, which appear in the range from 730 to 550 cm−1, arebest observed if KBr plates or cells are used. One strong CICl band appears in the spectrum ofacetyl chloride. In other aliphatic acid chlorides, one may observe as many as four bands due to themany conformations that are possible.
Anhydrides show two strong bands for the CJO groups. Simple alkyl-substituted anhydrides gen-erally give bands near 1820 and 1750 cm−1. Anhydrides and acid chlorides are the most commonfunctional groups that have a CJO peak appearing at such a high frequency. Conjugation shiftseach of the bands to lower frequencies (about 30 cm−1 each). Simple five-membered ring anhy-drides have bands at near 1860 and 1780 cm−1.
H. Anhydrides
S P E C T R A L A N A L Y S I S B O X
ANHYDRIDES
CJO Stretch always has two bands, 1830–1800 cm−1 and 1775–1740 cm−1, with variablerelative intensity. Conjugation moves the absorption to a lower frequency. Ring strain(cyclic anhydrides) moves the absorptions to a higher frequency.
CIO Stretch (multiple bands) occurs in the range 1300–900 cm−1.
Example: propionic anhydride (Fig. 2.57).
14782_02_Ch2_p015-104.pp2.qxd 1/25/08 10:27 AM Page 73
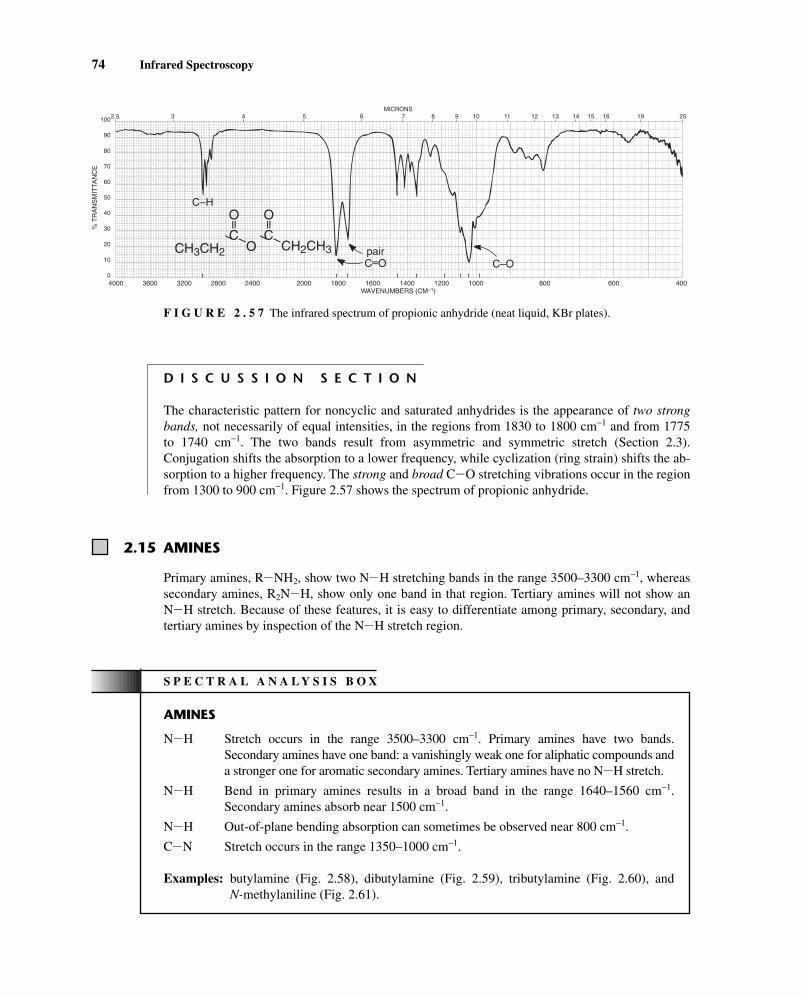
74 Infrared Spectroscopy
4000 3600 3200 2800 2400 2000 1800 1600 1400 1200 1000 800 600 400WAVENUMBERS (CM–1)
2.5 3 4 5 6 7 8 9 10 11 12 13 14 15 16 19 25100
90
80
70
60
50
40
30
20
10
0
MICRONS
% T
RA
NS
MIT
TAN
CE
C–H
pairC O C–O
CH3CH2 O CH2CH3
O– –
C––
O– –
C––
––
F I G U R E 2 . 5 7 The infrared spectrum of propionic anhydride (neat liquid, KBr plates).
S P E C T R A L A N A L Y S I S B O X
AMINES
NIH Stretch occurs in the range 3500–3300 cm−1. Primary amines have two bands.Secondary amines have one band: a vanishingly weak one for aliphatic compounds anda stronger one for aromatic secondary amines. Tertiary amines have no NIH stretch.
NIH Bend in primary amines results in a broad band in the range 1640–1560 cm−1.Secondary amines absorb near 1500 cm−1.
NIH Out-of-plane bending absorption can sometimes be observed near 800 cm−1.
CIN Stretch occurs in the range 1350–1000 cm−1.
Examples: butylamine (Fig. 2.58), dibutylamine (Fig. 2.59), tributylamine (Fig. 2.60), andN-methylaniline (Fig. 2.61).
D I S C U S S I O N S E C T I O N
The characteristic pattern for noncyclic and saturated anhydrides is the appearance of two strongbands, not necessarily of equal intensities, in the regions from 1830 to 1800 cm−1 and from 1775to 1740 cm−1. The two bands result from asymmetric and symmetric stretch (Section 2.3).Conjugation shifts the absorption to a lower frequency, while cyclization (ring strain) shifts the ab-sorption to a higher frequency. The strong and broad CIO stretching vibrations occur in the regionfrom 1300 to 900 cm−1. Figure 2.57 shows the spectrum of propionic anhydride.
2.15 AMINES
Primary amines, RINH2, show two NIH stretching bands in the range 3500–3300 cm−1, whereassecondary amines, R2NIH, show only one band in that region. Tertiary amines will not show anNIH stretch. Because of these features, it is easy to differentiate among primary, secondary, andtertiary amines by inspection of the NIH stretch region.
14782_02_Ch2_p015-104.pp2.qxd 1/25/08 10:27 AM Page 74

4000 3600 3200 2800 2400 2000 1800 1600 1400 1200 1000 800 600 400WAVENUMBERS (CM–1)
2.5 3 4 5 6 7 8 9 10 11 12 13 14 15 16 19 25100
90
80
70
60
50
40
30
20
10
0
MICRONS%
TR
AN
SM
ITTA
NC
E
CH3CH2CH2CH2–Novertoneof 1600 cm–1
NH2stretch
C–H stretch
N–H
CH2
CH3C–N
stretch
N–H oopbends
––
H
H
F I G U R E 2 . 5 8 The infrared spectrum of butylamine (neat liquid, KBr plates).
4000 3600 3200 2800 2400 2000 1800 1600 1400 1200 1000 800 600 400WAVENUMBERS (CM–1)
2.5 3 4 5 6 7 8 9 10 11 12 13 14 15 16 19 25100
90
80
70
60
50
40
30
20
10
0
MICRONS
% T
RA
NS
MIT
TAN
CE N–H
stretch
C–H stretch CH2 bend C–Nstretch
N–H oop
F I G U R E 2 . 5 9 The infrared spectrum of dibutylamine (neat liquid, KBr plates).
4000 3600 3200 2800 2400 2000 1800 1600 1400 1200 1000 800 600 400WAVENUMBERS (CM–1)
2.5 3 4 5 6 7 8 9 10 11 12 13 14 15 16 19 25100
90
80
70
60
50
40
30
20
10
0
MICRONS
% T
RA
NS
MIT
TAN
CE
(CH3CH2CH2CH2)3N
C–H stretch
CH2bend
C–Nstretch
CH3bend
F I G U R E 2 . 6 0 The infrared spectrum of tributylamine (neat liquid, KBr plates).
14782_02_Ch2_p015-104.pp2.qxd 1/25/08 10:27 AM Page 75

76 Infrared Spectroscopy
D I S C U S S I O N S E C T I O N
The NIH stretching vibrations occur in the range from 3500 to 3300 cm−1. In neat liquid samples,the NIH bands are often weaker and sharper than an OIH band (see Fig. 2.6). Amines may some-times be differentiated from alcohols on that basis. Primary amines, determined as neat liquids (hy-drogen bonded), give two bands at about 3400 and 3300 cm−1. The higher-frequency band in thepair is due to the asymmetric vibration, whereas the lower-frequency band results from a symmetricvibration (Section 2.3). In dilute solution, the two free NIH stretching vibrations are shifted tohigher frequencies. Figure 2.58 shows the spectrum of an aliphatic primary amine. A low-intensityshoulder appears at about 3200 cm−1 on the low-frequency side of the symmetric NIH stretchingband. This low-intensity band has been attributed to an overtone of the NIH bending vibration thatappears near 1600 cm−1. The 3200-cm−1 shoulder has been enhanced by a Fermi resonance interac-tion with the symmetric NIH stretching band near 3300 cm−1. The overtone band is often evenmore pronounced in aromatic primary amines.
Aliphatic secondary amines determined as neat liquids give one band in the NIH stretching re-gion at about 3300 cm−1, but the band is often vanishingly weak. On the other hand, an aromaticsecondary amine gives a stronger NIH band near 3400 cm−1. Figures 2.59 and 2.61 are the spectraof an aliphatic secondary amine and an aromatic secondary amine, respectively. Tertiary amines donot absorb in this region, as shown in Figure 2.60.
In primary amines, the NIH bending mode (scissoring) appears as a medium- to strong-intensity(broad) band in the range from 1640 to 1560 cm−1. In aromatic secondary amines, the band shifts toa lower frequency and appears near 1500 cm−1. However, in aliphatic secondary amines the NIHbending vibration is very weak and usually is not observed. The NIH vibrations in aromatic com-pounds often overlap the aromatic CJC ring absorptions, which also appear in this region. An out-of-plane NIH bending vibration appears as a broad band near 800 cm−1 for primary and secondaryamines. These bands appear in the spectra of compounds determined as neat liquids and are seenmost easily in aliphatic amines (Figs. 2.58 and 2.59).
The CIN stretching absorption occurs in the region from 1350 to 1000 cm−1 as a medium tostrong band for all amines. Aliphatic amines absorb from 1250 to 1000 cm−1, whereas aromaticamines absorb from 1350 to 1250 cm−1. The CIN absorption occurs at a higher frequency in aro-matic amines because resonance increases the double-bond character between the ring and the at-tached nitrogen atom.
4000 3600 3200 2800 2400 2000 1800 1600 1400 1200 1000 800 600 400WAVENUMBERS (CM–1)
2.5 3 4 5 6 7 8 9 10 11 12 13 14 15 16 19 25100
90
80
70
60
50
40
30
20
10
0
MICRONS
% T
RA
NS
MIT
TAN
CE
NCH3––H
C–Hstretch
N–Hstretch N–H bend
C–N stretch
mono subst.oopC=C
F I G U R E 2 . 6 1 The infrared spectrum of N-methylaniline (neat liquid, KBr plates).
14782_02_Ch2_p015-104.pp2.qxd 1/25/08 10:27 AM Page 76

2.16 Nitriles, Isocyanates, Isothiocyanates, and Imines 77
S P E C T R A L A N A L Y S I S B O X
NITRILES RICKN
ICKN Stretch is a medium-intensity, sharp absorption near 2250 cm−1. Conjugationwith double bonds or aromatic rings moves the absorption to a lower frequency.
Examples: butyronitrile (Fig. 2.62) and benzonitrile (Fig. 2.63).
ISOCYANATES RINJCJO
INJCJO Stretch in an isocyanate gives a broad, intense absorption near 2270 cm−1.
Example: benzyl isocyanate (Fig. 2.64).
ISOTHIOCYANATES RINJCJS
INJCJS Stretch in an isothiocyanate gives one or two broad, intense absorptions center-ing near 2125 cm−1.
IMINES R2CJNIR
ICJNI Stretch in an imine, oxime, and so on gives a variable-intensity absorptionL in the range 1690–1640 cm−1.
4000 3600 3200 2800 2400 2000 1800 1600 1400 1200 1000 800 600 400WAVENUMBERS (CM–1)
2.5 3 4 5 6 7 8 9 10 11 12 13 14 15 16 19 25100
90
80
70
60
50
40
30
20
10
0
MICRONS
% T
RA
NS
MIT
TAN
CE
CH3CH2CH2C N–––
–––C Nstretch
C–H stretch
F I G U R E 2 . 6 2 The infrared spectrum of butyronitrile (neat liquid, KBr plates).
2.16 NITRILES, ISOCYANATES, ISOTHIOCYANATES, AND IMINES
Nitriles, isocyanates, and isothiocyanates all have sp-hydridized carbon atoms similar to the CKCbond. They absorb in the region 2100–2270 cm−1. On the other hand, the CJN bond of an imine hasan sp2 carbon atom. Imines and similar compounds absorb near where double bonds appear,1690–1640 cm−1.
14782_02_Ch2_p015-104.pp2.qxd 1/25/08 10:27 AM Page 77

78 Infrared Spectroscopy
4000 3600 3200 2800 2400 2000 1800 1600 1400 1200 1000 800 600 400WAVENUMBERS (CM–1)
2.5 3 4 5 6 7 8 9 10 11 12 13 14 15 16 19 25100
90
80
70
60
50
40
30
20
10
0
MICRONS
% T
RA
NS
MIT
TAN
CE
– – –
N
C
arom. C Cstretch
––
C N stretch
–––
C–Hstretch
mono subst. oop
F I G U R E 2 . 6 3 The infrared spectrum of benzonitrile (neat liquid, KBr plates).
4000 3600 3200 2800 2400 2000 1800 1600 1400 1200 1000 800 600 400WAVENUMBERS (CM–1)
2.5 3 4 5 6 7 8 9 10 11 12 13 14 15 16 19 25100
90
80
70
60
50
40
30
20
10
0
MICRONS
% T
RA
NS
MIT
TAN
CE
CH2–N–– ––C O
arom. C Cstretch
––
C–Hstretch
N C Ostretch
–– –– mono subst.oop
F I G U R E 2 . 6 4 The infrared spectrum of benzyl isocyanate (neat liquid, KBr plates).
D I S C U S S I O N S E C T I O N
sp-Hybridized Carbon. The CKN group in a nitrile gives a medium-intensity, sharp band in thetriple-bond region of the spectrum (2270 to 2210 cm−1). The CKC bond, which absorbs near this re-gion (2150 cm−1), usually gives a weaker and broader band unless it is at the end of the chain.Aliphatic nitriles absorb at about 2250 cm−1, whereas their aromatic counterparts absorb at lowerfrequencies, near 2230 cm−1. Figures 2.62 and 2.63 are the spectra of an aliphatic nitrile and anaromatic nitrile, respectively. Aromatic nitriles absorb at lower frequencies with increased intensitybecause of conjugation of the triple bond with the ring. Isocynanates also contain an sp-hybridizedcarbon atom (RINJCJO). This class of compounds gives a broad, intense band at about 2270 cm−1
(Fig. 2.64).
sp2-Hybridized Carbon. The CJN bond absorbs in about the same range as a CJC bond. Althoughthe CJN band varies in intensity from compound to compound, it usually is more intense than thatobtained from the CJC bond. An oxime (RICHJNIOIH) gives a CJN absorption in the rangefrom 1690 to 1640 cm−1 and a broad OIH absorption between 3650 and 2600 cm−1. An imine(RICHJNIR) gives a CJN absorption in the range from 1690 to 1650 cm−1.
14782_02_Ch2_p015-104.pp2.qxd 1/25/08 10:27 AM Page 78

2.17 Nitro Compounds 79
2.17 NITRO COMPOUNDS
Nitro compounds show two strong bands in the infrared spectrum. One appears near 1550 cm−1 andthe other near 1350 cm−1. Although these two bands may partially overlap the aromatic ring region,1600–1450 cm−1, it is usually easy to see the NO2 peaks.
S P E C T R A L A N A L Y S I S B O X
NITRO COMPOUNDS
Aliphatic nitro compounds: asymmetric stretch (strong), 1600–1530 cm−1;symmetric stretch (medium), 1390–1300 cm−1.
Aromatic nitro compounds (conjugated): asymmetric stretch (strong),1550–1490 cm−1; symmetric stretch (strong), 1355–1315 cm−1.
Examples: 1-nitrohexane (Fig. 2.65) and nitrobenzene (Fig. 2.66).
NO
O
+ –
4000 3600 3200 2800 2400 2000 1800 1600 1400 1200 1000 800 600 400WAVENUMBERS (CM–1)
2.5 3 4 5 6 7 8 9 10 11 12 13 14 15 16 19 25100
90
80
70
60
50
40
30
20
10
0
MICRONS
% T
RA
NS
MIT
TAN
CE
CH2(CH2)4CH2–N––O
–O–+
C–Hstretch ––N O
long–chainband
F I G U R E 2 . 6 5 The infrared spectrum of 1-nitrohexane (neat liquid, KBr plates).
4000 3600 3200 2800 2400 2000 1800 1600 1400 1200 1000 800 600 400WAVENUMBERS (CM–1)
2.5 3 4 5 6 7 8 9 10 11 12 13 14 15 16 19 25100
90
80
70
60
50
40
30
20
10
0
MICRONS
% T
RA
NS
MIT
TAN
CE
NO2
arom.C C
–– N O
––
C–Hstretch
F I G U R E 2 . 6 6 The infrared spectrum of nitrobenzene (neat liquid, KBr plates).
14782_02_Ch2_p015-104.pp2.qxd 1/25/08 10:27 AM Page 79

80 Infrared Spectroscopy
D I S C U S S I O N S E C T I O N
The nitro group (NO2) gives two strong bands in the infrared spectrum. In aliphatic nitro compounds,the asymmetric stretching vibration occurs in the range from 1600 to 1530 cm−1, and the symmetricstretching band appears between 1390 and 1300 cm−1. An aliphatic nitro compound—for example,1-nitrohexane (Fig. 2.65)—absorbs at about 1550 and 1380 cm−1. Normally, its lower-frequency bandis less intense than its higher-frequency band. In contrast with aliphatic nitro compounds, aromaticcompounds give two bands of nearly equal intensity. Conjugation of a nitro group with an aromaticring shifts the bands to lower frequencies: 1550–1490 cm−1 and 1355–1315 cm−1. For example,nitrobenzene (Fig. 2.66) absorbs strongly at 1525 and 1350 cm−1. The nitroso group (RINJO) givesonly one strong band, which appears in the range from 1600 to 1500 cm−1.
S P E C T R A L A N A L Y S I S B O X
CARBOXYLATE SALTS
Asymmetric stretch (strong) occurs near 1600 cm−1; symmetric stretch (strong)occurs near 1400 cm−1.
Frequency of CJO absorption is lowered from the value found for the parentcarboxylic acid because of resonance (more single-bond character).
AMINE SALTS NH4� RNH3
� R2NH2� R3NH�
NIH Stretch (broad) occurs at 3300–2600 cm−1. The ammonium ion absorbs to theleft in this range, while the tertiary amine salt absorbs to the right. Primary andsecondary amine salts absorb in the middle of the range, 3100–2700 cm−1. Abroad band often appears near 2100 cm−1.
NIH Bend (strong) occurs at 1610–1500 cm−1. Primary (two bands) is asymmetricat 1610 cm−1, symmetric at 1500 cm−1. Secondary absorbs in the range1610–1550 cm−1. Tertiary absorbs only weakly.
AMINO ACIDS
These compounds exist as zwitterions (internal salts) and exhibit spectra that are combinationsof carboxylate and primary amine salts. Amino acids show NH3
+ stretch (very broad), NIHbend (asymmetric/symmetric), and COO− stretch (asymmetric/symmetric).
Example: leucine (Fig. 2.67).
O
CCHR OH
NH2
O
CCHR O
+NH3
–
CO
O
–
O
CR O� Na+
2.18 CARBOXYLATE SALTS, AMINE SALTS, AND AMINO ACIDS
This section covers compounds with ionic bonds. Included here are carboxylate salts, amine salts,and amino acids. Amino acids are included in this section because of their zwitterionic nature.
14782_02_Ch2_p015-104.pp2.qxd 1/25/08 10:27 AM Page 80

2.19 Sulfur Compounds 81
4000 3600 3200 2800 2400 2000 1800 1600 1400 1200 1000 800 600 400WAVENUMBERS (CM–1)
2.5 3 4 5 6 7 8 9 10 11 12 13 14 15 16 19 25100
90
80
70
60
50
40
30
20
10
0
MICRONS%
TR
AN
SM
ITTA
NC
E
N–H
C
O
O¯
N–H
NH3stretch
+ • •
•
CH–CH2–CH–C–O¯
CH3–
–
CH3
NH3 ––
O+
–
–
C
O
O¯–
––
––
F I G U R E 2 . 6 7 The infrared spectrum of leucine (Nujol mull, KBr plates). Dots indicate the Nujol(mineral oil) absorption bands (see Fig. 2.8).
2.19 SULFUR COMPOUNDS
Infrared spectral data for sulfur-containing compounds are covered in this section. Included here aresingle-bonded compounds (mercaptans or thiols and sulfides). Double-bonded SJO compoundsare also included in this section.
S P E C T R A L A N A L Y S I S B O X
MERCAPTANS (THIOLS) RISIH
SIH Stretch, one weak band, occurs near 2550 cm−1 and virtually confirms the presence ofthis group, since few other absorptions appear here.
Example: benzenethiol (Fig. 2.68).
SULFIDES RISIR
Little useful information is obtained from the infrared spectrum.
SULFOXIDES
SJO Stretch, one strong band, occurs near 1050 cm−1.
O
SR R
4000 3600 3200 2800 2400 2000 1800 1600 1400 1200 1000 800 600 400WAVENUMBERS (CM–1)
2.5 3 4 5 6 7 8 9 10 11 12 13 14 15 16 19 25100
90
80
70
60
50
40
30
20
10
0
MICRONS
% T
RA
NS
MIT
TAN
CE
C Carom.
––
C–Hstretch
S–Hstretch
mono subst.
mono subst.oop
S–H
F I G U R E 2 . 6 8 The infrared spectrum of benzenethiol (neat liquid, KBr plates).
14782_02_Ch2_p015-104.pp2.qxd 1/25/08 10:27 AM Page 81

82 Infrared Spectroscopy
SULFONES
SJO Asymmetric stretch (strong) occurs at 1300 cm−1, symmetric stretch (strong) at 1150 cm−1.
SULFONYL CHLORIDES
SJO Asymmetric stretch (strong) occurs at 1375 cm−1, symmetric stretch (strong) at 1185 cm−1.
Example: benzenesulfonyl chloride (Fig. 2.69).
SULFONATES
SJO Asymmetric stretch (strong) occurs at 1350 cm−1, symmetric stretch (strong) at 1175 cm−1.
SIO Stretch, several strong bands, occurs in the range 1000–750 cm−1.
Example: methyl p-toluenesulfonate (Fig. 2.70).
SULFONAMIDES(Solid State)
SJO Asymmetric stretch (strong) occurs at 1325 cm−1, symmetric stretch (strong) at 1140 cm−1.
NIH Primary stretch occurs at 3350 and 3250 cm−1; secondary stretch occurs at 3250 cm−1; bend occurs at 1550 cm−1.
Example: benzenesulfonamide (Fig. 2.71).
SULFONIC ACIDS(Anhydrous)
SJO Asymmetric stretch (strong) occurs at 1350 cm−1, symmetric stretch (strong) at 1150 cm−1.
SIO Stretch (strong) occurs at 650 cm−1.
O
O
SR HO
O
O
SR NH2
O
O
SR RNH
O
O
SR RO
O
O
SR Cl
O
O
SR R
14782_02_Ch2_p015-104.pp2.qxd 1/25/08 10:27 AM Page 82

4000 3600 3200 2800 2400 2000 1800 1600 1400 1200 1000 800 600 400WAVENUMBERS (CM–1)
2.5 3 4 5 6 7 8 9 10 11 12 13 14 15 16 19 25100
90
80
70
60
50
40
30
20
10
0
MICRONS%
TR
AN
SM
ITTA
NC
E
––O S O––
arom. C C
––
S O
––
C–Hstretch
Cl
F I G U R E 2 . 6 9 The infrared spectrum of benzenesulfonyl chloride (neat liquid, KBr plates).
4000 3600 3200 2800 2400 2000 1800 1600 1400 1200 1000 800 600 400WAVENUMBERS (CM–1)
2.5 3 4 5 6 7 8 9 10 11 12 13 14 15 16 19 25100
90
80
70
60
50
40
30
20
10
0
MICRONS
% T
RA
NS
MIT
TAN
CE
C C
––
arom. S O
––
S–O–R
C–Hstretch
–
O–CH3
CH3
O S O
–– ––
F I G U R E 2 . 7 0 The infrared spectrum of methyl p-toluenesulfonate (neat liquid, KBr plates).
4000 3600 3200 2800 2400 2000 1800 1600 1400 1200 1000 800 600 400WAVENUMBERS (CM–1)
2.5 3 4 5 6 7 8 9 10 11 12 13 14 15 16 19 25100
90
80
70
60
50
40
30
20
10
0
MICRONS
% T
RA
NS
MIT
TAN
CE
NH2stretch • •
•N–Hbend
NH2
–
O S O–– ––
arom. C C––
S O stretch––
F I G U R E 2 . 7 1 The infrared spectrum of benzenesulfonamide (Nujol mull, KBr plates). Dots indicatethe Nujol (mineral oil) absorption bands (see Fig. 2.8).
14782_02_Ch2_p015-104.pp2.qxd 1/25/08 10:27 AM Page 83

84 Infrared Spectroscopy
2.21 ALKYL AND ARYL HALIDES
Infrared spectral data for halogen-containing compounds are covered in this section. It is difficult todetermine the presence or the absence of a halide in a compound via infrared spectroscopy. Thereare several reasons for this problem. First, the CIX absorption occurs at very low frequencies, tothe extreme right of the spectrum, where a number of other bands appear (fingerprint). Second, thesodium chloride plates or cells that are often used obscure the region where halogens absorb (theseplates are transparent only above 650 cm−1). Other inorganic salts, most commonly KBr, can beused to extend the region down to 400 cm−1. Mass spectral methods (Sections 8.7 and 8.8) providemore reliable information for this class of compounds. The spectra of carbon tetrachloride and chlo-roform are shown in this section. These solvents are often used to dissolve solids for determiningspectra in solution.
2.20 PHOSPHORUS COMPOUNDS
Infrared spectral data for phosphorus-containing compounds are covered in this section. Includedhere are single-bonded compounds (PIH, PIR, and PIOIR). Double-bonded PJO compoundsare also included in this section.
S P E C T R A L A N A L Y S I S B O X
PHOSPHINES RPH2 R2PH
PIH Stretch, one strong, sharp band, at 2320–2270 cm−1.
PH2 Bend, medium bands, at 1090–1075 cm−1 and 840–810 cm−1.
PIH Bend, medium band, at 990–885 cm−1.
PICH3 Bend, medium bands, at 1450–1395 cm−1 and 1346–1255 cm−1.
PICH2I Bend, medium band, at 1440–1400 cm−1.
PHOSPHINE OXIDES R3PJO Ar3PJO
PJO Stretch, one very strong band, at 1210–1140 cm−1.
PHOSPHATE ESTERS (RO)3PJO
PJO Stretch, one very strong band, at 1300–1240 cm−1.
RIO Stretch, one or two strong bands, at 1088–920 cm−1.
PIO Stretch, medium band, at 845–725 cm−1.
14782_02_Ch2_p015-104.pp2.qxd 1/25/08 10:27 AM Page 84

2.21 Alkyl and Aryl Halides 85
S P E C T R A L A N A L Y S I S B O X
FLUORIDES RIF
CIF Stretch (strong) at 1400–1000 cm−1. Monofluoroalkanes absorb at the lower-frequency end of this range, while polyfluoroalkanes give multiple strong bands inthe range 1350–1100 cm−1. Aryl fluorides absorb between 1250 and 1100 cm−1.
CHLORIDES RICl
CICl Stretch (strong) in aliphatic chlorides occurs in the range 785–540 cm−1. Primarychlorides absorb at the upper end of this range, while tertiary chlorides absorbnear the lower end. Two or more bands may be observed due to the differentconformations possible.
Multiple substitution on a single-carbon atom results in an intense absorption atthe upper-frequency end of this range: CH2Cl2 (739 cm−1), HCCl3 (759 cm−1), andCCl4 (785 cm−1). Aryl chlorides absorb between 1100 and 1035 cm−1.
CH2ICl Bend (wagging) at 1300–1230 cm−1.
Examples: carbon tetrachloride (Fig. 2.72) and chloroform (Fig. 2.73).
BROMIDES RIBr
CIBr Stretch (strong) in aliphatic bromides occurs at 650–510 cm−1, out of the range ofroutine spectroscopy using NaCl plates or cells. The trends indicated for aliphaticchlorides hold for bromides. Aryl bromides absorb between 1075 and 1030 cm−1.
CH2IBr Bend (wagging) at 1250–1190 cm−1.
IODIDES RII
CII Stretch (strong) in aliphatic iodides occurs at 600–485 cm−1, out of the range ofroutine spectroscopy using NaCl plates or cells. The trends indicated for aliphaticchlorides hold for iodides.
CH2II Bend (wagging) at 1200–1150 cm−1.
4000 3600 3200 2800 2400 2000 1800 1600 1400 1200 1000 800 600 400WAVENUMBERS (CM–1)
2.5 3 4 5 6 7 8 9 10 11 12 13 14 15 16 19 25100
90
80
70
60
50
40
30
20
10
0
MICRONS
% T
RA
NS
MIT
TAN
CE
Cl–C–Cl
Cl
––Cl
C–Clstretch
F I G U R E 2 . 7 2 The infrared spectrum of carbon tetrachloride (neat liquid, KBr plates).
14782_02_Ch2_p015-104.pp2.qxd 1/25/08 10:27 AM Page 85

In this final section, we take a look at a typical background spectrum. The infrared energy beampasses not only through the sample being measured but also through a length of air. Air containstwo major infrared-active molecules: carbon dioxide and water vapor. Absorptions from these twomolecules are contained in every spectrum. Since the FT-IR is a single-beam instrument (seeSection 2.5B and Fig. 2.3B), it cannot remove these absorptions at the same time the sample spec-trum is determined. That method is used by double-beam, dispersive instruments (Section 2.5A andFig. 2.3A). Instead, the FT-IR determines the “background” spectrum (no sample in the path) andstores it in the computer memory. After a sample spectrum is determined, the computer subtractsthe background spectrum from that of the sample, effectively removing the air peaks.
Figure 2.74 shows a typical background spectrum as determined by an FT-IR instrument. Thetwo absorptions at 2350 cm−1 are due to the asymmetric stretching modes of carbon dioxide. Thegroups of peaks centered at 3750 cm−1 and 1600 cm−1 are due to the stretching and bending modesof atmospheric (gaseous) water molecules. The fine structure (spikes) in these absorptions are fre-quently seen in atmospheric water as well as other small gas-phase molecules, due to superimposedrotational energy level absorptions. In liquids or solids, the fine structure is usually blended to-gether into a broad, smooth curve (see hydrogen bonding in alcohols, Section 2.12). Occasionally,other peaks may show up in the background, sometimes due to chemical coatings on the mirrorsand sometimes due to degradation of the optics caused by adsorbed materials. Cleaning the opticscan remedy the last situation.
The observed bell-curve shape of the background spectrum is due to differences in the output ofthe infrared source. The “lamp” has its highest output intensities at the wavelengths in the center ofthe spectrum and diminished intensities at wavelengths at either end of the spectrum. Because thesource has unequal output intensity over the range of wavelengths measured, the FT-IR spectrum ofthe sample will also have a curvature. Most FT-IR instruments can correct this curvature using asoftware procedure called autobaseline. The autobaseline procedure corrects for imbalances in thesource output and attempts to give the spectrum a horizontal baseline.
In solid samples (KBr pellets or dry-film preparations), additional imbalances in the baseline canbe introduced due to “light-scattering” effects. Granular particles in a sample cause the source en-ergy to be diffracted or scattered out of the main beam, causing loss of intensity. This scattering isusually greatest at the high-frequency (short-wavelength) end of the spectrum, the region from
86 Infrared Spectroscopy
4000 3600 3200 2800 2400 2000 1800 1600 1400 1200 1000 800 600 400WAVENUMBERS (CM–1)
2.5 3 4 5 6 7 8 9 10 11 12 13 14 15 16 19 25100
90
80
70
60
50
40
30
20
10
0
MICRONS
% T
RA
NS
MIT
TAN
CE
H–C–Cl
Cl
––Cl
C–Clstretch
C–Hstretch
F I G U R E 2 . 7 3 The infrared spectrum of chloroform (neat liquid, KBr plates).
2.22 THE BACKGROUND SPECTRUM
14782_02_Ch2_p015-104.pp2.qxd 1/25/08 10:27 AM Page 86