Embed Size (px)
Citation preview

2015WaterQualityReportCardOrange Water and Sewer Authority, 400 Jones Ferry Road, Carrboro, NC 27510
PRSRT STDU.S. POSTAGE
PAIDPERMIT NO. 1
ZIP CODE 14304
2015 Water Quality ReportWe are pleased to provide this report on the quality of our drinking water in 2015. We are committed to supplying excellent water for our community’s quality of life, health, safety and economic vitality.
In 2015, we treated about 2.6 billion
or 7.12 million gallons per day, in accordance with Federal standards under the Safe Drinking Water Act and related State standards.
We routinely test for over
150 substances in our drinking water. The substances we found in 2015 are listed in the following table on page 2.
gallons of drinking water,
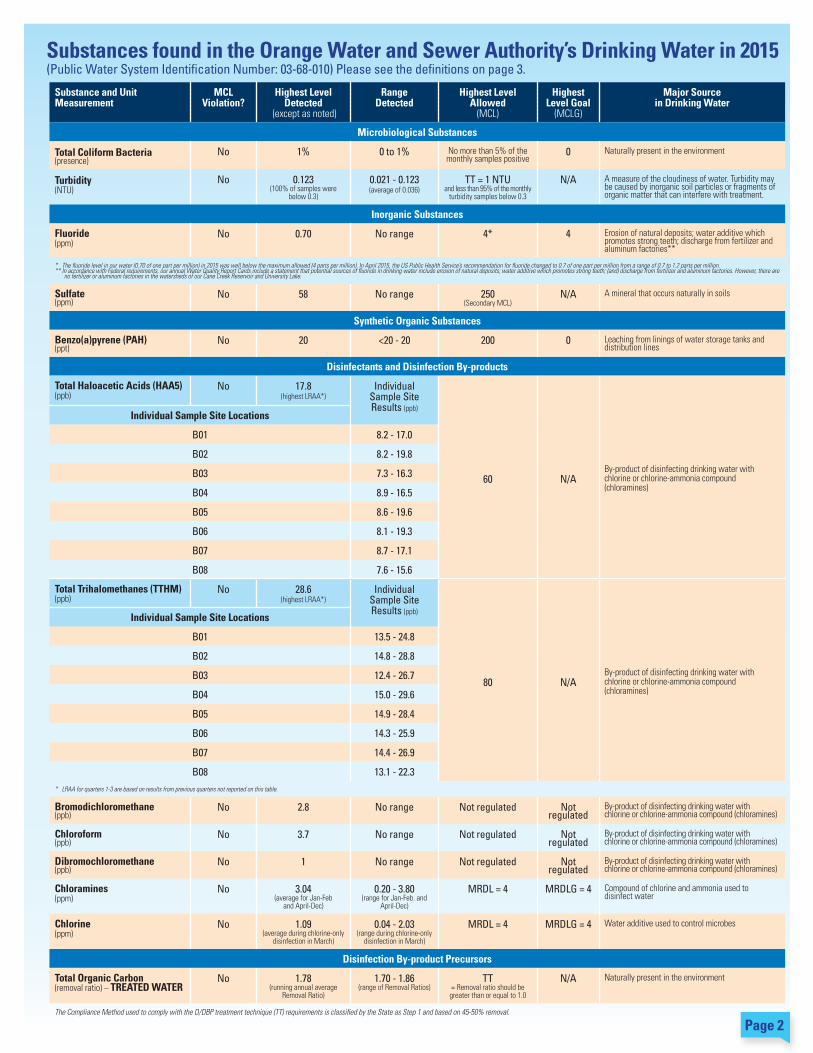
Substances found in the Orange Water and Sewer Authority’s Drinking Water in 2015(Public Water System Identification Number: 03-68-010) Please see the definitions on page 3.
Page 2
Substance and Unit Measurement
MCL Violation?
Highest LevelDetected
(except as noted)
RangeDetected
Highest LevelAllowed
(MCL)
Highest Level Goal
(MCLG)
Major Source in Drinking Water
Microbiological Substances
Total Coliform Bacteria (presence)
No 1% 0 to 1% No more than 5% of the monthly samples positive
0 Naturally present in the environment
Turbidity (NTU)
No 0.123(100% of samples were
below 0.3)
0.021 - 0.123(average of 0.036)
TT = 1 NTUand less than 95% of the monthly
turbidity samples below 0.3
N/A A measure of the cloudiness of water. Turbidity may be caused by inorganic soil particles or fragments of organic matter that can interfere with treatment.
Inorganic Substances
Fluoride (ppm)
No 0.70 No range 4* 4 Erosion of natural deposits; water additive which promotes strong teeth; discharge from fertilizer and aluminum factories**
* The fluoride level in our water (0.70 of one part per million) in 2015 was well below the maximum allowed (4 parts per million). In April 2015, the US Public Health Service’s recommendation for fluoride changed to 0.7 of one part per million from a range of 0.7 to 1.2 parts per million.** In accordance with Federal requirements, our annual Water Quality Report Cards include a statement that potential sources of fluoride in drinking water include erosion of natural deposits; water additive which promotes strong teeth; (and) discharge from fertilizer and aluminum factories. However, there are
no fertilizer or aluminum factories in the watersheds of our Cane Creek Reservoir and University Lake.
Sulfate (ppm)
No 58 No range 250 (Secondary MCL)
N/A A mineral that occurs naturally in soils
Synthetic Organic Substances
Benzo(a)pyrene (PAH) (ppt)
No 20 <20 - 20 200 0 Leaching from linings of water storage tanks and distribution lines
Disinfectants and Disinfection By-products
Total Haloacetic Acids (HAA5) (ppb)
No 17.8(highest LRAA*)
Individual Sample Site Results (ppb)
60 N/ABy-product of disinfecting drinking water withchlorine or chlorine-ammonia compound(chloramines)
Individual Sample Site Locations
B01 8.2 - 17.0
B02 8.2 - 19.8
B03 7.3 - 16.3
B04 8.9 - 16.5
B05 8.6 - 19.6
B06 8.1 - 19.3
B07 8.7 - 17.1
B08 7.6 - 15.6
Total Trihalomethanes (TTHM) (ppb)
No 28.6(highest LRAA*)
Individual Sample Site Results (ppb)
80 N/ABy-product of disinfecting drinking water withchlorine or chlorine-ammonia compound(chloramines)
Individual Sample Site Locations
B01 13.5 - 24.8
B02 14.8 - 28.8
B03 12.4 - 26.7
B04 15.0 - 29.6
B05 14.9 - 28.4
B06 14.3 - 25.9
B07 14.4 - 26.9
B08 13.1 - 22.3* LRAA for quarters 1-3 are based on results from previous quarters not reported on this table.
Bromodichloromethane (ppb)
No 2.8 No range Not regulated Not regulated
By-product of disinfecting drinking water with chlorine or chlorine-ammonia compound (chloramines)
Chloroform (ppb)
No 3.7 No range Not regulated Not regulated
By-product of disinfecting drinking water with chlorine or chlorine-ammonia compound (chloramines)
Dibromochloromethane (ppb)
No 1 No range Not regulated Not regulated
By-product of disinfecting drinking water with chlorine or chlorine-ammonia compound (chloramines)
Chloramines (ppm)
No 3.04(average for Jan-Feb
and April-Dec)
0.20 - 3.80(range for Jan-Feb. and
April-Dec)
MRDL = 4 MRDLG = 4 Compound of chlorine and ammonia used to disinfect water
Chlorine (ppm)
No 1.09(average during chlorine-only
disinfection in March)
0.04 - 2.03(range during chlorine-only
disinfection in March)
MRDL = 4 MRDLG = 4 Water additive used to control microbes
Disinfection By-product Precursors
Total Organic Carbon (removal ratio) – TREATED WATER
No 1.78(running annual average
Removal Ratio)
1.70 - 1.86(range of Removal Ratios)
TT= Removal ratio should be greater than or equal to 1.0
N/A Naturally present in the environment
The Compliance Method used to comply with the D/DBP treatment technique (TT) requirements is classified by the State as Step 1 and based on 45-50% removal.

Page 3
Drinking Water Treatment
P 1 65
32 4
7
Pump StationWater from University Lake or the Cane Creek Reservoir is pumped to our Jones Ferry Road Water Treatment Plant.
P
MixingWhen the water enters our plant, powdered carbon and ferric sulfate are mixed into the water to make solid particles clump together and to improve the taste and odor of the water.
1
ClarificationWater then flows to eithera “pulsator,” which separates solids for removal; or settling basins, where solids settle out of the water.
2
DisinfectionAs water flows to filters, chlorine in the form of liquid bleach is added for initial disinfection.
3
FiltrationWater flows down through filters with layers of sand and anthracite coal, where additional particles are removed from the water.
4
Post TreatmentWe add fluoride for dental health, and a chemical to set the pH (acidity/alkalinity) of the water at the right level.
5
ClearwellThe water flows to our 1.5 million gallon “clearwell” tank for temporary storage. Ammonia is added to the water and the ammonia combines with chlorine toform “chloramines” to further disinfect the water. Water is then pumped into the water lines throughout our community and to our water storage tanks.
6 Water TankElevated tanks help maintain pressure to deliver water to your tap through our network of about 380 miles of public water mains. The water tanks also help ensure that water is available to fight fires and to meet peak demand by our customers.
7
Supply DistributionTreatment
DEFINITIONS of Words and Phrases in the Table of Substances Found in our Water
Disinfection by-products (DBPs) - substances such as haloacetic acids and trihalomethanes, which are formed when chlorine or chloramines used to disinfect drinking water react with organic compounds naturally present in lake water. Federal standards require public water systems to limit the levels of haloacetic acids and trihalomethanes because they could be harmful at high levels.
Disinfection by-product precursors - organic carbon compounds that can combine with disinfectants (chlorine and chloramines) to form haloacetic acids and trihalomethanes as discussed above.
Locational Running Annual Average (LRAA) – The average of sample analytical results for samples taken at a particular monitoring location during the previous four calendar quarters under the Stage 2 Disinfectants and Disinfection Byproducts Rule.
Maximum Contaminant Level Goal (MCLG) - the level of a contaminant in drinking water below which there is no known or expected risk to health. MCLGs allow for a margin of safety.
Maximum Contaminant Level (MCL) - the highest level of a contaminant that is allowed in drinking water. MCLs are set as close to the MCLGs as feasible using the best available treatment technology. MCLs are set at very stringent levels. A person would have to drink 2 liters (about two quarts) of water at the MCL level every day for a lifetime to have a one-in-a-million chance of having adverse health effects from many regulated contaminants.
Maximum Residual Disinfection Level Goal (MRDLG) - the level of a drinking water disinfectant below which there is no known or expected risk to health. MRDLGs do not reflect the benefits of using disinfectants to control microbial contaminants.
Maximum Residual Disinfectant Level (MRDL) - the highest level of a disinfectant allowed in drinking water. Disinfection is necessaryto control microbial contaminants (germs) in drinking water.
Nephelometric Turbidity Unit (NTU) - a measure of cloudinessin water. Turbidity of 5 NTU is barely noticeable to theaverage person.
Parts per billion (ppb) - one part per billion corresponds to about one minute in 2,000 years, or one penny in $10 million. One ppb is equivalent to 1 microgram per liter (µg/L).
Parts per million (ppm) - one part per million corresponds to about one minute in two years, or one penny in $10,000. One ppm is equivalent to 1 milligram per liter (mg/L).
Parts per trillion (ppt) - One part per trillion corresponds to one minute in 2,000,000 years, or a single penny in $10 billion.
Removal Ratio - measure of the effectiveness of total organiccarbon removal during our water treatment process. This ratio should be greater than or equal to 1.0. The Removal Ratio is the Federally required reporting unit for total organic carbon.
Secondary Maximum Contaminant Level - a guideline foraesthetic (taste and odor), rather than health purposes.
Treatment Technique (TT) - a required process intended toreduce the level of a contaminant in drinking water.

DRINKING WATER QUALITY—Basic InformationDrinking water, including bottled drinking water, may reasonably be expected to contain at least small amounts of some contaminants. The presence of contaminants does not necessarily indicate that water poses a health risk. More information about contaminants and potential health effects can be obtained by calling the U.S. Environmental Protection Agency’s (EPA) Safe Drinking Water Hotline: 800.426.4791. Related EPA webpage: www.epa.gov/your-drinking-water.
To ensure that tap water is safe to drink, the EPA limits the amount of certain contaminants in water from public drinking water systems. The U.S. Food and Drug Administration sets limits for contaminants in bottled water, which must provide the same protection for public health.
ADDITIONAL Characteristics of our Drinking Water• DISINFECTION WITH CHLORAMINES. We disinfect our water
with chloramines, a compound of chlorine and ammonia, in all months except March, when we instead use chlorine to ensure a high level of disinfection. Chlorine is a more intense disinfectant than chloramines.
• CHLORAMINES AND CHLORINE ARE TOXIC TO FISH AND TO AMPHIBIANS such as frogs. If you have an aquarium filled with OWASA water, please contact a pet supply store for advice on how to neutralize chloramines and chlorine to protect fish, etc.
• OUR DRINKING WATER IS VERY SOFT. Its calcium carbonate level is 28 parts per million, or about 2 grains per gallon of water.
• OUR WATER IS SLIGHTLY ALKALINE. It normally has a pH of about 8.2 to 8.6, but during chlorine disinfection in March, the pH of our water declines to 7.3 to 7.5. (A pH of 7 indicates a neutral substance, pH under 7 indicates acidity, and pH over
7 indicates alkalinity).
• SOMETIMES OUR WATER IS DISCOLORED OR MAY CONTAIN AIR BUBBLES. During water line repairs, firefighting, and the release of water from hydrants, particles of iron and other
minerals can be stirred up in water pipes resulting in discoloration. Air bubbles may also be present following temperature changes or following repair work. Running cold
water in a bathtub for 5 to 10 minutes usually clears up the discoloration or bubbles. If the water does not clear up,
please call us at 919.968.4421.
WHERE Do Contaminants Come From?
The sources of drinking water (both tap and bottled water) include rivers, lakes, streams, ponds, reservoirs, springs and wells.
As water travels over the surface of land or through the ground, the water dissolves naturally-occurring minerals and, in some cases, radioactive material. Water can also pick up substances resulting from the presence of animals or human activity. Contaminants that may be present in water before it is treated include:
Jones Ferry Road WaterTreatment Plant.
Page 4
WHEN you Install or Replace a Toilet Flapper or Other Rubber Plumbing ComponentPlease choose a model that is designed for use in water systems with chloramine disinfection. Rubber degrades over time; selecting components that are compatible with the disinfectant we use to help ensure our water is healthy and safe will increase the useful life of your rubber plumbing components. For more information, please contact our OWASA Laboratory staff at 919.537.4228 or send an e-mail to [email protected].
• Microbial contaminants such as viruses and bacteria, which may come from wastewater treatment plants, septic systems, pets, agricultural livestock operations, and wildlife.
• Inorganic contaminants such as salts and metals, which may be naturally present in water or may result from stormwater runoff, industrial or domestic wastewater discharges, oil and gas production, mining, or farming.
• Pesticides and herbicides, which may come from a variety of sources, such as agriculture, stormwater runoff and residential uses.
• Organic chemical contaminants including synthetic and volatile organic chemicals, which are by-products of industrial processes and petroleum production, and can also come from gas stations and stormwater runoff from paved and other impervious surfaces.
• Radioactive contaminants, which may be naturally-occurring or result from oil and gas production and mining activities.

Help Protect our Source Water
Durham
JordanLake
UniversityLake
Cane CreekReservoir
QuarryReservoir
WTP
WWTP
Orange County
CarrboroChapel Hill
Ala
man
ce C
ount
y
Chatham County
Ora
nge
Cou
nty
Dur
ham
Cou
nty
Service Area
WatershedBoundaries
WTP: Jones Ferry Road (Drinking) Water Treatment PlantWWTP: Mason Farm Wastewater Treatment Plant
Page 5
Protecting water quality is everyone’s responsibility. To protect water in our lakes, we: • Limit extension of public water and sewer service in the Cane Creek and University Lake watersheds, • Support stringent zoning and land use controls in the watersheds, • Purchase property or conservation easements in watershed areas that are critical for water quality protection, • Financially support best management practices in farming, and • Prohibit body contact with lake water and minimize use of gasoline engines in our lakes.
You can help protect water by: • Volunteering to monitor stream water quality or participate in stream clean-up work; • Properly fertilizing your landscape; • Sweeping up debris instead of washing a driveway, walkway, etc.; • Directing water from downspouts to vegetated areas or a rain barrel; and • Limiting use of chemicals and properly disposing of them.
WHERE DOES Our Water Come From?
The Carrboro-Chapel Hill community has four water sources, which are in the Cape Fear River watershed:
• The Cane Creek Reservoir, which is about eight miles west of Carrboro on the north side of NC 54 just west of Stanford Road (storage capacity of about 3 billion gallons).
• University Lake, which is on the west side of Carrboro (capacity of about 450 million gallons).
• The Quarry Reservoir, which is about two miles west of Carrboro on the north side of NC 54 (capacity of about 200 million gallons).
• Jordan Lake in Chatham and Wake Counties. The NC Environmental Management Commission has given us an allocation of Jordan Lake capacity equal to about 5 million gallons per day which we would use only in severe droughts and operational emergencies. We can receive water from Jordan Lake via the Town of Cary and City of Durham water systems, which are connected to enable water transfers.
Beginning around 2030, we expect to expand the Quarry Reservoir to provide a capacity of at least 2.2 billion gallons. Filling the expanded quarry will take a few years.

SOURCE Water Assessment Program Results
The N.C. Department of Environmental Quality (DEQ), Public Water Supply (PWS) Section, Source Water Assessment Program (SWAP) has done assessments for all drinking water sources in North Carolina. The purpose of the assessments was to determine the susceptibility of each source toPotential Contaminant Sources (PCSs). The results of the assessment are available in SWAP Assessment Reports that include maps, background information and a susceptibility rating of Higher, Moderate or Lower.
The susceptibility rating of each water source for OWASA was determined by combining the contaminant rating(number and location of PCSs within the assessment area)and the inherent vulnerability rating (i.e., characteristics or existing conditions in the watershed and its delineatedassessment area). The SWAP findings are summarized below:
The complete SWAP Assessment report for OWASA maybe viewed on the Web at ncwater.org/pws/swap. Please note that because SWAP results and reports are periodically updated by the PWS Section, the results available on this website may differ from the results that were available at the time this report was prepared.
For a printed copy of this report, please mail a request to: Source Water Assessment Program – Report Request, 1634 Mail Service Center, Raleigh NC 27699-1634, or e-mail your request to [email protected].
Please indicate your water system name (OWASA), OWASA’s public water supply number (03-68-010), and provide your name, mailing address and phone number. If you have any questions about the SWAP report, please contact the NC Source Water Assessment staff at 919.707.9098.
It is important to understand that a susceptibility ratingdoes not imply poor water quality, only the system’s potential to become contaminated by PCSs in the assessment area.
Page 6
WHAT Is Cryptosporidium?
Cryptosporidium is a microbial parasite which comes from human and animal wastes and is found in surface water such as lakes throughout the U.S. Symptoms of infection by Cryptosporidium include nausea, diarrhea, and abdominal cramps. Although Cryptosporidium can be removed by filtration, the most commonly used filtration methods cannot guarantee 100% removal. We monitor our lake water and treated drinking water for these organisms.
Most healthy individuals are able to overcome the disease within a few weeks. However, people with compromised immune systems have more difficulty and are at greater risk of developing severe, life-threatening illness. People with compromised immune systems are encouraged to consult their doctors regarding appropriate precautions to prevent infection.
Cryptosporidium must be ingested for it to cause disease, and it may be spread through means other than drinking water.
MONITORING our Waterfor CryptosporidiumWe test 100 liters of our treated drinking water annually forCryptosporidium, and it has not been detected.
In 2015, we monitored our untreated lake water monthly for Cryptosporidium and found an average of zero oocysts per 10 liters, with a range of 0 to 1 oocyst per liter. An oocyst is a thick-walled reproductive particle which is dormant (non-growing) and can survive for lengthy periods in
Water Source Susceptibility RatingCane Creek Reservoir LowerUniversity Lake Moderate
Susceptibility of OWASA’s Water Sources to Potential Contaminant Sources
Robert Herring of our Laboratory staff at theJones Ferry Road Water Treatment Plant collecting a sample of water from the Cane Creek Reservoir.
unfavorable conditions. Current test methods do not enable us to determine whether the organisms detected are dead or whether they are capable of causing disease.

FOR PEOPLE With Special Risk of InfectionSome people may be more vulnerable to contaminants in drinking water than the general population. Immuno-compromised persons such as people with cancer undergoing chemotherapy, people who have undergone organ transplants, people with HIV/AIDS or other immune system disorders, some elderly people and infants can be particularly at risk from infections. These people should seek advice about drinking water from their health care providers.
Guidelines of the U.S. Environmental Protection Agency (EPA) and Centers for Disease Control and Prevention (CDC) on lessening the risk of infection by Cryptosporidium and other microbial contaminants are available from theEPA’s Safe Drinking Water Hotline, 800.426.4791. (Please see additionalinformation in this report about Cryptosporidium.)
Water that has received extra filtration (reverse osmosis) and is disinfected with ultraviolet light is available at several supermarkets in our community.
TESTING Our Drinking Water for LeadThe Federal limit on lead in drinking water is a maximum of 15 parts per billion in at least 90% of the samples tested. (One part per billion corresponds to one penny in $10 million.) Our testing results are significantly better than this standard.
We regularly test our water as it leaves the Jones Ferry Road Water Treatment Plant. For over 20 years, all of these lead test results have been less than the detectable level of 3 parts per billion. In accordance with Federal and State standards, we also test every three years for lead in tap water at 30 homes built between 1983 and 1985. The results from this testing in 2014 were 90% of samples tested below the detectable level of 3 parts per billion.
In response to customers’ requests in 2015, we tested tap water for lead in 3 homes. In all of the water samples, lead was below the detectable level of 3 parts per billion.
For more information, including how you can have the waterin your home tested for lead at no charge, please contact the OWASA Laboratory staff at 919.537.4228 or send an email to [email protected].
Tip! If you are a residential customer and you use more than an average of 4,000 gallons per month, feel free to contact usor visit our website for information on conservation opportunities.
Page 7
Lead and Your HealthIf present, elevated levels of lead can cause serious health problems, especially for pregnant women and young children. Lead in drinking water is primarily from materials and components associated with service lines and home plumbing. OWASA is responsible for providing high quality drinking water, but cannot control the variety of materials used in plumbing components. Plumbing code limits for lead in solder andfixtures were tightened in 1986 to reduce the potential for lead to dissolve from pipes, solder or fixtures into drinking water.
When your water has been sitting for several hours, you can minimize the potential for lead exposure by flushing your tap (running water through the faucet) for 30 seconds to 2 minutes before using water for drinking or cooking. If you are concerned about lead in your water, you may wish to have your water tested. Information on lead in drinking water, testing methods, and steps you can take to minimize exposure is available from theEPA’s Safe Drinking Water Hotline, 800.426.4791, or atepa.gov/safewater/lead.
How does lead get into drinking water?Lead is not typically found in sources of drinking water supplies such as lakes. However, lead can enter drinking water from corrosion of lead solder in plumbing systems installed before 1986, or corrosion of lead in other materials. (The safety standards for solder changed in 1986.)
What does OWASA do to minimize corrosion and the release of lead? We have an effective corrosion control program which includes properly managing the drinking water chemistry and adding a phosphate compound. The phosphate forms a protective coating inside pipes and fixtures to control corrosion in our public water system and in private plumbing. In the 1990s, we removed all known lead pipes from our water system.
The Laboratory staff at our Jones Ferry Road WaterTreatment Plant, left to right: Robert Herring;Katie Harrold, Supervisor; Chris Gibbons.
WATER Conservation• Reduces our community’s risks in droughts. • Reduces the need for costly expansion of water and sewer system capacities. • Reduces use of chemicals and energy to treat and pump water and wastewater. • Reduces greenhouse gas emissions related to conventional energy use to treat and pump water and wastewater. • Reduces monthly water and sewer costs. For more information: please contact us at [email protected] or 919.968.4421 or visit the water conservation section on our website: owasa.org/conservation-and-education.

Page 8
GETTING INVOLVED in Water IssuesYou can get involved in water resource issues at the local, State and national level. Being informed is the first step in being an effective participant. You can learn about water resource issues from: • News media; • Books in the library; • Websites such as those of the U.S. Environmental Protection Agency and American Water Works Association; and • By contacting OWASA by telephone: 919.968.4421 or e-mail: [email protected]; or visit our website: www.owasa.org.
If you have an e-mail address, we would be glad to send you our electronic notices and news releases about topics of interest to you. We invite you to contact OWASA Public Affairs at 919.537.4267 or [email protected] about the topics you are interested in. We also invite you to follow OWASA on Twitter at @owasa1. Expressing your views at public meetings, by contacting public officials, etc. is important when improvements, plans, policies and standards affecting water quality and watershed protection are needed or proposed. We invite you to attend and participate in meetings of the OWASA Board of Directors, which makes decisions on plans, policies, and service rates and fees, and adopts the annual budget for our water and wastewater services. The OWASA Board of Directors normally has work sessions at 6 PM on the second Thursdays of most months in the Community Room on the lower floor of the OWASA Administration Building, 400 Jones Ferry Road, Carrboro; and holds business meetings at 7 PM on the fourth Thursdays of most months at the Chapel Hill Town Hall, 405 Martin Luther King Jr. Boulevard. When the OWASA Board meets in the Town Hall, the meeting is televised on channel 18 of local cable television system.
Partnership for Safe Water Awards
We consistently produce high quality drinking water, meeting Partnership for Safe Water quality standards, which are stricter than State and Federal requirements. OWASA has been a member of the Partnership for Safe Water since 2002.
The Partnership for Safe Water provides a voluntary self-assessment and optimization program for water treatment plant and distribution operations. More than 250 utilities, serving more than 100 million people, are committed to the Partnership’s goals of providing safe, high-quality drinking water through achieving operational excellence in water treatment. Partnership members participate in a rigorous four-phase self-assessment and peer review process, developed by water experts.
In 2015, the American Water Works Association (AWWA), the largest and oldest worldwide organization dedicated to safe water, awarded OWASA the Partnership’s 10-Year Director’s Award in recognition of OWASA’s commitment to maintaining the highest possible drinking water quality.
We extended our participation to the Partnership’s Distribution System Optimization Program. In 2013, OWASA was one of the first utilities in the nation to receive a Director’s Award for optimizing operation and safety of the drinking water distribution system.
Orange Water and Sewer AuthorityPublic Water Supply No.: 03-68-010
400 Jones Ferry RoadCarrboro, NC 27510919.968.4421 | [email protected] | @owasa1EPA’s Safe Drinking Water Hotline: 800.426.4791
A public, non-profit agencyproviding water, sewer and reclaimed water services to the Carrboro-Chapel Hill community.
If you have any questions or comments about ourdrinking water, we invite you to contact our Water Treatment Plant Laboratory Supervisor at 919.537.4227 or our Water Supply and Treatment Manager at 919.537.4232; visit our website: owasa.org; or send us a letter: 400 Jones Ferry Road, Carrboro, NC 27510; an e-mail: [email protected] or fax: 919.968.4464. We welcome your questions and feedback!
For More Information


![DEVELOPING A STRATEGIC PLAN FOR ORANGE WATER AND … · AUTHORITY [OWASA] ALAN RIMER P.E. DEE – CHAIR OWASA BOARD OF DIRECTORS After more than a year of work with the OWASA Board](https://img.dokumen.tips/doc/110x75/5f60968437ed257cda32dc26/developing-a-strategic-plan-for-orange-water-and-authority-owasa-alan-rimer-pe.jpg)