Embed Size (px)
Citation preview

25JUL201322550356

To Our Shareholders:
Fiscal 2016 was a year in which we achieved tremendous operating and strategic momentumas we continued to build one of the largest content platforms in the world and positionedourselves closer to our consumers.
It was a year of organic growth in which our television business significantly increased itsscale, diversified its programming and achieved record-breaking results for the third year in arow. We also continued to roll out a suite of over-the-top (“OTT”) platforms for targetedaudiences, expanded our nascent location-based entertainment, gaming and virtual realitybusinesses and deepened a portfolio of brands and franchises that we expect to drive theprofitable growth of our film business for years to come.
We complemented this internal growth with a number of strategic initiatives culminating inour announcement on June 30th that we entered into an agreement to acquire Starz for$4.4 billion in cash and stock, the largest and potentially most transformative transaction inour Company’s history. We expect the transaction to close by the end of 2016.
Combination of Lionsgate & Starz Creates a Global Content Powerhouse
Starz President and CEO Chris Albrecht and his team have built a powerful brand and a robustplatform. The combination of Lionsgate, a premier next generation content leader, and Starz, aleading integrated media and entertainment company, will create a global powerhouse.
The combined entity will generate a tremendous amount of content across all platforms,giving us the scale to compete successfully in today’s fast-changing global marketplace. Ourcompany will encompass approximately 40 films annually, including 14-18 wide releases, andnearly 90 television series on more than 40 networks, enhancing what is already one of theindustry’s elite television businesses, all driven by world-class brands and backed by a 16,000-title library.
Following the close of the transaction, the combination of Lionsgate and Starz will invest innearly $1.8 billion of new content each year. By coupling our intellectual property creationmachine with the STARZ/STARZ ENCORE premium distribution platforms serving24 million and 32 million subscribers, respectively, we will create an integrated contentcreation and distribution company with massive reach, increased optionality andunprecedented opportunities for growth.
Lionsgate and Starz are both young companies that grew up in the digital age. By marshallingour resources and leveraging our focus on next generation audiences, we will create a newentertainment paradigm with the ability to deliver content directly to consumers through anexpanding infrastructure of location-based entertainment, gaming, virtual reality, cutting edgeapps and a suite of five OTT platforms, with more in the works.
These strategic benefits will be complemented by significant operational cost savings andadditional annual cash savings. The combination of Lionsgate and Starz is also expected to
1
diversify our revenue stream, increase the visibility of profit contributions from a stablenetwork business and generate strong and consistent free cash flow that will enable us to de-lever our balance sheet quickly.
Additional Partnerships Drive Opportunities
We also launched a number of other strategic initiatives during the fiscal year designed toexpand our reach and build our strength in key areas of the business.
In November 2015, Discovery Communications and Liberty Global each acquired a 3.4%stake in our Company, and the addition of Discovery CEO David Zaslav and Liberty GlobalCEO Mike Fries has brought valuable expertise to our Board of Directors. The transactionaligned Lionsgate with two of the pre-eminent programming and distribution platforms in theworld, and we are already seeing the operational benefits.
We have partnered with Discovery on a U.S. home entertainment distribution agreement andthe launch of a new documentary film division. We will soon begin production on the eventseries Manifesto for them as well.
Also in November, we acquired a majority stake in Pilgrim Media Group, a leading producerand supplier of unscripted programming. The investment is a key element of ourdiversification strategy as we continue to build a nonfiction television business alongside ourleadership in premium scripted programming.
Pilgrim has already become an important platform for our entry into new businesses, and werecently orchestrated a partnership between Pilgrim and e-sports leader ESL to create anddistribute original e-sports entertainment content for television and digital platforms.
Pilgrim also launched the ground-breaking competition reality series The Runner on Verizon’sGo90 platform in June, a broadcast quality series that has achieved tremendous levels of socialengagement and reflects the changing way that content is being viewed by millennialaudiences.
Throughout the year, Lionsgate continued to build its global distribution infrastructure bypartnering with leading third-party content suppliers around the world. In January, theCompany created a production and distribution alliance with New Regency to capitalize onglobal content opportunities. We are also managing international licensing for New Regency’sprestigious catalogue of more than 130 blockbuster films, and we’re launching a televisionjoint venture with them to develop and co-produce A-list talent-driven premium scripted seriesfor global audiences.
Lionsgate Television Achieves 3rd Straight Record-Breaking Year
Our television business continued its record-breaking growth during the year, solidifying itsposition as a leader in delivering premium series to cable and broadcast networks andemerging as a supplier of choice for streaming services. During the past three years, we have
2

more than tripled our roster of shows, and we expect the growth of our scalable televisionbusiness to continue.
We are fueling this growth by licensing original series to an ever-expanding array of buyersand continuing to convert these opportunities into hits.
We are planning to develop and produce original new series for Amazon (the Bob Dylan-themed Time Out of Mind), Hulu (the sci-fi anthology series Dimension 404) and YouTubeRed (the high-end scripted series Step Up, based on our hit franchise).
We’re also beginning production on a second original series for Netflix, Dear White People,based on Roadside Attractions’ critically-acclaimed film, another example of the synergiesbetween our film and television businesses.
Our strong roster of current series continues our tradition of helping to define the brands ofour network partners. Greenleaf, featuring Oprah Winfrey in her first recurring role in ascripted series in 20 years, is a breakout performer on OWN and has already been renewed fora second season. Casual, the Golden Globe-nominated comedy from Jason Reitman, is a top-rated series on Hulu, and The Royals remains the number one drama series on E!
The ground-breaking Orange is the New Black, the most watched series on Netflix, hasalready been renewed for three more seasons, and the transition of fan favorite Nashville toCMT and Hulu brings our brand-defining content to new partners.
We’re also continuing to build our unscripted business not only through acquisitions butorganic growth as well. Our first broadcast network reality show, the competition seriesKicking & Screaming from Fear Factor creator Matt Kunitz, will premiere on Fox in January2017. We have retained all international format and distribution rights to what we believecould become our first unscripted global brand.
Deep Portfolio of Brands & Franchises Positions Film Slate for Profitable Growth
After three straight blockbuster years, our film business underperformed our expectations infiscal 2016 even though our slate grossed over $1.6 billion at the global box office and turnedin another profitable performance.
The fiscal 2017 theatrical slate is larger, more diversified, deep in areas of proven strength andpositioned to build momentum for the rest of the year and set the stage for profitable growth inthe years to come.
We enter the Toronto Film Festival in September with our strongest line-up ever, includingthe action thriller Deepwater Horizon, the original musical La La Land, which has earned thecoveted opening night slot at the Venice International Film Festival, and the incrediblymoving drama American Pastoral, adapted from the Pulitzer Prize-winning novel.
3

Comprising a strong and diverse mix of targeted films, our fiscal 2017 slate also features thereturn of Tyler Perry in Boo! A Madea Halloween, his 17th film in a Lionsgate franchise thathas grossed nearly $800 million at the box office; Academy Award® winning director MelGibson’s war drama Hacksaw Ridge, based on a true story and an early contender for year-endawards; Blair Witch, a return to one of the Company’s iconic horror franchises; the dramathriller Patriots Day from our partners at CBS Films; and The Shack, a faith-based dramaadapted from the runaway global bestseller.
Building on our legacy of blockbuster franchises, we continue to partner with the leadingowners of intellectual property around the world to deepen our pipeline. We end fiscal 2017with the global launch of Saban’s Power Rangers, based on one of the most popular andrecognizable entertainment brands in the world.
Our focus on premium branded content leveraging valuable IP continues with a slate thatincludes Wonder, The Glass Castle, Chaos Walking, Monopoly, My Little Pony, MacGyver,Borderlands, Naruto and Robin Hood: Origins—all titles based on coveted brands with largebuilt-in fan bases and multiplatform appeal. And no discussion of franchise properties wouldbe complete without mentioning Saw, returning for Halloween 2017.
Lionsgate Content Drives Global Opportunities
Lionsgate content touches people all over the world, whether it’s Now You See Me 2 achievinga record-breaking performance of nearly $100 million at the box office in China or Orange isthe New Black ranking as Netflix’s top series globally.
During the year we expanded our reach into new markets, built our presence in keyinternational territories and continued the globalization of our television business.
We invested in Kindle Entertainment and Primal Media in the UK as we continue to diversifyour operations there. Our investment in Primal Media, an unscripted content producer led bytwo seasoned UK reality creators, represents an exciting opportunity to extend our nonfictionbusiness into the largest television market outside the U.S.
In May 2016, we partnered with a group of entertainment executives to form Globalgate, aconsortium of leading international producers, distributors and co-financing partners who willidentify and provide priority access to intellectual property for production as local-languagefilms in territories worldwide. Our unique approach to building a presence in the fast-growinglocal-language film business has already attracted world-class partners including Televisa inLatin America, Gaumont in France, Nordisk Film in Scandinavia, Kadokawa in Japan andLotte in Korea.
We’re also exploring partnerships for local-language film production in China, where we havealready invested in two local-language films and are finalizing investments in four others thatwe will distribute both internationally and in the U.S. In India, another market with untappedpotential, we’re remaking the action comedy Red following our successful Hindi-languageremake of the film Warrior.
4

Extending Our Platform into Location-Based Entertainment and Games
Fiscal 2016 was an active year in continuing to ramp businesses that extend the reach of ourcontent, bring us closer to our consumers and are designed to deliver significant incrementalprofits.
Our brands continue to drive the growth of our location-based entertainment as we announcedplans during the year to partner on two major new theme park developments—one a Lionsgatebranded zone in an outdoor theme park in metro Atlanta and the other an immersive Lionsgatebranded entertainment center in Hengqin, China, near Macau being developed by Hong Kongdeveloper eSun Holdings. The partnership with eSun extends our location-based entertainmentto three continents, and we expect eight million consumers to visit Lionsgate’s growingnetwork of theme park attractions, rides and exhibitions each year by 2020.
We’re also extending our intellectual property onto fast-growing gaming platforms,collaborating with powerhouses such as Starbreeze for a John Wick virtual reality game,Saban and nWay to produce a Power Rangers mobile game, Fifth Journey to develop a KevinHart social adventure game, and IGT and DoubleDown Casino to launch an Orange is theNew Black casino game. Within the next three years, we expect to roll out over 20 mobile, PCand virtual reality games as we continue to identify exciting new ways to monetize ourcontent.
Lionsgate has become a partner of choice for leading technology platforms that play agrowing role in our content ecosystem. We became one of the first studios to license our filmsto the Steam platform and the first studio to partner with Google on its Daydream VRinitiative. We also plan to launch location-based VR content within the next year as part of ourunique collaboration with IMAX and Starbreeze.
A Leader in New Entertainment Technologies
We continued our leadership in incubating new entertainment technologies, launching AtomTickets, a revolutionary approach to movie-going, with partners Disney and Fox in June. Wehave already brought aboard Regal Cinemas and AMC Theatres, the two largest exhibitionchains in North America, and expect to reach nearly half of the screens in the U.S. by the endof the year.
Our OTT platforms represent another way to deliver our content directly to consumers. Welaunched Tribeca Shortlist in partnership with Tribeca Enterprises last October, debutedComic-Con HQ in July and plan to roll out Kevin Hart’s Laugh Out Loud platform by the endof 2016. All three services are targeted at affinity audiences, distinguished by their curationand backed by our vast film and television library.
5
Positioned for the Next Level of Performance
Though the global environment for content owners has never been stronger, it is also in themidst of profound change. We are a disruptive company that has always benefitted fromchange. We enter fiscal 2017 poised to capitalize on the opportunities offered by a dynamicmarketplace with one of our deepest film and television pipelines, our stature as a leadingpremium content supplier to new and traditional platforms alike and a culture that fosters ourability to be agile, flexible and opportunistic in our strategic initiatives.
Our acquisition of Starz enhances our existing strengths while adding new ones. It diversifiesour Company, increases our flexibility and streamlines our pathways to the consumer.Combining our assets with Starz’s own premium brands and distribution is a natural androbust evolution of our content business, expanding our platform, creating new strategicgrowth opportunities and unlocking long-term value for our shareholders.
Sincerely,
Jon Feltheimer Michael BurnsChief Executive Officer Vice Chairman
6

UNITED STATESSECURITIES AND EXCHANGE COMMISSION
Washington, D.C. 20549Form 10-K
(Mark One)
ANNUAL REPORT PURSUANT TO SECTION 13 OR 15(d) OF THE SECURITIESEXCHANGE ACT OF 1934
For the fiscal year ended March 31, 2016 or
TRANSITION REPORT PURSUANT TO SECTION 13 OR 15(d) OF THE SECURITIESEXCHANGE ACT OF 1934
For the transition period from to Commission File No.: 1-14880
LIONS GATE ENTERTAINMENT CORP.(Exact name of registrant as specified in its charter)
British Columbia, Canada N/A(State or Other Jurisdiction of Incorporation or Organization)
(I.R.S. Employer Identification No.)
250 Howe Street, 20th FloorVancouver, British Columbia V6C 3R8
2700 Colorado AvenueSanta Monica, California 90404
(877) 848-3866 (310) 449-9200(Address of Principal Executive Offices, Zip Code)
Registrant’s telephone number, including area code:(877) 848-3866
Securities registered pursuant to Section 12(b) of the Act:
Title of Each Class Name of Each Exchange on Which RegisteredCommon Shares, without par value New York Stock Exchange
Securities registered pursuant to Section 12(g) of the Act:None
___________________________________________________________
Indicate by check mark if the registrant is a well-known seasoned issuer, as defined in Rule 405 of the Securities Act. Yes No Indicate by check mark if the registrant is not required to file reports pursuant to Section 13 or Section 15(d) of the Securities Exchange
Act of 1934. Yes No Indicate by check mark whether the registrant (1) has filed all reports required to be filed by Section 13 or Section 15(d) of the Securities
Exchange Act of 1934 during the preceding 12 months (or for such shorter period that the registrant was required to file such reports), and (2) has been subject to such filing requirements for the past 90 days. Yes No
Indicate by check mark whether the registrant has submitted electronically and posted on its corporate Website, if any, every Interactive Data File required to be submitted and posted pursuant to Rule 405 of Regulation S-T during the preceding 12 months (or for such shorter period that the registrant was required to submit and post such files). Yes No
Indicate by check mark if disclosure of delinquent filers pursuant to Item 405 of Regulation S-K is not contained herein, and will not be contained, to the best of registrant’s knowledge, in definitive proxy or information statements incorporated by reference in Part III of this Form 10-K or any amendment to this Form 10-K.
Indicate by check mark whether the registrant is a large accelerated filer, an accelerated filer, a non-accelerated filer, or a smaller reporting company. See the definitions of “large accelerated filer,” “accelerated filer” and “smaller reporting company” in Rule 12b-2 of the Exchange Act. (Check one):
Large accelerated filer Accelerated filer Non accelerated filer Smaller reporting company (Do not check if a smaller reporting company)
Indicate by check mark whether the registrant is a shell company (as defined in Rule 12b-2 of the Act). Yes No The aggregate market value of the voting stock held by non-affiliates of the registrant as of September 30, 2015 (the last business day of
the registrant’s most recently completed second fiscal quarter) was approximately $3,650,313,330, based on the closing sale price as reported on the New York Stock Exchange.
As of May 23, 2016, 147,227,797 shares of the registrant’s no par value common shares were outstanding.DOCUMENTS INCORPORATED BY REFERENCE
Portions of the registrant’s definitive proxy statement to be filed with the Securities and Exchange Commission pursuant to Regulation 14A and relating to the registrant’s 2016 annual meeting of shareholders are incorporated by reference into Part III.

2
Page
PART I Item 1. BusinessItem 1A. Risk FactorsItem 1B. Unresolved Staff CommentsItem 2. PropertiesItem 3. Legal ProceedingsItem 4. Mine Safety Disclosures
PART II Item 5. Market for Registrant’s Common Equity, Related Stockholder Matters and Issuer Purchases of Equity SecuritiesItem 6. Selected Financial DataItem 7. Management’s Discussion and Analysis of Financial Condition and Results of OperationsItem 7A. Quantitative and Qualitative Disclosures About Market RiskItem 8. Financial Statements and Supplementary DataItem 9. Changes In and Disagreements with Accountants on Accounting and Financial DisclosureItem 9A. Controls and ProceduresItem 9B. Other Information
PART III Item 10. Directors, Executive Officers and Corporate GovernanceItem 11. Executive CompensationItem 12. Security Ownership of Certain Beneficial Owners and Management and Related Stockholder MattersItem 13. Certain Relationships and Related Transactions, and Director IndependenceItem 14. Principal Accounting Fees and Services
PART IV Item 15. Exhibits, Financial Statement Schedules
42032323232
3336387577777780
8080808080
80

3
FORWARD-LOOKING STATEMENTS
This report includes statements that are, or may deemed to be, “forward looking statements” within the meaning of Section 27A of the Securities Act of 1933, as amended (the “Securities Act”), and Section 21E of the Securities Exchange Act of 1934, as amended (the “Exchange Act”). These forward-looking statements can be identified by the use of forward-looking terminology, including the terms “believes,” “estimates,” “potential,” “anticipates,” “expects,” “intends,” “plans,” “projects,” “forecasts,” “may,” “will,” “could,” “would” or “should” or, in each case, their negative or other variations or comparable terminology. These forward-looking statements include all matters that are not historical facts. They appear in a number of places throughout this report and include statements regarding our intentions, beliefs or current expectations concerning, among other things, our results of operations, financial condition, liquidity, prospects, growth, strategies and the industry in which we operate.
By their nature, forward-looking statements involve risks and uncertainties because they relate to events and depend on circumstances that may or may not occur in the future. We believe that these risks and uncertainties include, but are not limited to, those discussed under Part I, Item 1A. “Risk Factors”. These factors should not be construed as exhaustive and should be read with the other cautionary statements and information in the report.
We caution you that forward-looking statements made in this report or anywhere else are not guarantees of future performance and that our actual results of operations, financial condition and liquidity, and the development of the industry in which we operate may differ materially and adversely from those made in or suggested by the forward looking statements contained in this report as a result of various important factors, including, but not limited to, the substantial investment of capital required to produce and market films and television series, increased costs for producing and marketing feature films and television series, budget overruns, limitations imposed by our credit facilities and notes, unpredictability of the commercial success of our motion pictures and television programming, risks related to our acquisition and integration of acquired businesses, the effects of dispositions of businesses or assets, including individual films or libraries, the cost of defending our intellectual property, technological changes and other trends affecting the entertainment industry, and the other risks and uncertainties discussed under Part I, Item 1.A. “Risk Factors”. In addition, even if our results of operations, financial condition and liquidity, and the development of the industry in which we operate are consistent with the forward looking statements contained in this report, those results or developments may not be indicative of results or developments in subsequent periods.
Any forward-looking statements, which we make in this report, speak only as of the date of such statement, and we undertake no obligation to update such statements. Comparisons of results for current and any prior periods are not intended to express any future trends or indications of future performance, unless expressed as such, and should only be viewed as historical data.
Unless otherwise indicated, all references to the “Company,” “Lionsgate,” “we,” “us,” and “our” include reference to our subsidiaries as well.

4
PART I
ITEM 1. BUSINESS.
Overview
Lionsgate is a premier next generation global content leader with a diversified presence in motion picture production and distribution, television programming and syndication, home entertainment, international distribution and sales, branded channel platforms, interactive ventures and games, and location-based entertainment.
Although our business is both global and diverse, we classify our operations through two reporting segments: Motion Pictures and Television Production.
Motion Pictures
Our Motion Pictures segment includes revenues derived from the following:
• Theatrical. Theatrical revenues are derived from the domestic theatrical release of motion pictures licensed to theatrical exhibitors on a picture-by-picture basis (distributed by us directly in the United States and through a sub-distributor in Canada).
• Home Entertainment. Home entertainment revenues are derived from the sale and rental of our film productions and acquired or licensed films and certain television programs (including theatrical and direct-to-video releases) on packaged media and through digital media platforms. We distribute a library of approximately 16,000 motion picture titles and television episodes and programs.
• Television. Television revenues are primarily derived from the licensing of our theatrical productions and acquired films to the linear pay, basic cable and free television markets.
• International. International revenues are derived from the licensing of our productions, acquired films, our catalog product and libraries of acquired titles from our international subsidiaries and revenues from our distribution to international distributors, on a territory-by-territory basis. International revenues also include revenues from the direct distribution of our productions, acquired films and our catalog product and libraries of acquired titles in the United Kingdom.
• Motion Pictures-Other. Other revenues are derived from, among others, our interactive ventures and games division, our global franchise management and strategic partnerships division (which includes location-based entertainment), the sales and licensing of music from the theatrical exhibition of our films and the television broadcasts of our productions, and from the licensing of our films and television programs to ancillary markets.
Television Production
Our Television Production segment includes revenues derived from the following:
• Domestic Television. Domestic television revenues are derived from the licensing and syndication to domestic markets of one-hour and half-hour scripted and unscripted series, television movies, mini-series and non-fiction programming.
• International. International revenues are derived from the licensing and syndication to international markets of one-hour and half-hour scripted and unscripted series, television movies, mini-series and non-fiction programming.
• Home Entertainment. Home entertainment revenues are derived from the sale or rental of television production movies or series on packaged media and through digital media platforms. We distribute a library of approximately 16,000 motion picture titles and television episodes and programs.

5
• Television Production-Other. Other revenues are derived from, among others, product integration in our television episodes and programs, the sales and licensing of music from the television broadcasts of our productions, and from the licensing of our television programs to ancillary markets.
Segment Revenue
For the year ended March 31, 2016, contributions to the Company’s consolidated revenues from its reporting segments included Motion Pictures 71.5% and Television Production 28.5%.
Within the Motion Pictures segment, revenues were generated from the following: Theatrical 18.7%, Home Entertainment34.6%, Television 12.2%, International 32.7% and Motion Pictures-Other 1.8%.
Within the Television Production segment, revenues were generated from the following: Domestic Television 62.0%, International 28.4%, Home Entertainment 9.0% and Television Production-Other 0.6%.
Business Strategy
We continue to grow and diversify our portfolio of content to capitalize on demand from emerging and traditional platforms throughout the world. We maintain a disciplined approach to acquisition, production and distribution of product, by balancing our financial risks against the probability of commercial success for each project. We pursue the same disciplined approach to investments in, and acquisition of, libraries and other assets complementary to our business. We believe that our strategic focus on content and creation of innovative content distribution strategies will enhance our competitive position in the industry, ensure optimal use of our capital, build a diversified foundation for future growth and generate significant long-term value for our shareholders.
Motion Pictures - Theatrical
Theatrical Production
Theatrical production consists of “greenlighting” (proceeding with production) and financing motion pictures, as well as the development of screenplays, filming activities and the post-filming editing/post-production process.
We take a disciplined approach to theatrical production with the goal of producing content that can be distributed through various domestic and international platforms. We typically attempt to mitigate the financial risk associated with production by negotiating co-financing development and co-production agreements (which provide for joint efforts and cost-sharing between us and one or more third-party companies) and pre-selling international distribution rights on a selective basis, including through
71.5%
28.5%Motion PicturesTelevision Production
18.7%
34.6%12.2%
32.7%
1.8%
TheatricalHome EntertainmentTelevisionInternationalOther
62.0%28.4
9.0% 0.6%
Domestic Television
International
Home Entertainment
Other

6
international output agreements (which refers to licensing the rights to distribute a film in one or more media generally for a limited term, in one or more specific territories prior to completion of the film). We also often attempt to minimize production exposure by structuring agreements with talent that provide for them to participate in the financial success of the motion picture in exchange for reducing guaranteed amounts to be paid, regardless of the film's success (referred to as “up-front payments”). In addition, many states and foreign countries have implemented incentive programs designed to attract film production as a means of economic development. Government incentives typically take the form of sales tax refunds, transferable tax credits, refundable tax credits, low interest loans, direct subsidies or cash rebates, which are generally calculated based on the amount of money spent in the particular jurisdiction in connection with the production. Each jurisdiction determines the regulations that must be complied with, as well as the conditions that must be satisfied, in order for a production to qualify for the incentive. We use such incentives and/or programs and other structures to further reduce our financial risk in theatrical production.
Our approach to acquiring films for theatrical release is similar to our approach to film production. We generally seek to limit our financial exposure in acquiring films while adding films of quality and commercial viability to our release schedule and library. Theatrical Distribution
In general, the economic life of a motion picture consists of its exploitation in theaters, on packaged media and on various digital and television platforms in territories around the world.
Theatrical distribution refers to the marketing and commercial or retail exploitation of motion pictures. We distribute motion pictures directly to U.S. movie theaters. Generally, distributors and exhibitors (theater owners) will enter into agreements whereby the exhibitor retains a portion of the “gross box office receipts,” which are the admissions paid at the box office. The balance is remitted to the distributor. Successful motion pictures may continue to play in theaters for more than three months following their initial release. Concurrent with their release in the U.S., motion pictures are generally released in Canada and may also be released in one or more other foreign markets. After the initial theatrical release, distributors seek to maximize revenues by releasing movies in sequential release date windows, which may be exclusive against other non-theatrical distribution channels.
In most territories, international theatrical distribution (outside of the U.S. and Canada) generally follows the same cycle as domestic theatrical distribution. Historically, the international distribution cycle would begin a few months after the start of the domestic distribution cycle. However, due, in part, to international box office growth, as well as film piracy in international markets, a much higher percentage of films are being released simultaneously in the U.S. and international markets, or even earlier in certain international markets.
We construct release schedules taking into account moviegoer attendance patterns and competition from other studios' scheduled theatrical releases. We use either wide (generally, more than 2,000 screens nationwide) or limited initial releases, depending on the film. We believe that we generally spend significantly less on prints and advertising for a given film than other studios and design our marketing plans to cost-effectively reach a large audience.
Producing, marketing and distributing a motion picture can involve significant risks and costs, and can cause our financial results to vary depending on the timing of a motion picture’s release. For example, marketing costs are generally incurred before and throughout the theatrical release of a film and, to a lesser extent, other distribution windows, and are expensed as incurred. Therefore, we typically incur losses with respect to a particular film prior to and during the film’s theatrical exhibition, and profitability for the film may not be realized until after its theatrical release window.
We may revise the release date of a motion picture as the production schedule changes or in such a manner as we believe is likely to maximize revenues or for other business reasons. Additionally, there can be no assurance that any of the motion pictures scheduled for release will be completed, that completion will occur in accordance with the anticipated schedule or budget, or that the film will ever be released.

7
Theatrical Releases
In fiscal 2016 (i.e., the twelve-month period ended March 31, 2016), we released the following 14 films theatrically in the U.S., which included both Lionsgate and Summit Entertainment label films developed and produced in-house, films co-developed and co-produced and films acquired from third parties:
Fiscal 2016 Theatrical ReleasesLionsgate/Summit
Title Release Date LabelChild 44 April 17, 2015 SummitAge of Adaline April 24, 2015 LionsgateShaun The Sheep Movie August 5, 2015 LionsgateAmerican Ultra August 21, 2015 LionsgateSicario September 18, 2015 LionsgateFreeheld October 2, 2015 SummitThe Last Witch Hunter October 23, 2015 SummitLove the Coopers November 13, 2015 LionsgateThe Hunger Games: Mockingjay - Part 2 November 20, 2015 LionsgateNorm of the North January 1, 2016 LionsgateDirty Grandpa January 22, 2016 LionsgateThe Choice February 5, 2016 LionsgateGods of Egypt February 26, 2016 SummitThe Divergent Series: Allegiant March 18, 2016 Summit
In fiscal 2016, we also released the following films “day & date” from our new specialty film distribution label, Lionsgate Premiere, which encompasses a diverse slate of films released in theatres as well as across a broad spectrum of digital platforms. Lionsgate Premiere focuses on customizing innovative multiplatform and other release strategies for its slate of films in order to capitalize on the fast-changing motion picture environment, reach affinity audiences with branded content and targeted marketing, and enhance the profitability of individual films.
Fiscal 2016 ReleasesLionsgate Premiere
Title Release DateShe's Funny That Way August 21, 2015Dragon Blade September 4, 2015Cooties September 18, 2015Knock Knock October 9, 2015Heist November 13, 2015Don Verdean December 11, 2015Extraction December 18, 2015Exposed January 22, 2016Misconduct February 5, 2016Get A Job* March 25, 2016
* Through our partnership with CBS Films (with which we have a multi-year partnership that includes distribution initiatives by us across all media, including theatrical and home entertainment platforms (except U.S. pay television), as well as sales in international markets).

8
Finally, in fiscal 2016, the following films were released theatrically through CodeBlack Films, Pantelion Films (our joint venture with Televisa), and through our partnership with Roadside Attractions:
Fiscal 2016 Theatrical ReleasesCodeBlack/Pantelion/Roadside
Title Release Date Partnership/ LabelBeyond The Reach August 17, 2015 Roadside AttractionsMaggie May 8, 2015 Roadside AttractionsWhere Hope Grows May 15, 2015 Roadside AttractionsLove and Mercy June 5, 2015 Roadside AttractionsMr. Holmes July 17, 2015 Roadside AttractionsThe Vatican Tapes July 24, 2015 Pantelion FilmsZ for Zachariah August 21, 2015 Roadside AttractionsUn Gallo Con Muchos Huevos September 4, 2015 Pantelion FilmsStonewall September 25, 2015 Roadside AttractionsLadrones October 9, 2015 Pantelion FilmsMiss You Already November 6, 2015 Roadside AttractionsChi-Raq December 4, 2015 Roadside Attractions600 Miles (aka 600 Millas) February 5, 2016 Roadside AttractionsBusco Novio Para Mi Mujer February 19, 2016 Pantelion FilmsThe Perfect Match March 11, 2016 CodeBlack FilmsHello My Name is Doris March 11, 2016 Roadside AttractionsSummer Camp March 18, 2016 Pantelion
Over the last 15 years, Lionsgate, Summit Entertainment and affiliated companies have distributed films that have earned 90 Academy Award ® nominations, won 20 Academy Awards and have been nominated for and won numerous Golden Globe ® Awards, Screen Actors Guild Awards ®, BAFTA Awards and Spirit Awards.
Motion Pictures - Home Entertainment
Our U.S. home entertainment distribution operation exploits our film and television content library of approximately 16,000 motion picture titles and television episodes and programs, consisting of titles from, among others, Lionsgate, our subsidiaries, affiliates and joint ventures (such as Summit Entertainment, Artisan Entertainment, CodeBlack Films, Grindstone Entertainment Group, Modern Entertainment, Trimark, Pantelion Films and Roadside Attractions), as well as titles from third parties such as A&E, LeapFrog Entertainment, Marvel, MGA Entertainment, Miramax, Saban Entertainment, StudioCanal, Tyler Perry Studios and Zoetrope Corporation. Home entertainment revenue consists of packaged media and digital revenue.
Packaged Media
Packaged media distribution involves the marketing, promotion and sale and/or lease of DVDs and Blu-ray discs to wholesalers and retailers who then sell or rent the DVDs and Blu-ray discs to consumers for private viewing.
For new theatrical titles, home entertainment distribution has traditionally occurred within three to four months of initial theatrical release. However, due in part to new methods of distribution and the rise of new digital platforms and networks, select titles are now being released on video-on-demand (“VOD”) and other digital formats on the same day as the title is theatrically released (a so called “day & date” release strategy). These titles typically release on a modest number of screens for the purpose of positioning VOD and other ancillary platforms. We have also experimented with various other windowing strategies, where, for instance, a title may be released theatrically on several hundred screens, followed by an electronic-sell-through (“EST”) and premium priced interactive VOD window, followed by release on packaged media, regular priced cable VOD, and later, subscription video-on-demand (“SVOD”). Importantly, these release strategies are not applicable to every film, and may change based on release patterns, new technologies and product flow.
We distribute or sell content directly to retailers such as Wal-Mart, Best Buy, Target, Costco and others who buy large volumes of our DVDs and Blu-ray discs to sell directly to consumers. Sales to Wal-Mart accounted for approximately 42% of net home entertainment packaged media revenue in fiscal 2016. We also directly distribute content to the rental market through Netflix,

9
Amazon, Redbox and others. The DVDs and Blu-ray discs for new titles in the U.S. include an UltraViolet digital copy, a home entertainment industry standard that allows consumers who have purchased film and television content to access their content at any time by downloading or streaming it from the cloud to various devices supported by participating UltraViolet retailers.
Of these titles, certain are released through our subsidiary, Grindstone Entertainment Group, which acquires and/or produces titles as finished pictures and as “pre-buys” based on script, cast and genres, and creates targeted key art, marketing materials and release plans, which is then distributed direct-to-video, VOD and through other media. In fiscal 2016, Grindstone Entertainment Group released 38 titles.
Additionally, we distribute television product including series such as Mad Men, Orange Is The New Black, The Royals, Weeds, Nurse Jackie, Duck Dynasty, Hannibal, Blue Mountain State, and the upcoming Narcos and Grace and Frankie, library titles such as Alf and Little House on the Prairie, certain Disney-ABC Domestic Television series, as well as premiere children's brands including our Alpha and Omega franchise, Saban Entertainment’s Power Rangers, Aardman’s Shaun the Sheep library, LeapFrog Entertainment's LeapFrog, MGA Entertainment's LalaLoopsy and Bratz, American Greetings' Care Bears, and our catalog of Teenage Mutant Ninja Turtles and Marvel Animated Features.
In fiscal 2016, four of our theatrical releases debuted at number one on DVD and Blu-ray - The Divergent Series: Insurgent (which held the number one spot for two weeks), The Hunger Games: Mockingjay - Part 2, The Last Witch Hunter and Sicario.
We shipped approximately 80 million DVD and Blu-ray finished units during fiscal 2016. In calendar 2015, we had an approximate 10% market share for home entertainment (packaged media, VOD and digital combined) making us the number five studio in market share overall. We also maintained a box office-to-home entertainment conversion rate of approximately 15% above that of the industry average in calendar 2015. Box office-to-home entertainment conversion rate is calculated as the ratio of the total of both first cycle DVD release revenues and total digital platform revenues for a theatrical release compared to the total North American box-office revenues from such theatrical release.
Digital Media
Digital media distribution involves delivering content (including certain titles not available on packaged media) by electronic means directly to consumers through in-home devices (such as set-top boxes from cable, satellite and telco companies, connected or “smart” devices, game consoles and HDMI dongles) and mobile devices (such as smart phones, tablets and personal computers). The key distribution methods today, of which Lionsgate is an active participant, include transactional distribution (such as pay-per-view (“PPV”), EST and transaction video-on-demand (“TVOD”)), non-transactional distribution (such as SVOD), advertiser-supported video-on-demand (“AVOD”) and free video-on-demand (“FVOD”)) and distribution through various linear pay, basic cable and free television platforms.
Distribution on pay networks include, among others, EPIX, HBO, Starz and Showtime. Distribution on basic cable networks include, among others, USA Networks, FX, Turner Networks, BET, Pop, SyFy, Lifetime, MTV, Comedy Central, Spike, AMC Networks, Freeform (formerly known as ABC Family), Reelz, Telemundo, UniMás and Mundo Fox. We also license library content to digital platforms and networks such as iTunes, iQIYI, Amazon, Wal-Mart's Vudu, Microsoft's Xbox, Sony's PlayStation Network, Google Play, Netflix, Best Buy/Cinema Now, Hulu, EPIX, Barnes & Noble/Nook, M-Go and, most recently, Valve Corporation’s Steam platform, and directly distribute (including, in some cases, our home entertainment rights, VOD, PPV and EST content) to multichannel video programming distributors such as Comcast, DirecTV/AT&T, Dish Network, Cablevision, Cox Communications, Charter Communications and Verizon Communications.
Transactional digital media distribution of theatrically released motion pictures generally occurs within three to six months of the initial theatrical release. Pay television distribution and/or digital SVOD distribution usually follows within nine months of a movie’s initial theatrical release. Finally, all other linear television and non-transactional digital models commence throughout various windows thereafter. While these current release patterns may not remain static in the future and may change based on release patterns, new technologies and product flow, a film’s lifecycle remains long. A release pattern may look as follows:

10
We also distribute our original and acquired television programming across a variety of digital platforms on an EST basis, often the day after an episode airs on television in the territory. Television content is usually made available on digital SVOD, FVOD and AVOD platforms years after such content first airs, generating additional revenues for the Company and supplementing those revenues earned from traditional linear television distribution.
In fiscal 2016, three of our titles debuted at number one on the Rentrak On-Demand VOD charts - The Duff, The Divergent Series: Insurgent and Sicario.
In fiscal 2016, five Lionsgate titles achieved the number one ranking on iTunes’ Top Movies chart - The Duff, The Divergent Series: Insurgent, Sicario, Blue Mountain State: The Rise of Thadland and The Hunger Games: Mockingjay Part 2.
The Company also licenses its product outside of the U.S. The typical windowing sequence is generally consistent with the domestic cycle; however, windowing strategies are developed in response to local market practices and conditions, and the exact sequence and length of each window can vary by country and by title.
Over-The-Top Initiatives
We also distribute content through Tribeca ShortList, Comic-Con HQ and, shortly, Laugh Out Loud, our suite of over-the-top services which feature branded, targeted content for affinity audiences.

11
Tribeca Short List, our SVOD service with Tribeca Enterprises, a diversified global mediacompany which owns and operates the Tribeca Film Festival, encompasses a prestigiousselection of Lionsgate and Tribeca titles as well as critically-acclaimed films drawn fromaround the world. The films are curated by Tribeca and leading voices in contemporaryculture and are refreshed on a weekly basis.
Comic-Con HQ, our SVOD service with Comic-Con International, a nonprofit educationalorganization dedicated to creating awareness of, and appreciation for, comics and relatedpopular artforms, primarily through the presentation of conventions and events that celebratethe historic and ongoing contribution of comics to art and culture, features an evolving slateof programming. This slate includes original scripted and unscripted series, recurring dailyand weekly entertainment commentary, plus unique access to a growing library of live andarchival programming from world-class events, a highly-curated selection of film andtelevision genre titles, and behind-the-scenes access and bonus features from genre titles thatdefy and define pop culture.
In March 2016, we announced that we had formed a partnership with Kevin Hart and hiscompany, Hartbeat Digital, to launch a new video-on-demand service, Laugh Out Loud, andcreate a new social adventure mobile tablet game. The new service will serve as the exclusivehome for all content created by Kevin Hart outside his theatrical and live touring activitiesand will include original series starring Kevin Hart. Laugh Out Loud will also showcasecontent curated by Kevin Hart along with shows featuring social media stars and up andcoming comedians.
Motion Pictures - Television
We license our theatrical productions and acquired films to the domestic linear pay, basic cable and free television markets. For additional information, see Motion Pictures-Home Entertainment-Digital Media above.
Motion Pictures - International
Our international sales operations are headquartered at our offices in London, England. The primary components of our international business are, on a territory by territory basis through third parties or directly through our international divisions: (i) the licensing of rights in all media of our in-house feature film product on an output basis; (ii) the licensing of rights in all media of our in-house product on a pre-sales basis; (iii) the licensing and sale of third party feature films on an agency basis; and (iv) direct distribution.
We sell or license rights in all media on a territory by territory basis (other than the territories where Lionsgate self-distributes) of (i) our in-house Lionsgate and Summit Entertainment feature film product, and (ii) films produced by third parties such as Alcon Entertainment, Black Label Media, CBS Films, River Road Entertainment, Thunder Road Pictures and other independent producers. Films licensed and/or released by us in fiscal 2016 included such in-house productions as The Hunger Games: Mockingjay Part 2, The Divergent Series: Allegiant, Sicario, The Last Witch Hunter, Gods of Egypt, Child 44, Now You See Me 2, Deepwater Horizon, La La Land, Nerve, The Shack, John Wick: Chapter 2, Power Rangers, The Glass Castle, Robin Hood: Origins and Stronger. Third party films for which we were engaged as exclusive sales agent and/or released by us in fiscal 2016 included Love & Mercy, A Little Chaos, Pawn Sacrifice, Love the Coopers, The Last Face, A Monster Calls and Middle School.
Through our pre-sales and output arrangements, we generally cover the majority of the production budget or acquisition cost of new theatrical releases we distribute internationally. Our output agreements for Lionsgate and Summit feature films currently cover 11 territories including Australia/New Zealand, Benelux (Belgium/Netherlands/Luxembourg), Canada, CIS (Commonwealth of Independent States), Eastern Europe, France, Germany/Austria, Italy, Poland, Scandinavia and Spain. These output agreements generally include all rights for all media (including home entertainment and television rights). We also distribute theatrical titles in Latin America through our partnership with IDC, certain theatrical titles in China through our financing relationship with Hunan TV & Broadcast Intermediary Co., and certain television and library titles in Asia through our Celestial Tiger Entertainment joint venture. In all, we currently have 17 output arrangements covering 13 major territories and 80% of the movie going population (excluding China and India).

12
We self-distribute motion pictures in the United Kingdom and Ireland through Lionsgate UK (formerly Redbus Film Distribution), which we acquired in October 2005. Lionsgate UK has since established a reputation in the United Kingdom as a leading producer and distributor and acquirer of commercially successful and critically acclaimed product. In fiscal 2016, Lionsgate UK released the following 18 films theatrically:
Fiscal 2016 Theatrical ReleasesLionsgate UK
Title Release DateProduction/Acquisition
A Little Chaos April 17, 2015 ProductionStonehearst Asylum April 24, 2015 AcquisitionA Royal Night Out May 8, 2015 AcquisitionSurvivor June 5, 2015 AcquisitionSlow West June 26, 2015 AcquisitionShe's Funny That Way June 26, 2015 AcquisitionThe Gift August 7, 2015 AcquisitionAbsolutely Nothing August 14, 2015 AcquisitionGood People August 21, 2015 AcquisitionSicario October 9, 2015 ProductionPaper Planes October 23, 2015 AcquisitionBrooklyn November 6, 2015 AcquisitionThe Hunger Games: Mockingjay Part 2 November 29, 2015 ProductionDirty Grandpa January 25, 2016 AcquisitionPride & Prejudice & Zombies February 11, 2016 AcquisitionLondon Has Fallen March 3, 2016 AcquisitionThe Choice March 4, 2016 AcquisitionSing Street March 17, 2016 Acquisition

13
Motion Pictures - Other
Interactive Ventures and Games
Our Interactive Ventures and Games division develops our digital investment strategy as well as our operational initiatives for both our own and third party intellectual property for traditional and digital media adaptation through, among other things, the production and global distribution of multi-platform games, the licensing of content for games and mobile devices, and development of branded online services and experiences including virtual and augmented reality.
Over the past few years, we have invested in interactive storytellers Telltale Games, Finnish mobile game developer/publisher Next Games, live mobile gaming platform Mobcrush, and formed a strategic partnership with Hong Kong based mobile game developer/publisher Fifth Journey.
In gaming, we have announced an Orange Is The New Black slot machine with International Game Technology (which was simultaneously released into their DoubleDown Casino app), partnered with Alcon Entertainment and Starbreeze to create Point Break game pack extensions for Payday 2, released a Norm of the North edutainment app with Hong Kong based Animoca (to be followed by a Norm of the North runner game), and collaborated with Flashman Games on interactive Hunger Games PlayStation 4 themes. We also announced a deeper integration of John Wick into Payday 2, an Expendables mobile game in partnership with Avi Lerner's Millennium Films and Hong Kong-based mobile game developer and publisher Fifth Journey, a Kevin Hart social adventure game with Fifth Journey, and a story driven Now You See Me game with Kiwi. We anticipate significantly building this slate over the next several years.
In the past year, we have also launched a broad range of virtual reality ("VR") initiatives building upon our reputation as early definers of new content platforms and markets. We became one of the first studios to invest in a AAA VR game for tethered headsets (e.g., Vive, Oculus and PlayStation VR) with our soon-to-be released John Wick: The Impossible Task VR Game, a first-person shooter game in collaboration with Starbreeze. We also partnered with Side-Kick VR to develop one of the first-ever premium IP based mobile VR games based on the Now You See Me film franchise. Finally, we produced Hulu’s first original VR experience in collaboration with RocketJump and became one of the first two studios to provide EST and VOD titles to Oculus for the launch of their video platform.
Global Franchise Management and Strategic Partnerships
Our Global Franchise Management and Strategic Partnership division broadly covers all theatrical and television promotions and branded partnerships, licensed consumer products and location-based entertainment initiatives. Our goal is to drive incremental revenue and deepen fan engagement across our entire portfolio of properties via meaningful brand extensions, a direct model consumer products business and location-based entertainment destinations around the world.
Recent initiatives include strategic alliances with Samsung, Kellogg's and Fiat Chrysler Automobiles to support the release of The Hunger Games: Mockingjay - Part 2, a Lionsgate theme park zone featuring multiple attractions scheduled to open at Motiongate Dubai in late 2016, and a Lionsgate branded indoor entertainment experience scheduled to open in Hengqin, China.
Music
Our film and television music departments creatively oversee music for our theatrical and television slates, respectively. Our music strategy is to service the Company’s creative division’s music needs, while providing music for use in marketing our films and television shows. For our theatrical slate, the work of the music department includes overseeing songs, scores and soundtracks for all of our productions, co-productions and acquisitions. For our television slate, the work of the music department includes overseeing music staffing, scores and soundtracks for all of our television productions. Music revenues are derived from the sales and licensing of music from our films and television programs, and the theatrical exhibition of our films and the television broadcasts of our productions.
Ancillary Revenues
Ancillary revenues are derived from the licensing of non-theatrical uses of our films and television programs to distributors who, in turn, make a motion picture or television program available to airlines, hotels, schools, oil rigs, public libraries, prisons, community groups, the armed forces, ships at sea and others.

14
Television Production - Domestic Television
Our television business consists of the development, production, syndication and distribution of television programming. We principally generate revenue from the licensing and distribution of such programming to broadcast television networks, pay and basic cable networks, digital platforms and syndicators of first-run programming, which license programs on a station-by-station basis and pay in cash or via barter (i.e., trade of programming for airtime). Each of these platforms may acquire a mix of original and library programming.
After initial exhibition, we distribute programming to subsequent buyers, both domestically and internationally, including basic cable network, premium subscription services or digital platforms (known as “off-network syndicated programming”). Off-network syndicated programming can be sold in successive cycles of sales which may occur on an exclusive or non-exclusive basis. In addition, television programming is sold on home video (packaged media and via digital delivery) and across all other applicable ancillary revenue streams including music publishing, touring and integration.
As with film production, we use tax credits, subsidies, and other incentive programs for television production in order to maximize our returns and ensure fiscally responsible production models.
In November 2015, we acquired a 62.5% interest in Pilgrim Media Group, one of the world's leading producers of unscripted programming. Following this transaction, we currently produce, syndicate and distribute over 80 television shows on more than 40 networks.
In fiscal 2016, syndication (through our subsidiary, Debmar-Mercury), scripted and unscripted programming produced, co-produced or distributed by us and our affiliated entities included, among others, the following:
Fiscal 2016Scripted Television
Title NetworkCasual Hulu
Chasing Life Freeform (fka ABC Family)Deadbeat Hulu
Graves EPIXGreenleaf OWN
Guilt FreeformManhattan WGN AmericaNashville ABC
Orange Is The New Black NetflixThe Royals E!
Fiscal 2016Unscripted Television - LionsgateTitle Network
Hellevator GSNJoin or Die History
Kicking & Screaming FOXMonica the Medium Freeform
Rocket Jump: The Show HuluRevenge Body E!

15
Fiscal 2016Unscripted Television - Pilgrim StudiosTitle Network
Bring It! LifetimeCelebrity Newlyweds WE tv
David Tutera's CELEBrations WE tvFast & Loud Discovery
Ghost Brothers Destination AmericaGhost Hunters Syfy
Kocktails with Khloe FYIMisfits Garage Discovery
My Big Fat Fabulous Life TLCRaising Whitley OWN
Somebody's Got To Do It AmazonStreet Outlaws Discovery
Welcome to Sweetie Pie's OWNUltimate Fighter FS1
Wicked Tuna National Geographic ChannelWicked Tuna: Outer Banks National Geographic Channel
Fiscal 2016Syndication - Debmar-Mercury
Title NetworkCelebrity Name Game First Run Syndication
Family Feud First Run SyndicationThe Wendy Williams Show First Run Syndication
Are We There Yet? SyndicationAnger Management Syndication
House of Payne SyndicationMeet The Browns Syndication
Television Production- International
We continue to expand our television business internationally through sales and distribution of original Lionsgate television series, third party television programming and format acquisitions. Lionsgate UK has also acquired a 25% interest in British independent television and film production company Kindle Entertainment, marking Lionsgate UK’s entry into the television business as well as the continued globalization of Lionsgate’s television operations.
Television Production-Home Entertainment
For information regarding television production home entertainment revenue, see Motion Pictures - Home Entertainment
above.
Television Production- Other
Other revenues are derived from, among others, product integration in our television episodes and programs, the sales and licensing of music from the television broadcasts of our productions, and from the licensing of our television programs to ancillary markets. For additional information, see Motion Pictures - Other above.
Joint Ventures, Partnerships and Ownership Interests
Our joint ventures, partnerships and ownership interests support our strategy of diversifying our company as a multiplatform global industry leader in entertainment. We regularly evaluate our existing properties, libraries and other assets and businesses in order to determine whether they continue to enhance our competitive position in the industry, have the potential to generate

16
significant long-term returns, represent an optimal use of our capital and are aligned with our goals. When appropriate, we discuss potential strategic transactions with third parties for purchase of our properties, libraries or other assets or businesses that factor into these evaluations. As a result, we may, from time to time, determine to sell individual properties, libraries or other assets or businesses or enter into additional joint ventures, strategic transactions and similar arrangements for individual properties, libraries or other assets or businesses.
Atom Tickets. In August 2014, we acquired an interest in Atom Tickets, a theatrical movie discovery service. Atom Tickets is an Android and iOS app designed to make movie-going simple that can be used to pre-purchase tickets and concessions, coordinate and invite friends without having to pay for them and skip the lines at the theater. It’s movie-going for the twenty-first century. We own an approximately 19.5% interest in Atom Tickets.
Celestial Tiger Entertainment. In January 2012, we formed Celestial Tiger Entertainment, a joint venture with Saban Capital Group, Inc. and Celestial Pictures, a company wholly-owned by Astro Overseas Limited. Celestial Tiger Entertainment is a leading independent media company that focuses on the operation of branded pay television channels and content creation targeted at Asian consumers. It operates a powerful bouquet of distinct pay television channels including: CELESTIAL MOVIES, a premier 24-hour first-run Chinese movie channel in Asia backed by output deals with the top Hong Kong movie studios and distributors; CELESTIAL CLASSIC MOVIES, one of the most widely-distributed Chinese movie channels in the world showcasing Chinese movie masterpieces; CELESTIAL MOVIES PINOY, a Chinese movie channel that is programmed, dubbed and promoted specifically to Filipino viewers; cHK, a general entertainment channel offering cool, chic, and contemporary celebrity-powered Hong Kong entertainment; KIX, the ultimate destination for action entertainment in Asia; KIX 360, the dedicated Over-The-Top linear feed for KIX; MIAO MI, the Mandarin edutainment channel created for preschool kids across Asia; THRILL, Asia's only regional horror, thriller and suspense movie channel; and THRILL 360, the dedicated Over-The-Top linear feed for THRILL. As one of Asia's largest vertically integrated independent entertainment companies, Celestial Tiger Entertainment also produces original content which complements its channels business. We own a 16% interest in Celestial Tiger Entertainment.
DEFY Media. In June 2007, we acquired an interest in Break Media, a multi-platform digital media company and a leader in male-targeted content creation and distribution. In October 2013, Break Media merged with Alloy Digital to create DEFY Media. DEFY Media is a top creator of original content for digital consumers. Across popular comedy, lifestyle, and gaming brands-SMOSH, Clevver, ScreenJunkies, AWE me, Made Man, and Break-DEFY’s in-house created content generates 700 million monthly video views and reaches 125 million viewers on the most relevant and popular platforms. With a social following of more than 100 million, and uniquely integrated capabilities in content development, studio production, and distribution, many of the world’s top brands partner with DEFY to build immersive advertising solutions that deliver access to this influential audience. We own an approximately 15.8% economic interest in DEFY Media.

17
EPIX. In April 2008, we formed EPIX, a joint venture with Viacom, its Paramount Pictures unit and MGM. The fastest growing premium network in 2015, EPIX delivers the latest movie releases, classic film franchises, original series, documentaries, comedy and music events on television, on demand, online and on devices. EPIX has pioneered the development and proliferation of “TV Everywhere.” It was the first premium network to provide multi-platform access to its content online at EPIX.com and was the first premium network to launch on Xbox, PlayStation®, Android phones and tablets, Windows 8.1 and Roku® players. EPIX is also available across Chromecast, Apple® iPads® and iPhones® Android TV and more, delivering more movies than any other premium network with thousands of titles available for streaming. Through relationships with cable, satellite, telco and digital partners, EPIX is available to over 50 million homes nationwide. As reported by SNL Kagan, EPIX grew 39% in 2015 and drove 75% of net unit growth in the category. We own a 31.2% interest in EPIX.
Globalgate Entertainment. In May 2016, reflecting the growing popularity of local-language films in markets around the world, we partnered with international entertainment executives Paul Presburger, William Pfeiffer and Clifford Werber to launch Globalgate Entertainment. Globalgate has built a consortium of leading international producers, distributors and co-financing partners who will identify and provide priority access to intellectual property for production as local-language films in territories worldwide. In addition to properties controlled by its partners, Globalgate will identify third-party properties in the U.S. and internationally for development and production as local-language films. These films will be distributed by the consortium's partners and co-financed by the affiliated Globalgate Fund. Globalgate's consortium partners include Belga (Benelux), Gaumont (France), Kadokawa (Japan), Lotte (Korea), Nordisk Film (Scandinavia), Televisa/Videocine (Mexico), TME (Turkey) and Tobis (Germany). Globalgate expects partners to join soon in territories such as China, India, and other key markets. We own an 30% interest in Globalgate Entertainment.
Next Games. In July 2014, we entered into a strategic partnership and acquired an interest in mobile games developer Next Games. Next Games, founded in 2013 and headquartered in Helsinki, Finland, focuses on crafting visually impressive, highly engaging games. We invested $2.0 million in Next Games for a small minority ownership interest.
Pantelion Films. In September 2010, we launched Pantelion Films, a joint venture with Videocine, an affiliate of Televisa, which produces, acquires and distributes a slate of English and Spanish language feature films that target Hispanic moviegoers in the U.S. Pantelion Films, the first major Latino Hollywood studio and the face of Hispanic entertainment, provides Hispanic moviegoers with a steady source of exciting and original films, including world-class Latino actors, directors and writers. From comedies and dramas to family movies and romantic comedies, Pantelion Films produces and acquires movies that speak directly to acculturated and Spanish-dominant Hispanics alike. Pantelion Films’ fiscal 2016 theatrical slate included the following films: Un Gallo Con Muchos Huevos, the highest grossing Spanish Language animated film in the U.S.; Ladrones, the sequel to Lionsgate’s Ladron Que Roba a Ladrón; Busco Novio Para Mi Mujer; The Vatican Tapes; and Summer Camp. In fiscal 2016, Pantelion Films also wrapped principal photography on No Manches Frida, a Spanish language remake in association with Alcon Entertainment, based on the German blockbuster film Fack Ju Göhte; and began pre-production on How to be a Latin Lover, the studio’s first production under its first look deal with Eugenio Derbez. We own a 49% interest in Pantelion Films.
Pilgrim Media Group. In November 2015, we acquired a 62.5% interest in Craig Piligian’s Pilgrim Media Group. Pilgrim Media Group produces a wide variety of unscripted and scripted programming for television, including David Tutera's CELEBrations for WE tv; Bring It! and spin-off Step It Up! for Lifetime; Fast N' Loud, Misfit Garage, and Street Outlaws for Discovery; Ghost Hunters for Syfy; The Ultimate Fighter for FOX Sports 1; Welcome to Sweetie Pie's and Raising Whitley for OWN; Wicked Tuna and Wicked Tuna: Outer Banks for National Geographic Channel; Somebody's Gotta Do It with Mike Rowe for CNN; My Big Fat Fabulous Life for TLC; and Missing in Alaska for History. Pilgrim Media Group also produces the FYI talk show series Kocktails with Khloe, hosted by Khloe Kardashian. In the scripted realm, Pilgrim Media Group is completing production on the new series Recovery Road for Freeform (formerly known as ABC Family). The company's original movies for Lifetime include Amanda Knox: Murder On Trial In Italy; Abducted: The Carlina White Story, which earned a 2012 NAACP Image Award for Outstanding Writing In A Motion Picture; and the crime thriller Stalkers. We own a 62.5% membership interest in Pilgrim Media Group.
18
Pop. Entered into in March 2013, Pop (formerly TV Guide Network), our joint venture with CBS, is an entertainment television destination seen in approximately 80 million homes with programming that celebrates fandom and what’s popping in culture. The partnership combines CBS’s programming, production and marketing assets with our resources in motion pictures, television and digitally delivered content. Pop’s ownership structure is comprised of the company with the number one broadcast network and many of the top first-run syndication series (Entertainment Tonight, The Insider) and the studio that produced and distributes the blockbuster Hunger Games, Twilight and Divergent franchises and produces such award-winning TV series as Mad Men and Orange is the New Black. We own a 50% interest in Pop.
Roadside Attractions. In July 2007, we acquired an interest in Roadside Attractions, an independent theatrical distribution company. In just over a decade, Roadside Attractions’ films have grossed over $200 million and garnered 13 Academy Award® nominations. Roadside has released such critical and commercially successful films as Mr. Holmes, Love & Mercy, A Most Wanted Man, Dear White People, The Skeleton Twins, All Is Lost, Mud, Winter’s Bone, The Cove, Arbitrage, Margin Call and Super Size Me. Its upcoming slate includes A Hologram for the King, Love & Friendship, Genius, Our Kind of Traitor, Indignation, Southside with You and Manchester by the Sea. We own a 43% interest in Roadside Attractions.
Starz. Starz (NASDAQ: STRZA, STRZB) is a leading integrated global media and entertainment company with operating units that provide premium subscription video programming on domestic U.S. pay television networks (Starz Networks) and global content distribution (Starz Distribution), www.starz.com. The Starz Networks operating unit is home to the flagship STARZ® brand with 23.6 million subscribers in the United States as of December 31, 2015, with the STARZ ENCORESM network at 32.2 million subscribers. Through STARZ, the company provides high quality, entertaining premium subscription video programming with 17 premium pay TV channels and associated on-demand and online services. STARZ is sold through U.S. multichannel video distributors, including cable operators, satellite television providers, telecommunications companies, and other online and digital platforms. Starz offers subscribers more than 5,000 distinct premium television episodes and feature films every year and up to 1,500 every month, including STARZ Original series, first-run movies and other popular movie and television programming. The Starz Distribution operating unit is home to the Anchor Bay Entertainment, Starz Digital, and Starz Worldwide Distribution divisions. In addition to STARZ Original series, Starz Distribution develops, produces and acquires movies, television and other entertainment content for worldwide home video, digital, and television licensing and sales. We currently own approximately 4.8% of Starz common stock outstanding and 15.0% of the total voting power of Starz common stock.
Telltale Games. In February 2015, we acquired an interest in Telltale Games, a leading and award-winning independent developer and publisher of games for every major interactive platform from home consoles and PC to mobile and tablet devices, and pioneer of the episodic delivery of digital gaming content. By successfully developing games as an episodic series and frequently releasing in the format of a game season, Telltale Games creates longer consumer engagement than traditional games for each release. Founded in 2004 by games industry veterans with decades of experience, Telltale Games has quickly become an industry leader with numerous honors and awards from the Academy of Interactive Arts and Sciences, BAFTA, the IMGA, and more, as well as being named Studio of the Year across multiple years. Telltale Games’ reputation for quality has been established across more than two dozen different product releases over the years with recognition and acclaim from publications like IGN, The New York Times, and Variety, including over 100 "Game of the Year" awards from publications like USA Today, Yahoo! Games, Wired, Spike TV VGAs, E!, Official Xbox Magazine, The Telegraph, Metacritic, and more. Telltale is a fully licensed third party publisher on consoles from Microsoft, Sony, and Nintendo, and also publishes games on the PC, Mac, iOS, and Android-based platforms. We own an approximately 14% economic interest in Telltale Games.
Intellectual Property
We currently use a number of trademarks, service marks, copyrights, domain names and similar intellectual property in connection with our business and own registrations and applications to register them both domestically and internationally. We believe that ownership of such trademarks, service marks, copyrights, domain names and similar intellectual property is an important factor in our business and that our success does depends, in part, on such ownership.
Motion picture and television piracy is extensive in many parts of the world, including South America, Asia and certain Eastern European countries, and is made easier by technological advances and the conversion of content into digital formats. This trend

19
facilitates the creation, transmission and sharing of high quality unauthorized copies of content on packaged media and through digital formats. The proliferation of unauthorized copies of these products has had and will likely continue to have an adverse effect on our business, because these products reduce the revenue we receive from our products. Our ability to protect and enforce our intellectual property rights is subject to certain risks and from time to time, we encounter disputes over rights and obligations concerning intellectual property. We cannot provide assurance that we will prevail in any intellectual property disputes.
This Annual Report on Form 10-K contains references to our trademarks and to trademarks belonging to other entities. Solely for convenience, trademarks and trade names referred to in this Annual Report on Form 10-K, including logos, artwork and other visual displays, may appear without the ® or TM symbols, but such references are not intended to indicate, in any way, that we will not assert, to the fullest extent under applicable law, our rights or the rights of the applicable licensor to these trademarks and trade names. We do not intend our use or display of other companies’ trade names or trademarks to imply a relationship with, or endorsement or sponsorship of us by, any other company.
Competition
Television and motion picture production and distribution are highly competitive businesses. We face competition from companies within the entertainment business and from alternative forms of leisure entertainment, such as travel, sporting events, outdoor recreation, video games, the internet and other cultural related activities. We compete with the major studios, numerous independent motion picture and television production companies, television networks, pay television systems and digital media platforms for the acquisition of literary and film properties, the services of performing artists, directors, producers and other creative and technical personnel and production financing, all of which are essential to the success of our entertainment businesses. In addition, our motion pictures compete for audience acceptance and exhibition outlets with motion pictures produced and distributed by other companies. Likewise, our television product faces significant competition from independent distributors as well as major studios. As a result, the success of any of our motion pictures and television product is dependent not only on the quality and acceptance of a particular film or program, but also on the quality and acceptance of other competing motion pictures or television programs released into the marketplace at or near the same time.
Given such competition, we attempt to operate with a different business model than many others. We typically emphasize a lower cost structure, risk mitigation, reliance on financial partnerships and innovative financial strategies. Our cost structures are designed to utilize our flexibility and agility as well as the entrepreneurial spirit of our employees, partners and affiliates, in order to provide creative entertainment content to serve diverse audiences worldwide.
Social Responsibility
We are committed to acting responsibly and making a positive difference in the local and global community through Lionshares, the umbrella for our companywide commitment to our communities. Lionshares is a volunteer program that seeks to provide opportunities for employees within the Lionsgate family to partner with a diverse range of charitable organizations. The program not only enriches the Lionsgate work experience through cultural and educational outreach, but also positively interacts and invests in the local and global community. Specifically, Lionshares strives to:
• Provide diverse activities intended to appeal to a broad range of interests, including: literacy, elderly visits, food banks, animal interactions, disaster relief, community relations, environmental activities, health/fitness, cancer awareness and charitable fundraising.
• Partner with leading organizations with expertise in these areas. • Create an effectual and influential impact through human contact.• Share time and experience, not just among Lionsgate employees, but with the greater community as well.
For further information about our social responsibility initiatives, see www.lionsgate.com/corporate/volunteer.
Employees
As of May 23, 2016, we had 795 full-time employees in our worldwide operations, including full-time and part-time employees of our wholly-owned subsidiaries and consolidated ventures. We also utilize many consultants in the ordinary course of our business and hire additional employees on a project-by-project basis in connection with the production of our motion pictures and television programming.
Corporate History

20
We are a corporation organized under the laws of the Province of British Columbia, resulting from the merger of Lions Gate Entertainment Corp. and Beringer Gold Corp. on November 13, 1997. Beringer Gold Corp. was incorporated under the Business Corporation Act (British Columbia) on May 26, 1986 as IMI Computer Corp. Lions Gate Entertainment Corp. was incorporated under the Canada Business Corporations Act using the name 3369382 Canada Limited on April 28, 1997, amended its articles on July 3, 1997 to change its name to Lions Gate Entertainment Corp., and on September 24, 1997, continued under the Business Corporation Act (British Columbia).
Available Information
Our Annual Report on Form 10-K, Quarterly Reports on Form 10-Q, Current Reports on Form 8-K, proxy statements and amendments to those reports filed or furnished pursuant to Sections 13(a) and 15(d) of the Exchange Act, are available, free of charge, on our website at www.lionsgate.com as soon as reasonably practicable after we electronically file such material with, or furnish it to, the Securities and Exchange Commission (the “SEC”). The Company's Disclosure Policy, Corporate Governance Guidelines, Standards for Director Independence, Code of Business Conduct and Ethics for Directors, Officers and Employees, Code of Ethics for Senior Financial Officers, Policy on Shareholder Communications, Related Person Transaction Policy, Charter of the Audit & Risk Committee, Charter of the Compensation Committee and Charter of the Nominating and Corporate Governance Committee and any amendments thereto are also available on the Company's website, as well as in print to any shareholder who requests them. The information posted on our website is not incorporated into this Annual Report on Form 10-K.
The SEC maintains an internet site that contains reports, proxy and information statements and other information regarding issuers that file electronically with the SEC at www.sec.gov. The public may read and copy any materials we file with the SEC at the SEC's Public Reference Room at 100 F Street, NE, Washington, D.C. 20549. The public may obtain information on the operation of the Public Reference Room by calling the SEC at 1-800-SEC-0330.
ITEM 1A. RISK FACTORS.
You should carefully consider the risks described below as well as other information included in, or incorporated by reference into in this Form 10-K. The risks described below are not the only ones facing the Company. Additional risks that we are not presently aware of, or that we currently believe are immaterial, may also become important factors that affect us. All of these risks and uncertainties could adversely affect our business, financial condition, operating results, liquidity and prospects.
We face substantial capital requirements and financial risks.
Our business requires a substantial investment of capital. The production, acquisition and distribution of motion pictures and television programs require a significant amount of capital. A significant amount of time may elapse between our expenditure of funds and the receipt of revenues from our motion pictures or television programs. This time lapse may require us to fund a significant portion of our capital requirements from our credit facilities or other financing sources. Although we intend to continue to reduce the risks of our production exposure through financial contributions from broadcasters and distributors, tax credit programs, government and industry programs, other studios and co-financiers and other sources, we cannot assure you that we will continue to successfully implement these arrangements or that we will not be subject to substantial financial risks relating to the production, acquisition, completion and release of future motion pictures and television programs. In addition, if we increase (through internal growth or acquisition) our production slate or our production budgets, we may be required to increase overhead and/or make larger up-front payments to talent and, consequently, bear greater financial risks. Any of the foregoing could have a material adverse effect on our business, financial condition, operating results, liquidity and prospects.
The costs of producing and marketing feature films is high and may increase in the future, which may make it more difficult for a film to generate a profit or compete against other films. The costs of producing and marketing feature films generally increase from year to year, which may make it more difficult for our films to generate a profit or compete against other films. A continuation of this trend would leave us more dependent on other media, such as packaged media, digital media, television and international markets, which revenues may not be sufficient to offset an increase in the cost of motion picture production and marketing. If we cannot successfully exploit these other media, it could have a material adverse effect on our business, financial condition, operating results, liquidity and prospects.
Budget overruns may adversely affect our business. While our business model requires that we be efficient in the production of our motion pictures and television programs, actual motion picture and television production costs may exceed their budgets. The

21
production, completion and distribution of motion pictures and television productions can be subject to a number of uncertainties, including delays and increased expenditures due to disruptions or events beyond our control. As a result, if a motion picture or television production incurs substantial budget overruns, we may have to seek additional financing from outside sources to complete production or fund the overrun ourselves. We cannot make assurances regarding the availability of such financing or on terms acceptable to us, nor can we assure you that we will recoup these costs. For instance, increased costs incurred with respect to a particular film may result in any such film not being ready for release at the intended time and the postponement to a potentially less favorable date, all of which could cause a decline in box office performance, and, thus, the overall financial success of such film. Budget overruns could also prevent a picture from being completed or released. Any of the foregoing could have a material adverse effect on our business, financial condition, operating results, liquidity and prospects.
We may not be able to generate sufficient cash to service all of our indebtedness, and we may be forced to take other actions to satisfy our obligations under our indebtedness, which may not be successful.
Our ability to make scheduled payments or to refinance our debt obligations depends on our financial and operating performance, which is subject to prevailing economic and competitive conditions and to certain financial, business and other factors beyond our control. We cannot assure you that we will maintain a level of cash flows from operating activities sufficient to permit us to pay the principal, premium, if any, and interest on our indebtedness. If our cash flows and capital resources are insufficient to fund our debt service obligations, we may be forced to reduce or delay capital expenditures, sell assets or operations, seek additional capital or restructure or refinance our indebtedness. We cannot assure you that we would be able to take any of these actions, that these actions would be successful and permit us to meet our scheduled debt service obligations or that these actions would be permitted under the terms of our existing or future debt agreements, including our credit facilities and the indenture governing our senior secured notes. In the absence of such cash flows or capital resources, we could face substantial liquidity problems and might be required to dispose of material assets or operations to meet our debt service and other obligations. Our credit facilities and the indenture governing our senior secured notes restrict our ability to dispose of assets and use the proceeds from such dispositions. We may not be able to consummate those dispositions or to obtain the proceeds which we could realize from them and these proceeds may not be adequate to meet any debt service obligations then due.
If we cannot make scheduled payments on our debt, we will be in default and, as a result:
• our debt holders could declare all outstanding principal and interest to be due and payable;• the lenders under our credit facilities could terminate their commitments to lend us money;• the holders of our secured debt could foreclose against the assets securing their borrowings; and/or• we could be forced into bankruptcy or liquidation.
If our level of corporate debt increases, it could adversely affect our ability to raise additional capital to fund our operations, require us to dedicate substantial capital to servicing our debt obligations, expose us to interest rate risk, limit our ability to pursue strategic business opportunities, affect our ability to react to changes in the economy or our industry and prevent us from meeting our debt obligations.
As of March 31, 2016, our corporate debt was $887.9 million (carrying value - $886.1 million). In addition, our productionloan obligations were $690.4 million.
On July 19, 2013, we redeemed $432.0 million of our 10.25% Senior Secured Second-Priority Notes (the “10.25% Senior Notes”), issued $225.0 million of our 5.25% Senior Secured Second-Priority Notes (the “5.25% Senior Notes”) and borrowed $225.0 million under our Second Lien Credit and Guarantee Agreement dated July 19, 2013 (the “Term Loan Due 2020”). On March 17, 2015, we redeemed the Term Loan Due 2020 and borrowed $375 million under our Second Lien Credit and Guarantee Agreement dated March 17, 2015 (the "Term Loan Due 2022"). On March 17, 2015, the April 2009 3.625% Notes were called for redemption and in April 2015, the holders of the notes converted substantially all of the outstanding principal amounts into common shares. On May 4, 2015, we amended the Term Loan Due 2022 to increase the aggregate principal amount to $400 million.
A substantial degree of leverage could have important consequences, including the following:
• it may limit our ability to obtain additional debt or equity financing for working capital, capital expenditures, motion picture and television development, production and distribution, debt service requirements, acquisitions or general corporate or other purposes, or limit our ability to obtain such financing on terms acceptable to us;
• a portion of our cash flows from operations will be dedicated to the payment of principal and interest on our indebtedness and will not be available for other purposes, including funding motion picture and television production, development and distribution and other operating expenses, capital expenditures and future business opportunities;

22
• the debt service requirements of our indebtedness could make it more difficult for us to satisfy our financial obligations;• certain of our borrowings, including borrowings under our secured credit facilities are at variable rates of interest, exposing
us to the risk of increased interest rates;• it may limit our ability to adjust to changing market conditions and place us at a competitive disadvantage compared to our
competitors that have less debt;• it may limit our ability to pursue strategic acquisitions and other business opportunities that may be in our best interests;• we may be vulnerable to a downturn in general economic conditions or in our business; and/or• we may be unable to carry out capital spending that is important to our growth.
Despite our current indebtedness levels, we and our subsidiaries may be able to incur additional debt in the future.
Although each of our credit facilities and the indentures governing our senior secured notes contains covenants that, among other things, limit our ability to incur additional indebtedness, including guarantees, make restricted payments and investments, and grant liens on our assets, the covenants contained in such debt documents provide a number of important exceptions and thus, do not prohibit us or our subsidiaries from doing so. Such exceptions will provide us substantial flexibility to incur indebtedness, grant liens and expend funds to operate our business. For example, under the terms of the indenture governing our senior secured notes (i) with few restrictions, we may incur indebtedness in connection with certain film and television financing arrangements, including without limitation, purchasing or acquiring rights in film or television productions or financing print and advertising expenses, and such indebtedness may be secured by liens senior to the liens in respect of our senior secured notes, and (ii) in limited circumstances, we may make investments in assets that are not included in the borrowing base supporting our senior secured notes, in each case, without having to meet the leverage ratio tests for debt incurrence or to fit such investments within the restricted payments “build up basket” or within other categories of funds applicable to making investments and other restricted payments under the indenture governing our senior secured notes.
In addition, we may incur additional indebtedness through our senior secured credit facility. We may borrow up to $800 million under the senior secured credit facility. At March 31, 2016, we have $161.0 million of borrowings under our senior secured credit facility, and no letters of credit outstanding. We could borrow some or all of the remaining permitted amount in the future. The amount we have available to borrow under this facility depends upon our borrowing base, which in turn depends on the value of our existing library of films and television programs, as well as accounts receivable and cash held in collateral accounts. If new debt is added to our and our subsidiaries' existing debt levels, this has the potential to magnify the risks discussed above relating to our ability to service our indebtedness and the potential adverse impact our high level of indebtedness could have on us.
An increase in the ownership of our common shares by certain shareholders could trigger a change in control under the agreements governing our long-term indebtedness.
The agreements governing certain of our long-term indebtedness contain change in control provisions that are triggered when any of our shareholders, directly or indirectly, acquires ownership or control in excess of a certain percentage of our common shares. As of May 23, 2016, five of our shareholders, Mark H. Rachesky, M.D., Capital World Investors, FMR, LLC, Capital Research Global Investors and Vanguard Group and their respective affiliates, beneficially owned approximately 20.5%, 6.0%, 5.8%, 5.3%, and 5.0%, respectively, of our outstanding common shares.
Under certain circumstances, including the acquisition of ownership or control by a person or group in excess of 50% of our common shares, the holders of our senior secured notes and our convertible senior subordinated notes may require us to repurchase all or a portion of such notes upon a change in control and the holders of our convertible senior subordinated notes may be entitled to receive a make whole premium based on the price of our common shares on the change in control date. We may not be able to repurchase these notes upon a change in control because we may not have sufficient funds. Further, we may be contractually restricted under the terms of our secured credit facilities from repurchasing all of the notes tendered by holders upon a change in control. Our failure to repurchase our senior secured notes upon a change in control would cause a default under the indentures governing the senior secured notes and the convertible senior subordinated notes and a cross-default under our secured credit facilities.
Our secured credit facilities also provide that a change in control, which includes a person or group acquiring ownership or control in excess of 50% of our outstanding common shares, will be an event of default that permits lenders to accelerate the maturity of borrowings thereunder and to enforce security interests in the collateral securing such debt, thereby limiting our ability to raise cash to purchase our outstanding senior secured notes and convertible senior subordinated notes. Any of our future debt agreements may contain similar provisions.

23
Restrictive covenants may adversely affect our operations.
Our credit facilities and the indenture governing our senior secured notes contain various covenants that, subject to certain exceptions, limit our ability to, among other things:
• incur or assume additional debt or provide guarantees in respect of obligations of other persons;• issue redeemable stock and preferred stock;• pay dividends or distributions or redeem or repurchase capital stock;• prepay, redeem or repurchase debt that is junior in right of payment to our senior secured notes;• make loans, investments and capital expenditures;• incur liens;• engage in sale/leaseback transactions;• restrict dividends, loans or asset transfers from our subsidiaries;• sell or otherwise dispose of assets, including capital stock of subsidiaries;• consolidate or merge with or into, or sell substantially all of our assets to, another person;• enter into transactions with affiliates; and• enter into new lines of business.
These covenants may prevent us from raising additional financing, competing effectively or taking advantage of new business opportunities. In addition, the restrictive covenants in our credit facilities require us to maintain specified financial ratios and satisfy other financial condition tests and the indenture governing our senior secured notes, outside of specified exceptions, requires us to satisfy certain financial tests in order to engage in activities such as incurring debt or making restricted payments. Our ability to comply with these covenants or meet those financial ratios and tests can be affected by events beyond our control (such as a change in control event), and we cannot assure you that we will meet them. See “An increase in the ownership of our common shares by certain shareholders could trigger a change in control under the agreements governing our long-term indebtedness.” Upon the occurrence of an event of default under our credit facilities, the indenture governing our senior secured notes or the agreements governing our other financing arrangements, the holders of such debt could elect to declare all amounts outstanding to be immediately due and payable and the lenders under our credit facilities could terminate all commitments to extend further credit. Further, the holders of our secured debt that is secured by a first priority or other senior lien, could proceed against the collateral granted to them to secure that indebtedness, which collateral represents substantially all of our assets. If the holders of our debt accelerate the repayment of borrowings, we cannot assure you that we will have sufficient cash flow or assets to repay our debt, or borrow sufficient funds to refinance such indebtedness. Even if we are able to obtain new financing, it may not be on commercially reasonable terms, or terms that are acceptable to us.
Variable rate indebtedness subjects us to interest rate risk, which could cause our debt service obligations to increase significantly.
Certain of our borrowings, primarily borrowings under our senior credit facility, are at variable rates of interest and expose us to interest rate risk. If interest rates increase, our debt service obligations on the variable rate indebtedness would increase even though the amount borrowed remained the same. The applicable margin with respect to loans under our senior secured credit facility is a percentage per annum equal to 2.50% plus an adjusted rate based on LIBOR.
Assuming that our senior secured credit facility is fully drawn, based on the applicable LIBOR in effect as of March 31, 2016, each quarter point change in interest rates would result in a $2.0 million change in annual interest expense. In the future, we may enter into interest rate swaps, involving the exchange of floating for fixed rate interest payments, to reduce interest rate volatility.
We have had losses in the past, and we cannot assure future profitability.
Even though we have reported operating income for fiscal years 2010 through 2015, we had operating losses for fiscal year 2009 and 2016. We have also reported net losses for the fiscal years 2009 through 2012. Our retained earnings were $7.6 million at March 31, 2016. We cannot assure you that we will operate profitably in future periods and, if we do not, we may not be able to meet our debt service requirements, working capital requirements, capital expenditure plans, production slate, acquisition and releasing plans or other cash needs. Our inability to meet those needs could have a material adverse effect on our business, financial condition, operating results, liquidity and prospects.

24
We may incur significant write-offs if our feature films and other projects do not perform well enough to recoup production, marketing and distribution costs.
We are required to amortize capitalized production costs over the expected revenue streams as we recognize revenue from the associated films or other projects. The amount of production costs that will be amortized each quarter depends on, among other things, how much future revenue we expect to receive from each project. Unamortized production costs are evaluated for impairment each reporting period on a project-by-project basis. If estimated remaining revenue is not sufficient to recover the unamortized production costs, the unamortized production costs will be written down to fair value. In any given quarter, if we lower our previous forecast with respect to total anticipated revenue from any individual feature film or other project, we may be required to accelerate amortization or record impairment charges with respect to the unamortized costs, even if we have previously recorded impairment charges for such film or other project. Such impairment charges could adversely impact our business, operating results and financial condition.
Our revenues and results of operations may fluctuate significantly.
Our results of operations are difficult to predict and depend on a variety of factors. Our results of operations depend significantly upon the commercial success of the motion pictures and television programming that we distribute, which cannot be predicted with certainty. In particular, the underperformance at the box office of one or more motion pictures in any period may cause our revenue and earnings results for that period (and potentially, subsequent periods) to be less than anticipated, in some instances to a significant extent. Accordingly, our results of operations may fluctuate significantly from period to period, and the results of any one period may not be indicative of the results for any future periods.
Our results of operations also fluctuate due to the timing, mix, number and availability of our theatrical motion picture and home entertainment releases, as well as license periods for our content. Our operating results may increase or decrease during a particular period or fiscal year due to differences in the number and/or mix of films released compared to the corresponding period in the prior year or prior fiscal year.
Moreover, our results of operations may be impacted by the success of all of our theatrical releases, including critically acclaimed and award winning films. We cannot assure you that we will manage the production, acquisition and distribution of all future motion pictures successfully including critically acclaimed, award winning and/or commercially popular films or that we will produce or acquire motion pictures that will receive critical acclaim or perform well commercially. Any inability to achieve such commercial success could have a material adverse effect on our business, financial condition, operating results, liquidity and prospects.
Our operating results also fluctuate due to our accounting practices (which are standard for the industry) which may cause us to recognize the production and marketing expenses in different periods than the recognition of related revenues, which may occur in later periods. For example, in accordance with generally accepted accounting principles and industry practice, we are required to expense film advertising costs as incurred, but are also required to recognize the revenue from any motion picture or television program over the entire revenue stream expected to be generated by the individual picture or television program. In addition, we amortize film and television programming costs using the "individual-film-forecast" method. Under this accounting method, we amortize film and television programming costs for each film or television program based on the following ratio:
Revenue earned by title in the current periodEstimated total future revenues by title as of the beginning of the year
We regularly review, and revise when necessary, our total revenue estimates on a title-by-title basis. This review may result in a change in the rate of amortization and/or a write-down of the film or television asset to its estimated fair value. Results of operations in future years depend upon our amortization of our film and television costs. Periodic adjustments in amortization rates may significantly affect these results.
In addition, the comparability of our results may be affected by changes in accounting guidance or changes in our ownership of certain assets and businesses. Accordingly, our results of operations from year to year may not be directly comparable to prior reporting periods.
As a result of the foregoing and other factors, our results of operations may fluctuate significantly from period to period, and the results of any one period may not be indicative of the results for any future period.
We have few output agreements with cable and broadcast channels. We distribute our library of motion picture titles and television episodes and programs through EPIX, certain broadcast channels such as Pop (which exhibit our films, but license such rights on

25
a film-by-film, rather than an output basis) and, specifically, for certain Summit Entertainment motion picture titles, through Showtime Networks and HBO. We cannot assure you that we will be able to secure other output agreements on acceptable terms, if at all. Without multiple output agreements that typically contain guaranteed minimum payments, our revenues may be subject to greater volatility, which could have a material adverse effect on our business, financial condition, operating results, liquidity and prospects.
We do not have long-term arrangements with many of our production or co-financing partners. We typically do not enter into long term production contracts with the creative producers of the films we produce, acquire or distribute. Moreover, we generally have certain derivative rights that provide us with distribution rights to, for example, prequels, sequels and remakes of certain films we produce, acquire or distribute. However, there is no guarantee that we will produce, acquire or distribute future films by any creative producer or co-financing partner, and a failure to do so could adversely affect our business, financial condition, operating results, liquidity and prospects.
We rely on a few major retailers and distributors and the loss of any of those retailers or distributors could reduce our revenues and operating results. Netflix represented approximately 12% of our revenues in fiscal 2016. In addition, a small number of other retailers and distributors account for a material percentage of our revenues. We do not have long-term agreements with retailers. We cannot assure you that we will continue to maintain favorable relationships with our retailers and distributors or that they will not be adversely affected by economic conditions. If any of these retailers or distributors reduces or cancels a significant order or becomes bankrupt, it could have a material adverse effect on our business, financial condition, operating results, liquidity and prospects.
Our revenues and results of operations are vulnerable to currency fluctuations. We report our revenues and results of operations in U.S. dollars, but a significant portion of our revenues is earned outside of the U.S. Our currency exposure is primarily between Canadian dollars, British pound sterling, Euros, Australian dollars and U.S. dollars. We cannot accurately predict the impact of future exchange rate fluctuations on revenues and operating margins, and fluctuations could have a material adverse effect on our business, financial condition, operating results, liquidity and prospects. From time to time, we may experience currency exposure on distribution and production revenues and expenses from foreign countries, which could have a material adverse effect on our business, financial condition, operating results, liquidity and prospects.
Failure to manage future growth may adversely affect our business.
We are subject to risks associated with possible acquisitions, business combinations, or joint ventures. From time to time, we engage in discussions and activities with respect to possible acquisitions, sale of assets, business combinations, or joint ventures intended to complement or expand our business, some of which may be significant transactions for us. We may not realize the anticipated benefit from any of the transactions we pursue. Regardless of whether we consummate any such transaction, the negotiation of a potential transaction, as well as the integration of the acquired business, could require us to incur significant costs and cause diversion of management's time and resources. Any such transaction could also result in impairment of goodwill and other intangibles, development write-offs and other related expenses. Any of the foregoing could have a material adverse effect on our business, financial condition, operating results, liquidity and prospects.
We may be unable to integrate any business that we acquire or have acquired or with which we combine or have combined. Integrating any business that we acquire or have acquired or with which we combine or have combined may be distracting to our management and disruptive to our business and may result in significant costs to us. We could face several challenges in the consolidation and integration of information technology, accounting systems, personnel and operations. If any such integration is unsuccessful, or if the integration takes longer than anticipated, there could be a material adverse effect on our business, financial condition, operating results, liquidity and prospects. We may have difficulty managing the combined entity in the short term if we experience a significant loss of management personnel during the transition period after a significant acquisition.
Claims against us relating to any acquisition or business combination may necessitate our seeking claims against the seller for which the seller may not indemnify us or that may exceed the seller's indemnification obligations. There may be liabilities assumed in any acquisition or business combination that we did not discover or that we underestimated in the course of performing our due diligence. Although a seller generally will have indemnification obligations to us under an acquisition or merger agreement, these obligations usually will be subject to financial limitations, such as general deductibles and maximum recovery amounts, as well as time limitations. We cannot assure you that our right to indemnification from any seller will be enforceable, collectible or sufficient in amount, scope or duration to fully offset the amount of any undiscovered or underestimated liabilities that we may incur. Any such liabilities, individually or in the aggregate, could have a material adverse effect on our business, financial condition, operating results, liquidity and prospects.

26
We may not be able to obtain additional funding to meet our requirements. Our ability to grow through acquisitions, business combinations and joint ventures, to maintain and expand our development, production and distribution of motion pictures and television programs, and to fund our operating expenses depends upon our ability to obtain funds through equity financing, debt financing (including credit facilities) or the sale or syndication of some or all of our interests in certain projects or other assets or businesses. If we do not have access to such financing arrangements, and if other funds do not become available on terms acceptable to us, there could be a material adverse effect on our business, financial condition, operating results, liquidity and prospects.
Our dispositions may not aid our future growth. If we determine to sell individual properties, libraries or other assets or businesses, we will benefit from the net proceeds realized from such sales. However, our revenues may suffer in the long term due to the disposition of a revenue generating asset, or the timing of such dispositions may be poor, causing us to fail to realize the full value of the disposed asset, all of which may diminish our ability to service our indebtedness and repay our notes and our other indebtedness at maturity. Furthermore, our goal of building a diversified platform for future growth may be inhibited if the disposed asset contributed in a significant way to the diversification of our business platform.
Limitations on control of joint ventures may adversely impact our operations.
We hold our interests in certain businesses as a joint venture or in partnership with non-affiliated third parties. As a result of such arrangements, we may be unable to control the operations, strategies and financial decisions of such joint venture or partnership entities which could, in turn, result in limitations on our ability to implement strategies that we may favor and may limit our ability to transfer our interests. Consequently, any losses experienced by these entities could adversely impact our results of operations and the value of our investment.
A significant portion of our film and television content library revenues comes from a small number of titles.
We depend on a limited number of titles in any given fiscal quarter for the majority of the revenues generated by our film and television content library. In addition, many of the titles in our library are not presently distributed and generate substantially no revenue. If we cannot acquire new product and the rights to popular titles through production, distribution agreements, acquisitions, mergers, joint ventures or other strategic alliances, it could have a material adverse effect on our business, financial condition, operating results, liquidity and prospects.
We are limited in our ability to exploit a portion of our film and television content library.
Our rights to the titles in our film and television content library vary; in some cases, we have only the right to distribute titles in certain media and territories for a limited term. We cannot assure you that we will be able to renew expiring rights on acceptable terms and that any failure to renew titles generating a significant portion of our revenue would not have a material adverse effect on our business, financial condition, operating results, liquidity and prospects.
Our success depends on external factors in the motion picture and television industry.
Our success depends on the commercial success of motion pictures and television programs, which is unpredictable. Generally, the popularity of our motion pictures and television programs depends on many factors, including the critical acclaim they receive, the format of their initial release (for example, theatrical or direct-to-video), their actors and other key talent, their genre and their specific subject matter, audience reaction, the quality and acceptance of motion pictures or programs that our competitors release into the marketplace at or near the same time, critical reviews, the availability of alternative forms of entertainment and leisure activities, general economic conditions and other tangible and intangible factors, many of which we do not control and all of which may change. We cannot predict the future effects of these factors with certainty. In addition, because a motion picture's or television program's performance in ancillary markets, such as home video and pay and free television, is often directly related to its box office performance or television ratings, poor box office results or poor television ratings may negatively affect future revenue streams. Our success will depend on the experience and judgment of our management to select and develop new investment and production opportunities. We cannot make assurances that our motion pictures and television programs will obtain favorable reviews or ratings, that our motion pictures will perform well at the box office or in ancillary markets or that broadcasters will license the rights to broadcast any of our television programs in development or renew licenses to broadcast programs in our library. The failure to achieve any of the foregoing could have a material adverse effect on our business, financial condition, operating results, liquidity and prospects.
Global economic turmoil and regional economic conditions in the U.S. could adversely affect our business. Global economic turmoil may cause a general tightening in the credit markets, lower levels of liquidity, increases in the rates of default and bankruptcy, levels of intervention from the U.S. federal government and other foreign governments, decreased consumer confidence, overall slower economic activity and extreme volatility in credit, equity and fixed income markets. A decrease in economic activity in the
27
U.S. or in other regions of the world in which we do business could adversely affect demand for our films, thus reducing our revenues and earnings. A decline in economic conditions could reduce performance of our theatrical, television and home entertainment releases. In addition, an increase in price levels generally could result in a shift in consumer demand away from the entertainment we offer, which could also adversely affect our revenues and, at the same time, increase our costs. Moreover, financial institution failures may cause us to incur increased expenses or make it more difficult to finance any future acquisitions, or engage in other financing activities. We cannot predict the timing or the duration of any downturn in the economy and we are not immune to the effects of general worldwide economic conditions.
Licensed distributors' failure to promote our programs may adversely affect our business. We generally do not control the timing and manner in which our licensed distributors distribute our motion pictures or television programs; their decisions regarding the timing of release and promotional support are important in determining success. Any decision by those distributors not to distribute or promote one of our motion pictures, television programs or related products or to promote our competitors' motion pictures, television programs or related products to a greater extent than they promote ours could have a material adverse effect on our business, financial condition, operating results, liquidity and prospects.
We could be adversely affected by strikes or other union job actions. We are directly or indirectly dependent upon highly specialized union members who are essential to the production of motion pictures and television programs. A strike by, or a lockout of, one or more of the unions that provide personnel essential to the production of motion pictures or television programs could delay or halt our ongoing production activities, or could cause a delay or interruption in our release of new motion pictures and television programs, which could have a material adverse effect on our business, financial condition, operating results, liquidity and prospects.
Business interruptions could adversely affect our operations. Our operations are vulnerable to outages and interruptions due to fire, floods, power loss, telecommunications failures and similar events beyond our control. In addition, we currently have our offices in Southern California. This area in California is subject to earthquakes. Although we have developed certain plans to respond in the event of a disaster, there can be no assurance that they will be effective in the event of a specific disaster. In the event of a short-term power outage, we have installed UPS (uninterrupted power source) equipment designed to protect our equipment. A long-term power outage, however, could disrupt our operations. Prices for electricity have in the past risen dramatically and may increase in the future. An increase in prices would increase our operating costs, which could in turn adversely affect our profitability. Although we currently carry business interruption insurance for potential losses (including earthquake-related losses), there can be no assurance that such insurance will be sufficient to compensate us for losses that may occur or that such insurance may continue to be available on affordable terms. Any losses or damages incurred by us could have a material adverse effect on our business and results of operations.
We face substantial competition in all aspects of our business.
We are smaller and less diversified than many of our competitors. Unlike us, an independent distributor and producer, most of the major U.S. studios are part of large diversified corporate groups with a variety of other operations, including television networks and cable channels that can provide both the means of distributing their products and stable sources of earnings that may allow them to better offset fluctuations in the financial performance of their motion picture and television operations. In addition, the major studios have more resources with which to compete for ideas, storylines and scripts created by third parties as well as for actors, directors and other personnel required for production. The resources of the major studios may also give them an advantage in acquiring other businesses or assets, including film libraries, that we might also be interested in acquiring.
The motion picture industry is highly competitive and at times may create an oversupply of motion pictures in the market. The number of motion pictures released by our competitors, particularly the major studios, may create an oversupply of product in the market, reduce our share of box office receipts and make it more difficult for our films to succeed commercially. The limited supply of motion picture screens compounds this product oversupply problem. Oversupply may become most pronounced during peak release times, such as school holidays and national holidays, when theater attendance is expected to be highest. As a result of changes in the theatrical exhibition industry, including reorganizations and consolidations, and major studio releases occupying more screens, the number of screens available to us when we want to release a picture may decrease. If the number of motion picture screens decreases, box office receipts, and the correlating future revenue streams, such as from home entertainment and pay and free television, of our motion pictures may also decrease. Moreover, we cannot guarantee that we can release all of our films when they are otherwise scheduled due to production or other delays, or a change in the schedule of a major studio. Any such change could adversely impact a film's financial performance. In addition, if we cannot change our schedule after such a change by a major studio because we are too close to the release date, the major studio's release and its typically larger promotion budget may adversely impact the financial performance of our film.

28
We must successfully respond to rapid technological changes and alternative forms of delivery or storage to remain competitive.
The entertainment industry continues to undergo significant developments as advances in technologies and new methods of product delivery and storage, and certain changes in consumer behavior driven by these developments emerge. New technologies affect the demand for our content, the manner in which our content is distributed to consumers, the sources and nature of competing content offerings and the time and manner in which consumers acquire and view our content. We and our distributors must adapt our businesses to shifting patterns of content consumption and changing consumer behavior and preferences through the adoption and exploitation of new technologies. If we cannot successfully exploit these and other emerging technologies, it could have a material adverse effect on our business, financial condition, operating results, liquidity and prospects.
We face risks from doing business internationally.
We distribute motion picture and television productions outside the U.S. and derive revenues from international sources. As a result, our business is subject to certain risks inherent in international business, many of which are beyond our control. These risks may include:
• laws and policies affecting trade, investment and taxes, including laws and policies relating to the repatriation of funds and withholding taxes, and changes in these laws;
• anti-corruption laws and regulations such as the Foreign Corrupt Practices Act and the U.K. Bribery Act that impose stringent requirements on how we conduct our foreign operations and changes in these laws and regulations;
• changes in local regulatory requirements, including restrictions on content; differing cultural tastes and attitudes;• international jurisdictions where laws are less protective of intellectual property and varying attitudes towards the piracy of
intellectual property;• financial instability and increased market concentration of buyers in foreign television markets, including in European pay
television markets;• the instability of foreign economies and governments;• fluctuating foreign exchange rates;• the spread of communicable diseases in such jurisdictions, which may impact business in such jurisdictions; and• war and acts of terrorism.
Events or developments related to these and other risks associated with international trade could adversely affect our revenues from non-U.S. sources, which could have a material adverse effect on our business, financial condition, operating results, liquidity and prospects.
Protecting and defending against intellectual property claims may have a material adverse effect on our business.
Our ability to compete depends, in part, upon successful protection of our intellectual property. We attempt to protect proprietary and intellectual property rights to our productions through available copyright and trademark laws and licensing and distribution arrangements with reputable international companies in specific territories and media for limited durations. Despite these precautions, existing copyright and trademark laws afford only limited practical protection in certain countries where we distribute our products. As a result, it may be possible for unauthorized third parties to copy and distribute our productions or certain portions or applications of our intended productions, which could have a material adverse effect on our business, financial condition, operating results, liquidity and prospects.
Litigation may also be necessary to enforce our intellectual property rights, to protect our trade secrets, or to determine the validity and scope of the proprietary rights of others or to defend against claims of infringement or invalidity. Any such litigation, infringement or invalidity claims could result in substantial costs and the diversion of resources and could have a material adverse effect on our business, financial condition, operating results, liquidity and prospects. We cannot assure you that infringement or invalidity claims will not materially adversely affect our business, financial condition, operating results, liquidity and prospects.
Our more successful and popular film or television products or franchises may experience higher levels of infringing activity, particularly around key release dates. Alleged infringers have claimed and may claim that their products are permitted under fair use or similar doctrines, that they are entitled to compensatory or punitive damages because our efforts to protect our intellectual property rights are illegal or improper, and that our key trademarks or other significant intellectual property are invalid. Such claims, even if meritless, may result in adverse publicity or costly litigation. We vigorously defend our copyrights and trademarks from infringing products and activity, which can result in litigation. We may receive unfavorable preliminary or interim rulings in the course of litigation, and there can be no assurance that a favorable final outcome will be obtained in all cases. Regardless of the validity or the success of the assertion of any such claims, we could incur significant costs and diversion of resources in

29
enforcing our intellectual property rights or in defending against such claims, which could have a material adverse effect on our business, financial condition, operating results, liquidity and prospects.
Others may assert intellectual property infringement claims against us.
One of the risks of the film and television production business is the possibility that others may claim that our productions and production techniques misappropriate or infringe the intellectual property rights of third parties with respect to their previously developed films and televisions series, stories, characters, other entertainment or intellectual property. Irrespective of the validity or the successful assertion of such claims, we could incur significant costs and diversion of resources in defending against them, which could have a material adverse effect on our business, financial condition, operating results, liquidity and prospects.
Our business involves risks of liability claims for media content, which could adversely affect our business, results of operations and financial condition.
As a distributor of media content, we may face potential liability for:
• defamation;• invasion of privacy;• negligence;• copyright or trademark infringement (as discussed above); and• other claims based on the nature and content of the materials distributed.
These types of claims have been brought, sometimes successfully, against producers and distributors of media content. Any imposition of liability that is not covered by insurance or is in excess of insurance coverage could have a material adverse effect on our business, financial condition, operating results, liquidity and prospects.
Piracy of motion pictures may reduce the gross receipts from the exploitation of our films.
Motion picture piracy is extensive in many parts of the world, including South America, Asia, and certain Eastern European countries, and is made easier by technological advances and the conversion of motion pictures into digital formats. This trend facilitates the creation, transmission and sharing of high quality unauthorized copies of motion pictures in theatrical release on DVDs, Blu-ray discs, from pay-per-view through set-top boxes and other devices and through unlicensed broadcasts on free television and the internet. The proliferation of unauthorized copies of these products has had and will likely continue to have an adverse effect on our business, because these products reduce the revenue we receive from our products. Additionally, in order to contain this problem, we may have to implement elaborate and costly security and anti-piracy measures, which could result in significant expenses and losses of revenue. We cannot assure you that even the highest levels of security and anti-piracy measures will prevent piracy.
In particular, unauthorized copying and piracy are prevalent in countries outside of the U.S., Canada and Western Europe, whose legal systems may make it difficult for us to enforce our intellectual property rights. While the U.S. government has publicly considered implementing trade sanctions against specific countries that, in its opinion, do not make appropriate efforts to prevent copyright infringements of U.S. produced motion pictures, there can be no assurance that any such sanctions will be enacted or, if enacted, will be effective. In addition, if enacted, such sanctions could impact the amount of revenue that we realize from the international exploitation of motion pictures. If no embargoes or sanctions are enacted, or if other measures are not taken, we may lose revenue as a result of motion picture piracy.
We face cybersecurity and similar risks, which could result in the disclosure of confidential information, disruption of our businesses, damage to our brands and reputation, legal exposure and financial losses.
Our online, mobile and app offerings, as well as our internal systems, involve the storage and transmission of our proprietary and personal information, and we and our partners rely on various technology systems in connection with the production and distribution of programming. Although we monitor our security measures regularly, they may be breached due to employee error, computer malware, viruses, hacking and phishing attacks, or otherwise. Additionally, outside parties may attempt to fraudulently induce employees or users to disclose sensitive or confidential information in order to gain access to our data. Because the techniques used to obtain unauthorized access, disable or degrade service, or sabotage systems change frequently and often are not recognized until launched against a target, we may be unable to anticipate these techniques or to implement adequate preventative measures. Any such breach or unauthorized access could result in a loss of our proprietary information, a disruption of our distribution business or a reduction of the revenues we are able to generate from such distribution, damage to our brands and reputation, and

30
significant legal and financial exposure, including from regulatory or consumer actions related to consumer data collection and other data privacy concerns, each of which could potentially have an adverse effect on our business.
Our success depends on attracting and retaining key personnel.
Our success depends upon the continued efforts, abilities and expertise of our corporate and divisional executive teams and other key employees, including production and creative personnel. Our success also continues to depend on our ability to identify, attract, hire, train and retain such qualified professional, creative, technical and managerial personnel.
We have entered into employment agreements with our top executive officers and production executives but do not currently have significant “key person” life insurance policies for any of our employees. However, although it is standard in the motion picture industry to rely on employment agreements as a method of retaining the services of key employees, these agreements cannot assure us of the continued services of such employees. In addition, competition for the limited number of business, production and creative personnel necessary to create and distribute our entertainment content is intense and may grow in the future. We cannot assure you that we will be successful in identifying, attracting, hiring, training and retaining such personnel in the future. Our inability to retain or successfully replace, where necessary, members of our executive teams and other key employees could have a material adverse effect on our business, financial condition, operating results, liquidity and prospects.
While we believe we currently have adequate internal control over financial reporting, we are required to assess our internal control over financial reporting on an annual basis and any future adverse results from such assessment could result in a loss of investor confidence in our financial reports and have an adverse effect on our securities.
Section 404 of the Sarbanes-Oxley Act of 2002 and the accompanying rules and regulations promulgated by the SEC to implement it, require us to include in our Annual Report on Form 10-K an annual report by our management regarding the effectiveness of our internal control over financial reporting. The report includes, among other things, an assessment of the effectiveness of our internal control over financial reporting as of the end of our fiscal year. This assessment must include disclosure of any material weaknesses in our internal control over financial reporting identified by management. During this process, if our management identifies one or more material weaknesses in our internal control over financial reporting that cannot be remediated in a timely manner, we will be unable to assert such internal control is effective. While we currently believe our internal control over financial reporting is effective, the effectiveness of our internal controls in future periods is subject to the risk that our controls may become inadequate because of changes in conditions, and, as a result, the degree of compliance of our internal control over financial reporting with the applicable policies or procedures may deteriorate. If we are unable to conclude that our internal control over financial reporting is effective (or if our independent auditors disagree with our conclusion), we could lose investor confidence in the accuracy and completeness of our financial reports, which would have an adverse effect on our securities.
Changes in, or interpretations of, tax rules and regulations, and changes in geographic operating results, may adversely affect our effective tax rates.
We are subject to income taxes in the U.S. and foreign tax jurisdictions. We also conduct business and financing activities between our entities in various jurisdictions and we are subject to complex transfer pricing regulations in the countries in which we operate. Although uniform transfer pricing standards are emerging in many of the countries in which we operate, there is still a relatively high degree of uncertainty and inherent subjectivity in complying with these rules. Our future effective tax rates could be affected by changes in tax laws or the interpretation of tax laws, by changes in the amount of revenue or earnings that we derive from international sources in countries with high or low statutory tax rates, or by changes in the valuation of our deferred tax assets and liabilities. Unanticipated changes in our tax rates could affect our future results of operations.
In addition, we may be subject to examination of our income tax returns by federal, state, and foreign tax jurisdictions. We regularly assess the likelihood of outcomes resulting from possible examinations to determine the adequacy of our provision for income taxes. In making such assessments, we exercise judgment in estimating our provision for income taxes. While we believe our estimates are reasonable, we cannot assure you that final determinations from any examinations will not be materially different from those reflected in our historical income tax provisions and accruals. Any adverse outcome from any examinations may have an adverse effect on our business and operating results, which could cause the market price of our securities to decline.
As of March 31, 2013, we concluded that it was more likely than not that our deferred tax assets were realizable and that a significant portion of the related valuation allowance previously established was no longer needed. This conclusion was based upon our expectation of sufficient future taxable income to fully utilize these assets. Based on our current assessment, we continue to believe that substantially all of our deferred tax assets will be realized. There is no assurance that we will attain our future expected levels of taxable income or that a valuation allowance against new or existing deferred tax assets will not be necessary in the future.

31
Certain shareholders own a majority of our outstanding common shares.
As of May 23, 2016, five of our shareholders beneficially owned an aggregate of 62,745,944 of our common shares, or approximately 42.6% of the outstanding shares. In addition, one of these shareholders, Mark H. Rachesky, M.D., the beneficial owner of approximately 20.5% of our outstanding common shares, currently serves as the Chairman of our Board of Directors. Accordingly, these five shareholders, collectively, have the power to exercise substantial influence over us and on matters requiring approval by our shareholders, including the election of directors, the approval of mergers and other significant corporate transactions. This concentration of ownership may make it more difficult for other shareholders to effect substantial changes in our company and may also have the effect of delaying, preventing or expediting, as the case may be, a change in control of our company.
Sales of a substantial number of shares of our common shares, or the perception that such sales might occur, could have an adverse effect on the price of our common shares, and therefore our ability to raise additional capital to fund our operations.
As of May 23, 2016, approximately 42.6% of our common shares were held beneficially by certain individuals and institutional investors who each had ownership of equal to or greater than 5% of our common shares. We also filed resale registration statements to enable certain shareholders who received our common shares in connection with acquisitions and certain holders of debt convertible into our common shares, to resell our common shares. Sales by such individuals and institutional investors of a substantial number of shares of our common shares into the public market, or the perception that such sales might occur, could have an adverse effect on the price of our common shares, which could materially impair our ability to raise capital through the sale of common shares or debt that is convertible into our common shares.
Our online activities are subject to a variety of laws and regulations relating to privacy and child protection, which, if violated, could subject us to an increased risk of litigation and regulatory actions.
In addition to our company websites and applications, we use third-party applications, websites, and social media platforms to promote our projects and engage consumers, as well as monitor and collect certain information about users of our online forums. A variety of laws and regulations have been adopted in recent years aimed at protecting children using the internet such as the Children's Online Privacy and Protection Act of 1998 (“COPPA”). COPPA sets forth, among other things, a number of restrictions on what website operators can present to children under the age of 13 and what information can be collected from them. There are also a variety of laws and regulations governing individual privacy and the protection and use of information collected from such individuals, particularly in relation to an individual's personally identifiable information (e.g., credit card numbers). Many foreign countries have adopted similar laws governing individual privacy, including safeguards which relate to the interaction with children. If our online activities were to violate any applicable current or future laws and regulations, we could be subject to litigation and regulatory actions, including fines and other penalties.
Any decisions to reduce or discontinue paying cash dividends to our shareholders or repurchase our common shares pursuant to our previously announced share repurchase program could cause the market price for our common shares to decline.
Our payment of quarterly cash dividends and repurchases of our common shares pursuant to our share purchase program will be subject to, among other things, our financial position and results of operations, available cash and cash flow, capital requirements, and other factors. Any reduction or discontinuance by us of the payment of quarterly cash dividends or repurchases of our common shares pursuant to our share repurchase program could cause the market price of our common shares to decline. Moreover, in the event our payment of quarterly cash dividends or repurchases of our common shares are reduced or discontinued, our failure or inability to resume paying cash dividends or repurchasing our common shares at historical levels could result in a lower market valuation of our common shares.
The directional guidance we provide from time to time is subject to a number of factors that we may not be successful in achieving.
From time to time, we provide directional guidance for certain financial periods. Our directional guidance depends on a number of factors that we may not be successful in achieving, including, but not limited to, the timing and commercial success of the motion pictures and television programming that we distribute, which cannot be predicted with certainty. In particular, underperformance at the box office of one or more motion pictures in any period may cause our revenue and earnings results for that period (and potentially, subsequent periods) to be less than anticipated, in some instances to a significant extent. Accordingly, our results of operations may fluctuate significantly from period to period, and the results of any one period may not be indicative of the results for any future periods. The directional guidance is prepared by management on the basis of available information at such time. Management believes such estimates are prepared on a reasonable basis. However, such estimates should not be relied on as necessarily indicative of our actual financial results. Our inability to achieve directional guidance could have a material adverse effect on our business, financial condition, operating results, liquidity and prospects.

32
ITEM 1B. UNRESOLVED STAFF COMMENTS.
Not applicable.
ITEM 2. PROPERTIES.
Our corporate office is located at 250 Howe Street, 20th Floor, Vancouver, BC V6C 3R8. Our principal executive offices are located at 2700 Colorado Avenue, Santa Monica, California, 90404. At the Santa Monica address, we occupy approximately 189,186 square feet. Our lease expires in August 2023. We also lease a 9,123 square foot space in Santa Monica (per a lease that expires in March 2017) and a 7,803 square foot space in New York (per a lease that expires in August 2022). Our international office is located at 45 Mortimer St, London W1W 8HJ, United Kingdom, where we occupy 11,243 square feet (per a lease that expires in July 2029).
We believe that our current facilities are adequate to conduct our business operations for the foreseeable future. We believe that we will be able to renew these leases on similar terms upon expiration. If we cannot renew, we believe that we could find other suitable premises without any material adverse impact on our operations.
ITEM 3. LEGAL PROCEEDINGS.
From time to time, the Company is involved in certain claims and legal proceedings arising in the normal course of business. While the resolution of these matters cannot be predicted with certainty, we do not believe, based on current knowledge, that the outcome of any currently pending legal proceedings in which the Company is currently involved will have a material adverse effect on the Company's consolidated financial position, results of operations or cash flow.
For a discussion of certain claims and legal proceedings, see Note 17 - Commitments and Contingencies to our consolidated financial statements, which discussion is incorporated by reference into this Part I, Item 3, Legal Proceedings.
ITEM 4. MINE SAFETY DISCLOSURES.
Not Applicable.

33
PART II
ITEM 5. MARKET FOR REGISTRANT’S COMMON EQUITY, RELATED STOCKHOLDER MATTERS AND ISSUER PURCHASES OF EQUITY SECURITIES.
Market Information
Our common shares are listed on the NYSE under the symbol “LGF.”
As of May 23, 2016, the closing price of our common shares on the NYSE was $19.59.
The following table presents the high and low sale prices of our common shares on the NYSE for each period, based on inter-dealer prices that do not include retail mark-ups, mark-downs or commissions, and cash dividends declared for each period:
Common shares (per share)Market prices
DividendsDeclared2017 fiscal year High Low
First quarter (through May 23, 2016) $ 22.62 $ 19.37 $ —
2016 fiscal year High LowDividendsDeclared
Fourth quarter $ 32.00 $ 16.21 $ 0.09Third quarter 41.41 31.90 0.09Second quarter 40.74 27.51 0.09First quarter 38.25 30.27 0.07
2015 fiscal year High LowDividendsDeclared
Fourth quarter $ 34.87 $ 27.55 $ 0.07Third quarter 35.75 29.00 0.07Second quarter 34.15 27.46 0.07First quarter 29.82 24.80 0.05
Holders
As of May 23, 2016, there were approximately 582 shareholders of record.
Dividends
The Company declared a quarterly dividend of $0.07, $0.09, $0.09 and $0.09 per share of common shares for the four quarters of the year ended March 31, 2016, respectively. The most recent dividend is payable May 27, 2016 to shareholders of record as of March 31, 2016. We expect to pay quarterly dividends each quarter; however, the amount of dividends, if any, that we pay to our shareholders is determined by our Board of Directors, at its discretion, and is dependent on a number of factors, including our financial position, results of operations, cash flows, capital requirements and restrictions under our credit agreements, and shall be in compliance with applicable law. We cannot guarantee the amount of dividends paid in the future, if any.
Lionsgate is also limited in its ability to pay dividends on its common shares by restrictions under the Business Corporations Act (British Columbia) relating to the solvency of Lionsgate before and after the payment of a dividend and by the terms of its credit facility and indentures governing certain of its notes.
Securities Authorized for Issuance Under Equity Compensation Plans
The information required by this item is incorporated by reference to our Proxy Statement for our 2016 Annual General Meeting of Stockholders to be filed with the SEC within 120 days after the end of the fiscal year ended March 31, 2016.

34
Taxation
The following is a general summary of certain Canadian federal income tax consequences to U.S. Holders (who, at all relevant times, deal at arm's length with the Company) of the purchase, ownership and disposition of common shares. For the purposes of this Canadian income tax discussion, a “U.S. Holder” means a holder of common shares who (1) for the purposes of the Income Tax Act (Canada) (the "ITA") is not, has not, and will not be, or deemed to be, resident in Canada at any time while he, she or it holds common shares, (2) at all relevant times is a resident of the United States under the Canada-United States Tax Convention (1980) (the “Convention”) and is eligible for benefits under the Convention, (3) is not a “foreign affiliate” as defined in the ITA of a person resident in Canada, and (4) does not and will not use or be deemed to use the common shares in carrying on a business in Canada. This summary does not apply to a U.S. Holder that is an insurer or an “authorized foreign bank” within the meaning of the ITA. Such U.S. Holders should seek tax advice from their advisors.
This summary is not intended to be, and should not be construed to be, legal or tax advice and no representation with respect to the tax consequences to any particular investor is made. The summary does not address any aspect of any provincial, state or local tax laws or the tax laws of any jurisdiction other than Canada or the tax considerations applicable to non-U.S. Holders. Accordingly, prospective investors should consult with their own tax advisors for advice with respect to the income tax consequences to them having regard to their own particular circumstances, including any consequences of an investment in common shares arising under any provincial, state or local tax laws or the tax laws of any jurisdiction other than Canada.
This summary is based upon the current provisions of the ITA, the regulations thereunder and the proposed amendments thereto publicly announced by the Department of Finance, Canada before the date hereof and our understanding of the current administrative policies and assessing practices of the Canada Revenue Agency published in writing prior to the date hereof. No assurance may be given that any proposed amendment will be enacted in the form proposed, if at all. This summary does not otherwise take into account or anticipate any changes in law, whether by legislative, governmental or judicial action.
The following summary applies only to U.S. Holders who hold their common shares as capital property. In general, common shares will be considered capital property of a holder where the holder is neither a trader nor dealer in securities, does not hold the common shares in the course of carrying on a business and is not engaged in an adventure in the nature of trade in respect thereof. This summary does not apply to a U.S. Holder that is a “financial institution” within the meaning of the mark-to-market rules contained in the ITA or to holders who have entered into a “derivative forward agreement” or a “synthetic disposition arrangement” as these terms are defined in the ITA.
Amounts in respect of common shares paid or credited or deemed to be paid or credited as, on account or in lieu of payment of, or in satisfaction of, dividends to a shareholder who is not a resident of Canada within the meaning of the ITA will generally be subject to Canadian non-resident withholding tax. Canadian withholding tax applies to dividends that are formally declared and paid by the Company and also to deemed dividends that may be triggered by a cancellation of common shares if the cancellation occurs otherwise than as a result of a simple open market transaction. For either deemed or actual dividends, withholding tax is levied at a basic rate of 25%, which may be reduced pursuant to the terms of an applicable tax treaty between Canada and the country of residence of the non-resident shareholder. Under the Convention, the rate of Canadian non-resident withholding tax on the gross amount of dividends received by a U.S. Holder, which is the beneficial owner of such dividends, is generally 15%. However, where such beneficial owner is a company that owns at least 10% of the voting shares of the company paying the dividends, the rate of such withholding is 5%. For these purposes, a company that is a resident of the United States for the purposes of the Convention and which holds an interest in an entity (other than an entity that is resident in Canada) that is fiscally transparent under the laws of the United States will be considered to own the voting shares of the Company owned by that fiscally transparent entity in proportion to the company’s ownership interest in the fiscally transparent entity.
In addition to the Canadian withholding tax on actual or deemed dividends, a U.S. Holder also needs to consider the potential application of Canadian income tax on capital gains. A U.S. Holder will generally not be subject to tax under the ITA in respect of any capital gain arising on a disposition of common shares (including, generally, on a purchase by the Company on the open market) unless at the time of disposition such shares constitute taxable Canadian property of the holder for purposes of the ITA and such U.S. Holder is not entitled to relief under the Convention. If the common shares are listed on a designated stock exchange (which includes the NYSE) at the time they are disposed of, they will generally not constitute taxable Canadian property of a U.S. Holder unless, at any time during the 60-month period immediately preceding the disposition of the common shares, the U.S. Holder, persons with whom he, she or it does not deal at arm's length, or the U.S. Holder together with such non-arm's length persons, owned 25% or more of the issued shares of any class or series of the capital stock of the Company and at any time during the immediately preceding 60-month period, the shares derived their value principally from one or any combination of (i) real or immovable property situated in Canada, (ii) Canadian resource properties, (iii) timber resource properties, and (iv) options in respect of, or interests in, such properties. Assuming that the common shares have never derived

35
their value principally from any of the items listed in (i)-(iv) above, capital gains derived by a U.S. Holder from the disposition of common shares will generally not be subject to tax in Canada.
Issuer Purchases of Equity Securities
On May 31, 2007, our Board of Directors authorized the repurchase of up to $50 million of our common shares. On each of May 29, 2008 and November 6, 2008, our Board of Directors authorized additional repurchases up to an additional $50 million of our common shares. On December 17, 2013, our Board of Directors authorized the Company to increase its stock repurchase plan to $300 million and on February 2, 2016, our Board of Directors authorized the Company to further increase its stock repurchase plan to $468 million. To date, approximately $283.2 million (or 15,729,923) of our common shares have been purchased, leaving approximately $184.7 million of authorized potential purchases. The remaining $184.7 million of our common shares may be purchased from time to time at the Company’s discretion, including quantity, timing and price thereof, and will be subject to market conditions. Such purchases will be structured as permitted by securities laws and other legal requirements. The share repurchase program has no expiration date.
The following table sets forth information with respect to our common shares purchased by us during the three months ended March 31, 2016:
ISSUER PURCHASES OF EQUITY SECURITIES
Period
(a) TotalNumber of
SharesPurchased
(b) AveragePrice Paidper Share
(c) Total Numberof Shares
Purchased as Partof Publicly
Announced Plansor Programs
(d) ApproximateDollar Value of
Shares that May YetBe Purchased Under
the Plans orPrograms
January 1, 2016 - January 31, 2016 267,806 $ 29.48 267,806 $ 82,037,803February 1, 2016 - February 29, 2016 2,841,975 19.19 2,841,975 195,466,789March 1, 2016 - March 31, 2016 490,614 21.92 490,614 184,713,820Total 3,600,395 $ 20.33 3,600,395 $ 184,713,820
Additionally, during the three months ended March 31, 2016, 84,989 common shares were withheld upon the vesting of restricted share units and restricted share issuances to satisfy minimum statutory federal, state and local tax withholding obligations.
Stock Performance Graph
The following graph compares our cumulative total shareholder return with those of the NYSE Composite Index and the S&P Movies & Entertainment Index for the period commencing March 31, 2011 and ending March 31, 2016. All values assume that $100 was invested on March 31, 2011 in our common shares and each applicable index and all dividends were reinvested.
The comparisons shown in the graph below are based on historical data and we caution that the stock price performance shown in the graph below is not indicative of, and is not intended to forecast, the potential future performance of our common shares.

36
3/11 3/12 3/13 3/14 3/15 3/16
Lions Gate EntertainmentCorporation 100.00 222.72 380.32 429.20 549.16 357.74NYSE Composite 100.00 100.11 114.12 135.21 143.35 137.74S&P Movies & Entertainment 100.00 106.76 151.82 198.08 241.22 214.82
_______
The graph and related information are being furnished solely to accompany this Form 10-K pursuant to Item 201(e) of Regulation S-K. They shall not be deemed “soliciting materials” or to be “filed” with the SEC (other than as provided in Item 201), nor shall such information be incorporated by reference into any future filing under the Securities Act or the Exchange Act, except to the extent that we specifically incorporate it by reference into such filing.
ITEM 6. SELECTED FINANCIAL DATA.
The consolidated financial statements for all periods presented in this Form 10-K are prepared in conformity with U.S. GAAP.
The Selected Consolidated Financial Data below includes the results of Pilgrim Studios from its acquisition date of November 12, 2015 onwards, and Summit Entertainment from its acquisition date of January 13, 2012 onwards. The Selected Consolidated Financial Data below also includes the results of Maple Pictures from the date of consolidation through the date

37
of sale of August 10, 2011. Due to the acquisitions of Pilgrim Studios, Summit Entertainment and the consolidation and subsequent sale of our interest in Maple Pictures, the Company’s results of operations for the years ended March 31, 2016, 2015, 2014, 2013, and 2012 and financial positions as at March 31, 2016, 2015, 2014, 2013, and 2012 are not directly comparable to prior reporting periods.
Year Ended March 31, 2016 2015 2014 2013 2012 (Amounts in thousands, except per share amounts)
Statement of Operations Data: Revenues $ 2,347,419 $ 2,399,640 $ 2,630,254 $ 2,708,141 $ 1,587,579Expenses:
Direct operating 1,415,344 1,315,775 1,369,381 1,390,569 908,402Distribution and marketing 661,789 591,491 739,461 817,862 483,513General and administration 282,232 263,507 254,925 218,341 168,864Gain on sale of asset disposal group — — — — (10,967)Depreciation and amortization 13,084 6,586 6,539 8,290 4,276
Total expenses 2,372,449 2,177,359 2,370,306 2,435,062 1,554,088Operating income (loss) (25,030) 222,281 259,948 273,079 33,491Other expenses (income):
Interest expense Cash interest 45,695 39,657 48,960 75,322 62,430Amortization of debt discount and deferredfinancing costs 9,184 12,819 17,210 18,258 15,681
Total interest expense 54,879 52,476 66,170 93,580 78,111Interest and other income (1,851) (2,790) (6,030) (4,036) (2,752)Loss on extinguishment of debt — 11,664 39,572 24,089 967
Total other expenses, net 53,028 61,350 99,712 113,633 76,326Income (loss) before equity interests and income taxes (78,058) 160,931 160,236 159,446 (42,835)Equity interests income (loss) 44,231 52,477 24,724 (3,075) 8,412Income (loss) before income taxes (33,827) 213,408 184,960 156,371 (34,423)Income tax provision (benefit) (76,527) 31,627 32,923 (75,756) 4,695Net income (loss) 42,700 181,781 152,037 232,127 (39,118)
Less: Net loss attributable to noncontrolling interest 7,509 — — — —Net income (loss) attributable to Lions GateEntertainment Corp. shareholders $ 50,209 $ 181,781 $ 152,037 $ 232,127 $ (39,118)
Per share information attributable to Lions GateEntertainment Corp. shareholders:Basic net income (loss) per common share $ 0.34 $ 1.31 $ 1.11 $ 1.73 $ (0.30)Diluted net income (loss) per common share $ 0.33 $ 1.23 $ 1.04 $ 1.61 $ (0.30)
Weighted average number of common sharesoutstanding:
Basic 148,480 139,048 137,468 134,514 132,226Diluted 154,088 151,778 154,415 149,370 132,226
Dividends declared per common share $ 0.34 $ 0.26 $ 0.10 $ — $ —
Balance Sheet Data (at end of period): Cash and cash equivalents $ 57,742 $ 102,697 $ 25,692 $ 62,363 $ 64,298Investment in films and television programs 1,478,296 1,381,829 1,274,573 1,244,075 1,329,053

38
Total assets 3,855,508 3,292,089 2,851,632 2,760,869 2,787,995Corporate debt:
Senior revolving credit facility 161,000 — 97,619 338,474 99,750Other senior debt 625,000 600,000 447,753 432,277 909,024Convertible senior subordinated notes and otherfinancing obligations 100,050 114,126 131,788 87,167 108,276
Total liabilities 2,914,710 2,449,802 2,267,094 2,404,343 2,698,210Redeemable noncontrolling interests 90,525 — — — —Total shareholders’ equity 850,273 842,287 584,538 356,526 89,785

39
ITEM 7. MANAGEMENT’S DISCUSSION AND ANALYSIS OF FINANCIAL CONDITION AND RESULTS OF OPERATIONS.
Overview
Lions Gate Entertainment Corp. (“Lionsgate,” the “Company,” “we,” “us” or “our”) is a premier next generation global content leader with a diversified presence in motion picture production and distribution, television programming and syndication, home entertainment, international distribution and sales, branded channel platforms, interactive ventures and games, and location-based entertainment.
Although our business is both global and diverse, we classify our operations through two reporting segments: Motion Pictures and Television Production.
Revenues
Our revenues are derived from the Motion Pictures and Television Production segments, as described below. Our revenues are derived from the U.S., Canada, the United Kingdom and other foreign countries. None of the non-U.S. countries individually comprised greater than 10% of total revenues for the years ended March 31, 2016, 2015 and 2014.
Motion Pictures
Our Motion Pictures segment includes revenues derived from the following:
• Theatrical. Theatrical revenues are derived from the domestic theatrical release of motion pictures licensed to theatrical exhibitors on a picture-by-picture basis (distributed by us directly in the U.S. and through a sub-distributor in Canada). The revenues from Canada are reported net of distribution fees and release expenses of the Canadian sub-distributor. The financial terms that we negotiate with our theatrical exhibitors in the U.S. generally provide that we receive a percentage of the box office results and are negotiated on a picture-by-picture basis.
• Home Entertainment. Home Entertainment revenues are derived from the sale or rental of our film productions and acquired or licensed films and certain television programs (including theatrical and direct-to-video releases) on packaged media and through digital media platforms. In addition, we have revenue sharing arrangements with certain digital media platforms which generally provide that, in exchange for a nominal or no upfront sales price, we share in the rental or sales revenues generated by the platform on a title-by-title basis. We distribute a library of approximately 16,000 motion picture titles and television episodes and programs. We categorize our Home Entertainment revenue as follows:
• Packaged media revenue: Packaged media revenue consists of the sale or rental of DVDs and Blu-ray discs.
• Digital media revenue: Digital media revenue consists of revenues generated from pay-per-view and video-on-demand platforms, electronic sell-through (“EST”), and digital rental.
• Television. Television revenues are primarily derived from the licensing of our theatrical productions and acquired films to the linear pay, basic cable and free television markets.
• International. International revenues are derived from the licensing of our productions, acquired films, our catalog product and libraries of acquired titles from our international subsidiaries, and revenues from our distribution to international distributors, on a territory-by-territory basis. International revenues also includes revenues from the direct distribution of our productions, acquired films, and our catalog product and libraries of acquired titles in the United Kingdom.
• Motion Pictures - Other. Other revenues are derived from, among others, our interactive ventures and games division, our global franchise management and strategic partnerships division (which includes location-based entertainment), the sales and licensing of music from the theatrical exhibition of our films and the television broadcasts of our productions, and from the licensing of our films and television programs to ancillary markets.
40
Television Production
Our Television Production segment includes revenues derived from the following:
• Domestic Television. Domestic television revenues are derived from the licensing and syndication to domestic markets of one-hour and half-hour scripted and unscripted series, television movies, mini-series and non-fiction programming.
• International. International revenues are derived from the licensing and syndication to international markets of one-hour and half-hour scripted and unscripted series, television movies, mini-series and non-fiction programming.
• Home Entertainment. Home entertainment revenues are derived from the sale or rental of television production movies or series on packaged media and through digital media platforms. We distribute a library of approximately 16,000 motion picture titles and television episodes and programs. Home entertainment revenue consists of packaged media revenue and digital media revenue.
• Television Production - Other. Other revenues are derived from, among others, product integration in our television episodes and programs, the sales and licensing of music from the television broadcasts of our productions, and from the licensing of our television programs to ancillary markets.
Expenses
Our primary operating expenses include direct operating expenses, distribution and marketing expenses and general and administration expenses.
Direct operating expenses include amortization of film and television production or acquisition costs, participation and residual expenses, provision for doubtful accounts, and foreign exchange gains and losses. Participation costs represent contingent consideration payable based on the performance of the film to parties associated with the film, including producers, writers, directors or actors. Residuals represent amounts payable to various unions or “guilds” such as the Screen Actors Guild, Directors Guild of America, and Writers Guild of America, based on the performance of the film in certain ancillary markets or based on the individual’s (i.e., actor, director, writer) salary level in the television market.
Distribution and marketing expenses primarily include the costs of theatrical “prints and advertising” (“P&A”) and of DVD/Blu-ray duplication and marketing. Theatrical P&A includes the costs of the theatrical prints delivered to theatrical exhibitors and the advertising and marketing cost associated with the theatrical release of the picture. DVD/Blu-ray duplication represents the cost of the DVD/Blu-ray product and the manufacturing costs associated with creating the physical products. DVD/Blu-ray marketing costs represent the cost of advertising the product at or near the time of its release or special promotional advertising.
General and administration expenses include salaries and other overhead.
CRITICAL ACCOUNTING POLICIES
The preparation of our financial statements in conformity with accounting principles generally accepted in the United States requires management to make estimates, judgments and assumptions that affect the amounts reported in the consolidated financial statements and accompanying notes. The application of the following accounting policies, which are important to our financial position and results of operations, requires significant judgments and estimates on the part of management. As described more fully below, these estimates bear the risk of change due to the inherent uncertainty of the estimate. In some cases, changes in the accounting estimates are reasonably likely to occur from period to period. Accordingly, actual results could differ materially from our estimates. To the extent that there are material differences between these estimates and actual results, our financial condition or results of operations will be affected. We base our estimates on past experience and other assumptions that we believe are reasonable under the circumstances, and we evaluate these estimates on an ongoing basis. For a summary of all of our accounting policies, including the accounting policies discussed below, see Note 2 to our consolidated financial statements.
Accounting for Films and Television Programs. We capitalize costs of production and acquisition, including financing costs and production overhead, to investment in films and television programs. These costs for an individual film or television program are amortized and participation and residual costs are accrued to direct operating expenses in the proportion that current year’s revenues bear to management’s estimates of the ultimate revenue at the beginning of the current year expected to be recognized from the exploitation, exhibition or sale of such film or television program. Ultimate revenue includes estimates over a period not to exceed ten years following the date of initial release of the motion picture. For an episodic television series, the period over which ultimate revenues are estimated cannot exceed ten years following the date of delivery of the first episode, or, if still in production, five years from the date of delivery of the most recent episode, if later. For previously released

41
film or television programs acquired as part of a library, ultimate revenue includes estimates over a period not to exceed twenty years from the date of acquisition.
Due to the inherent uncertainties involved in making such estimates of ultimate revenues and expenses, these estimates have differed in the past from actual results and are likely to differ to some extent in the future from actual results. In addition, in the normal course of our business, some films and titles are more successful than anticipated and some are less successful than anticipated. Management regularly reviews and revises when necessary its ultimate revenue and cost estimates, which may result in a change in the rate of amortization of film costs and participations and residuals and/or write-down of all or a portion of the unamortized costs of the film or television program to its estimated fair value. Management estimates the ultimate revenue based on experience with similar titles or title genre, the general public appeal of the cast, actual performance (when available) at the box office or in markets currently being exploited, and other factors such as the quality and acceptance of motion pictures or programs that our competitors release into the marketplace at or near the same time, critical reviews, general economic conditions and other tangible and intangible factors, many of which we do not control and which may change.
An increase in the estimate of ultimate revenue will generally result in a lower amortization rate and, therefore, less film and television program amortization expense, while a decrease in the estimate of ultimate revenue will generally result in a higher amortization rate and, therefore, higher film and television program amortization expense, and also periodically results in an impairment requiring a write-down of the film cost to the title’s fair value. These write-downs are included in amortization expense within direct operating expenses in our consolidated statements of operations. Investment in films and television programs is stated at the lower of amortized cost or estimated fair value. The valuation of investment in films and television programs is reviewed on a title-by-title basis, when an event or change in circumstances indicates that the fair value of a film or television program is less than its unamortized cost. In determining the fair value of our films and television programs, we employ a discounted cash flows ("DCF") methodology with assumptions for cash flows. Key inputs employed in the DCF methodology include estimates of a film's ultimate revenue and costs as well as a discount rate. The discount rate utilized in the DCF analysis is based on our weighted average cost of capital plus a risk premium representing the risk associated with producing a particular film or television program. The fair value of any film costs associated with a film or television program that we plan to abandon is zero. As the primary determination of fair value is determined using a DCF model, the resulting fair value is considered a Level 3 measurement (as defined in Note 10 to our consolidated financial statements). Additional amortization is recorded in the amount by which the unamortized costs exceed the estimated fair value of the film or television program. Estimates of future revenue involve measurement uncertainty and it is therefore possible that reductions in the carrying value of investment in films and television programs may be required as a consequence of changes in our future revenue estimates.
Revenue Recognition. Revenue from the theatrical release of feature films is recognized at the time of exhibition based on our participation in box office receipts. Revenue from the sale of DVDs and Blu-ray discs in the retail market, net of an allowance for estimated returns and other allowances, is recognized on the later of receipt by the customer or “street date” (when it is available for sale by the customer). Under revenue sharing arrangements, including digital and EST arrangements, such as download-to-own, download-to-rent, video-on-demand, and subscription video-on-demand, revenue is recognized when we are entitled to receipts and such receipts are determinable. Revenues from television or digital licensing for fixed fees are recognized when the feature film or television program is available to the licensee for telecast. For television licenses that include separate availability “windows” during the license period, revenue is allocated over the “windows.” Revenue from sales to international territories are recognized when access to the feature film or television program has been granted or delivery has occurred, as required under the contract, and the right to exploit the feature film or television program has commenced. For multiple media rights contracts with a fee for a single film or television program where the contract provides for media holdbacks (defined as contractual media release restrictions), the fee is allocated to the various media based on our assessment of the relative fair value of the rights to exploit each media and is recognized as each holdback is released. For multiple-title contracts with a fee, the fee is allocated on a title-by-title basis, based on our assessment of the relative fair value of each title. The primary estimate involving revenue recognition is the estimate of sales returns associated with our revenue from the sale of DVD’s/Blu-ray discs in the retail market, which is discussed separately below under the caption “Sales Returns Allowance.”
Sales Returns Allowance. Revenues are recorded net of estimated returns and other allowances. We estimate reserves for DVD/Blu-ray returns based on previous returns experience, point-of-sale data available from certain retailers, current economic trends, and projected future sales of the title to the consumer based on the actual performance of similar titles on a title-by-title basis in each of the DVD/Blu-ray businesses. Factors affecting actual returns include, among other factors, limited retail shelf space at various times of the year, success of advertising or other sales promotions, and the near term release of competing titles. We believe that our estimates have been materially accurate in the past; however, due to the judgment involved in establishing reserves, we may have adjustments to our historical estimates in the future. Our estimate of future returns affects reported revenue and operating income. If we underestimate the impact of future returns in a particular period, then we may record less revenue in later periods when returns exceed the estimated amounts. If we overestimate the impact of future returns

42
in a particular period, then we may record additional revenue in later periods when returns are less than estimated. An incremental change of 1% in our estimated sales returns rate (i.e., provisions for returns divided by gross sales of related product) for home entertainment products would have had an impact of approximately $5.4 million, $6.6 million and $8.6 million on our total revenue in the fiscal years ended March 31, 2016, 2015, and 2014, respectively.
Provisions for Accounts Receivable. We estimate provisions for accounts receivable based on historical experience and relevant facts and information regarding the collectability of the accounts receivable. In performing this evaluation, significant judgments and estimates are involved, including an analysis of specific risks on a customer-by-customer basis for our larger customers and an analysis of the length of time receivables have been past due. The financial condition of a given customer and its ability to pay may change over time or could be better or worse than anticipated and could result in an increase or decrease to our allowance for doubtful accounts, which is recorded in other direct operating expenses.
Income Taxes. We are subject to federal and state income taxes in the U.S. and in several foreign jurisdictions. We record deferred tax assets related to net operating loss carryforwards and certain temporary differences, net of applicable reserves. We recognize a future tax benefit to the extent that realization of such benefit is more likely than not, otherwise a valuation allowance is applied. In order to realize the benefit of our deferred tax assets, we will need to generate sufficient taxable income in the future. In previous years, we had historically provided a full valuation allowance against our net deferred tax assets because of our historical operating losses. Due to the profitability achieved in our fiscal year ended March 31, 2013, which resulted in a cumulative positive three year pre-tax income, and our current projections of profitability in the next few years, we determined that it was more likely than not that we will realize the benefit of certain of our deferred tax assets, including our net operating loss carryforwards, and, accordingly, the valuation allowance related to those assets was reversed as of March 31, 2013. In addition, due to certain financing transactions in the year ended March 31, 2014, we determined that it was more likely than not that we will realize the benefit of certain of our deferred tax assets in our Canadian tax jurisdiction, and accordingly, the valuation allowance related to those assets was reversed during the year ended March 31, 2014. However, the assessment as to whether there will be sufficient taxable income to realize our net deferred tax assets is an estimate which could change in the future depending primarily upon the actual performance of our Company. We will be required to continually evaluate the more likely than not assessment that our net deferred tax assets will be realized, and if operating results deteriorate, we may need to reestablish all or a portion of the valuation allowance through a charge to our income tax provision. Our net unreserved deferred tax assets at March 31, 2016 amounted to $134.4 million.
Our income tax provision (benefit) differs from the federal statutory rate multiplied by pre-tax income (loss) and could fluctuate significantly in the future as it is affected by many factors, including the overall level of pre-tax income, mix of our pre-tax income generated across the various jurisdictions in which we operate, changes in tax laws and regulations in those jurisdictions, changes in valuation allowances on our deferred tax assets, tax planning strategies available to us and other discrete items.
Goodwill. Goodwill is reviewed for impairment each fiscal year or between the annual tests if an event occurs or circumstances change that indicate it is more likely than not that the fair value of a reporting unit is less than its carrying value. We perform our annual impairment test as of January 1 in each fiscal year. We performed our last annual impairment test on our goodwill as of January 1, 2016 by first assessing qualitative factors to determine whether it was necessary to perform the two-step annual goodwill impairment test. Based on our qualitative assessments, including, but not limited to, the results of our most recent quantitative impairment test, consideration of macroeconomic conditions, industry and market conditions, cash flows, and changes in our share price, we concluded that it was more likely than not that the fair value of our reporting units was greater than their carrying value.
Consolidation. We consolidate entities in which we own more than 50% of the voting stock and control operations and also variable interest entities for which we are the primary beneficiary. Investments in nonconsolidated affiliates in which we own more than 20% of the voting stock or otherwise exercise significant influence over operating and financial policies, but not control of the nonconsolidated affiliate, are accounted for using the equity method of accounting. Investments in nonconsolidated affiliates in which we own less than 20% of the voting stock are accounted for using the cost method of accounting.
Business Combinations. We account for our business combinations under the acquisition method of accounting. Identifiable assets acquired, liabilities assumed and any noncontrolling interest in the acquiree are recognized and measured as of the acquisition date at fair value. Goodwill is recognized to the extent by which the aggregate of the acquisition-date fair value of the consideration transferred and any noncontrolling interest in the acquiree exceeds the recognized basis of the identifiable assets acquired, net of assumed liabilities. Determining the fair value of assets acquired, liabilities assumed and noncontrolling interest requires management’s judgment and often involves the use of significant estimates and assumptions, including assumptions with respect to future cash flows, discount rates and asset lives among other items.

43
Recent Accounting Pronouncements
See Note 2 to the accompanying consolidated financial statements for a discussion of recent accounting guidance.
RESULTS OF OPERATIONS
Fiscal 2016 Compared to Fiscal 2015
The following table sets forth segment information by business unit, and as a percentage of segment revenues, for the fiscal years ended March 31, 2016 and 2015. Due to the acquisition of Pilgrim Media Group, LLC ("Pilgrim Studios"), the results of operations for the Television Production segment for the fiscal year ended March 31, 2016 includes revenues of $52.5 million and gross contribution of $10.9 million (excluding purchase accounting impact of $6.5 million) from Pilgrim Studios from the acquisition date of November 12, 2015 through March 31, 2016 (see Note 11 to our consolidated financial statements).
Year Ended March 31,2016 2015 Increase (Decrease)
Amount
% ofSegmentRevenues Amount
% ofSegmentRevenues Amount Percent
(Amounts in millions)
Segment revenuesMotion Pictures $ 1,677.5 $ 1,820.1 $ (142.6) (7.8)%Television Production 669.9 579.5 90.4 15.6 %
$ 2,347.4 $ 2,399.6 $ (52.2) (2.2)%Gross segment contribution(1)
Motion Pictures $ 184.3 11.0% $ 449.8 24.7% $ (265.5) (59.0)%Television Production 104.0 15.5 55.1 9.5 48.9 88.7 %
$ 288.3 12.3% $ 504.9 21.0% $ (216.6) (42.9)% _________________________________________
(1) Gross segment contribution is defined as segment revenue less segment direct operating and distribution and marketing expenses, and excludes purchase accounting and related adjustments, start-up costs of new business initiatives, a non-cash imputed interest charge of $5.3 million in fiscal 2016, and backstopped prints and advertising ("P&A") expense (see Note 16 to our consolidated financial statements). Gross segment contribution amounts for fiscal 2015 reflect the reclassification of certain distribution and marketing expenses in order to be consistent with the current fiscal year presentation (see Distribution and Marketing Expenses below).
A significant component of revenue comes from home entertainment. The following table sets forth total home entertainment revenue for both the Motion Pictures and Television Production reporting segments for the fiscal years ended March 31, 2016 and 2015:
Year Ended March 31, Increase (Decrease) 2016 2015 Amount Percent (Amounts in millions)
Home Entertainment RevenueMotion Pictures $ 579.8 $ 662.7 $ (82.9) (12.5)%Television Production 60.3 44.8 15.5 34.6 %
$ 640.1 $ 707.5 $ (67.4) (9.5)%

44
Motion Pictures Revenue
The table below sets forth Motion Pictures revenue by media for the fiscal years ended March 31, 2016 and 2015:
Year Ended March 31, Increase (Decrease) 2016 2015 Amount Percent (Amounts in millions)
Motion PicturesTheatrical $ 314.1 $ 354.0 $ (39.9) (11.3)%Home Entertainment 579.8 662.7 (82.9) (12.5)%Television 205.1 270.2 (65.1) (24.1)%International 548.2 495.0 53.2 10.7 %Other 30.3 38.2 (7.9) (20.7)%
$ 1,677.5 $ 1,820.1 $ (142.6) (7.8)%
Motion Pictures — Theatrical Revenue
The following table sets forth the titles released from our Fiscal 2016 and Fiscal 2015 Theatrical Slates and other titles that represented a significant portion of theatrical revenue for the fiscal years ended March 31, 2016 and 2015, respectively:
Year Ended March 31,2016 2015
Theatrical Release Date Theatrical Release Date
Fiscal 2016 Theatrical Slate: Fiscal 2015 Theatrical Slate:The Divergent Series: Allegiant March 2016 The Divergent Series: Insurgent March 2015Gods of Egypt February 2016 The D.U.F.F. February 2015The Choice February 2016 Mortdecai January 2015
Dirty Grandpa January 2016The Hunger Games:Mockingjay - Part 1 November 2014
Norm of the North January 2016 John Wick October 2014The Hunger Games: Mockingjay - Part 2 November 2015 Addicted* October 2014*Love the Coopers November 2015 The Expendables 3 August 2014The Last Witch Hunter October 2015 Step Up All In August 2014Freeheld* October 2015* The Quiet Ones April 2014Sicario** September 2015** Draft Day April 2014Shaun the Sheep Movie August 2015American Ultra August 2015The Age of Adaline April 2015Child 44* April 2015*
Fiscal 2015 Theatrical Slate: Fiscal 2014 Theatrical Slate:The Divergent Series: Insurgent March 2015 Divergent March 2014
The Hunger Games: Mockingjay - Part 1 November 2014The Hunger Games: CatchingFire November 2013
___________________* Limited release** Initially a limited release through September 30, 2015, with a wide release in October 2015.

45
The following table sets forth the components of theatrical revenue by product category for the fiscal years ended March 31, 2016 and 2015:
Year Ended March 31, Increase (Decrease) 2016 2015 Amount Percent (Amounts in millions)
Theatrical revenuesFeature Film(1) $ 296.5 $ 338.4 $ (41.9) (12.4)%Managed Brands(2) 11.5 8.5 3.0 35.3 %Other(3) 6.1 7.1 (1.0) (14.1)%
$ 314.1 $ 354.0 $ (39.9) (11.3)%___________________
(1) Feature Film includes releases through our Lionsgate and Summit Entertainment film labels. We released 14 films in fiscal 2016 and 10 films in fiscal 2015 theatrically in the U.S. from these labels, which included films developed and produced in-house, films co-developed and co-produced and films acquired from third parties.
(2) Managed Brands represents direct-to-DVD motion pictures, acquired and licensed brands, third-party library product and ancillary-driven platform theatrical releases. These theatrical releases included releases through our specialty films distribution labels, Lionsgate Premiere, and through CodeBlack films, and with our equity method investee, Roadside Attractions.
(3) Represents certain specialty theatrical releases with our equity method investee, Pantelion Films, and other titles.
Theatrical revenue of $314.1 million decreased $39.9 million, or 11.3%, in fiscal 2016, as compared to fiscal 2015, primarily due to the relative performance of our feature films, as listed in the table above, and in particular, the lower box office generated from The Hunger Games: Mockingjay - Part 2 and The Divergent Series: Allegiant as compared to The Hunger Games: Mockingjay - Part 1 and The Divergent Series: Insurgent in fiscal 2015. To a lesser extent, the decrease was also driven by the limited releases of Child 44 and Freeheld in fiscal 2016, and while The Age of Adaline had a strong performance at the box office, under the terms of our distribution arrangement, we recorded only our distribution fee as theatrical revenue.

46
Motion Pictures — Home Entertainment Revenue
The following table sets forth our feature film titles released on home entertainment in the fiscal years ended March 31, 2016 and 2015, in addition to other titles which contributed a significant amount of home entertainment revenue in fiscal 2016 and fiscal 2015, respectively:
Year Ended March 31,2016 2015
Packaged Media
Release Date Packaged Media
Release Date
Fiscal 2016 Theatrical Slate: Fiscal 2015 Theatrical Slate:The Hunger Games: Mockingjay -Part 2 March 2016
The Hunger Games: Mockingjay -Part 1
March 2015
Love the Coopers February 2016 John Wick February 2015The Last Witch Hunter February 2016 Addicted February 2015Freeheld February 2016 The Expendables 3 November 2014Sicario January 2016 Step Up All In November 2014American Ultra November 2015 Draft Day September 2014Shaun the Sheep Movie November 2015 The Quiet Ones August 2014The Age of Adaline September 2015Child 44 August 2015
Fiscal 2015 Theatrical Slate: Fiscal 2014 Theatrical Slate:The Divergent Series: Insurgent August 2015 Tyler Perry's A Madea Christmas November 2014The D.U.F.F. June 2015 Divergent August 2014Mortdecai May 2015 The Single Moms Club July 2014The Hunger Games: Mockingjay -Part 1 March 2015 I, Frankenstein May 2014John Wick February 2015 The Legend of Hercules April 2014
The Hunger Games: Catching Fire March 2014
The following table sets forth the components of home entertainment revenue by product category for the fiscal years ended March 31, 2016 and 2015:
Year Ended March 31, 2016 2015
Packaged
MediaDigital
Media(1) TotalPackaged
MediaDigital
Media(1) Total
TotalIncrease
(Decrease) (Amounts in millions)
Home entertainment revenues(2)
Feature Film:Fiscal 2016 Theatrical Slate $ 110.3 $ 36.9 $ 147.2 $ — $ — $ — $ 147.2Fiscal 2015 Theatrical Slate 67.7 67.4 135.1 128.4 35.8 164.2 (29.1)Fiscal 2014 Theatrical Slate 17.1 7.7 24.8 106.6 88.0 194.6 (169.8)Prior Theatrical Slates 31.3 23.7 55.0 45.8 28.7 74.5 (19.5)
Total Feature Film 226.4 135.7 362.1 280.8 152.5 433.3 (71.2)Managed Brands 131.7 78.2 209.9 147.5 74.9 222.4 (12.5)Other 4.8 3.0 7.8 4.3 2.7 7.0 0.8
$ 362.9 $ 216.9 $ 579.8 $ 432.6 $ 230.1 $ 662.7 $ (82.9)
(1) Digital media revenue consists of revenues generated from pay-per-view and video-on-demand platforms, EST, and digital rental.
(2) Certain amounts in fiscal 2015 have been reclassified between product types in order to be consistent with the current fiscal year classification.

47
Home entertainment revenue of $579.8 million decreased $82.9 million, or 12.5%, in fiscal 2016, as compared to fiscal 2015. The decrease was primarily driven by the performance of our Feature Film titles released on packaged media from our Fiscal 2016 and Fiscal 2015 Theatrical Slates in fiscal 2016 (as listed in the table above), compared to the revenue from the titles released on packaged media from our Fiscal 2015 and Fiscal 2014 Theatrical Slates in fiscal 2015 (as listed in the table above). In particular, significant home entertainment revenues were generated in fiscal 2015 from The Hunger Games: Mockingjay - Part 1 and Divergent, which compared to lower home entertainment revenues generated in fiscal 2016 from The Hunger Games: Mockingjay - Part 2 and The Divergent Series: Insurgent. Additionally, Managed Brands decreased $12.5 million, driven by lower packaged media revenue and slightly offset by increased digital media revenue in fiscal 2016, as compared to fiscal 2015.
Motion Pictures — Television Revenue
The following table sets forth the titles contributing significant motion pictures television revenue for the fiscal years ended March 31, 2016 and 2015:
Year Ended March 31,2016 2015
Fiscal 2015 Theatrical Slate: Fiscal 2014 Theatrical Slate:John Wick DivergentThe Divergent Series: Insurgent Ender's GameThe Hunger Games: Mockingjay - Part 1 Red 2
The Hunger Games: Catching FirePrior Theatrical Slates: Prior Theatrical Slates:
The Twilight Saga: Breaking Dawn - Part 2 The Hunger GamesThe Twilight Saga: Breaking Dawn - Part 1
The following table sets forth the components of television revenue by product category for the fiscal years ended March 31, 2016 and 2015:
Year Ended March 31, Increase (Decrease) 2016 2015 Amount Percent (Amounts in millions)
Television revenues(1)
Feature Film:Fiscal 2016 Theatrical Slate $ 9.2 $ — $ 9.2 n/mFiscal 2015 Theatrical Slate 58.2 16.3 41.9 257.1 %Fiscal 2014 Theatrical Slate 15.4 98.3 (82.9) (84.3)%Prior Theatrical Slates 83.4 110.7 (27.3) (24.7)%
Total Feature Film 166.2 225.3 (59.1) (26.2)%Managed Brands 35.7 41.9 (6.2) (14.8)%Other 3.2 3.0 0.2 6.7 %
$ 205.1 $ 270.2 $ (65.1) (24.1)% n/m - Percentage not meaningful.(1) Certain amounts in fiscal 2015 have been reclassified between product types in order to be consistent with the current
fiscal year classification.
Television revenue decreased in fiscal 2016 as compared to fiscal 2015, primarily driven by our feature films. In particular, there were a fewer number of titles with television windows opening in the current fiscal year from our smaller Fiscal 2015 Theatrical Slate as compared to our Fiscal 2014 Theatrical Slate, and lower revenue was generated from those titles. Additionally, revenue decreased in fiscal 2016 from our Prior Theatrical Slates category, largely driven by a significant contribution from The Hunger Games in fiscal 2015.

48
Motion Pictures — International Revenue
The following table sets forth the titles contributing significant motion pictures international revenue for the fiscal years ended March 31, 2016 and 2015:
Year Ended March 31,2016 2015
Fiscal 2016 Theatrical Slate: Fiscal 2015 Theatrical Slate:Child 44 Step Up All InGods of Egypt The Divergent Series: InsurgentSicario The Hunger Games: Mockingjay - Part 1The Divergent Series: AllegiantThe Hunger Games: Mockingjay - Part 2The Last Witch Hunter
Fiscal 2015 Theatrical Slate: Fiscal 2014 Theatrical Slate:Mortdecai DivergentThe Divergent Series: Insurgent The Hunger Games: Catching Fire
The following table sets forth the components of international revenue by product category for the fiscal years ended March 31, 2016 and 2015:
Year Ended March 31, Increase (Decrease) 2016 2015 Amount Percent (Amounts in millions)
International revenues(1)
Feature Film:Fiscal 2016 Theatrical Slate $ 281.8 $ — $ 281.8 n/mFiscal 2015 Theatrical Slate 96.4 209.7 (113.3) (54.0)%Fiscal 2014 Theatrical Slate 17.7 99.4 (81.7) (82.2)%Prior Theatrical Slates 48.2 84.1 (35.9) (42.7)%
Total Feature Film 444.1 393.2 50.9 12.9 %UK Third Party Product(2) 72.4 66.8 5.6 8.4 %Managed Brands 22.9 22.3 0.6 2.7 %Other 8.8 12.7 (3.9) (30.7)%
$ 548.2 $ 495.0 $ 53.2 10.7 % n/m - Percentage not meaningful.(1) Certain amounts in fiscal 2015 have been reclassified between product types in order to be consistent with the current
fiscal year classification.(2) UK Third Party Product represents titles acquired separately for self-distribution in the United Kingdom.
International motion pictures revenue increased in fiscal 2016 as compared to fiscal 2015, primarily driven by our feature films, and in particular, a higher contribution from our Fiscal 2016 Theatrical Slate in the current fiscal year as compared to the revenue generated by our Fiscal 2015 Theatrical Slate in the prior fiscal year, due to a greater number of titles generating revenue. This was partially offset by lower revenue from our Prior Theatrical Slates category, which included significant contributions from The Hunger Games, The Twilight Saga: Breaking Dawn - Part 1 and The Twilight Saga: Breaking Dawn - Part 2 in fiscal 2015.
Motion Pictures —Other Revenue
Other revenue included in motion pictures revenue decreased in fiscal 2016 as compared to fiscal 2015, primarily due to a licensing arrangement made in fiscal 2015.

49
Television Production Revenue
The following table sets forth the components and the changes in the components of revenue that make up television production revenue for the fiscal years ended March 31, 2016 and 2015:
Year Ended March 31, Increase (Decrease) 2016 2015 Amount Percent (Amounts in millions)
Television ProductionDomestic television $ 415.5 $ 415.2 $ 0.3 0.1 %International 190.2 112.4 77.8 69.2 %Home entertainment revenue
Digital 48.8 34.3 14.5 42.3 %Packaged Media 11.5 10.5 1.0 9.5 %
Total home entertainment revenue 60.3 44.8 15.5 34.6 %Other 3.9 7.1 (3.2) (45.1)%
$ 669.9 $ 579.5 $ 90.4 15.6 %
Television Production - Domestic Television
Domestic television revenue increased slightly in fiscal 2016, as compared to fiscal 2015, primarily due to television revenue in fiscal 2016 of $52.5 million from the November 12, 2015 acquisition of Pilgrim Studios, which was mostly offset by a decrease in revenue driven by fewer television episodes delivered in fiscal 2016, as compared to fiscal 2015, and in particular, significant revenue in fiscal 2015 from Mad Men - Season 7. Television episodes delivered for original exhibition during fiscal 2016 and 2015 included the episode deliveries as shown in the table below:
Year Ended Year EndedMarch 31, 2016 March 31, 2015
Episodes Hours Episodes Hours
Casual - Season 1 1/2hr 10 5.0 Anger Management 1/2hr 35 17.5Greenleaf - Season 1 1hr 3 3.0 Ascension 1hr 6 6.0Manhattan - Season 2 1hr 10 10.0 Houdini 1hr 4 4.0Monica the Medium - Season 1 1hr 10 10.0 Mad Men - Season 7 1hr 11 11.0Monica the Medium - Season 2 1hr 1 1.0 Manhattan - Season 1 1hr 13 13.0Nashville - Season 3 1hr 5 5.0 Nashville - Season 2 1hr 3 3.0Nashville - Season 4 1hr 16 16.0 Nashville - Season 3 1hr 17 17.0Orange Is The New Black -Season 3 1hr 1 1.0 Nurse Jackie - Season 7 1/2hr 12 6.0Orange Is The New Black -Season 4 1hr 13 13.0
Orange Is The New Black -Season 3 1hr 12 12.0
The Royals - Season 2 1hr 10 10.0 Rosemary's Baby 1hr 4 4.0
Other(1) 1/2hr &1hr 77 47.5 The Royals - Season 1 1hr 9 9.0
Other(1) 1/2hr & 1hr 112 65.5156 121.5 238 168.0
______________________(1) Other in fiscal 2016 includes episodes delivered for Christina Milian Turned Up (Season 2), Deadbeat (Seasons 2 &
3), Deion's Family Playbook, DeSean Jackson: Home Team (Season 1), Flea Market Flip (Seasons 6 & 7), Rocket Jump: The Show, among others. Other in fiscal 2015 includes episodes delivered for Alaska: Battle on the Bay, Christina Milian Turned Up (Season 1), Deadbeat (Season 2), Deal With It (Season 2), Deion's Family Playbook, Flea Market Flip (Seasons 4 & 5), Partners, and Way Out West.

50
In addition to the titles mentioned in the table above, significant domestic television revenue was contributed in fiscal 2016 from Family Feud (Seasons 8 & 9), The Wendy Williams Show (Seasons 6 & 7), House of Payne, Celebrity Name Game, and Anger Management, and in fiscal 2015, from Are We There Yet, Family Feud (Seasons 7 & 8), and The Wendy Williams Show (Season 5).
Television Production - International Revenue
International revenue in fiscal 2016 increased as compared to fiscal 2015, primarily driven by a significant contribution of revenue from Orange Is The New Black (Seasons 1, 2, 3 & 4), and to a lesser extent, contributions from Blue Mountain State (Seasons 1, 2 & 3) and The Royals (Seasons 1 & 2) in fiscal 2016, partially offset by decreases in revenues from Anger Management and Mad Men.
Television Production - Home Entertainment Revenue
The increase in home entertainment revenue is primarily due to an increase in digital media revenue, largely driven by revenues from Mad Men (Season 7), Manhattan (Season 2), The Royals (Season 1), and Blue Mountain State (Seasons 1,2 & 3) in fiscal 2016, compared to revenues from Mad Men (Season 7) and Manhattan (Season 1) in fiscal 2015.
Direct Operating Expenses
The following table sets forth direct operating expenses by segment for the fiscal years ended March 31, 2016 and 2015:
Year Ended Year EndedMarch 31, 2016 March 31, 2015
MotionPictures
TelevisionProduction Total
MotionPictures
TelevisionProduction Total
(Amounts in millions)
Direct operating expensesAmortization of films and televisionprograms $ 659.3 $ 360.5 $ 1,019.8 $ 545.7 $ 354.3 $ 900.0Participation and residual expense 214.9 166.9 381.8 270.8 131.4 402.2Provision for doubtful accounts andforeign exchange losses 0.1 4.4 4.5 11.0 2.6 13.6
874.3 531.8 1,406.1 827.5 488.3 1,315.8Other(1) — — 9.2 — — —
Total direct operating expenses $ 874.3 $ 531.8 $ 1,415.3 $ 827.5 $ 488.3 $ 1,315.8Direct operating expenses as a percentage ofsegment revenues 52.1% 79.4% 60.3% 45.5% 84.3% 54.8%
______________________(1) Other direct operating expenses primarily consist of the incremental amortization expense of the purchase accounting
fair value adjustments on television assets related to the acquisition of Pilgrim Studios, and direct operating costs related to our new direct-to-consumer business initiatives including our subscription video-on-demand platforms.
Direct operating expenses of the Motion Pictures segment of $874.3 million for fiscal 2016 were 52.1% of motion pictures revenue, compared to $827.5 million, or 45.5% of motion pictures revenue for fiscal 2015. Direct operating expenses increased by $46.8 million, even though motion pictures revenue decreased $142.6 million primarily due to the higher amortization rates of our Fiscal 2016 and Fiscal 2015 Theatrical Slates in the current fiscal year as compared to the amortization rates of our Fiscal 2015 and Fiscal 2014 Theatrical Slates in the prior fiscal year. In particular, the amortization rates in the current fiscal year for The Hunger Games: Mockingjay - Part 2 and to a lesser extent, The Divergent Series: Insurgent and The Last Witch Hunter, were higher as compared to the amortization rates in the prior fiscal year for The Hunger Games: Mockingjay - Part 1 and to a lesser extent, Divergent and The Hunger Games: Catching Fire. Included in direct operating expenses are investment in film write-downs of approximately $22.2 million in fiscal 2016, compared to approximately $17.3 million in fiscal 2015. Foreign exchange losses decreased in fiscal 2016 as compared to fiscal 2015, and this decrease was offset partially by an increase in the provision for doubtful accounts.
Direct operating expenses of the Television Production segment of $531.8 million for fiscal 2016 were 79.4% of television production revenue, compared to $488.3 million, or 84.3%, of television production revenue for fiscal 2015. The increase in direct operating expense is primarily due to an increase in television production revenue. The decrease in direct operating

51
expenses as a percentage of television production revenue is primarily due to the mix of titles generating revenue in fiscal 2016 as compared to fiscal 2015, and was primarily driven by the significant contribution of revenue in fiscal 2016 from Orange Is The New Black (which carries a lower amortization rate as compared to the amortization rate of the total Television Production segment), relative to total television production revenue. This decrease was offset partially by an increase attributable to a greater number of new television programs in fiscal 2016 compared to fiscal 2015, which typically result in higher amortization expenses in relation to revenues initially, until there are a sufficient number of subsequent seasons ordered and episodes produced, such that revenue can be generated from syndication in domestic and international markets.
Distribution and Marketing Expenses
The following table sets forth distribution and marketing expenses by segment for the fiscal years ended March 31, 2016 and 2015:
Year Ended Year Ended March 31, 2016 March 31, 2015
MotionPictures
TelevisionProduction Total
MotionPictures
TelevisionProduction Total
(Amounts in millions)
Distribution and marketing expensesTheatrical $ 392.1 $ — $ 392.1 $ 289.6 $ — $ 289.6Home Entertainment 142.9 8.3 151.2 166.4 6.7 173.1International 69.3 15.3 84.6 80.8 12.8 93.6Television 14.6 15.8 30.4 6.1 16.6 22.7
618.9 39.4 658.3 542.9 36.1 579.0Other(1) — — 3.5 — 12.5
Total distribution and marketing expenses $ 618.9 $ 39.4 $ 661.8 $ 542.9 $ 36.1 $ 591.5______________________
(1) Other distribution and marketing expenses in fiscal 2016 consist of distribution and marketing costs related to our new direct-to-consumer business initiatives, including our subscription video-on-demand platforms, and backstopped P&A expense, which represents the amount of theatrical marketing expense for third party titles that we funded and expensed for which a third party provides a first dollar loss guarantee (subject to a cap) that such expense will be recouped from the performance of the film (which results in minimal risk of loss to the Company). The amount represents the P&A expense incurred net of the impact of expensing the P&A costs over the revenue streams similar to a participation expense. We do not consider these costs part of segment distribution and marketing expense and have reclassified the fiscal 2015 amount of backstopped P&A from the Motion Pictures segment to Other to be consistent with the current fiscal year presentation.
The majority of distribution and marketing expenses relate to the Motion Pictures segment. Theatrical P&A in the Motion Pictures segment in fiscal 2016 of $392.1 million increased $102.5 million, compared to $289.6 million in fiscal 2015. The increase was primarily driven by higher P&A spending on our theatrical releases, in part due to a greater number of wide releases requiring P&A in fiscal 2016. In addition, the increase was driven to a lesser extent, by higher P&A incurred in advance for films to be released in fiscal 2017. In fiscal 2016, approximately $16.6 million of P&A was incurred in advance for films to be released in fiscal 2017, such as Criminal, Now You See Me 2, and Deepwater Horizon. In fiscal 2015, approximately $5.9 million of P&A was incurred in advance for films to be released in fiscal 2016, such as The Hunger Games: Mockingjay Part 2 and Child 44.
Home entertainment distribution and marketing costs on motion pictures and television product in fiscal 2016 of $151.2 million decreased $21.9 million, or 12.7%, compared to $173.1 million in fiscal 2015, primarily due to lower motion pictures home entertainment revenue. Home entertainment distribution and marketing costs as a percentage of home entertainment revenues in fiscal 2016 were 23.6%, and were comparable to home entertainment distribution and marketing costs as a percentage of home entertainment revenues in fiscal 2015 of 24.5%.
International distribution and marketing expenses in the Motion Pictures segment in fiscal 2016 of $69.3 million decreased from $80.8 million in fiscal 2015, primarily driven by higher spending in fiscal 2015 on our theatrical slate releases, including The Expendables 3 and The Hunger Games: Mockingjay - Part 1.

52
Gross Segment Contribution
Gross segment contribution is defined as segment revenue less segment direct operating and segment distribution and marketing expenses. Consistent with how management reviews the Television Production gross segment contribution, the Television Production segment also excludes a non-cash imputed interest charge of $5.3 million in fiscal 2016 for the interest cost of certain long-term accounts receivable for Television Production licensed product that become due beyond one-year. The following table sets forth gross segment contribution for the fiscal years ended March 31, 2016 and 2015:
Year Ended March 31, Increase (Decrease)
2016
% ofSegmentRevenues 2015
% ofSegmentRevenues Amount Percent
(Amounts in millions)
Gross segment contributionMotion Pictures $ 184.3 11.0% $ 449.8 24.7% $ (265.5) (59.0)%Television Production 104.0 15.5 55.1 9.5 48.9 88.7 %
$ 288.3 12.3% $ 504.9 21.0% $ (216.6) (42.9)%
Gross segment contribution of the Motion Pictures segment for fiscal 2016 of $184.3 million decreased $265.5 million, or 59.0%, as compared to fiscal 2015. The decrease in gross segment contribution and gross contribution margin of the Motion Pictures segment was primarily driven by our theatrical slates, and is due to lower motion pictures revenue, higher direct operating expenses as a percentage of motion pictures revenue, and to a lesser extent, higher distribution and marketing expenses as a percentage of motion pictures revenue.
Gross segment contribution of the Television Production segment for fiscal 2016 increased $48.9 million, or 88.7% as compared to fiscal 2015. The increase in gross segment contribution and gross contribution margin of the Television Production segment is due to an increase in television production revenue and lower direct operating expenses as a percentage of television production revenue.
General and Administrative Expenses
The following table sets forth general and administrative expenses by segment for the fiscal years ended March 31, 2016 and 2015:
Year Ended March 31, Increase (Decrease)
2016% of
Revenues 2015% of
Revenues Amount Percent (Amounts in millions)
General and administrative expensesMotion Pictures $ 81.0 $ 73.5 $ 7.5 10.2 %Television Production 19.8 13.3 6.5 48.9 %Shared services and corporate expenses,excluding items below 76.4 85.7 (9.3) (10.9)%
General and administrative expenses before itemsbelow: 177.2 7.5% 172.5 7.2% 4.7 2.7 %
Share-based compensation expense 78.5 80.3 (1.8) (2.2)%Restructuring and other items 19.8 10.7 9.1 85.0 %Purchase accounting and related adjustments 1.9 — 1.9 n/mStart-up costs of new business initiatives 4.8 — 4.8 n/m
Total general and administrative expenses $ 282.2 12.0% $ 263.5 11.0% $ 18.7 7.1 %
Total General and Administrative Expenses
General and administrative expenses increased by $18.7 million, or 7.1%, as reflected in the table above and further discussed below.
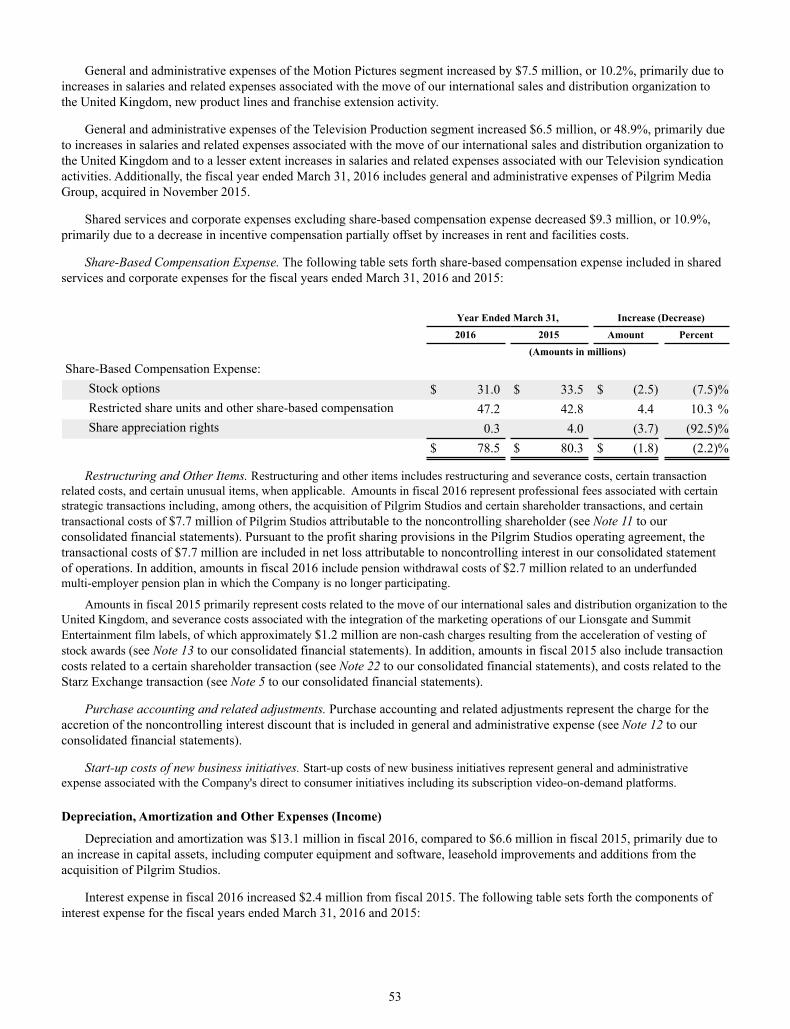
53
General and administrative expenses of the Motion Pictures segment increased by $7.5 million, or 10.2%, primarily due to increases in salaries and related expenses associated with the move of our international sales and distribution organization to the United Kingdom, new product lines and franchise extension activity.
General and administrative expenses of the Television Production segment increased $6.5 million, or 48.9%, primarily due to increases in salaries and related expenses associated with the move of our international sales and distribution organization to the United Kingdom and to a lesser extent increases in salaries and related expenses associated with our Television syndication activities. Additionally, the fiscal year ended March 31, 2016 includes general and administrative expenses of Pilgrim Media Group, acquired in November 2015.
Shared services and corporate expenses excluding share-based compensation expense decreased $9.3 million, or 10.9%, primarily due to a decrease in incentive compensation partially offset by increases in rent and facilities costs.
Share-Based Compensation Expense. The following table sets forth share-based compensation expense included in shared services and corporate expenses for the fiscal years ended March 31, 2016 and 2015:
Year Ended March 31, Increase (Decrease) 2016 2015 Amount Percent (Amounts in millions)
Share-Based Compensation Expense:Stock options $ 31.0 $ 33.5 $ (2.5) (7.5)%Restricted share units and other share-based compensation 47.2 42.8 4.4 10.3 %Share appreciation rights 0.3 4.0 (3.7) (92.5)%
$ 78.5 $ 80.3 $ (1.8) (2.2)%
Restructuring and Other Items. Restructuring and other items includes restructuring and severance costs, certain transaction related costs, and certain unusual items, when applicable. Amounts in fiscal 2016 represent professional fees associated with certain strategic transactions including, among others, the acquisition of Pilgrim Studios and certain shareholder transactions, and certain transactional costs of $7.7 million of Pilgrim Studios attributable to the noncontrolling shareholder (see Note 11 to our consolidated financial statements). Pursuant to the profit sharing provisions in the Pilgrim Studios operating agreement, the transactional costs of $7.7 million are included in net loss attributable to noncontrolling interest in our consolidated statement of operations. In addition, amounts in fiscal 2016 include pension withdrawal costs of $2.7 million related to an underfunded multi-employer pension plan in which the Company is no longer participating.
Amounts in fiscal 2015 primarily represent costs related to the move of our international sales and distribution organization to the United Kingdom, and severance costs associated with the integration of the marketing operations of our Lionsgate and Summit Entertainment film labels, of which approximately $1.2 million are non-cash charges resulting from the acceleration of vesting of stock awards (see Note 13 to our consolidated financial statements). In addition, amounts in fiscal 2015 also include transaction costs related to a certain shareholder transaction (see Note 22 to our consolidated financial statements), and costs related to the Starz Exchange transaction (see Note 5 to our consolidated financial statements).
Purchase accounting and related adjustments. Purchase accounting and related adjustments represent the charge for the accretion of the noncontrolling interest discount that is included in general and administrative expense (see Note 12 to our consolidated financial statements).
Start-up costs of new business initiatives. Start-up costs of new business initiatives represent general and administrative expense associated with the Company's direct to consumer initiatives including its subscription video-on-demand platforms.
Depreciation, Amortization and Other Expenses (Income)
Depreciation and amortization was $13.1 million in fiscal 2016, compared to $6.6 million in fiscal 2015, primarily due to an increase in capital assets, including computer equipment and software, leasehold improvements and additions from the acquisition of Pilgrim Studios.
Interest expense in fiscal 2016 increased $2.4 million from fiscal 2015. The following table sets forth the components of interest expense for the fiscal years ended March 31, 2016 and 2015:

54
Year Ended March 31, Increase (Decrease)2016 2015 Amount Percent
(Amounts in millions)
Interest ExpenseCash Based:
Senior revolving credit facility $ 5.4 $ 6.7 $ (1.3) (19.4)%Convertible senior subordinated notes 2.4 3.5 (1.1) (31.4)%5.25% Senior Notes 11.8 11.8 — — %Term Loans 20.2 11.7 8.5 72.6 %Other 5.9 6.0 (0.1) (1.7)%
45.7 39.7 6.0 15.1 %Non-Cash Based:
Amortization of discount and deferred financing costs 9.2 12.8 (3.6) (28.1)%$ 54.9 $ 52.5 $ 2.4 4.6 %
Interest and other income was $1.9 million in fiscal 2016, compared to $2.8 million in fiscal 2015.
The following table represents our portion of the income or (loss) of our equity method investees based on our percentage ownership for the fiscal years ended March 31, 2016 and 2015:
March 31, 2016Ownership Year Ended March 31, Increase (Decrease)Percentage 2016 2015 Amount Percent
(Amounts in millions)
EPIX(1) 31.2% $ 52.1 $ 48.7 $ 3.4 7.0 %Pop(1) 50.0% (1.8) (9.6) 7.8 (81.3)%Other(2) Various (6.1) 13.4 (19.5) (145.5)%
$ 44.2 $ 52.5 $ (8.3) (15.8)% ______________________
(1) We license certain of our theatrical releases and other films and television programs to EPIX and Pop. A portion of the profits of these licenses reflecting our ownership share in the venture is eliminated through an adjustment to the equity interest income (loss) of the venture. These profits are recognized as they are realized by the venture (see Note 5 to our consolidated financial statements).
(2) On April 14, 2014, we sold all of our 34.5% interest in FEARnet, which resulted in a gain on sale of $11.4 million in the fiscal year ended March 31, 2015 included in our other equity method investments income shown above. See Note 5 to our consolidated financial statements.
Loss on Extinguishment of Debt
Loss on extinguishment of debt was $11.7 million for the fiscal year ended March 31, 2015, with no comparable loss for the fiscal year ended March 31, 2016. Amounts in fiscal 2015 primarily resulted from the March 2015 early redemption of the Term Loan Due 2020, which carried a variable rate of LIBOR, subject to a 1% floor, plus 4%, in connection with the issuance of the Term Loan Due 2022, which carries a fixed interest rate of 5%. See Note 7 to our consolidated financial statements.
Income Tax Provision (Benefit)
We had an income tax benefit of $76.5 million in fiscal 2016, compared to an expense of $31.6 million in fiscal 2015. Our income tax provision (benefit) differs from the federal statutory rate multiplied by pre-tax income (loss) and has changed from the prior fiscal year. Our income tax provision (benefit) is affected by many factors, including the overall level of pre-tax income, the mix of pre-tax income generated across the various jurisdictions in which we operate, changes in tax laws and regulations in those jurisdictions, changes in valuation allowances on our deferred tax assets, tax planning strategies available to us, and other discrete items.
The decrease in our income tax provision in fiscal 2016 as compared to fiscal 2015 is driven by lower pre-tax income and a change in the mix of pre-tax income (loss) generated across the various jurisdictions in which we operate which reflects the impact of the implementation of certain business and financing strategies. This includes a favorable permanent book-tax

55
difference in our Canadian jurisdiction for certain foreign affiliate dividends. Canadian tax law permits such dividends to be received without being subject to tax. The impact is reflected in Note 14 to our consolidated financial statements in the table that reconciles income taxes computed at U.S. statutory income tax rates to the income tax provision (benefit).
We expect that with the utilization of our net operating loss carryforwards and other tax attributes, our cash tax requirements will not increase significantly in fiscal 2017 as compared to fiscal 2016. At March 31, 2016, we had U.S. net operating loss carryforwards of approximately $285.2 million available to reduce future federal income taxes which expire beginning in 2028 through 2036, state net operating loss carryforwards of approximately $254.1 million available to reduce future state income taxes which expire in varying amounts beginning 2024, and Canadian loss carryforwards of $22.5 million, which will expire beginning in 2034. At March 31, 2016, the Company had U.K. loss carryforwards of $6.7 million which do not expire. In addition, at March 31, 2016, we had U.S. credit carryforwards related to foreign taxes paid of approximately $44.7 million to offset future federal income taxes that will expire beginning in 2021.
Net Income Attributable to Lions Gate Entertainment Corp. Shareholders
Net income attributable to our shareholders for the fiscal year ended March 31, 2016 was $50.2 million, or basic net income per common share of $0.34 on 148.5 million weighted average common shares outstanding and diluted net income per common share of $0.33 on 154.1 million weighted average common shares outstanding. This compares to net income attributable to our shareholders for the fiscal year ended March 31, 2015 of $181.8 million, or basic net income per common share of $1.31 on 139.0 million weighted average common shares outstanding and diluted net income per common share of $1.23 on 151.8 million weighted average common shares outstanding.
Fiscal 2015 Compared to Fiscal 2014
The following table sets forth segment information by business unit, and as a percentage of segment revenues, for the fiscal years ended March 31, 2015 and 2014:
Year Ended March 31,2015 2014 Increase (Decrease)
Amount
% ofSegmentRevenues Amount
% ofSegmentRevenues Amount Percent
(Amounts in millions)
Segment revenuesMotion Pictures $ 1,820.1 $ 2,182.9 $ (362.8) (16.6)%Television Production 579.5 447.4 132.1 29.5 %
$ 2,399.6 $ 2,630.3 $ (230.7) (8.8)%Gross segment contribution(1)
Motion Pictures $ 449.8 24.7% $ 491.8 22.5% $ (42.0) (8.5)%Television Production 55.1 9.5 29.6 6.6 25.5 86.1 %
$ 504.9 21.0% $ 521.4 19.8% $ (16.5) (3.2)% _________________________________________
(1) Gross segment contribution is defined as segment revenue less segment direct operating and segment distribution and marketing expenses. Gross segment contribution amounts for fiscal 2015 reflect the reclassification of certain distribution and marketing expenses in order to be consistent with the current fiscal year presentation (see Distribution and Marketing Expenses section below).
A significant component of revenue comes from home entertainment. The following table sets forth total home entertainment revenue for both the Motion Pictures and Television Production reporting segments for the fiscal years ended March 31, 2015 and 2014:
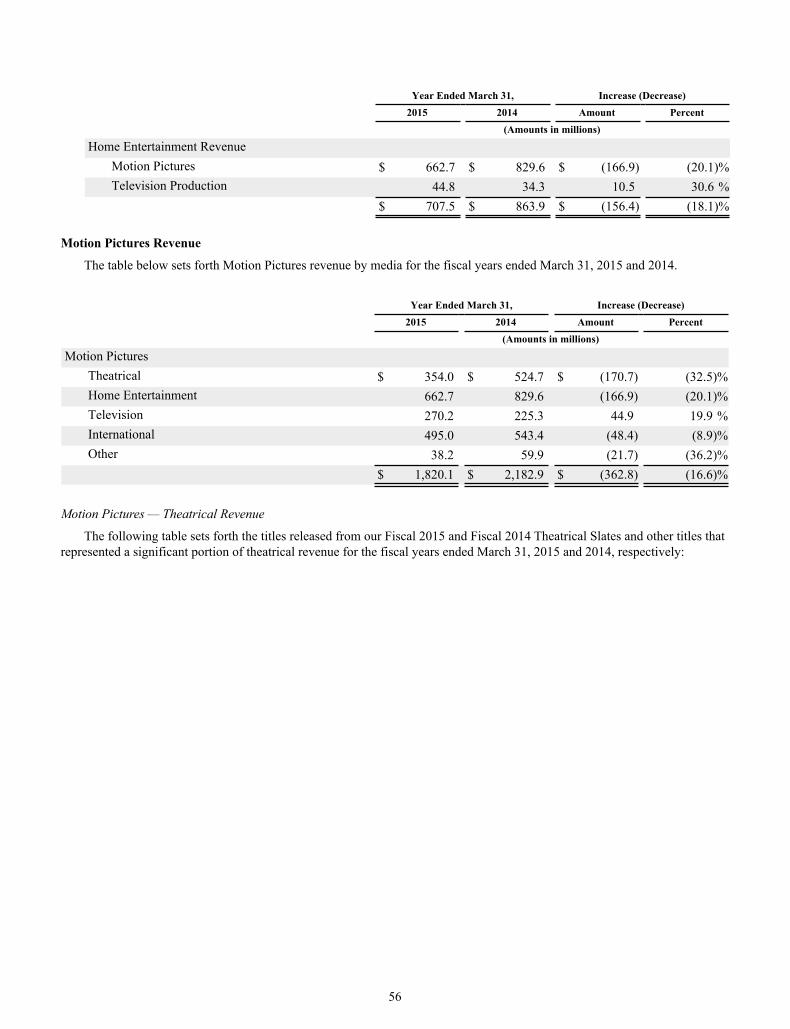
56
Year Ended March 31, Increase (Decrease) 2015 2014 Amount Percent (Amounts in millions)
Home Entertainment RevenueMotion Pictures $ 662.7 $ 829.6 $ (166.9) (20.1)%Television Production 44.8 34.3 10.5 30.6 %
$ 707.5 $ 863.9 $ (156.4) (18.1)%
Motion Pictures Revenue
The table below sets forth Motion Pictures revenue by media for the fiscal years ended March 31, 2015 and 2014.
Year Ended March 31, Increase (Decrease) 2015 2014 Amount Percent (Amounts in millions)
Motion PicturesTheatrical $ 354.0 $ 524.7 $ (170.7) (32.5)%Home Entertainment 662.7 829.6 (166.9) (20.1)%Television 270.2 225.3 44.9 19.9 %International 495.0 543.4 (48.4) (8.9)%Other 38.2 59.9 (21.7) (36.2)%
$ 1,820.1 $ 2,182.9 $ (362.8) (16.6)%
Motion Pictures — Theatrical Revenue
The following table sets forth the titles released from our Fiscal 2015 and Fiscal 2014 Theatrical Slates and other titles that represented a significant portion of theatrical revenue for the fiscal years ended March 31, 2015 and 2014, respectively:

57
Year Ended March 31,2015 2014
Theatrical Release Date Theatrical Release Date
Fiscal 2015 Theatrical Slate: Fiscal 2014 Theatrical Slate:The Divergent Series: Insurgent March 2015 Divergent March 2014The D.U.F.F. February 2015 The Single Moms Club March 2014Mortdecai January 2015 I, Frankenstein January 2014The Hunger Games: Mockingjay -Part 1 November 2014 The Legend of Hercules January 2014John Wick October 2014 Tyler Perry's A Madea Christmas December 2013
Addicted* October 2014*The Hunger Games: CatchingFire November 2013
The Expendables 3 August 2014 Ender's Game November 2013Step Up All In August 2014 Escape Plan October 2013The Quiet Ones April 2014 You're Next August 2013Draft Day April 2014 Red 2 July 2013
Now You See Me May 2013Peeples May 2013The Big Wedding April 2013
Fiscal 2014 Theatrical Slate: Fiscal 2013 Theatrical Slate:
Divergent March 2014Temptation: Confessions of aMarriage Counselor March 2013
The Hunger Games: CatchingFire November 2013
* Limited release.
The following table sets forth the components of theatrical revenue by product category for the fiscal years ended March 31, 2015 and 2014:
Year Ended March 31, Increase (Decrease) 2015 2014 Amount Percent (Amounts in millions)
Theatrical revenuesFeature Film(1) $ 338.4 $ 468.4 $ (130.0) (27.8)%Managed Brands(2) 8.5 30.1 (21.6) (71.8)%Other(3) 7.1 26.2 (19.1) (72.9)%
$ 354.0 $ 524.7 $ (170.7) (32.5)%___________________
(1) Feature Film includes our releases through our Lionsgate and Summit Entertainment film labels. We released 10 films in fiscal 2015 and 13 films in fiscal 2014 theatrically in the U.S. from these labels, which included films developed and produced in-house, films co-developed and co-produced and films acquired from third parties.
(2) Managed Brands represents direct-to-DVD motion pictures, acquired and licensed brands, third-party library product and ancillary-driven platform theatrical releases. These theatrical releases include releases through our specialty films distribution labels, Lionsgate Premiere and through CodeBlack films, and with our equity method investee, Roadside Attractions.
(3) Represents certain specialty theatrical releases with our equity method investee, Pantelion Films, and other titles.
Theatrical revenue of $354.0 million decreased $170.7 million, or 32.5%, in fiscal 2015, as compared to fiscal 2014. Approximately $130.0 million of this decrease was driven by fewer films (as listed above) released from our Fiscal 2015 Theatrical Slate compared to our Fiscal 2014 Theatrical Slate and the relative performance of those films released. In particular, the box office performance of The Hunger Games: Mockingjay - Part 1 in fiscal 2015 was lower than the box office performance of The Hunger Games: Catching Fire and fiscal 2014 included the strong box office performance of Now You See Me. In addition, theatrical revenue from Managed Brands declined $21.6 million, due primarily to significant revenue from

58
Kevin Hart: Let Me Explain and Mud in fiscal 2014, and Other theatrical revenue declined $19.1 million due primarily to significant theatrical revenue from Instructions Not Included in fiscal 2014.
Motion Pictures — Home Entertainment Revenue
The following table sets forth our feature film titles released on home entertainment in the fiscal years ended March 31, 2015 and 2014, in addition to other titles which contributed a significant amount of home entertainment revenue in fiscal 2015 and fiscal 2014, respectively:
Year Ended March 31,2015 2014
Packaged Media
Release Date Packaged Media
Release Date
Fiscal 2015 Theatrical Slate: Fiscal 2014 Theatrical Slate:The Hunger Games: Mockingjay -Part 1 March 2015 The Hunger Games: Catching Fire March 2014John Wick February 2015 Escape Plan February 2014Addicted February 2015 Ender's Game February 2014The Expendables 3 November 2014 You're Next January 2014Step Up All In November 2014 Red 2 November 2013Draft Day September 2014 Now You See Me September 2013The Quiet Ones August 2014 Peeples September 2013
The Big Wedding August 2013Fiscal 2014 Theatrical Slate: Fiscal 2013 Theatrical Slate:
Tyler Perry's A Madea Christmas November 2014Temptation: Confessions of AMarriage Counselor July 2013
Divergent August 2014 Snitch June 2013The Single Moms Club July 2014 Warm Bodies June 2013I, Frankenstein May 2014 The Last Stand May 2013The Legend of Hercules April 2014 Texas Chainsaw 3D May 2013The Hunger Games: Catching Fire March 2014 The Impossible April 2013
The Twilight Saga: Breaking Dawn- Part 2 March 2013
Prior Theatrical Slates:The Hunger Games August 2012
Managed Brands:Mud August 2013Duck Dynasty (multiple seasons) Various

59
The following table sets forth the components of home entertainment revenue by product category for the fiscal years ended March 31, 2015 and 2014:
Year Ended March 31, 2015 2014
Packaged
MediaDigital
Media(1) TotalPackaged
MediaDigital
Media(1) Total
TotalIncrease
(Decrease) (Amounts in millions)
Home entertainment revenues(2)
Feature Film:Fiscal 2015 Theatrical Slate $ 128.4 $ 35.8 $ 164.2 $ — $ — $ — $ 164.2Fiscal 2014 Theatrical Slate 106.6 88.0 194.6 209.7 49.5 259.2 (64.6)Fiscal 2013 Theatrical Slate 14.0 6.2 20.2 101.2 83.9 185.1 (164.9)Prior Theatrical Slates 31.8 22.5 54.3 71.4 23.0 94.4 (40.1)
Total Feature Film 280.8 152.5 433.3 382.3 156.4 538.7 (105.4)Managed Brands 147.5 74.9 222.4 199.5 80.6 280.1 (57.7)Other 4.3 2.7 7.0 8.6 2.2 10.8 (3.8)
$ 432.6 $ 230.1 $ 662.7 $ 590.4 $ 239.2 $ 829.6 $ (166.9) ___________________(1) Digital media revenue consists of revenues generated from pay-per-view and video-on-demand platforms, EST, and digital
rental.(2) Certain amounts in fiscal 2015 and fiscal 2014 have been reclassified between product types in order to be consistent with
the current fiscal year classification.
Home entertainment revenue of $662.7 million decreased $166.9 million, or 20.1%, in fiscal 2015 as compared to fiscal 2014. Of the $166.9 million decrease, approximately $105.4 million was from our feature films, and $57.7 million was from Managed Brands. The decrease in home entertainment revenues from our feature films was largely driven by the performance of the titles released in fiscal 2015 from our Fiscal 2015 Theatrical Slate, as compared to the titles released in fiscal 2014 from our Fiscal 2014 Theatrical Slate, which included significant revenues from the release of The Hunger Games: Catching Fire, Now You See Me and Red 2 in fiscal 2014. The decrease was also, to a lesser extent, driven by fewer titles released on packaged media from our feature films in fiscal 2015 as compared to fiscal 2014. These decreases in revenue were partially offset by contributions from our Fiscal 2014 Theatrical Slate in fiscal 2015, driven by the performance of Divergent and The Hunger Games: Catching Fire in fiscal 2015. The decrease in Managed Brands revenue was primarily due to the number and performance of titles released in fiscal 2015, as compared to the titles released in fiscal 2014, and in particular, a significant contribution from Mud in fiscal 2014.
Motion Pictures — Television Revenue
The following table sets forth the titles contributing significant motion pictures television revenue for the fiscal years ended March 31, 2015 and 2014:

60
Year Ended March 31,2015 2014
Fiscal 2014 Theatrical Slate: Fiscal 2014 Theatrical Slate:Divergent Now You See MeEnder's Game
Red 2
The Hunger Games: Catching Fire
Prior Theatrical Slates: Fiscal 2013 Theatrical Slate:The Hunger Games SnitchThe Twilight Saga: Breaking Dawn - Part 1 Temptation: Confessions of a Marriage Counselor
The Twilight Saga: Breaking Dawn - Part 2The PossessionWarm Bodies
The following table sets forth the components of television revenue by product category for the fiscal years ended March 31, 2015 and 2014:
Year Ended March 31, Increase (Decrease) 2015 2014 Amount Percent (Amounts in millions)
Television revenues(1)
Feature Film:Fiscal 2015 Theatrical Slate $ 16.3 $ — $ 16.3 n/mFiscal 2014 Theatrical Slate 98.3 24.4 73.9 n/mFiscal 2013 Theatrical Slate 17.6 94.4 (76.8) (81.4)%Prior Theatrical Slates 93.1 76.4 16.7 21.9 %
Total Feature Film 225.3 195.2 30.1 15.4 %Managed Brands 41.9 29.2 12.7 43.5 %Other 3.0 0.9 2.1 233.3 %
$ 270.2 $ 225.3 $ 44.9 19.9 % ___________________n/m - Percentage not meaningful.(1) Certain amounts in fiscal 2015 and fiscal 2014 have been reclassified between product types in order to be consistent with
the current fiscal year classification.
Television revenue increased in fiscal 2015 as compared to fiscal 2014 due primarily to an increase in the contribution of revenue from our feature films as listed above, and in particular, contributions from our Prior Theatrical Slates category reflecting television window openings for The Twilight Saga: Breaking Dawn - Part 1 and The Hunger Games and also, to a lesser extent, an increase in the contribution of revenue from our Managed Brands category reflecting the timing of television windows opening in fiscal 2015.

61
Motion Pictures — International Revenue
The following table sets forth the titles contributing significant motion pictures international revenue for the fiscal years ended March 31, 2015 and 2014:
Year Ended March 31,2015 2014
Fiscal 2015 Theatrical Slate: Fiscal 2014 Theatrical Slate:Step Up All In Escape PlanThe Divergent Series: Insurgent Now You See MeThe Hunger Games: Mockingjay - Part 1 Red 2
The Hunger Games: Catching FireFiscal 2014 Theatrical Slate: Fiscal 2013 Theatrical Slate:
Divergent The Twilight Saga: Breaking Dawn - Part 2The Hunger Games: Catching Fire
The following table sets forth the components of international revenue by product category for the fiscal years ended March 31, 2015 and 2014:
Year Ended March 31, Increase (Decrease) 2015 2014 Amount Percent (Amounts in millions)
International revenues(1)
Feature Film:Fiscal 2015 Theatrical Slate $ 209.7 $ — $ 209.7 n/mFiscal 2014 Theatrical Slate 99.4 273.9 (174.5) (63.7)%Fiscal 2013 Theatrical Slate 29.0 109.9 (80.9) (73.6)%Prior Theatrical Slates 55.1 67.2 (12.1) (18.0)%
Total Feature Film 393.2 451.0 (57.8) (12.8)%UK Third Party Product(2) 66.8 61.8 5.0 8.1 %Managed Brands 22.3 21.8 0.5 2.3 %Other 12.7 8.8 3.9 44.3 %
$ 495.0 $ 543.4 $ (48.4) (8.9)% ___________________n/m - Percentage not meaningful.(1) Certain amounts in fiscal 2015 and fiscal 2014 have been reclassified between product types in order to be consistent with
the current fiscal year classification.(2) UK Third Party Product represents titles acquired separately for self-distribution in the United Kingdom.
International motion pictures revenue decreased in fiscal 2015 as compared to fiscal 2014, due primarily to a decrease in revenues from our feature films, offset in part by increases in our UK Third Party Product and Other categories. The decrease in our feature films was primarily driven by a decrease in revenue from our Fiscal 2015 Theatrical Slate in fiscal 2015 as compared to the revenue from our Fiscal 2014 Theatrical Slate in fiscal 2014, due primarily to significant revenues from Now You See Me, Red 2 and Escape Plan in fiscal 2014, which were partially offset by higher international revenues from The Hunger Games: Mockingjay - Part 1 in fiscal 2015 as compared to The Hunger Games: Catching Fire in fiscal 2014.
Motion Pictures —Other Revenue
Other revenue included in motion pictures revenue decreased in fiscal 2015 as compared to fiscal 2014. Other revenue in fiscal 2014 primarily included revenue from the sale of a portion of our music catalog.

62
Television Production Revenue
The following table sets forth the components and the changes in the components of revenue that make up television production revenue for the fiscal years ended March 31, 2015 and 2014:
Year Ended March 31, Increase (Decrease) 2015 2014 Amount Percent (Amounts in millions)
Television ProductionDomestic television $ 415.2 $ 326.1 $ 89.1 27.3 %International 112.4 82.3 30.1 36.6 %Home entertainment revenue
Digital 34.3 22.8 11.5 50.4 %Packaged media 10.5 11.5 (1.0) (8.7)%
Total home entertainment revenue 44.8 34.3 10.5 30.6 %Other 7.1 4.7 2.4 51.1 %
$ 579.5 $ 447.4 $ 132.1 29.5 %
Television Production - Domestic Television
Domestic television revenue increased in fiscal 2015 as compared to fiscal 2014, primarily due to an increase in television episodes delivered in fiscal 2015, as compared to fiscal 2014. Television episodes delivered for original exhibition during fiscal 2015 and 2014 included the episode deliveries as shown in the table below:
Year Ended Year EndedMarch 31, 2015 March 31, 2014
Episodes Hours Episodes Hours
Anger Management 1/2hr 35 17.5 Anger Management 1/2hr 38 19.0Ascension 1hr 6 6.0 Mad Men - Season 6 1hr 11 11.0Houdini 1hr 4 4.0 Mad Men - Season 7 1hr 3 3.0Mad Men - Season 7 1hr 11 11.0 Nashville - Season 1 1hr 6 6.0Manhattan - Season 1 1hr 13 13.0 Nashville - Season 2 1hr 19 19.0Nashville - Season 2 1hr 3 3.0 Nurse Jackie - Season 6 1/2hr 12 6.0
Nashville - Season 3 1hr 17 17.0Orange Is The New Black -Season 1 1hr 5 5.0
Nurse Jackie - Season 7 1/2hr 12 6.0Orange Is The New Black -Season 2 1hr 13 13.0
Orange Is The New Black -Season 3 1hr 12 12.0 Other(1) 1/2hr & 1hr 69 40.0Rosemary's Baby 1hr 4 4.0The Royals - Season 1 1hr 9 9.0Other(1) 1/2hr & 1hr 112 65.5
238 168.0 176 122.0______________________
(1) Other in fiscal 2015 includes episodes delivered for Alaska: Battle on the Bay, Christina Milian Turned Up (Season 1), Deadbeat (Season 2), Deal With It (Season 2), Deion's Family Playbook, Flea Market Flip (Seasons 4 & 5), Partners, and Way Out West. Other in fiscal 2014 includes episodes delivered for Saint George, Deadbeat, Deion's Family Playbook, Deal With It (Seasons 1 & 2) and Flea Market Flip (Season 3).
In addition to the titles mentioned in the table above, significant domestic television revenue was contributed in fiscal 2015 from Are We There Yet, Family Feud (Seasons 7 & 8), and The Wendy Williams Show (Season 5), and in fiscal 2014, from Family Feud (Season 6) and The Wendy Williams Show (Season 4).

63
Television Production - International Revenue
International revenue in fiscal 2015 increased as compared to fiscal 2014. International revenue in fiscal 2015 primarily included revenue from Anger Management, Mad Men (Season 6), Nashville (Seasons 2 & 3), and Orange Is The New Black (Seasons 1, 2 & 3). International revenue in fiscal 2014 primarily included revenue from Anger Management, Mad Men (Seasons 5 & 6), Nashville (Seasons 1 & 2), and Orange Is The New Black (Season 1).
Television Production - Home Entertainment Revenue
The increase in home entertainment revenue in fiscal 2015 as compared to fiscal 2014 is due to an increase in digital media revenue, largely driven by revenues from Mad Men (Season 7) and Manhattan (Season 1), offset in part by a slight decrease in packaged media revenue.
Direct Operating Expenses
The following table sets forth direct operating expenses by segment for the fiscal years ended March 31, 2015 and 2014:
Year Ended Year EndedMarch 31, 2015 March 31, 2014
MotionPictures
TelevisionProduction Total
MotionPictures
TelevisionProduction Total
(Amounts in millions)
Direct operating expensesAmortization of films and televisionprograms $ 545.7 $ 354.3 $ 900.0 $ 624.0 $ 297.3 $ 921.3Participation and residual expense 270.8 131.4 402.2 359.4 89.9 449.3Provision for doubtful accounts andforeign exchange losses (gains) 11.0 2.6 13.6 (2.3) 1.1 (1.2)
$ 827.5 $ 488.3 $ 1,315.8 $ 981.1 $ 388.3 $ 1,369.4Direct operating expenses as a percentage ofsegment revenues 45.5% 84.3% 54.8% 44.9% 86.8% 52.1%
Direct operating expenses of the Motion Pictures segment of $827.5 million for fiscal 2015 were 45.5% of motion pictures revenue, compared to $981.1 million, or 44.9% of motion pictures revenue for fiscal 2014. The decrease in direct operating expenses of $153.6 million was primarily due to a decrease in motion pictures revenue in the fiscal year ended March 31, 2015, as compared to the fiscal year ended March 31, 2014. Included in direct operating expenses are investment in film write-downs of approximately $17.3 million in the fiscal year ended March 31, 2015, compared to $17.3 million in the fiscal year ended March 31, 2014. Foreign exchange losses and the provision for doubtful accounts in fiscal 2015 compared to primarily foreign exchange gains, offset in part by the provision for doubtful accounts in fiscal 2014.
Direct operating expenses of the Television Production segment of $488.3 million for fiscal 2015 were 84.3% of television production revenue, compared to $388.3 million, or 86.8%, of television production revenue for fiscal 2014. The increase in direct operating expenses of $100.0 million is primarily due to an increase in television production revenue in fiscal 2015, as compared to fiscal 2014. The slight decrease in direct operating expenses as a percentage of television production revenue is primarily due to the revenue contributions on shows such as Orange Is The New Black, Mad Men and The Wendy Williams Show, relative to total television production revenue in fiscal 2015 as compared to fiscal 2014.

64
Distribution and Marketing Expenses
The following table sets forth distribution and marketing expenses by segment for the fiscal years ended March 31, 2015 and 2014:
Year Ended Year Ended March 31, 2015 March 31, 2014
MotionPictures
TelevisionProduction Total
MotionPictures
TelevisionProduction Total
(Amounts in millions)
Distribution and marketing expensesTheatrical $ 289.6 $ — $ 289.6 $ 431.5 $ 0.3 $ 431.8Home Entertainment 166.4 6.7 173.1 200.5 6.5 207.0International 80.8 12.8 93.6 69.4 9.7 79.1Television 6.1 16.6 22.7 8.6 13.0 21.6
542.9 36.1 579.0 710.0 29.5 739.5Other(1) — — 12.5 — — —
Total distribution and marketing expenses $ 542.9 $ 36.1 $ 591.5 $ 710.0 $ 29.5 $ 739.5______________________
(1) Other distribution and marketing expenses consist of backstopped P&A, which represents the amount of theatrical marketing expense for third party titles that we funded and expensed for which a third party provides a first dollar loss guarantee (subject to a cap) that such expense will be recouped from the performance of the film (which results in minimal risk of loss to the Company). The amount represents the P&A expense incurred net of the impact of expensing the P&A costs over the revenue streams similar to a participation expense. We do not consider these costs part of segment distribution and marketing expense and have reclassified the fiscal 2015 amount of backstopped P&A from the Motion Pictures segment to Other to be consistent with the current fiscal year presentation (none in fiscal 2014).
The majority of distribution and marketing expenses relate to the Motion Pictures segment. Theatrical P&A in the Motion Pictures segment in fiscal 2015 of $289.6 million decreased $141.9 million, compared to $431.5 million in fiscal 2014. The decrease was primarily driven by lower P&A spending in the fiscal year ended March 31, 2015 on our feature films as a result of only ten wide releases from our Fiscal 2015 Theatrical Slate, compared to 13 wide releases from our Fiscal 2014 Theatrical Slate. In addition, the decrease was to a lesser extent due to lower P&A incurred on ancillary driven platform theatrical releases in fiscal 2015 as compared to fiscal 2014, which included the releases of All Is Lost, Mud and Kevin Hart: Let Me Explain, and a decrease in P&A incurred in advance for films to be released in fiscal 2016. In fiscal 2015, approximately $5.9 million of P&A was incurred in advance for films to be released in fiscal 2016, such as The Hunger Games: Mockingjay - Part 2 and Child 44. In fiscal 2014, approximately $22.9 million of P&A was incurred in advance for films to be released in fiscal 2015, such as Draft Day, The Quiet Ones, The Hunger Games: Mockingjay -Part 1 and The Expendables 3.
Home entertainment distribution and marketing costs on motion pictures and television product in fiscal 2015 of $173.1 million decreased $33.9 million, or 16.4%, compared to $207.0 million in fiscal 2014, primarily due to lower motion pictures home entertainment revenues. Home entertainment distribution and marketing costs as a percentage of home entertainment revenues in fiscal 2015 were 24.5%, and were comparable to home entertainment distribution and marketing costs as a percentage of home entertainment revenues in fiscal 2014 of 24.0%.
International distribution and marketing expenses in the Motion Pictures segment in fiscal 2015 of $80.8 million increased from $69.4 million in fiscal 2014.
Gross Segment Contribution
Gross segment contribution is defined as segment revenue less segment direct operating and segment distribution and marketing expenses. The following table sets forth gross segment contribution for the fiscal years ended March 31, 2015 and 2014:

65
Year Ended March 31, Increase (Decrease)
2015
% ofSegmentRevenues 2014
% ofSegmentRevenues Amount Percent
(Amounts in millions)
Gross segment contributionMotion Pictures $ 449.8 24.7% $ 491.8 22.5% $ (42.0) (8.5)%Television Production 55.1 9.5 29.6 6.6 25.5 86.1 %
$ 504.9 21.0% $ 521.4 19.8% $ (16.5) (3.2)%
Gross segment contribution of the Motion Pictures segment for fiscal 2015 of $449.8 million decreased $42.0 million, or 8.5%, as compared to fiscal 2014. The gross segment contribution of the Motion Pictures segment decreased only 8.5% despite a 16.6% decrease in Motion Pictures segment revenue due to lower direct operating expenses and lower distribution and marketing expenses incurred relative to motion pictures segment revenue in the fiscal year ended March 31, 2015 as compared to the fiscal year ended March 31, 2014.
Gross segment contribution of the Television Production segment for fiscal 2015 increased $25.5 million, or 86.1% as compared to fiscal 2014. The increase in gross segment contribution of the television production segment is primarily due to an increase in television production segment revenues, particularly driven by the success of shows, such as Orange Is The New Black.
General and Administrative Expenses
The following table sets forth general and administrative expenses by segment for the fiscal years ended March 31, 2015 and 2014:
Year Ended March 31, Increase (Decrease)
2015% of
Revenues 2014% of
Revenues Amount Percent (Amounts in millions)
General and administrative expensesMotion Pictures $ 73.5 $ 66.8 $ 6.7 10.0 %Television Production 13.3 12.7 0.6 4.7 %Shared services and corporate expenses,excluding items below 85.7 95.8 (10.1) (10.5)%
General and administrative expenses before itemsbelow: 172.5 7.2% 175.3 6.7% (2.8) (1.6)%
Share-based compensation expense 80.3 72.1 8.2 11.4 %Restructuring and other items 10.7 7.5 3.2 42.7 %
91.0 79.6 11.4 14.3 %Total general and administrative expenses $ 263.5 11.0% $ 254.9 9.7% $ 8.6 3.4 %
Total General and Administrative Expenses
General and administrative expenses of the Motion Pictures segment increased $6.7 million, or 10.0%, primarily due to increases in salaries and related expenses, rent and facilities costs and professional fees.
General and administrative expenses of the Television Production segment increased slightly from the fiscal year ended March 31, 2014.
Shared services and corporate expenses excluding share-based compensation expense and restructuring and other items decreased compared to the fiscal year ended March 31, 2014, primarily due to a reduction of cash-based incentive compensation, which was partially offset by an increase in share-based incentive compensation as reflected in the table below.

66
Share-Based Compensation Expense. The following table sets forth share-based compensation expense included in shared services and corporate expenses for the fiscal years ended March 31, 2015 and 2014:
Year Ended March 31, Increase (Decrease) 2015 2014 Amount Percent (Amounts in millions)
Share-Based Compensation Expense:Stock options $ 33.5 $ 22.5 $ 11.0 48.9 %Restricted share units and other share-based compensation 42.8 33.2 9.6 28.9 %Share appreciation rights 4.0 16.4 (12.4) (75.6)%
$ 80.3 $ 72.1 $ 8.2 11.4 %
Restructuring and Other Items. Restructuring and other items includes restructuring and severance costs, certain transaction related costs, and certain unusual items, when applicable. Amounts in fiscal 2015 primarily represent costs related to the move of our international sales and distribution organization to the United Kingdom, and severance costs associated with the integration of the marketing operations of our Lionsgate and Summit Entertainment film labels, of which approximately $1.2 million were non-cash charges resulting from the acceleration of vesting of stock awards (see Note 13 to our consolidated financial statements). In addition, amounts in fiscal 2015 also include transaction costs related to a certain shareholder transaction (see Note 22 to our consolidated financial statements), and costs related to the Starz Exchange transaction (see Note 5 to our consolidated financial statements). Amounts in fiscal 2014 represent the settlement of an administrative order.
Depreciation, Amortization and Other Expenses (Income)
Depreciation and amortization was $6.6 million in fiscal 2015, compared to $6.5 million in fiscal 2014.
Interest expense in fiscal 2015 decreased from fiscal 2014, primarily due to the fiscal 2014 redemption of $432.0 million principal amount of the 10.25% Senior Notes and contemporaneous issuance of $225.0 million principal amount of 5.25% Senior Notes and borrowings of $222.5 million (net of an original issuance discount of $2.5 million) under the Term Loan Due 2020 (see Note 7 to our consolidated financial statements). The following table sets forth the components of interest expense for the fiscal years ended March 31, 2015 and 2014:
Year Ended March 31, Increase (Decrease)2015 2014 Amount Percent
(Amounts in millions)
Interest ExpenseCash Based:
Senior revolving credit facility $ 6.7 $ 9.2 $ (2.5) (27.2)%Convertible senior subordinated notes 3.5 4.8 (1.3) (27.1)%5.25% Senior Notes and 10.25% Senior Note (year endedMarch 31, 2014 only) 11.8 21.6 (9.8) (45.4)%Term Loans 11.7 8.0 3.7 46.3 %Other 6.0 5.4 0.6 11.1 %
39.7 49.0 (9.3) (19.0)%Non-Cash Based:
Amortization of discount and deferred financing costs 12.8 17.2 (4.4) (25.6)%$ 52.5 $ 66.2 $ (13.7) (20.7)%
Interest and other income was $2.8 million in fiscal 2015, compared to $6.0 million in fiscal 2014.

67
The following table represents our portion of the income or (loss) of our equity method investees based on our percentage ownership for the fiscal years ended March 31, 2015 and 2014:
March 31, 2015Ownership Year Ended March 31, Increase (Decrease)Percentage 2015 2014 Amount Percent
(Amounts in millions)
EPIX(1) 31.2% $ 48.7 $ 32.3 $ 16.4 50.8%Pop(1) 50.0% (9.6) (2.6) (7.0) 269.2%Other(2) Various 13.4 (5.0) 18.4 n/m
$ 52.5 $ 24.7 $ 27.8 112.6% ______________________n/m - Percentage not meaningful.(1) We license certain of our theatrical releases and other films and television programs to EPIX and Pop. A portion of the
profits of these licenses reflecting our ownership share in the venture is eliminated through an adjustment to the equity interest income (loss) of the venture. These profits are recognized as they are realized by the venture (see Note 5 to our consolidated financial statements).
(2) On April 14, 2014, we sold all of our 34.5% interest in FEARnet, which resulted in a gain on sale of $11.4 million in the fiscal year ended March 31, 2015 included in our other equity method investments income shown above. See Note 5 to our consolidated financial statements.
Loss on Extinguishment of Debt
Loss on extinguishment of debt was $11.7 million for the fiscal year ended March 31, 2015, primarily resulting from the March 2015 early redemption of the Term Loan Due 2020, which carried a variable rate of LIBOR, subject to a 1% floor, plus 4%, in connection with the issuance of new Term Loan Due 2022, which carries a fixed interest rate of 5%. For the fiscal year ended March 31, 2014, loss on extinguishment of debt was $39.6 million, primarily resulting from the 10.25% Senior Notes that were redeemed on August 19, 2013. See Note 7 to our consolidated financial statements.
Income Tax Provision
We had an income tax expense of $31.6 million in fiscal 2015, compared to an expense of $32.9 million in fiscal 2014. Our tax provision for the fiscal years ended March 31, 2015 and March 31, 2014 included certain unusual and discrete tax items (see below). Excluding these items, our tax provision for fiscal 2015 was $31.8 million compared to $59.6 million for fiscal 2014. The decrease in our tax provision in fiscal 2015 as compared to fiscal 2014 reflects the implementation of certain business and financing strategies in and among our operations in the various tax jurisdictions in which we operate. This includes a favorable permanent book-tax difference in our Canadian jurisdiction for certain foreign affiliate dividends. Canadian tax law permits such dividends to be received without being subject to tax.
In fiscal 2015, the income tax provision included the effect at the applicable statutory rate from the impact of the loss on early extinguishment of debt, and other discrete tax items, which contributed a tax benefit of $0.2 million. In fiscal 2014, the income tax provision included a discrete benefit of $12.0 million from the reversal of a valuation allowance related to the Company's net deferred tax assets in the Canadian tax jurisdiction, and the impact of the loss on early extinguishment of debt, which contributed a tax benefit of $14.7 million.
Net Income Attributable to Lions Gate Entertainment Corp. Shareholders
Net income attributable to our shareholders for the fiscal year ended March 31, 2015 was $181.8 million, or basic net income per common share of $1.31 on 139.0 million weighted average common shares outstanding and diluted net income per common share of $1.23 on 151.8 million weighted average common shares outstanding. This compares to net income attributable to our shareholders for the fiscal year ended March 31, 2014 of $152.0 million, or basic net income per common share of $1.11 on 137.5 million weighted average common shares outstanding and diluted net income per common share of $1.04 on 154.4 million weighted average common shares outstanding.

68
Liquidity and Capital Resources
Sources and Uses of Cash
Our liquidity and capital resources have been provided principally through cash generated from operations, corporate debt, and our production loans. Our corporate debt at March 31, 2016 primarily consisted of our senior revolving credit facility, 5.25% Senior Notes, Term Loan Due 2022, and our convertible senior subordinated notes.
Our principal uses of cash in operations include the funding of film and television productions, film rights acquisitions, and the distribution and marketing of films and television programs. We also use cash for debt service (i.e., principal and interest payments) requirements, equity or cost method investments, quarterly cash dividends, the purchase of common shares under our share repurchase program, capital expenditures, and acquisitions of businesses. The Company also has a redeemable noncontrolling interest balance of $90.5 million, which may require the use of cash in the event the holders of the noncontrolling interests put their interests to the Company.
We may from time to time seek to retire or purchase our outstanding debt through cash purchases and/or exchanges for equity securities, in open market purchases, privately negotiated transactions or otherwise. Such repurchases or exchanges, if any, will depend on prevailing market conditions, our liquidity requirements, contractual restrictions and other factors. The amounts involved may be material.
Anticipated Cash Requirements. The nature of our business is such that significant initial expenditures are required to produce, acquire, distribute and market films and television programs, while revenues from these films and television programs are earned over an extended period of time after their completion or acquisition. We believe that cash flow from operations, cash on hand, senior revolving credit facility availability, tax-efficient financing, and available production financing will be adequate to meet known operational cash, quarterly cash dividends and debt service (i.e., principal and interest payments) requirements for the foreseeable future, including the funding of future film and television production, film rights acquisitions and theatrical and video release schedules, future equity or cost method investment funding requirements, and the purchase of common shares under our share repurchase program. We monitor our cash flow liquidity, availability, fixed charge coverage, capital base, film spending and leverage ratios with the long-term goal of maintaining our credit worthiness.
Our current financing strategy is to fund operations and to leverage investment in films and television programs through our cash flow from operations, our senior revolving credit facility, single-purpose production financing, government incentive programs, film funds, and distribution commitments. In addition, we may acquire businesses or assets, including individual films or libraries that are complementary to our business. Any such transaction could be financed through our cash flow from operations, credit facilities, equity or debt financing. If additional financing beyond our existing cash flows from operations and credit facilities cannot fund such transactions, there is no assurance that such financing will be available on terms acceptable to us. We may also dispose of businesses or assets, including individual films or libraries, and use the net proceeds from such dispositions to fund operations or such acquisitions, or to repay debt.
Share Repurchase Plan. On February 2, 2016, our Board of Directors authorized to increase our previously announced share repurchase plan from $300 million to $468 million. To date, approximately $283.2 million of our common shares have been purchased, leaving approximately $184.7 million of authorized potential purchases. The remaining $184.7 million of our common shares may be purchased from time to time at the Company's discretion, including quantity, timing and price thereof, and will be subject to market conditions. Such purchases will be structured as permitted by securities laws and other legal requirements.
Dividends. During fiscal 2016, 2015 and 2014, the Company paid dividends of $47.4 million, $33.4 million, and $6.9 million, respectively, and on March 17, 2016, our Board of Directors declared a quarterly cash dividend of $0.09 per common share, payable on May 27, 2016 to shareholders of record as of March 31, 2016. See Note 13 to our consolidated financial statements for dividends declared during fiscal 2016, 2015 and 2014. The amount of dividends, if any, that we pay to our shareholders is determined by our Board of Directors, at its discretion, and is dependent on a number of factors, including our financial position, results of operations, cash flows, capital requirements and restrictions under our credit agreements, and shall be in compliance with applicable law. We cannot guarantee the amount of dividends paid in the future, if any.

69
Discussion of Operating, Investing, Financing Cash Flows
Cash and cash equivalents decreased by $45.3 million for the fiscal year ended March 31, 2016, increased by $75.5 million for the fiscal year ended March 31, 2015, and decreased by $35.4 million for the fiscal year ended March 31, 2014, before foreign exchange effects on cash. Components of these changes are discussed below in more detail.
Operating Activities. Cash flows provided by (used in) operating activities for the years ended March 31, 2016, 2015 and 2014 were as follows:
Year Ended March 31, Net Change2016 2015 2014 2016 vs. 2015 2015 vs. 2014
(Amounts in thousands)Operating Activities:Operating income (loss) $ (25,030) $ 222,281 $ 259,948 $ (247,311) $ (37,667)Amortization of films and television programs 1,029,077 899,951 921,289 129,126 (21,338)Non-cash share-based compensation 77,906 79,938 60,492 (2,032) 19,446Cash interest (45,695) (39,657) (48,960) (6,038) 9,303Current income tax provision (8,542) (17,693) (17,010) 9,151 (683)Other non-cash charges included in operating activities 16,966 17,164 28,648 (198) (11,484)
Cash flows from operations before changes inoperating assets and liabilities 1,044,682 1,161,984 1,204,407 (117,302) (42,423)
Changes in operating assets and liabilities:Accounts receivable, net (144,910) (13,968) (93,503) (130,942) 79,535Investment in films and television programs (1,066,403) (1,012,294) (948,082) (54,109) (64,212)Other changes in operating assets and liabilities 147,625 (39,213) 89,690 186,838 (128,903)
Changes in operating assets and liabilities (1,063,688) (1,065,475) (951,895) 1,787 (113,580)Net Cash Flows Provided By (Used In) OperatingActivities $ (19,006) $ 96,509 $ 252,512 $ (115,515) $ (156,003)
Fiscal 2016 as Compared to Fiscal 2015. Cash flows used in operating activities for the year ended March 31, 2016 were $19.0 million compared to cash flows provided by operating activities for the year ended March 31, 2015 of $96.5 million. The increase in cash used in operating activities in fiscal 2016 as compared to fiscal 2015 was primarily due to lower operating income (loss), greater increases in accounts receivable and increased investment in films and television programs production activity, including the production of Deepwater Horizon, The Divergent Series: Allegiant, Power Rangers, John Wick: Chapter Two, and Orange Is The New Black - Season 4. These changes were partially offset by higher amortization of films and television programs, and increases in changes in other operating assets and liabilities primarily driven by increases in participations and residuals, deferred revenue and accounts payable and accrued liabilities in fiscal 2016 as compared to fiscal 2015.
Fiscal 2015 as Compared to Fiscal 2014. Cash flows provided by operating activities for the year ended March 31, 2015 were $96.5 million compared to cash flows provided by operating activities for the year ended March 31, 2014 of $252.5 million. The decrease in cash provided by operating activities in fiscal 2015 as compared to fiscal 2014 was primarily due to changes in other operating assets and liabilities primarily driven by decreases in deferred revenue and participations and residuals as compared to fiscal 2014, increases in investment in films and television programs production activity, including the production of The Divergent Series: Insurgent, The Hunger Games: Mockingjay - Part 2, Now You See Me 2, Gods of Egypt, and The Last Witch Hunter, and lower cash flows from operations before changes in operating assets and liabilities offset by smaller increases in accounts receivable as compared to fiscal 2014.

70
Investing Activities. Cash flows used in investing activities for the years ended March 31, 2016, 2015 and 2014 were as follows:
Year Ended March 31,2016 2015 2014
(Amounts in thousands)Investing Activities:Proceeds from the sale of equity method investees $ — $ 14,575 $ 9,000Investment in equity method investees (15,989) (22,730) (17,250)Purchase of Pilgrim Studios, net of cash acquired of $15,816 (126,892) — —Purchases of property and equipment (18,433) (17,013) (8,799)Other investing activities (750) (30,000) 8,444Net Cash Flows Used In Investing Activities $ (162,064) $ (55,168) $ (8,605)
Fiscal 2016 as Compared to Fiscal 2015. Cash used in investing activities of $162.1 million for the year ended March 31, 2016 compared to cash used in investing activities of $55.2 million for the year ended March 31, 2015, as reflected above. The change was primarily due to cash used for the purchase of Pilgrim Studios of $126.9 million, net of cash acquired in fiscal 2016. In addition, fiscal 2015 included proceeds from the sale of equity method investees, due to the sale of our interest in FEARnet, with no comparable proceeds in fiscal 2016. These were partially offset by lower cash used in "other investing activities" in fiscal 2016 as compared to fiscal 2015, primarily driven by a cash investment in Telltale Games of $28.0 million along with a $2.0 million investment in Next Games in fiscal 2015, and lower investments in equity method investees in fiscal 2016 as compared to fiscal 2015, primarily related to investments in Pop ($8.8 million in fiscal 2016 compared to $15.0 million in fiscal 2015) (see Note 5 to our consolidated financial statements).
Fiscal 2015 as Compared to Fiscal 2014. Cash used in investing activities of $55.2 million for the year ended March 31, 2015 compared to cash used in investing activities of $8.6 million for the year ended March 31, 2014, as reflected above. The most significant change from fiscal 2014 was from "other investing activities", which in fiscal 2015 included a cash investment in Telltale Games of $28.0 million along with a $2.0 million investment in Next Games, and in fiscal 2014 included distributions received from EPIX in excess of earnings of $4.2 million and payments against loans receivable. In fiscal 2015, purchases of property and equipment increased primarily related to leasehold improvements of the Company's headquarters and computer equipment and software. In addition, investments in equity method investees increased in fiscal 2015 compared to fiscal 2014. These increases in cash used in investing activities were offset by higher proceeds from the sale of equity method investees, which in fiscal 2015 included the sale of our interest in FEARnet (see Note 5 to our consolidated financial statements), compared to the sale of our interest in TVGuide.com in fiscal 2014.

71
Financing Activities. Cash flows provided by (used in) financing activities for the years ended March 31, 2016, 2015 and 2014 were as follows:
Year Ended March 31,2016 2015 2014
(Amounts in thousands)Senior revolving credit facility - borrowings $ 605,500 $ 778,500 $ 872,220Senior revolving credit facility - repayments (444,500) (876,119) (1,113,075)
Net borrowings under (repayments of) senior revolving credit facility 161,000 (97,619) (240,855)
Term Loans and 5.25% Senior Notes - borrowings, net of deferred financing costs of$4,315 and $6,860 for the years ended March 31, 2015 and 2014, respectively 24,036 370,685 440,640Term Loans - repayments — (229,500) —10.25% Senior Notes - repurchases and redemptions — — (470,584)Convertible senior subordinated notes - borrowings — — 60,000Convertible senior subordinated notes - repurchases (5) (16) —
Net proceeds from (repayments of) corporate debt 185,031 43,550 (210,799)
Production loans - borrowings 572,572 631,709 532,416Production loans - repayments (483,145) (449,648) (517,874)Pennsylvania Regional Center credit facility - repayments — — (65,000)
Net proceeds from (repayments of) production loans 89,427 182,061 (50,458)
Repurchase of common shares (73,180) (144,840) —Other financing activities (65,555) (46,576) (18,005)Net Cash Flows Provided By (Used In) Financing Activities $ 135,723 $ 34,195 $ (279,262)
Fiscal 2016. Cash flows provided by financing activities of $135.7 million for the year ended March 31, 2016 increased from $34.2 million for the year ended March 31, 2015. Cash flows provided by financing activities for fiscal 2016 primarily reflects net borrowings under our senior revolving credit facility of $161.0 million, production loan borrowings in order to fund productions and production loan repayments, and net proceeds of $24.0 million from additional borrowings under the Term Loan Due 2022, offset by cash used for share repurchases and other financing activities which includes dividend payments of $47.4 million and tax withholding of $24.2 million required on equity awards offset by the proceeds from the exercise of stock options.
Fiscal 2015. Cash flows provided by financing activities of $34.2 million for the year ended March 31, 2015 increased from cash used in financing activities of $279.3 million for the year ended March 31, 2014. Cash flows provided by financing activities for fiscal 2015 primarily reflects net proceeds of $370.7 million from the issuance of our Term Loan Due 2022 in connection with the redemption of the Term Loan Due 2020 for $229.5 million (see discussion under Corporate Debt Transactions below), and net repayments under our line of credit of $97.6 million. Cash flows provided by financing activities in fiscal 2015 also included production loan borrowings in order to fund productions and production loan repayments, offset by cash used for share repurchases and other financing activities which includes dividend payments of $33.4 million and tax withholding of $20.1 million required on equity awards offset by the exercise of stock options.
Fiscal 2014. Cash flows used in financing activities of $279.3 million for the year ended March 31, 2014 primarily reflects net repayments of our senior revolving credit facility of $240.9 million, and net proceeds of $440.6 million from the issuance of our Term Loan Due 2020 and 5.25% Senior Notes, which were used together with cash on hand and borrowings under our senior revolving credit facility to fund the $470.6 million repurchase and redemption of our 10.25% Senior Notes (see discussion under Corporate Debt Transactions below). Cash flows used in financing activities for fiscal 2014 also reflects net proceeds of $60.0 million from the issuance of our April 2013 1.25% Notes, net borrowings under production loans of $14.5 million, and the $65.0 million repayment of our Pennsylvania Regional Center credit facility.

72
Corporate Debt
See Note 7 to our consolidated financial statements for a discussion of our corporate debt. The principal amounts outstanding under our corporate debt as of March 31, 2016 and 2015 were as follows:
Maturity Date
ConversionPrice Per
Share as ofMarch 31,
2016
Principal Amounts OutstandingMarch 31, March 31,
2016 2015(Amounts in thousands)
Senior revolving credit facility(1) September 2017 N/A $ 161,000 $ —5.25% Senior Notes(2) August 2018 N/A 225,000 225,000Term Loan Due 2022(3) March 2022 N/A 400,000 375,000Principal amounts of convertible senior subordinated notes
April 2009 3.625% Notes N/A N/A — 16,167January 2012 4.00% Notes January 2017 $10.26 41,850 41,850April 2013 1.25% Notes April 2018 $29.32 60,000 60,000
$ 887,850 $ 718,017
______________________(1) Senior Revolving Credit Facility: The senior revolving credit facility provides for borrowings up to $800.0 million,
limited by a borrowing base and also reduced by outstanding letters of credit, if any. At March 31, 2016, there was $639.0 million available (March 31, 2015 — $800.0 million). Interest is payable at an alternative base rate, as defined, plus 1.5% or LIBOR plus 2.5% as designated by us (effective interest rate of approximately 2.94% at March 31, 2016; 2.68% at March 31, 2015). We are required to pay a quarterly commitment fee of 0.375% to 0.5% per year on our unused capacity for the period. Obligations are secured by collateral (as defined in the credit agreement) granted by us and certain of our subsidiaries, as well as a pledge of equity interests in certain of our subsidiaries. The senior revolving credit facility contains a number of covenants, and as of March 31, 2016, we were in compliance with all applicable covenants.
(2) 5.25% Senior Notes: The 5.25% Senior Notes contain a number of certain restrictions and covenants, and as of March 31, 2016, we were in compliance with all applicable covenants. Interest is payable semi-annually on February 1 and August 1 of each year at a rate of 5.25% per year.
(3) Term Loan Due 2022: The Term Loan Due 2022 contains a number of certain restrictions and covenants, and as of March 31, 2016, we were in compliance with all applicable covenants. Interest is payable on the last business day of each April, July, October and January at a rate of 5.00% per year.
Corporate Debt Transactions
Fiscal 2016
Amendment of Term Loan Due 2022. In May 2015, we amended the credit agreement governing our Term Loan Due 2022, and pursuant to the amended credit agreement, borrowed an additional aggregate amount of $25.0 million.
Fiscal 2015
Issuance of Term Loan Due 2022 and Redemption of Term Loan Due 2020. On March 17, 2015, we entered into a second lien credit and guarantee agreement (the "Credit Agreement") and borrowed a term loan of $375 million (the "Term Loan Due 2022"). Contemporaneously with the issuance of the Term Loan Due 2022 (which carries a fixed interest rate of 5.00%), we used a portion of the proceeds to redeem our Term Loan Due 2020 (see below for definition) (which carried a variable interest rate of LIBOR, subject to a 1.00% floor, plus 4.00%). In conjunction with the early redemption of the Term Loan Due 2020, we paid a call premium pursuant to the terms of the agreement governing the Term Loan Due 2020 of $4.5 million.
Fiscal 2014
Issuance of 5.25% Senior Notes, Term Loan Due 2020 and Redemption of 10.25% Senior Notes. On July 19, 2013, we issued $225.0 million aggregate principal amount of 5.25% Senior Secured Second-Priority Notes (the "5.25% Senior Notes"), and entered into a seven-year $225.0 million term loan agreement (the "Term Loan Due 2020"). Contemporaneously with these issuances, we called for early redemption of the $432.0 million remaining outstanding principal amount of the then outstanding 10.25% Senior Secured Second-Priority Notes (the "10.25% Senior Notes").

73
The proceeds from the issuance of the 5.25% Senior Notes and Term Loan Due 2020, whose principal amount collectively totaled $450.0 million, together with cash on hand and borrowings under our senior revolving credit facility, were used to fund the discharge of the 10.25% Senior Notes. In conjunction with the early redemption of the 10.25% Senior Notes, we paid $34.3 million, representing the present value of interest through the first call date of November 1, 2013 and related call premium pursuant to the terms of the indenture governing the 10.25% Senior Notes.
Other Repurchases of 10.25% Senior Notes. In June 2013, Lions Gate Entertainment, Inc. ("LGEI"), our wholly-owned subsidiary, paid $4.3 million to repurchase $4.0 million of aggregate principal amount (carrying value - $4.0 million) of the 10.25% Senior Notes. We recorded a loss on extinguishment during the year ended March 31, 2014 of $0.5 million, which included $0.2 million of deferred financing costs written off.
Convertible Senior Subordinated Notes Conversions. During the years ended March 31, 2016, 2015 and 2014, there were various conversions of our convertible senior subordinated notes. The table below summarizes the total principal amount converted, common shares issued upon conversion and weighted average conversion price per share (see Note 7 to our consolidated financial statements for detailed information by debt instrument):
Year Ended March 31,
2016 2015 2014(Amounts in thousands, except share amounts)
Principal amount converted $ 16,162 $ 24,152 27,672Common shares issued upon conversion 1,983,058 2,945,730 3,263,892Weighted average conversion price per share $ 8.15 $ 8.20 $ 8.48
Production Loans
The amounts outstanding under our production loans as of March 31, 2016 and 2015 were as follows:
March 31, March 31,2016 2015
(Amounts in thousands)Production loans(1) $ 690,371 $ 600,944
______________________(1) Represents individual loans for the production of film and television programs that we produce. Production loans have
contractual repayment dates either at or near the expected film or television program completion date, with the exception of certain loans containing repayment dates on a longer term basis, and incur interest at rates ranging from 3.37% to 3.87%.

74
Table of Debt and Contractual Commitments
The following table sets forth our future annual repayment of debt, and our contractual commitments as of March 31, 2016:
Year Ended March 31,
2017 2018 2019 2020 2021 Thereafter Total(Amounts in thousands)
Future annual repayment of debtrecorded as of March 31, 2016 (on-balance sheet arrangements)
Senior revolving credit facility $ — $ 161,000 $ — $ — $ — $ — $ 161,0005.25% Senior Notes — — 225,000 — — — 225,000Term Loan Due 2022 — — — — — 400,000 400,000Film obligations and production loans(1) 663,174 51,295 1,000 — — — 715,469Principal amounts of convertible seniorsubordinated notes 41,850 — 60,000 — — — 101,850
705,024 212,295 286,000 — — 400,000 1,603,319Contractual commitments by expectedrepayment date (off-balance sheetarrangements)
Film obligation and production loan commitments(2) 290,411 221,842 10,385 — — — 522,638Interest payments(3) 34,237 32,563 26,281 20,000 20,000 22,444 155,525Operating lease commitments 14,532 14,183 14,579 14,975 14,912 34,235 107,416Other contractual obligations 71,043 43,212 19,718 6,927 3,650 6,395 150,945
410,223 311,800 70,963 41,902 38,562 63,074 936,524Total future commitments under contractual obligations(4) $1,115,247 $ 524,095 $ 356,963 $ 41,902 $ 38,562 $ 463,074 $2,539,843
________________________________
(1) Film obligations include minimum guarantees and theatrical marketing obligations. Production loans represent loans for the production of film and television programs that we produce. Repayment dates are based on anticipated delivery or release date of the related film or contractual due dates of the obligation.
(2) Film obligation commitments include distribution and marketing commitments and minimum guarantee commitments. Distribution and marketing commitments represent contractual commitments for future expenditures associated with distribution and marketing of films which we will distribute. The payment dates of these amounts are primarily based on the anticipated release date of the film. Minimum guarantee commitments represent contractual commitments related to the purchase of film rights for pictures to be delivered in the future. Production loan commitments represent amounts committed for future film production and development to be funded through production financing and recorded as a production loan liability when incurred. Future payments under these commitments are based on anticipated delivery or release dates of the related film or contractual due dates of the commitment. The amounts include future interest payments associated with the commitment.
(3) Includes cash interest payments on our corporate debt, excluding the interest payments on the senior revolving credit facility as future amounts are not fixed or determinable due to fluctuating balances and interest rates.
(4) Not included in the amounts above are $90.5 million of redeemable noncontrolling interest, as future amounts and timing are subject to a number of uncertainties such that we are unable to make sufficiently reliable estimations of future payments (see Note 12 to our consolidated financial statements).
Theatrical Slate Participation
On March 10, 2015, we entered into a theatrical slate participation arrangement with TIK Films (U.S.), Inc. and TIK Films (Hong Kong) Limited (collectively, "TIK Films"), both wholly owned subsidiaries of Hunan TV & Broadcast Intermediary Co. Ltd. Under the arrangement, TIK Films, in general and subject to certain limitations including per picture and annual caps, will contribute a minority share of 25% of our production or acquisition costs of “qualifying” theatrical feature films, released during the three-year period ending January 23, 2018, and participate in a pro-rata portion of the pictures’ net profits or losses similar to a co-production arrangement based on the portion of costs funded. The arrangement excludes among others, any theatrical feature film incorporating any elements from the Twilight, Hunger Games, or Divergent franchises. The percentage of the contribution could vary on certain pictures.

75
Amounts provided from TIK Films are reflected as a participation liability in our consolidated balance sheet and amounted to $61.3 million at March 31, 2016 (March 31, 2015 - $13.6 million). The difference between the ultimate participation expected to be paid to TIK Films and the amount provided by TIK Films is amortized as a charge to or a reduction of participation expense under the individual-film-forecast method.
Filmed Entertainment Backlog
Backlog represents the amount of future revenue not yet recorded from contracts for the licensing of films and television product for television exhibition and in international markets. Backlog at March 31, 2016 and March 31, 2015 was $1.5 billion and $1.1 billion, respectively.
Off-Balance Sheet Arrangements
We do not have any transactions, arrangements and other relationships with unconsolidated entities that will affect our liquidity or capital resources. We have no special purpose entities that provided off-balance sheet financing, liquidity or market or credit risk support, nor do we engage in leasing, hedging or research and development services, that could expose us to liability that is not reflected on the face of our consolidated financial statements. Our commitments to fund operating leases, minimum guarantees, production loans, equity method investment funding requirements and all other contractual commitments not reflected on the face of our consolidated financial statements are presented in the table above.
ITEM 7A. QUANTITATIVE AND QUALITATIVE DISCLOSURES ABOUT MARKET RISK.
Currency and Interest Rate Risk Management
Market risks relating to our operations result primarily from changes in interest rates and changes in foreign currency exchange rates. Our exposure to interest rate risk results from the financial debt instruments that arise from transactions entered into during the normal course of business. As part of our overall risk management program, we evaluate and manage our exposure to changes in interest rates and currency exchange risks on an ongoing basis. Hedges and derivative financial instruments will be used in the future in order to manage our interest rate and currency exposure. We have no intention of entering into financial derivative contracts, other than to hedge a specific financial risk.
Currency Rate Risk. We enter into forward foreign exchange contracts to hedge our foreign currency exposures on future production expenses denominated in various foreign currencies. As of March 31, 2016, we had the following outstanding forward foreign exchange contracts (all outstanding contracts have maturities of less than 24 months from March 31, 2016):
March 31, 2016
Foreign Currency
ForeignCurrencyAmount
US DollarAmount
Weighted AverageExchange Rate Per
$1 USD
(Amounts in
millions)(Amounts in
millions)
British Pound Sterling £17.5 in exchange for $24.7 £0.71Australian Dollar A$56.8 in exchange for $50.6 A$1.12Canadian Dollar C$4.4 in exchange for $2.6 C$1.69
Changes in the fair value representing a net unrealized fair value loss on foreign exchange contracts that qualified as effective hedge contracts outstanding during the year ended March 31, 2016 were losses, net of tax, of $0.2 million (2015 - gains, net of tax, of $2.8 million; 2014 - gains, net of tax, of $0.8 million) and are included in accumulated other comprehensive income (loss), a separate component of shareholders’ equity. Changes in the fair value representing a net unrealized fair value gain on foreign exchange contracts that did not qualify as effective hedge contracts outstanding were $1.3 million during the year ended March 31, 2016 (2015 - $0.4 million and 2014 - nil), and were included in direct operating expenses in the consolidated statement of income. These contracts are entered into with major financial institutions as counterparties. We are exposed to credit loss in the event of nonperformance by the counterparty, which is limited to the cost of replacing the contracts, at current market rates. We do not require collateral or other security to support these contracts.
Interest Rate Risk. Certain of our borrowings, primarily borrowings under our amended and restated senior revolving credit facility and certain production loans, are, and are expected to continue to be, at variable rates of interest and expose us to interest rate risk. If interest rates increase, our debt service obligations on the variable rate indebtedness would increase even though the amount borrowed remained the same, and our net income would decrease. The applicable margin with respect to loans under the amended and restated senior revolving credit facility is a percentage per annum equal to 2.50% plus an adjusted

76
rate based on LIBOR. Assuming the amended and restated senior revolving credit facility is drawn up to its maximum borrowing capacity of $800 million, based on the applicable LIBOR in effect as of March 31, 2016, each quarter point change in interest rates would result in a $2.0 million change in annual interest expense on the amended and restated senior revolving credit facility.
The variable interest production loans incur interest at rates ranging from approximately 3.37% to 3.87% and applicable margins ranging from 2.25% over the one, two, or three-month LIBOR to 3.0% over the one, three or six-month LIBOR. A quarter point increase of the interest rates on the outstanding principal amount of our variable rate production loans would result in $1.7 million in additional costs capitalized to the respective film or television asset.
At March 31, 2016, our 5.25% Senior Notes, Term Loan Due 2022 and convertible senior subordinated notes had an aggregate outstanding carrying value of $725.1 million, and an estimated fair value of $725.7 million. A 1% increase or decrease in the level of interest rates would increase or decrease the fair value of the 5.25% Senior Notes, Term Loan Due 2022 and convertible senior subordinated notes by approximately $26.2 million and $27.4 million, respectively.
The following table presents our financial instruments that are sensitive to changes in interest rates. The table also presents the cash flows of the principal amounts of the financial instruments with the related weighted-average interest rates by expected maturity dates and the fair value of the instrument as of March 31, 2016:
Year Ended March 31, Fair Value
2017 2018 2019 2020 2021 Thereafter TotalMarch 31,
2016
Variable Rates:Senior Revolving Credit Facility(1) $ — $ 161,000 $ — $ — $ — $ — $ 161,000 $ 161,000
Average Interest Rate — 2.94% — — — —Production loans(2) 641,076 49,295 — — — — 690,371 690,371
Average Interest Rate 3.56% 3.62% — — — —Fixed Rates:
5.25% Senior Notes(3) — — 225,000 — — — 225,000 229,500Average Interest Rate — — 5.25% — — —
Term Loan Due 2022(4) — — — — — 400,000 400,000 400,500Average Interest Rate — — — — — 5.00%
Principal Amounts of Convertible Senior Subordinated Notes(5):
January 2012 4.00%Notes 41,850 — — — — — 41,850 41,477
Average InterestRate 4.00% — — — — —
April 2013 1.25%Notes — — 60,000 — — — 60,000 54,188
Average InterestRate — — 1.25% — — —
$ 682,926 $ 210,295 $ 285,000 $ — $ — $ 400,000 $ 1,578,221 $ 1,577,036
____________________(1) Amended and restated senior revolving credit facility, which expires September 27, 2017 and bears interest of 2.50% over
the Adjusted LIBOR rate. (2) Represents amounts owed to film production entities on anticipated delivery date or release date of the titles or the
contractual due dates of the obligation, that incur interest at rates ranging from approximately 3.37% to 3.87%.(3) Senior secured second-priority notes with a fixed interest rate equal to 5.25%.(4) Term loan maturing on March 17, 2022 with a fixed interest rate equal to 5.00%.

77
ITEM 8. FINANCIAL STATEMENTS AND SUPPLEMENTARY DATA.
The Auditors’ Report and our Consolidated Financial Statements and Notes thereto appear in a separate section of this report (beginning on page F-1 following Part IV). The index to our Consolidated Financial Statements is included in Item 15.
ITEM 9. CHANGES IN AND DISAGREEMENTS WITH ACCOUNTANTS ON ACCOUNTING AND FINANCIAL DISCLOSURE.
Not applicable.
ITEM 9A. CONTROLS AND PROCEDURES.
Disclosure Controls and Procedures
We maintain disclosure controls and procedures that are designed to ensure that information required to be disclosed in our reports under the Securities Exchange Act of 1934, as amended (the “Exchange Act”), is recorded, processed, summarized and reported within the time periods specified in the SEC's rules and forms, and that such information is accumulated and communicated to management, including our Chief Executive Officer and Chief Financial Officer, as appropriate, to allow timely decisions regarding required disclosure. We periodically review the design and effectiveness of our disclosure controls and internal control over financial reporting. We make modifications to improve the design and effectiveness of our disclosure controls and internal control structure, and may take other corrective action, if our reviews identify a need for such modifications or actions.
As of March 31, 2016, the end of the period covered by this report, the Company's management had carried out an evaluation under the supervision and with the participation of our Chief Executive Officer and Chief Financial Officer of the effectiveness of our disclosure controls and procedures, as defined in Exchange Act Rules 13a-15(e). Based on that evaluation, our Chief Executive Officer and Chief Financial Officer have concluded that such controls and procedures were effective as of March 31, 2016.
Internal Control Over Financial Reporting
Management's Report on Internal Control over Financial Reporting
Our management is responsible for establishing and maintaining adequate internal control over financial reporting for the Company. Our internal control over financial reporting is a process designed to provide reasonable assurance regarding the reliability of our financial reporting and the preparation of financial statements for external purposes in accordance with U.S. generally accepted accounting principles. Internal control over financial reporting includes policies and procedures that:
• pertain to the maintenance of records that, in reasonable detail, accurately and fairly reflect the transactions and dispositions of the assets of the Company;
• provide reasonable assurance that (a) transactions are recorded as necessary to permit preparation of financial statements in accordance with U.S. generally accepted accounting principles, and (b) that our receipts and expenditures are being recorded and made only in accordance with authorizations of management and directors of the Company; and
• provide reasonable assurance regarding prevention or timely detection of unauthorized acquisition, use or disposition of our assets that could have a materially effect on the financial statements.
A control system, no matter how well designed and operated, can provide only reasonable, not absolute, assurance that the objectives of the control system are met. Because of the inherent limitations, internal controls over financial reporting may not prevent or detect misstatements. Projections of any evaluation of the effectiveness of internal control over financial reporting to future periods are subject to the risks that controls may become inadequate because of changes in conditions, or that the degree of compliance with the policies or procedures may deteriorate.
Our management has made an assessment of the effectiveness of our internal control over financial reporting as of March 31, 2016. Management based its assessment on criteria established in Internal Control-Integrated Framework issued by the Committee

78
of Sponsoring Organizations of the Treadway Commission (2013 Framework). On November 12, 2015, we purchased 62.5% of the membership interests in Pilgrim Media Group, LLC ("Pilgrim Studios") and, as a result, we have begun integrating the processes, systems and controls relating to Pilgrim Studios into our existing system of internal control over financial reporting in accordance with our integration plans. Our evaluation and conclusion on the effectiveness of internal control over financial reporting as of March 31, 2016 did not include the internal controls of Pilgrim Studios because of the timing of this acquisition. As of March 31, 2016, Pilgrim Studios represented $321.2 million of total assets, $52.5 million of revenues and $7.2 million of net loss for the year then ended.
Based on this assessment, our management has concluded that, as of March 31, 2016, the Company maintained effective internal control over financial reporting. The effectiveness of the Company's internal control over financial reporting has been audited by the Company's independent auditor, Ernst & Young LLP, a registered public accounting firm. Their report is included below.
Changes in Internal Control over Financial Reporting
We acquired Pilgrim Studios on November 12, 2015, and the addition of Pilgrim Studios' financial systems and processes represent a change in our internal controls over financial reporting. There were no other changes in internal control over financial reporting during the fiscal fourth quarter ended March 31, 2016, that have materially affected, or are reasonably likely to materially affect, our internal control over financial reporting.

79
REPORT OF INDEPENDENT REGISTERED PUBLIC ACCOUNTING FIRM
The Board of Directors and Shareholders of Lions Gate Entertainment Corp.
We have audited Lions Gate Entertainment Corp.’s internal control over financial reporting as of March 31, 2016, based on criteria established in Internal Control - Integrated Framework issued by the Committee of Sponsoring Organizations of the Treadway Commission (2013 framework) (the COSO criteria). Lions Gate Entertainment Corp.’s management is responsible for maintaining effective internal control over financial reporting, and for its assessment of the effectiveness of internal control over financial reporting included in the accompanying Management’s Report on Internal Control over Financial Reporting. Our responsibility is to express an opinion on the company’s internal control over financial reporting based on our audit.
We conducted our audit in accordance with the standards of the Public Company Accounting Oversight Board (United States). Those standards require that we plan and perform the audit to obtain reasonable assurance about whether effective internal control over financial reporting was maintained in all material respects. Our audit included obtaining an understanding of internal control over financial reporting, assessing the risk that a material weakness exists, testing and evaluating the design and operating effectiveness of internal control based on the assessed risk, and performing such other procedures as we considered necessary in the circumstances. We believe that our audit provides a reasonable basis for our opinion.
A company’s internal control over financial reporting is a process designed to provide reasonable assurance regarding the reliability of financial reporting and the preparation of financial statements for external purposes in accordance with generally accepted accounting principles. A company’s internal control over financial reporting includes those policies and procedures that (1) pertain to the maintenance of records that, in reasonable detail, accurately and fairly reflect the transactions and dispositions of the assets of the company; (2) provide reasonable assurance that transactions are recorded as necessary to permit preparation of financial statements in accordance with generally accepted accounting principles, and that receipts and expenditures of the company are being made only in accordance with authorizations of management and directors of the company; and (3) provide reasonable assurance regarding prevention or timely detection of unauthorized acquisition, use, or disposition of the company’s assets that could have a material effect on the financial statements.
Because of its inherent limitations, internal control over financial reporting may not prevent or detect misstatements. Also, projections of any evaluation of effectiveness to future periods are subject to the risk that controls may become inadequate because of changes in conditions, or that the degree of compliance with the policies or procedures may deteriorate.
As indicated in the accompanying Management's Report on Internal Control over Financial Reporting, management's assessment of and conclusion of the effectiveness of internal control over financial reporting did not include the internal controls of Pilgrim Studios, which is included in the fiscal 2016 consolidated financial statements of Lions Gate Entertainment Corp. and constituted $321.2 million of total assets as of March 31, 2016, and $52.5 million of revenues and $7.2 million of net loss for the year then ended. Our audit of internal control over financial reporting of Lions Gate Entertainment Corp. also did not include an evaluation of the internal control over financial reporting of Pilgrim Studios.
In our opinion, Lions Gate Entertainment Corp. maintained, in all material respects, effective internal control over financial reporting as of March 31, 2016, based on the COSO criteria.
We also have audited, in accordance with the standards of the Public Company Accounting Oversight Board (United States), the consolidated balance sheets of Lions Gate Entertainment Corp. as of March 31, 2016 and 2015, and the related consolidated statements of income, comprehensive income, shareholders’ equity, and cash flows for each of the three years in the period ended March 31, 2016 of Lions Gate Entertainment Corp. and our report dated May 25, 2016 expressed an unqualified opinion thereon.
/s/ Ernst & Young LLP
Los Angeles, CaliforniaMay 25, 2016

80
ITEM 9B. OTHER INFORMATION.
None.
PART III
ITEM 10. DIRECTORS, EXECUTIVE OFFICERS AND CORPORATE GOVERNANCE.
The information required by this Item is incorporated by reference to our Proxy Statement for our 2016 Annual General Meeting of Shareholders to be filed with the SEC within 120 days after the end of the fiscal year ended March 31, 2016.
ITEM 11. EXECUTIVE COMPENSATION.
The information required by this Item is incorporated by reference to our Proxy Statement for our 2016 Annual General Meeting of Shareholders to be filed with the SEC within 120 days after the end of the fiscal year ended March 31, 2016.
ITEM 12. SECURITY OWNERSHIP OF CERTAIN BENEFICIAL OWNERS AND MANAGEMENT AND RELATED SHAREHOLDER MATTERS.
The information required by this Item is incorporated by reference to our Proxy Statement for our 2016 Annual General Meeting of Shareholders to be filed with the SEC within 120 days after the end of the fiscal year ended March 31, 2016.
ITEM 13. CERTAIN RELATIONSHIPS AND RELATED TRANSACTIONS, AND DIRECTOR INDEPENDENCE.
The information required by this Item is incorporated by reference to our Proxy Statement for our 2016 Annual General Meeting of Shareholders to be filed with the SEC within 120 days after the end of the fiscal year ended March 31, 2016.
ITEM 14. PRINCIPAL ACCOUNTING FEES AND SERVICES.
The information required by this Item is incorporated by reference to our Proxy Statement for our 2016 Annual General Meeting of Shareholders to be filed with the SEC within 120 days after the end of the fiscal year ended March 31, 2016.
PART IV
ITEM 15. EXHIBITS, FINANCIAL STATEMENT SCHEDULES.
(a) The following documents are filed as part of this report:
(1) Financial Statements
The financial statements listed on the accompanying Index to Financial Statements are filed as part of this report at pages F-1 to F-57.
(2) Financial Statement Schedules
Schedule II. Valuation and Qualifying Accounts

81
All other Schedules are omitted since the required information is not present or is not present in amounts sufficient to require submission of the schedule.
(3) and (b) Exhibits
The exhibits listed on the accompanying Index to Exhibits are filed as part of this report.

82
Item 15(a).
Schedule II. Valuation and Qualifying Accounts
Lions Gate Entertainment Corp.
March 31, 2016
(In Thousands)
Additions
Description
Balance atBeginning of
PeriodCharged to Costsand Expenses(1)
Charged to Other
Accounts Deductions Balance at
End of Period
Year Ended March 31, 2016: Reserves:
Returns and allowances $ 64,362 $ 136,790 $ — $ (149,343) (2) $ 51,809Provision for doubtful accounts $ 4,120 $ 1,926 $ — $ (32) (3) $ 6,014Deferred tax valuation allowance $ 9,284 $ — $ 819 $ — $ 10,103
Year Ended March 31, 2015: Reserves:
Returns and allowances $ 106,680 $ 162,303 $ — $ (204,621) (2) $ 64,362Provision for doubtful accounts $ 4,876 $ (454) $ — $ (302) (3) $ 4,120Deferred tax valuation allowance $ 8,925 $ — $ 359 $ — $ 9,284
Year Ended March 31, 2014: Reserves:
Returns and allowances $ 103,418 $ 185,373 $ — $ (182,111) (2) $ 106,680Provision for doubtful accounts $ 4,494 $ 421 $ — $ (39) (3) $ 4,876Deferred tax valuation allowance $ 25,836 $ — $ — $ (16,911) (4) $ 8,925
____________________________(1) Charges for returns and allowances are charges against revenue.(2) Actual returns and fluctuations in foreign currency exchange rates. (3) Uncollectible accounts written off and fluctuations in foreign currency exchange rates. (4) Release of a portion of the valuation allowance previously held against the Company's deferred tax assets.

83
Item 15(b).
INDEX TO EXHIBITS
Exhibit Number Description of Documents3.1(1) Articles3.2(2) Notice of Articles3.3(3) Vertical Short Form Amalgamation Application3.4(3) Certificate of Amalgamation10.4(4)* Lions Gate Entertainment Corp. 2012 Performance Incentive Plan10.7*x Director Compensation Summary10.62(5) Form of Director Indemnity Agreement10.67(6) Letter Agreement between Mark H. Rachesky and Lions Gate Entertainment Corp. dated July 9, 200910.68(7) Registration Rights Agreement, dated as of October 22, 2009, by and among Lions Gate Entertainment Corp. and the
persons listed on the signature pages thereto.10.80(8) Refinancing Exchange Agreement, dated July 20, 2010, by Lions Gate Entertainment Inc. and Kornitzer Capital
Management, Inc.10.83(9) Membership Interest Purchase Agreement, dated as of January 13, 2012, among Lions Gate Entertainment Corp.,
LGAC 1, LLC, LGAC 3, LLC, Summit Entertainment, LLC, S Representative, LLC and the several sellers partythereto
10.84(10) Purchase Agreement, dated January 11, 2012 by and among Lions Gate Entertainment Inc., Lions Gate EntertainmentCorp. and Kornitzer Capital Management, Inc.
10.91(11)* Third Amended and Restated Credit, Security, Guaranty and Pledge Agreement dated September 27, 2012 withJPMorgan Chase Bank, N.A., as administrative agent and issuing bank, J.P. Morgan Securities LLC, Barclays BankPLC, Merrill Lynch, Pierce, Fenner & Smith Incorporated and Royal Bank of Canada, as co-syndication agents, jointbookrunners and joint lead arrangers, Wells Fargo Bank, National Association, as co-syndication agent, SunTrust Bankand Union Bank, N.A., as co-documentation agents, and the other guarantors and lenders that are parties thereto
10.92(12)* Employment Agreement dated October 30, 2012 between the Company and Michael Burns
10.95(13) Purchase Agreement, dated April 15, 2013 by and among Lions Gate Entertainment Inc., Lions Gate EntertainmentCorp. and Kornitzer Capital Management, Inc.
10.97(14)* Executive Annual Bonus Program10.98(15)* Employment Agreement, dated May 30, 2013, between the Company and Jon Feltheimer10.101(16)* Employment Agreement between the Company and James W. Barge dated as of September 16, 201310.102(17) Amendment No. 1 to the Third Amended and Restated Credit, Security, Guaranty and Pledge Agreement, dated
December 20, 201310.105(18) Stock Exchange Agreement, dated as of February 10, 2015, by and between Lions Gate Entertainment Corp., LG
Leopard Canada LP and the stockholders listed on Schedule 1 thereto.10.106(19) Second Lien Credit and Guarantee Agreement, dated March 17, 2015, among Lions Gate Entertainment Corp., as
borrower, the guarantors referred to therein, the lenders referred to therein and JPMorgan Chase Bank, N.A., asadministrative agent.
10.108(20)* Employment Agreement between Lions Gate Films, Inc. and Steve Beeks dated May 6, 2015
10.109(21) Investor Rights Agreement, dated as of November 10, 2015, by and among Lions Gate Entertainment Corp., LibertyGlobal plc, Discovery Communications, Inc., Liberty Global Incorporated Limited, Discovery Lightning InvestmentsLtd. and affiliates of MHR Fund Management, LLC
10.110(22) Voting and Standstill Agreement, dated as of November 10, 2015, by and among Lions Gate Entertainment Corp.,Liberty Global plc, Discovery Communications, Inc., Liberty Global Incorporated Limited, Discovery LightningInvestments Ltd., Dr. John C. Malone and affiliates of MHR Fund Management, LLC
10.111(23) Registration Rights Agreement, dated as of November 10, 2015, by and among Lions Gate Entertainment Corp. andLiberty Global Incorporated Limited
10.112(24) Registration Rights Agreement, dated as of November 10, 2015, by and among Lions Gate Entertainment Corp. andDiscovery Lightning Investments Ltd.
10.113(25) Amendment No. 2 to the Third Amended and Restated Credit, Security, Guaranty and Pledge Agreement, datedNovember 12, 2015
10.114(26) Underwriting Agreement, dated November 12, 2015, by and among Lions Gate Entertainment Corp., J.P. MorganSecurities LLC, Liberty Global Incorporated Limited, Discovery Lightning Investments Ltd. And Bank of America,N.A.
10.115(27)* Employment Agreement between Lions Gate Films, Inc. and Brian Goldsmith dated November 13, 2015

84
Exhibit Number Description of Documents10.116(28)* Employment Agreement between Lions Gate Entertainment, Inc. and Wayne Levin dated November 13, 201510.117(29) Amendment No. 1, dated as of February 3, 2016, to Registration Rights Agreement, dated as of October 22, 2009, by and
among Lions Gate Entertainment Corp. and the persons listed on the signature pages thereto.21.1x Subsidiaries of the Company23.1x Consent of Ernst & Young LLP, Independent Registered Public Accounting Firm (with respect to financial statements
of Lions Gate Entertainment Corp.)23.2x Consent of Ernst & Young LLP, Independent Auditors (with respect to financial statements of Pop Media Group, LLC)23.3x Consent of PricewaterhouseCoopers LLP, Independent Auditors24.1x Power of Attorney (Contained on Signature Page)31.1x Certification of CEO pursuant to Section 302 of Sarbanes-Oxley Act of 200231.2x Certification of CFO pursuant to Section 302 of Sarbanes-Oxley Act of 200232.1x Certification of CEO and CFO pursuant to Section 906 of Sarbanes-Oxley Act of 200299.1x Studio 3 Partners LLC Audited Financial Statements for the years ended September 30, 2015, 2014 and 201399.2x Pop Media Group, LLC Audited Consolidated Financial Statements as of March 31, 2016 and 2015, and for each of
the three fiscal years ended March 31, 2016101 The following materials from the Company's Annual Report on Form 10-K for the year ended March 31, 2016
formatted in Extensible Business Reporting Language (XBRL): (i) the Consolidated Balance Sheets, (ii) theConsolidated Statements of Income, (iii) the Consolidated Statements of Comprehensive Income, (iv) the ConsolidatedStatements of Shareholder's Equity, (v) the Consolidated Statements of Cash Flows and (vi) Notes to ConsolidatedFinancial Statements
__________________________
(1) Incorporated by reference to the Company's Annual Report on Form 10-K for the fiscal year ended March 31, 2005 as filed on June 29, 2005.
(2) Incorporated by reference as Exhibit 3.2 to the Company's Quarterly Report on Form 10-Q as filed on February 9, 2011.(3) Incorporated by reference to the Company's Annual Report on Form 10-K for the fiscal year ended March 31, 2007 as filed on May
30, 2007.(4) Incorporated by reference as Exhibit A to the Company's Definitive Proxy Statement dated July 29, 2014.(5) Incorporated by reference to the Company's Quarterly Report on Form 10-Q as filed on February 9, 2009.(6) Incorporated by reference as Exhibit 10.65 to the Company's Current Report on Form 8-K as filed on July 10, 2009.(7) Incorporated by reference to the Company's Current Report on Form 8-K as filed on October 23, 2009.(8) Incorporated by reference to the Company's Current Report on Form 8-K as filed on July 20, 2010.(9) Incorporated by reference as Exhibit 2.1 to the Company's Current Report on Form 8-K as filed on January 17, 2012.(10) Incorporated by reference as Exhibit 4.1 to the Company's Current Report on Form 8-K as filed on January 17, 2012.(11) Incorporated by reference to the Company's Quarterly Report on Form 10-Q for the period ended September 30, 2012.(12) Incorporated by reference as Exhibit 10.1 to the Company's Current Report on Form 8-K as filed on November 5, 2012.(13) Incorporated by reference as Exhibit 4.1 to the Company's Current Report on Form 8-K as filed on April 15, 2013.(14) Incorporated by reference as Exhibit 10.1 to the Company's Current Report on Form 8-K as filed on May 31, 2013. (15) Incorporated by reference as Exhibit 10.1 to the Company's Current Report on Form 8-K as filed on June 3, 2013.(16) Incorporated by reference to the Company's Quarterly Report on Form 10-Q for the period ended September 30, 2013.(17) Incorporated by reference as Exhibit 10.1 to the Company's Current Report on Form 8-K as filed on December 24, 2013.(18) Incorporated by reference as Exhibit 10.1 to the Company's Current Report on Form 8-K as filed on February 11, 2015.(19) Incorporated by reference as Exhibit 10.1 to the Company's Current Report on Form 8-K as filed on March 17, 2015.(20) Incorporated by reference as Exhibit 10.1 to the Company's Current Report on Form 8-K as filed on May 7, 2015.(21) Incorporated by reference as Exhibit 10.1 to the Company's Current Report on Form 8-K as filed on November 10, 2015.(22) Incorporated by reference as Exhibit 10.2 to the Company's Current Report on Form 8-K as filed on November 10, 2015.(23) Incorporated by reference as Exhibit 10.3 to the Company's Current Report on Form 8-K as filed on November 10, 2015.(24) Incorporated by reference as Exhibit 10.4 to the Company's Current Report on Form 8-K as filed on November 10, 2015.(25) Incorporated by reference as Exhibit 10.1 to the Company's Current Report on Form 8-K as filed on November 12, 2015.(26) Incorporated by reference as Exhibit 1.1 to the Company's Current Report on Form 8-K as filed on November 13, 2015.(27) Incorporated by reference as Exhibit 10.1 to the Company's Current Report on Form 8-K as filed on November 19, 2015.(28) Incorporated by reference as Exhibit 10.2 to the Company's Current Report on Form 8-K as filed on November 19, 2015.(29) Incorporated by reference as Exhibit 10.116 to the Company's Quarterly Report on Form 10-Q as filed on February 4, 2016.
_____________________________
* Management contract or compensatory plan or arrangement.x Filed herewith

85
SIGNATURES
Pursuant to the requirements of Section 13 or 15(d) of the Securities Exchange Act of 1934, the registrant has duly caused this report to be signed on its behalf by the undersigned, thereunto duly authorized on May 25, 2016.
LIONS GATE ENTERTAINMENT CORP.
By: /s/ James W. Barge James W. Barge Chief Financial Officer
DATE: May 25, 2016
Pursuant to the requirements of the Securities Exchange Act of 1934, this report has been signed by the following persons in the capacities and on the dates so indicated.
Each person whose signature appears below authorizes each of Jon Feltheimer, Michael Burns, Wayne Levin and James W. Barge, severally and not jointly, to be his or her true and lawful attorney-in-fact and agent, with full power of substitution and resubstitution, for him or her and in such person’s name, place and stead, in any and all capacities, to sign any amendments to the Company’s Annual Report on Form 10-K for the fiscal year ended March 31, 2016; granting unto said attorney-in-fact and agent, full power and authority to do and perform each and every act and thing requisite and necessary to be done, as fully for all intents and purposes as he or she might or could do in person, hereby ratifying and confirming all that said attorney-in-fact and agent, or his substitute or substitutes, shall lawfully do or cause to be done by virtue hereof.

86
Signature Title Date
/s/ JAMES W. BARGE Chief Financial Officer (Principal Financial Officer and
Principal Accounting Officer) May 25, 2016
James W. Barge
/s/ MICHAEL BURNS
Director May 25, 2016Michael Burns /s/ GORDON CRAWFORD Director May 25, 2016Gordon Crawford
/s/ ARTHUR EVRENSEL Director May 25, 2016Arthur Evrensel /s/ JON FELTHEIMER Chief Executive Officer (Principal Executive Officer)
and Director May 25, 2016
Jon Feltheimer
/s/ EMILY FINE Director May 25, 2016Emily Fine /s/ MICHAEL T. FRIES Director May 25, 2016Michael T. Fries /s/ HARALD LUDWIG Director May 25, 2016Harald Ludwig /s/ DR. JOHN C. MALONE Director May 25, 2016Dr. John C. Malone
/s/ G. SCOTT PATERSON Director May 25, 2016G. Scott Paterson
/s/ MARK H. RACHESKY, M.D.
Chairman of the Board of Directors May 25, 2016Mark H. Rachesky, M.D. /s/ DARYL SIMM Director May 25, 2016Daryl Simm /s/ HARDWICK SIMMONS Director May 25, 2016Hardwick Simmons /s/ PHYLLIS YAFFE Director May 25, 2016Phyllis Yaffe
/s/ DAVID M. ZASLAV Director May 25, 2016David M. Zaslav

F-1
INDEX TO FINANCIAL STATEMENTS
Page Number
Audited Financial Statements Report of Independent Registered Public Accounting Firm F-2Consolidated Balance Sheets — March 31, 2016 and 2015 F-3Consolidated Statements of Income — Years Ended March 31, 2016, 2015 and 2014 F-4Consolidated Statements of Comprehensive Income — Years Ended March 31, 2016, 2015 and 2014 F-5Consolidated Statements of Shareholders’ Equity — Years Ended March 31, 2016, 2015 and 2014 F-6Consolidated Statements of Cash Flows — Years Ended March 31, 2016, 2015 and 2014 F-7Notes to Audited Consolidated Financial Statements F-8

F-2
REPORT OF INDEPENDENT REGISTERED PUBLIC ACCOUNTING FIRM
The Board of Directors and Shareholders of Lions Gate Entertainment Corp.
We have audited the accompanying consolidated balance sheets of Lions Gate Entertainment Corp. as of March 31, 2016 and 2015, and the related consolidated statements of income, comprehensive income, shareholders’ equity, and cash flows for each of the three years in the period ended March 31, 2016. Our audits also included the financial statement schedule listed in the Index at Item 15(a). These financial statements and schedule are the responsibility of the Company’s management. Our responsibility is to express an opinion on these financial statements and schedule based on our audits.
We conducted our audits in accordance with the standards of the Public Company Accounting Oversight Board (United States). Those standards require that we plan and perform the audit to obtain reasonable assurance about whether the financial statements are free of material misstatement. An audit includes examining, on a test basis, evidence supporting the amounts and disclosures in the financial statements. An audit also includes assessing the accounting principles used and significant estimates made by management, as well as evaluating the overall financial statement presentation. We believe that our audits provide a reasonable basis for our opinion.
In our opinion, the financial statements referred to above present fairly, in all material respects, the consolidated financial position of Lions Gate Entertainment Corp. at March 31, 2016 and 2015, and the consolidated results of its operations and its cash flows for each of the three years in the period ended March 31, 2016, in conformity with U.S. generally accepted accounting principles. Also, in our opinion, the related financial statement schedule, when considered in relation to the basic financial statements taken as a whole, presents fairly in all material respects the information set forth therein.
We also have audited, in accordance with the standards of the Public Company Accounting Oversight Board (United States), Lions Gate Entertainment Corp.’s internal control over financial reporting as of March 31, 2016, based on criteria established in Internal Control - Integrated Framework issued by the Committee of Sponsoring Organizations of the Treadway Commission (2013 framework) and our report dated May 25, 2016 expressed an unqualified opinion thereon.
/s/ Ernst & Young LLP
Los Angeles, CaliforniaMay 25, 2016

F-3
LIONS GATE ENTERTAINMENT CORP.CONSOLIDATED BALANCE SHEETS
March 31,2016
March 31,2015
(Amounts in thousands,except share amounts)
ASSETSCash and cash equivalents $ 57,742 $ 102,697Restricted cash 2,906 2,508Accounts receivable, net of reserves for returns and allowances of $51,809 (March 31, 2015- $64,362) and provision for doubtful accounts of $6,014 (March 31, 2015 - $4,120) 1,049,289 891,880Investment in films and television programs, net 1,478,296 1,381,829Property and equipment, net 43,384 26,651Investments 464,346 438,298Goodwill 534,780 323,328Other assets 90,344 74,784Deferred tax assets 134,421 50,114
Total assets $ 3,855,508 $ 3,292,089LIABILITIES
Senior revolving credit facility $ 161,000 $ —5.25% Senior Notes 225,000 225,000Term Loan 400,000 375,000Accounts payable and accrued liabilities 377,698 332,473Participations and residuals 607,358 471,661Film obligations and production loans 715,360 656,755Convertible senior subordinated notes 100,050 114,126Deferred revenue 328,244 274,787
Total liabilities 2,914,710 2,449,802Commitments and contingencies (Note 17)Redeemable noncontrolling interests 90,525 —
SHAREHOLDERS’ EQUITYCommon shares, no par value, 500,000,000 shares authorized, 146,785,940 shares issued(March 31, 2015 - 145,532,978 shares) 885,800 830,786Retained earnings 7,584 13,720Accumulated other comprehensive loss (43,111) (2,219)Total shareholders’ equity 850,273 842,287
Total liabilities and shareholders’ equity $ 3,855,508 $ 3,292,089
See accompanying notes.

F-4
LIONS GATE ENTERTAINMENT CORP.
CONSOLIDATED STATEMENTS OF INCOME
Year Ended March 31,2016 2015 2014
(Amounts in thousands, except per share amounts)
Revenues $ 2,347,419 $ 2,399,640 $ 2,630,254Expenses:
Direct operating 1,415,344 1,315,775 1,369,381Distribution and marketing 661,789 591,491 739,461General and administration 282,232 263,507 254,925Depreciation and amortization 13,084 6,586 6,539
Total expenses 2,372,449 2,177,359 2,370,306Operating income (loss) (25,030) 222,281 259,948Other expenses (income):
Interest expenseCash interest 45,695 39,657 48,960Amortization of debt discount and deferred financing costs 9,184 12,819 17,210
Total interest expense 54,879 52,476 66,170Interest and other income (1,851) (2,790) (6,030)Loss on extinguishment of debt — 11,664 39,572
Total other expenses, net 53,028 61,350 99,712Income (loss) before equity interests and income taxes (78,058) 160,931 160,236Equity interests income 44,231 52,477 24,724Income (loss) before income taxes (33,827) 213,408 184,960Income tax provision (benefit) (76,527) 31,627 32,923Net income 42,700 181,781 152,037
Less: Net loss attributable to noncontrolling interest 7,509 — —Net income attributable to Lions Gate Entertainment Corp.shareholders $ 50,209 $ 181,781 $ 152,037
Per share information attributable to Lions Gate Entertainment Corp.shareholders:Basic net income per common share $ 0.34 $ 1.31 $ 1.11Diluted net income per common share $ 0.33 $ 1.23 $ 1.04
Weighted average number of common shares outstanding:Basic 148,480 139,048 137,468Diluted 154,088 151,778 154,415
Dividends declared per common share $ 0.34 $ 0.26 $ 0.10
See accompanying notes.

F-5
LIONS GATE ENTERTAINMENT CORP.
CONSOLIDATED STATEMENTS OF COMPREHENSIVE INCOME
Year Ended March 31,2016 2015 2014
(Amounts in thousands)
Net income $ 42,700 $ 181,781 $ 152,037Foreign currency translation adjustments, net of tax (3,056) (6,391) 4,294Net unrealized gain (loss) on available-for-sale securities, net of tax charge(benefit) of ($403) and $404 in 2016 and 2015, respectively (37,643) 2,705 —Net unrealized gain (loss) on foreign exchange contracts, net of tax (193) 2,842 808Comprehensive income 1,808 180,937 157,139Less: Comprehensive loss attributable to noncontrolling interest 7,509 — —Comprehensive income attributable to Lions Gate Entertainment Corp.shareholders $ 9,317 $ 180,937 $ 157,139
See accompanying notes.

LIO
NS
GAT
E E
NT
ER
TAIN
ME
NT
CO
RP.
CO
NSO
LID
ATE
D S
TAT
EM
EN
TS
OF
SHA
RE
HO
LD
ER
S’ E
QU
ITY
F-6
C
omm
on S
hare
sR
etai
ned
Ear
ning
s (A
ccum
ulat
edD
efic
it)
Acc
umul
ated
Oth
er
Com
preh
ensi
veIn
com
e (L
oss)
N
umbe
rA
mou
ntT
otal
(Am
ount
s in
thou
sand
s, ex
cept
shar
e am
ount
s)B
alan
ce a
t Mar
ch 3
1, 2
013
135,
882,
899
$67
2,91
5$
(309
,912
)$
(6,4
77)
$35
6,52
6Ex
erci
se o
f sto
ck o
ptio
ns1,
198,
035
11,9
72—
—11
,972
Shar
e-ba
sed
com
pens
atio
n, n
et o
f with
hold
ing
tax
oblig
atio
ns o
f $23
,077
964,
324
53,4
19—
—53
,419
Issu
ance
of c
omm
on sh
ares
to d
irect
ors f
or se
rvic
es14
,017
427
——
427
Con
vers
ion
of A
pril
2009
3.6
25%
Not
es a
nd Ja
nuar
y 20
12 4
.00%
Not
es3,
263,
892
27,3
60—
—27
,360
Rep
urch
ase
of c
omm
on sh
ares
, no
par v
alue
(315
,706
)(8
,339
)—
—(8
,339
)D
ivid
ends
dec
lare
d—
(13,
966)
——
(13,
966)
Net
inco
me
attri
buta
ble
to L
ions
Gat
e En
terta
inm
ent C
orp.
shar
ehol
ders
——
152,
037
—15
2,03
7Fo
reig
n cu
rren
cy tr
ansl
atio
n ad
just
men
ts, n
et o
f tax
——
—4,
294
4,29
4N
et u
nrea
lized
gai
n on
fore
ign
exch
ange
con
tract
s, ne
t of t
ax—
——
808
808
Bal
ance
at M
arch
31,
201
414
1,00
7,46
174
3,78
8(1
57,8
75)
(1,3
75)
584,
538
Exer
cise
of s
tock
opt
ions
481,
069
6,83
9—
—6,
839
Shar
e-ba
sed
com
pens
atio
n, n
et o
f with
hold
ing
tax
oblig
atio
ns o
f $20
,657
777,
916
47,4
79—
—47
,479
Con
vers
ion
of O
ctob
er 2
004
2.93
75%
Not
es a
nd A
pril
2009
3.6
25%
Not
es2,
945,
730
24,0
31—
—24
,031
Issu
ance
of c
omm
on sh
ares
rela
ted
to in
vest
men
ts5,
328,
924
170,
916
——
170,
916
Issu
ance
of c
omm
on sh
ares
to d
irect
ors f
or se
rvic
es18
,390
521
——
521
Rep
urch
ase
of c
omm
on sh
ares
, no
par v
alue
(5,0
26,5
12)
(136
,501
)—
—(1
36,5
01)
Div
iden
ds d
ecla
red
—(2
6,28
7)(1
0,18
6)—
(36,
473)
Net
inco
me
attri
buta
ble
to L
ions
Gat
e En
terta
inm
ent C
orp.
shar
ehol
ders
——
181,
781
—18
1,78
1Fo
reig
n cu
rren
cy tr
ansl
atio
n ad
just
men
ts, n
et o
f tax
——
—(6
,391
)(6
,391
)N
et u
nrea
lized
gai
n on
ava
ilabl
e-fo
r-sa
le se
curit
ies,
net o
f tax
——
—2,
705
2,70
5N
et u
nrea
lized
gai
n on
fore
ign
exch
ange
con
tract
s, ne
t of t
ax—
—2,
842
2,84
2B
alan
ce a
t Mar
ch 3
1, 2
015
145,
532,
978
830,
786
13,7
20(2
,219
)84
2,28
7Ex
erci
se o
f sto
ck o
ptio
ns40
2,00
86,
097
——
6,09
7Sh
are-
base
d co
mpe
nsat
ion,
net
of w
ithho
ldin
g ta
x ob
ligat
ions
of $
24,1
8294
0,09
648
,555
——
48,5
55C
onve
rsio
n of
Apr
il 20
09 3
.625
% N
otes
1,98
3,05
816
,162
——
16,1
62Is
suan
ce o
f com
mon
shar
es to
dire
ctor
s for
serv
ices
10,7
4437
7—
—37
7Is
suan
ce o
f com
mon
shar
es re
late
d to
Pilg
rim S
tudi
os a
cqui
sitio
n1,
517,
451
57,0
03—
—57
,003
Rep
urch
ase
of c
omm
on sh
ares
, no
par v
alue
(3,6
00,3
95)
(73,
180)
——
(73,
180)
Div
iden
ds d
ecla
red
——
(50,
469)
—(5
0,46
9)N
et in
com
e at
tribu
tabl
e to
Lio
ns G
ate
Ente
rtain
men
t Cor
p. sh
areh
olde
rs—
—50
,209
—50
,209
Fore
ign
curr
ency
tran
slat
ion
adju
stm
ents
, net
of t
ax—
——
(3,0
56)
(3,0
56)
Net
unr
ealiz
ed lo
ss o
n av
aila
ble-
for-
sale
secu
ritie
s, ne
t of t
ax—
——
(37,
643)
(37,
643)
Net
unr
ealiz
ed lo
ss o
n fo
reig
n ex
chan
ge c
ontra
cts,
net o
f tax
——
—(1
93)
(193
)N
onco
ntro
lling
inte
rest
adj
ustm
ents
to re
dem
ptio
n va
lue
——
(5,8
76)
—(5
,876
)B
alan
ce a
t Mar
ch 3
1, 2
016
146,
785,
940
$88
5,80
0$
7,58
4$
(43,
111)
$85
0,27
3
See
acco
mpa
nyin
g no
tes.

F-7
LIONS GATE ENTERTAINMENT CORP.CONSOLIDATED STATEMENTS OF CASH FLOWS
Year Ended March 31,2016 2015 2014
Operating Activities: (Amounts in thousands)Net income $ 42,700 $ 181,781 $ 152,037Adjustments to reconcile net income to net cash provided by (used in) operating activities:
Depreciation and amortization 13,084 6,586 6,539Amortization of films and television programs 1,029,077 899,951 921,289Amortization of debt discount and deferred financing costs 9,184 12,819 17,210Non-cash share-based compensation 77,906 79,938 60,492Other non-cash items 2,031 — —Distribution from equity method investee — 7,788 16,079Loss on extinguishment of debt — 11,664 39,572Equity interests income (44,231) (52,477) (24,724)Deferred income taxes (benefit) (85,069) 13,934 15,913
Changes in operating assets and liabilities:Restricted cash (398) 6,417 1,775Accounts receivable, net (144,910) (13,968) (93,503)Investment in films and television programs (1,066,403) (1,012,294) (948,082)Other assets (13,413) (5,331) (3,768)Accounts payable and accrued liabilities 28,916 (5,086) 17,628Participations and residuals 134,884 2,704 59,207Film obligations (30,711) (24,977) (19,187)Deferred revenue 28,347 (12,940) 34,035
Net Cash Flows Provided By (Used In) Operating Activities (19,006) 96,509 252,512Investing Activities:Proceeds from the sale of equity method investees — 14,575 9,000Investment in equity method investees (15,989) (22,730) (17,250)Distributions from equity method investee in excess of earnings — — 4,169Purchase of Pilgrim Studios, net of cash acquired of $15,816 (see Note 11) (126,892) — —Purchases of other investments (750) (30,000) —Repayment of loans receivable — — 4,275Purchases of property and equipment (18,433) (17,013) (8,799)Net Cash Flows Used In Investing Activities (162,064) (55,168) (8,605)Financing Activities:Senior revolving credit facility - borrowings 605,500 778,500 872,220Senior revolving credit facility - repayments (444,500) (876,119) (1,113,075)Term Loans and 5.25% Senior Notes - borrowings, net of deferred financing costs of $964,$4,315 and $6,860 for the years ended March 31, 2016, 2015 and 2014, respectively 24,036 370,685 440,640Term Loans - repayments — (229,500) —10.25% Senior Notes - repurchases and redemptions — — (470,584)Convertible senior subordinated notes - borrowings — — 60,000Convertible senior subordinated notes - repurchases (5) (16) —Production loans - borrowings 572,572 631,709 532,416Production loans - repayments (483,145) (449,648) (517,874)Pennsylvania Regional Center credit facility - repayments — — (65,000)Repurchase of common shares (73,180) (144,840) —Dividends paid (47,447) (33,353) (6,900)Exercise of stock options 6,097 6,839 11,972Tax withholding required on equity awards (24,205) (20,062) (23,077)Net Cash Flows Provided By (Used In) Financing Activities 135,723 34,195 (279,262)Net Change In Cash And Cash Equivalents (45,347) 75,536 (35,355)Foreign Exchange Effects on Cash 392 1,469 (1,316)Cash and Cash Equivalents - Beginning Of Period 102,697 25,692 62,363Cash and Cash Equivalents - End Of Period $ 57,742 $ 102,697 $ 25,692
See accompanying notes.

F-8
LIONS GATE ENTERTAINMENT CORP.
NOTES TO AUDITED CONSOLIDATED FINANCIAL STATEMENTS
1. Nature of Operations
Lions Gate Entertainment Corp. (“Lionsgate,” the “Company,” “we,” “us” or “our”) is a premier next generation global content leader with a strong and diversified presence in motion picture production and distribution, television programming and syndication, home entertainment, digital distribution, channel platforms and international distribution and sales.
2. Significant Accounting Policies
(a) Generally Accepted Accounting Principles
These consolidated financial statements have been prepared in accordance with United States (“U.S.”) generally accepted accounting principles (“GAAP”).
(b) Principles of Consolidation
The accompanying consolidated financial statements of the Company include the accounts of Lionsgate and its majority-owned and controlled subsidiaries. The Company reviews its relationships with other entities to identify whether it is the primary beneficiary of a variable interest entity (“VIE”). If the determination is made that the Company is the primary beneficiary, then the entity is consolidated in accordance with accounting guidance.
All significant intercompany balances and transactions have been eliminated in consolidation.
(c) Use of Estimates
The preparation of financial statements in conformity with U.S. GAAP requires management to make estimates and assumptions that affect the reported amounts of assets and liabilities and disclosure of contingent assets and liabilities at the date of the financial statements, and the reported amounts of revenue and expenses during the reporting period. The most significant estimates made by management in the preparation of the financial statements relate to ultimate revenue and costs for investment in films and television programs; estimates of sales returns and other allowances and provisions for doubtful accounts; fair value of equity-based compensation; fair value of assets and liabilities for allocation of the purchase price of companies acquired; income taxes; and accruals for contingent liabilities; and impairment assessments for investment in films and television programs, property and equipment, equity investments, goodwill and intangible assets. Actual results could differ from such estimates.
(d) Reclassifications
Certain amounts presented in prior years have been reclassified to conform to the current year’s presentation.
(e) Revenue Recognition
Revenue from the theatrical release of feature films is recognized at the time of exhibition based on the Company's participation in box office receipts. Revenue from the sale of DVDs and Blu-ray discs in the retail market, net of an allowance for estimated returns and other allowances, is recognized on the later of receipt by the customer or “street date” (when it is available for sale by the customer). Under revenue sharing arrangements, including digital and electronic-sell-through ("EST") arrangements, such as download-to-own, download-to-rent, video-on-demand and subscription video-on-demand, revenue is recognized when the Company is entitled to receipts and such receipts are determinable. Revenues from television or digital licensing for fixed fees are recognized when the feature film or television program is available to the licensee for telecast. For television licenses that include separate availability “windows” during the license period, revenue is allocated over the “windows.” Revenue from sales to international territories are recognized when access to the feature film or television program has been granted or delivery has occurred, as required under the sales contract, and the right to exploit the feature film or television program has commenced. For multiple media rights contracts with a fee for a single film or television program where the contract provides for media holdbacks (defined as contractual media release restrictions), the fee is allocated to the various media based on the Company's assessment of the relative fair value of the rights to exploit each media and is recognized as each holdback is released. For multiple-title contracts with a fee, the fee is allocated on a title-by-title basis, based on the Company's assessment of the relative fair value of each title.
Cash payments received are recorded as deferred revenue until all the conditions of revenue recognition have been met. Long-term, non-interest bearing receivables are discounted to present value. Such unamortized discounts were $14.0 million and $10.2 million at March 31, 2016 and 2015, respectively. At March 31, 2016, $222.1 million of accounts receivable are due

LIONS GATE ENTERTAINMENT CORP.
NOTES TO AUDITED CONSOLIDATED FINANCIAL STATEMENTS — (Continued)
F-9
beyond one year. The accounts receivable are due as follows: $128.5 million in fiscal 2018, $65.2 million in fiscal 2019, $20.3 million in fiscal 2020, $6.6 million in fiscal 2021 and $1.5 million in fiscal 2022.
(f) Cash and Cash Equivalents
Cash and cash equivalents consist of cash deposits at financial institutions and investments in money market mutual funds.
(g) Restricted Cash
Restricted cash primarily consists of amounts that are contractually designated for certain theatrical marketing obligations.
(h) Investment in Films and Television Programs
Investment in films and television programs includes the unamortized costs of completed films and television programs which have been produced by the Company or for which the Company has acquired distribution rights, libraries acquired as part of acquisitions of companies, films and television programs in progress and in development and home entertainment product inventory.
For films and television programs produced by the Company, capitalized costs include all direct production and financing costs, capitalized interest and production overhead. For the years ended March 31, 2016, 2015, and 2014, total capitalized interest was $19.9 million, $15.6 million, and $13.8 million, respectively. For acquired films and television programs, capitalized costs consist of minimum guarantee payments to acquire the distribution rights.
Costs of acquiring and producing films and television programs and of acquired libraries are amortized using the individual-film-forecast method, whereby these costs are amortized and participations and residuals costs are accrued in the proportion that current year’s revenue bears to management’s estimate of ultimate revenue at the beginning of the current year expected to be recognized from the exploitation, exhibition or sale of the films or television programs.
Ultimate revenue includes estimates over a period not to exceed ten years following the date of initial release of the motion picture. For an episodic television series, the period over which ultimate revenues are estimated cannot exceed ten years following the date of delivery of the first episode, or, if still in production, five years from the date of delivery of the most recent episode, if later. For titles included in acquired libraries, ultimate revenue includes estimates over a period not to exceed twenty years following the date of acquisition.
Investment in films and television programs is stated at the lower of amortized cost or estimated fair value. The valuation of investment in films and television programs is reviewed on a title-by-title basis, when an event or change in circumstances indicates that the fair value of a film or television program is less than its unamortized cost. During the years ended March 31, 2016 and 2015, the Company recorded impairment charges of $25.0 million and $23.5 million, respectively, on film and television programs. In determining the fair value of its films and television programs, the Company employs a discounted cash flows ("DCF") methodology with assumptions for cash flows. Key inputs employed in the DCF methodology include estimates of a film's ultimate revenue and costs as well as a discount rate. The discount rate utilized in the DCF analysis is based on the weighted average cost of capital of the Company plus a risk premium representing the risk associated with producing a particular film or television program. The fair value of any film costs associated with a film or television program that management plans to abandon is zero. As the primary determination of fair value is determined using a DCF model, the resulting fair value is considered a Level 3 measurement (see Note 10). Additional amortization is recorded in the amount by which the unamortized costs exceed the estimated fair value of the film or television program. Estimates of future revenue involve measurement uncertainty and it is therefore possible that reductions in the carrying value of investment in films and television programs may be required as a consequence of changes in management’s future revenue estimates.
Films and television programs in progress include the accumulated costs of productions which have not yet been completed.
Films and television programs in development include costs of acquiring film rights to books, stage plays or original screenplays and costs to adapt such projects. Such costs are capitalized and, upon commencement of production, are transferred to production costs. Projects in development are written off at the earlier of the date they are determined not to be recoverable or when abandoned, or three years from the date of the initial investment.
Home entertainment product inventory consists of DVDs and Blu-ray discs and is stated at the lower of cost or market value (first-in, first-out method). Costs of DVDs and Blu-ray discs sales, including shipping and handling costs, are included in distribution and marketing expenses.

LIONS GATE ENTERTAINMENT CORP.
NOTES TO AUDITED CONSOLIDATED FINANCIAL STATEMENTS — (Continued)
F-10
(i) Property and Equipment, net
Property and equipment is carried at cost less accumulated depreciation. Depreciation is provided for on a straight line basis over the following useful lives:
Computer equipment and software 2 — 5 yearsFurniture and equipment 2 — 10 yearsLeasehold improvements Lease term or the useful life, whichever is shorterLand Not depreciated
The Company periodically reviews and evaluates the recoverability of property and equipment. Where applicable, estimates of net future cash flows, on an undiscounted basis, are calculated based on future revenue estimates. If appropriate and where deemed necessary, a reduction in the carrying amount is recorded.
(j) Investments
Investments include investments accounted for under the equity method of accounting, fair value method and cost method.
Equity Method Investments: The Company uses the equity method of accounting for investments in companies in which it has a minority equity interest and the ability to exert significant influence over operating decisions of the companies. Significant influence is generally presumed to exist when the Company owns between 20% and 50% of the voting interests in the investee, holds substantial management rights or holds an interest of less than 20% in an investee that is a limited liability partnership or limited liability corporation that is treated as a flow-through entity.
Under the equity method of accounting, the Company's share of the investee's earnings (losses), net of intercompany eliminations, are included in the "equity interest income (loss)" line item in the consolidated statement of income. The Company records its share of the net income or loss of certain other equity method investments (see Note 5) on a one quarter lag and, accordingly, during the years ended March 31, 2016, 2015 and 2014, the Company recorded its share of the income or loss generated by these entities for the years ended December 31, 2015, 2014 and 2013, respectively.
Profit Eliminations. The Company licenses theatrical releases and other films and television programs to certain equity method investments. A portion of the profits of these licenses reflecting the Company's ownership share in the venture are eliminated through an adjustment to the equity interest income (loss) of the venture. These profits are recognized as they are realized by the equity method investee through the amortization of the related asset, recorded on the equity method investee's balance sheet, over the license period.
Dividends and Other Distributions. Dividends and other distributions from equity method investees are recorded as a reduction of the Company's investment. Distributions received up to the Company's interest in the investee's retained earnings are considered returns on investments and are classified within cash flows from operating activities in the consolidated statement of cash flows. Distributions from equity method investments in excess of the Company's interest in the investee's retained earnings are considered returns of investments and are classified within cash flows provided by investing activities in the statement of cash flows.
Fair Value and Cost Method Investments: Investments in companies in which the Company does not have a controlling voting interest or over which it is unable to exert significant influence are generally accounted for at fair value if the investments are publicly traded. If the investment or security is not publicly traded, the investment is accounted for at cost because its fair value is not readily determinable. Fair value investments are considered available-for-sale by the Company. Unrealized gains and losses on investments, which are available-for-sale and accounted for at fair value, are reported net of tax in accumulated other comprehensive income or loss.
All of the Company’s investments are periodically reviewed to determine whether there has been a loss in value that is other than a temporary decline. If the Company determines that an investment has sustained an other-than-temporary decline in its value, the investment is written down to its fair value by a charge to earnings.
(k) Goodwill
Goodwill represents the excess of acquisition costs over the tangible and intangible assets acquired and liabilities assumed in various business acquisitions by the Company. The Company has two reporting units with goodwill: Motion Pictures and Television Production. Goodwill is not amortized but is reviewed for impairment annually each fiscal year or between the annual tests if an event occurs or circumstances change that indicate it is more-likely-than-not that the fair value of a reporting unit is less than its carrying value. The impairment test follows a two-step approach. The first step determines if the goodwill is potentially impaired, and the second step measures the amount of the impairment loss, if necessary. Under the first step,

LIONS GATE ENTERTAINMENT CORP.
NOTES TO AUDITED CONSOLIDATED FINANCIAL STATEMENTS — (Continued)
F-11
goodwill is considered potentially impaired if the fair value of the reporting unit is less than the reporting unit’s carrying amount, including goodwill. Under the second step, the impairment loss is then measured as the excess of recorded goodwill over the fair value of the goodwill, as calculated. The fair value of goodwill is calculated by allocating the fair value of the reporting unit to all the assets and liabilities of the reporting unit as if the reporting unit was purchased in a business combination and the purchase price was the fair value of the reporting unit. However, entities are permitted to first assess qualitative factors to determine whether it is more likely than not that the fair value of a reporting unit is less than its carrying amount as a basis for determining whether it is necessary to perform the two-step impairment test. The Company performs its annual impairment test as of January 1 in each fiscal year. The Company elected to first assess qualitative factors to determine whether it is necessary to perform the two-step annual goodwill impairment test in fiscal 2016. Based on the Company's qualitative assessments including, but not limited to, the results of the most recent quantitative impairment test, consideration of macroeconomic conditions, industry and market conditions, cash flows, and the Company's share price, the Company concluded that it is more likely than not that the fair value of our reporting units is greater than their carrying value.
(l) Other Assets
Other assets include deferred financing costs, prepaid expenses and other, and finite-lived intangible assets.
Deferred Financing Costs. Amounts incurred in connection with obtaining debt financing that is not deemed to be a modification of terms of an existing borrowing are deferred and amortized using the effective interest method, as a component of interest expense, over the period to the earlier of the date of the earliest put option or term to maturity of the related debt obligation. Debt financing costs associated with a debt issuance deemed to be a modification of terms of an existing borrowing are charged to expense at the time of modification.
Prepaid Expenses and Other. Prepaid expenses and other primarily include prepaid expenses, security deposits, and other assets.
Finite-lived Intangible Assets. Finite-lived intangible assets consist primarily of noncompete agreements, trademarks and tradenames, and sales agency relationships, which are amortized over their anticipated revenue stream and reviewed for impairment when events and circumstances indicate that the intangible asset might be impaired.
(m) Prints, Advertising and Marketing Expenses
The costs of advertising and marketing expenses are expensed as incurred. Advertising expenses for the year ended March 31, 2016 were $470.2 million (2015 — $400.0 million, 2014 — $520.0 million) which were recorded as distribution and marketing expenses. The costs of film prints are capitalized as prepaid expenses and expensed upon theatrical release and are included in distribution and marketing expenses.
(n) Income Taxes
Income taxes are accounted for using an asset and liability approach for financial accounting and reporting for income taxes and recognition and measurement of deferred assets are based upon the likelihood of realization of tax benefits in future years. Under this method, deferred taxes are provided for the net tax effects of temporary differences between the carrying amounts of assets and liabilities for financial reporting purposes and the amounts used for income tax purposes. Valuation allowances are established when management determines that it is more likely than not that some portion or all of the net deferred tax asset will not be realized. The financial effect of changes in tax laws or rates is accounted for in the period of enactment.
From time to time, the Company engages in transactions in which the tax consequences may be subject to uncertainty. Significant judgment is required in assessing and estimating the tax consequences of these transactions. In determining the Company’s tax provision for financial reporting purposes, the Company establishes a reserve for uncertain tax positions unless such positions are determined to be more likely than not of being sustained upon examination, based on their technical merits. The Company’s policy is to recognize interest and/or penalties related to income tax matters in income tax expense.
(o) Government Assistance
The Company has access to government programs that are designed to promote film and television production and distribution in Canada and Australia. The Company also has access to similar programs in certain states within the U.S. that are designed to promote film and television production in those states.
Tax credits earned with respect to expenditures on qualifying film and television productions are included as an offset to investment in films and television programs when the qualifying expenditures have been incurred provided that there is reasonable assurance that the credits will be realized (see Note 15).

LIONS GATE ENTERTAINMENT CORP.
NOTES TO AUDITED CONSOLIDATED FINANCIAL STATEMENTS — (Continued)
F-12
(p) Foreign Currency Translation
Monetary assets and liabilities denominated in currencies other than the functional currency are translated at exchange rates in effect at the balance sheet date. Resulting unrealized and realized gains and losses are included in the consolidated statements of income.
Foreign company assets and liabilities in foreign currencies are translated into U.S. dollars at the exchange rate in effect at the balance sheet date. Foreign company revenue and expense items are translated at the average rate of exchange for the fiscal year. Gains or losses arising on the translation of the accounts of foreign companies are included in accumulated other comprehensive income or loss, a separate component of shareholders’ equity.
(q) Derivative Instruments and Hedging Activities
Derivative financial instruments are used by the Company in the management of its foreign currency exposures. The Company’s policy is not to use derivative financial instruments for trading or speculative purposes.
The Company enters into forward foreign exchange contracts to hedge its foreign currency exposures on future production expenses denominated in various foreign currencies. The Company evaluates whether the foreign exchange contracts qualify for hedge accounting at the inception of the contract. The fair value of the forward exchange contracts is recorded on the consolidated balance sheets. Changes in the fair value of the foreign exchange contracts that are effective hedges are reflected in accumulated other comprehensive income or loss, a separate component of shareholders’ equity, and changes in the fair value of foreign exchange contracts that are ineffective hedges are reflected in the consolidated statements of income. Gains and losses realized upon settlement of the foreign exchange contracts that are effective hedges are amortized to the consolidated statements of income on the same basis as the production expenses being hedged.
(r) Share-Based Compensation
The Company measures the cost of employee services received in exchange for an award of equity instruments based on the grant date fair value of the award. The fair value is recognized in earnings over the period during which an employee is required to provide service. See Note 13 for further discussion of the Company’s share-based compensation.
(s) Net Income Per Share
Basic net income per share is calculated based on the weighted average common shares outstanding for the period. Basic net income per share for the years ended March 31, 2016, 2015 and 2014 is presented below:
Year Ended March 31,2016 2015 2014
(Amounts in thousands, except per share amounts)
Basic Net Income Per Common Share:Numerator:
Net income attributable to Lions Gate Entertainment Corp. shareholders $ 50,209 $ 181,781 $ 152,037Denominator:
Weighted average common shares outstanding 148,480 139,048 137,468Basic net income per common share $ 0.34 $ 1.31 $ 1.11
Diluted net income per common share reflects the potential dilutive effect, if any, of the conversion of convertible senior subordinated notes under the "if converted" method. Diluted net income per common share also reflects share purchase options, including equity-settled share appreciation rights and restricted share units ("RSUs") using the treasury stock method when dilutive, and any contingently issuable shares when dilutive. Diluted net income per common share for the years ended March 31, 2016, 2015 and 2014 is presented below:

LIONS GATE ENTERTAINMENT CORP.
NOTES TO AUDITED CONSOLIDATED FINANCIAL STATEMENTS — (Continued)
F-13
Year Ended March 31,2016 2015 2014
(Amounts in thousands, except per share amounts)
Diluted Net Income Per Common Share:Numerator:
Net income attributable to Lions Gate Entertainment Corp. shareholders $ 50,209 $ 181,781 $ 152,037Add:
Interest on convertible notes, net of tax 450 5,515 8,573Numerator for diluted net income per common share $ 50,659 $ 187,296 $ 160,610
Denominator:Weighted average common shares outstanding 148,480 139,048 137,468Effect of dilutive securities:
Conversion of notes 2,098 9,508 13,736Share purchase options 3,129 2,773 2,593Restricted share units 381 449 618
Adjusted weighted average common shares outstanding 154,088 151,778 154,415
Diluted net income per common share $ 0.33 $ 1.23 $ 1.04
For the years ended March 31, 2016, 2015 and 2014, the outstanding common shares issuable presented below were excluded from diluted net income per common share because their inclusion would have had an anti-dilutive effect.
Year Ended March 31,2016 2015 2014
(Amounts in thousands)
Anti-dilutive shares issuableConversion of notes 4,047 — —Share purchase options 4,660 4,312 2,759Restricted share units 179 147 87Contingently issuable shares 624 322 457Total weighted average anti-dilutive shares issuable excluded from diluted netincome per common share 9,510 4,781 3,303
(t) Recent Accounting Pronouncements
Revenue Recognition: In May 2014, the Financial Accounting Standards Board ("FASB") issued an accounting standard update relating to the recognition of revenue from contracts with customers, which will supersede most current U.S. GAAP revenue recognition guidance, including industry-specific guidance. The new revenue recognition standard provides a five-step analysis of transactions to determine when and how revenue is recognized. Based on the current guidance, the new framework will become effective on either a full or modified retrospective basis for the Company on April 1, 2018. The Company is currently evaluating the impact that the adoption of this new guidance will have on its consolidated financial statements.
Presentation of Debt Issuance Costs: In April 2015, the FASB issued an accounting standards update relating to the presentation of debt issuance costs. The accounting update requires companies to present debt issuance costs related to a recognized debt liability as a direct deduction from the carrying amount of that debt liability, consistent with debt discounts, rather than as an asset. The guidance is effective for the Company's fiscal year beginning April 1, 2016, with early adoption permitted. The Company plans to adopt the new guidance effective April 1, 2016. The adoption of this guidance is not expected to have a material impact on the Company's consolidated financial statements.
Business Combinations - Accounting for Measurement Period Adjustments: In September 2015, the FASB issued new guidance on adjustments to provisional amounts recognized in a business combination, which are currently recognized on a retrospective basis. Under the new requirements, adjustments will be recognized in the reporting period in which the adjustments are determined. The effects of changes in depreciation, amortization, or other income arising from changes to the

LIONS GATE ENTERTAINMENT CORP.
NOTES TO AUDITED CONSOLIDATED FINANCIAL STATEMENTS — (Continued)
F-14
provisional amounts, if any, are included in earnings of the reporting period in which the adjustments to the provisional amounts are determined. An entity is also required to present separately on the face of the income statement or disclose in the notes the portion of the amount recorded in current-period earnings by line item that would have been recorded in previous reporting periods if the adjustment to the provisional amounts had been recognized as of the acquisition date. The guidance is effective for the Company's fiscal year beginning April 1, 2016, with early adoption permitted, and is required to be implemented on a prospective basis. The Company adopted the new guidance effective October 1, 2015 and it did not have a material impact on the Company's consolidated financial statements.
Recognition and Measurement of Financial Instruments: In January 2016, the FASB issued new guidance that addresses certain aspects of recognition, measurement, presentation, and disclosure of financial instruments. Among other provisions, the new guidance requires equity investments (except those accounted for under the equity method of accounting, or those that result in consolidation of the investee) to be measured at fair value with changes in fair value recognized in net income. For investments without readily determinable fair values, entities have the option to either measure these investments at fair value or at cost adjusted for changes in observable prices minus impairment. The guidance is effective for the Company's fiscal year beginning April 1, 2018. Early adoption is not permitted, except for certain provisions relating to financial liabilities. The Company is currently evaluating the impact that the adoption of this new guidance will have on its consolidated financial statements.
Accounting for Leases: In February 2016, the FASB issued guidance on accounting for leases which requires lessees to recognize most leases on their balance sheets for the rights and obligations created by those leases. The new guidance also requires additional qualitative and quantitative disclosures related to the nature, timing and uncertainty of cash flows arising from leases. The guidance is effective for the Company's fiscal year beginning April 1, 2019, with early adoption is permitted, and is required to be implemented using a modified retrospective approach. The Company is currently evaluating the impact that the adoption of this new guidance will have on its consolidated financial statements.
Employee Share-Based Payment Accounting: In March 2016, the FASB issued amended guidance related to employee share-based payment accounting. The guidance requires all income tax effects of awards to be recognized in the income statement when the awards vest or are settled, to be implemented on a prospective basis. The guidance also requires presentation of excess tax benefits as an operating activity on the statement of cash flows rather than as a financing activity, and can be applied retrospectively or prospectively. The guidance increases the amount companies can withhold to cover income taxes on awards without triggering liability classification for shares used to satisfy statutory income tax withholding obligations and requires application of a modified retrospective transition method. The guidance is effective for the Company's fiscal year beginning April 1, 2017, with early adoption permitted. The Company is currently evaluating the impact that the adoption of this new guidance will have on its consolidated financial statements.
Equity Method of Accounting: In March 2016, the FASB issued guidance that changes the requirements for equity method accounting when an investment qualifies for use of the equity method as a result of an increase in the investor’s ownership interest in or degree of influence over an investee. The guidance (i) eliminates the need to retroactively apply the equity method of accounting upon qualifying for such treatment, (ii) requires that the cost of acquiring the additional interest in an investee be added to the basis of the previously held interest and (iii) requires that unrealized holding gains or losses for available-for-sale equity securities that qualify for the equity method of accounting be recognized in earnings at the date the investment becomes qualified for use of the equity method of accounting. The guidance is effective for the Company's fiscal year beginning April 1, 2017, with early adoption permitted. The Company is currently evaluating the impact that the adoption of this new guidance will have on its consolidated financial statements.

LIONS GATE ENTERTAINMENT CORP.
NOTES TO AUDITED CONSOLIDATED FINANCIAL STATEMENTS — (Continued)
F-15
3. Investment in Films and Television Programs
March 31,2016
March 31,2015
(Amounts in thousands)
Motion Pictures Segment - Theatrical and Non-Theatrical FilmsReleased, net of accumulated amortization $ 584,419 $ 507,628Acquired libraries, net of accumulated amortization 3,612 9,357Completed and not released 33,806 76,968In progress 421,687 478,879In development 28,148 21,054Product inventory 20,693 23,023
1,092,365 1,116,909Television Production Segment - Direct-to-Television ProgramsReleased, net of accumulated amortization 189,246 231,470In progress 191,161 28,585In development 5,524 4,865
385,931 264,920$ 1,478,296 $ 1,381,829
The Company expects approximately 49% of completed films and television programs, net of accumulated amortization, will be amortized during the one-year period ending March 31, 2017. Additionally, the Company expects approximately 81% of completed and released films and television programs, net of accumulated amortization and excluding acquired libraries, will be amortized during the three-year period ending March 31, 2019.
4. Property and Equipment
March 31,2016
March 31,2015
(Amounts in thousands)
Leasehold improvements $ 20,509 $ 13,788Property and equipment 15,402 7,149Computer equipment and software 52,261 43,605 88,172 64,542Less accumulated depreciation and amortization (45,994) (39,097) 42,178 25,445Land 1,206 1,206 $ 43,384 $ 26,651
During the year ended March 31, 2016, depreciation expense amounted to $8.9 million (2015 - $4.8 million; 2014 - $2.8 million).

LIONS GATE ENTERTAINMENT CORP.
NOTES TO AUDITED CONSOLIDATED FINANCIAL STATEMENTS — (Continued)
F-16
5. Investments
The carrying amounts of investments, by category, at March 31, 2016 and March 31, 2015 were as follows:
March 31,2016
March 31,2015
(Amounts in thousands)
Equity method investments $ 297,546 $ 234,202Available-for-sale securities 123,978 162,024Cost method investments 42,822 42,072
$ 464,346 $ 438,298
Equity Method Investments:
The carrying amounts of equity method investments at March 31, 2016 and March 31, 2015 were as follows:
March 31,2016
Equity Method InvesteeOwnershipPercentage
March 31,2016
March 31,2015
(Amounts in thousands)
EPIX 31.2% $ 171,837 $ 119,688Pop 50.0% 98,719 91,683Other Various 26,990 22,831
$ 297,546 $ 234,202
Equity interests from equity method investments for the years ended March 31, 2016, 2015 and 2014 were as follows (income (loss)):
Year Ended March 31,Equity Method Investee 2016 2015 2014 (Amounts in thousands)
EPIX $ 52,149 $ 48,718 $ 32,308Pop (1,763) (9,615) (2,610)Other(1) (6,155) 13,374 (4,974)
$ 44,231 $ 52,477 $ 24,724____________________
(1) The Company records its share of the net income or loss of other equity method investments on a one quarter lag. Equity interest income from other equity method investments for the year ended March 31, 2015 includes a gain on sale of the Company's investment in FEARnet of $11.4 million.
EPIX. In April 2008, the Company formed a joint venture with Viacom, its Paramount Pictures unit, and Metro-Goldwyn-Mayer Studios to create a premium television channel and subscription video-on-demand service named “EPIX”. The Company invested $80.4 million through September 30, 2010, and no additional amounts have been funded since. During the years ended March 31, 2016, 2015 and 2014, the Company received distributions from EPIX of nil, $7.8 million and $20.2 million, respectively. Since the Company's original investment in April 2008, the Company has received distributions from EPIX of $28.0 million.
EPIX Financial Information:
The following table presents summarized balance sheet data as of March 31, 2016 and March 31, 2015 for EPIX:

LIONS GATE ENTERTAINMENT CORP.
NOTES TO AUDITED CONSOLIDATED FINANCIAL STATEMENTS — (Continued)
F-17
March 31,2016
March 31,2015
(Amounts in thousands)
Current assets $ 355,735 $ 285,819Non-current assets $ 360,441 $ 277,887Current liabilities $ 90,837 $ 121,451Non-current liabilities $ 23,948 $ 6,753
The following table presents the summarized statement of operations for the years ended March 31, 2016, 2015 and 2014 for EPIX and a reconciliation of the net income reported by EPIX to equity interest income recorded by the Company:
Year Ended March 31,2016 2015 2014
(Amounts in thousands)
Revenues $ 413,760 $ 442,793 $ 353,439Expenses:
Operating expenses 221,586 252,896 239,933Selling, general and administrative expenses 24,028 23,305 22,835
Operating income 168,146 166,592 90,671Interest and other expense (2,180) (1,993) (304)
Net income $ 165,966 $ 164,599 $ 90,367Reconciliation of net income reported by EPIX to equity interestincome:
Net income reported by EPIX $ 165,966 $ 164,599 $ 90,367Ownership interest in EPIX 31.15% 31.15% 31.15%The Company's share of net income 51,698 51,273 28,149Eliminations of the Company’s share of profits on licensing sales to EPIX(1) (7,314) (10,159) (9,638)Realization of the Company’s share of profits on licensing sales to EPIX(2) 7,765 7,604 13,797Total equity interest income recorded $ 52,149 $ 48,718 $ 32,308
__________________(1) Represents the elimination of the gross profit recognized by the Company on licensing sales to EPIX in proportion to the
Company's ownership interest in EPIX.
(2) Represents the realization of a portion of the profits previously eliminated. This profit remains eliminated until realized by EPIX. EPIX initially records the license fee for the title as inventory on its balance sheet and amortizes the inventory over the license period. Accordingly, the profit is realized as the inventory on EPIX's books is amortized.
Pop. The Company’s investment interest in Pop consists of an equity investment in its common stock units and mandatorily redeemable preferred stock units. The Company's partner in Pop, CBS TVG Inc. ("CBS"), has a call option to purchase a portion of the Company's ownership interest in Pop at fair market value, which would result in CBS owning 80% of Pop, exercisable beginning March 26, 2018 for a period of 30 days. During the year ended March 31, 2016, the Company made contributions to Pop of $8.8 million (2015 - $15.0 million; 2014 - $6.5 million).
The mandatorily redeemable preferred stock units carry a dividend rate of 10% compounded annually and are mandatorily redeemable in May 2019 at the stated value plus the dividend return and any additional capital contributions less previous distributions. The mandatorily redeemable preferred stock units were initially recorded based on their estimated fair value, as determined using an option pricing model. The mandatorily redeemable preferred stock units and the 10% dividend are being accreted up to their redemption amount over the ten-year period to the redemption date, which is recorded as income within equity interest.

LIONS GATE ENTERTAINMENT CORP.
NOTES TO AUDITED CONSOLIDATED FINANCIAL STATEMENTS — (Continued)
F-18
Pop Financial Information:
The following table presents summarized balance sheet data as of March 31, 2016 and March 31, 2015 for Pop:
March 31,2016
March 31,2015
(Amounts in thousands)
Current assets $ 38,278 $ 28,612Non-current assets $ 192,461 $ 192,188Current liabilities $ 29,090 $ 26,048Non-current liabilities $ 8,198 $ 7,196Redeemable preferred stock $ 466,501 $ 399,247
The following table presents the summarized statement of operations for the years ended March 31, 2016, 2015 and 2014 for Pop and a reconciliation of the net loss reported by Pop to equity interest loss recorded by the Company:
Year Ended March 31,2016 2015 2014
(Amounts in thousands)
Revenues $ 86,437 $ 79,048 $ 78,407Expenses:
Cost of services 39,683 38,757 36,866Selling, marketing, and general and administration 42,145 49,524 43,967Depreciation and amortization 7,777 7,814 8,031
Operating loss (3,168) (17,047) (10,457)Other expense 14 385 (1,213)Interest expense, net 523 683 1,205Accretion of redeemable preferred stock units(1) 57,654 48,546 40,342
Total interest expense, net 58,191 49,614 40,334Loss from continuing operations (61,359) (66,661) (50,791)
Loss from discontinued operations — — (2,799)Net loss $ (61,359) $ (66,661) $ (53,590)Reconciliation of net loss reported by Pop to equity interest loss:
Net loss reported by Pop $ (61,359) $ (66,661) $ (53,590)Ownership interest in Pop 50% 50% 50%The Company's share of net loss (30,680) (33,331) (26,795)Gain on sale of the Company's 50% share of TVGuide.com(2) — — 3,960Accretion of dividend and interest income on redeemable preferred stock units(1) 28,827 24,273 20,171Eliminations of the Company’s share of profit on licensing sales to Pop (813) (920) —Realization of the Company’s share of profits on licensing sales to Pop 903 363 54Total equity interest loss recorded $ (1,763) $ (9,615) $ (2,610)
___________________(1) Accretion of mandatorily redeemable preferred stock units represents Pop's 10% dividend and the amortization of discount
on its mandatorily redeemable preferred stock units held by the Company and the other interest holder. The Company recorded its share of this expense as income from the accretion of dividend and discount on mandatorily redeemable preferred stock units within equity interest income (loss).
(2) Represents the gain on the May 31, 2013 sale of the Company's 50% interest in TVGuide.com. As a result of the sale, TVGuide.com is considered a discontinued operation by Pop, and accordingly, the revenues and expenses of TVGuide.com

LIONS GATE ENTERTAINMENT CORP.
NOTES TO AUDITED CONSOLIDATED FINANCIAL STATEMENTS — (Continued)
F-19
prior to the transaction for all periods presented, are reflected net within the discontinued operations section of the summarized statement of operations for Pop.
Other Equity Method Investments
Defy Media. In June 2007, the Company acquired an interest in Break Media, a multi-platform digital media company and a leader in male-targeted content creation and distribution. In October 2013, Break Media merged with Alloy Digital, a multi-platform digital media company with a strong presence in the youth market, to create Defy Media. The Company's effective economic interest in Defy Media through its investment in Break Media and its direct investment in Defy Media is approximately 15.8%. The Company is accounting for its investment in Defy Media, a limited liability company, under the equity method of accounting due to the Company's board representation that provides significant influence over the investee.
Roadside Attractions. Roadside Attractions is an independent theatrical distribution company. The Company owns a 43.0% interest in Roadside Attractions.
Pantelion Films. Pantelion Films is a joint venture with Videocine, an affiliate of Televisa, which produces, acquires and distributes a slate of English and Spanish language feature films that target Hispanic moviegoers in the U.S. The Company owns a 49.0% interest in Pantelion Films.
Atom Tickets. Atom Tickets is the first-of-its-kind theatrical mobile ticketing platform and app. The Company made initial investments totaling $4.3 million in Atom Tickets during the year ended March 31, 2015. During the year ended March 31, 2016, the Company participated in an equity offering of Atom Tickets and subscribed for an additional $7.9 million. The Company owns an interest of approximately 19.5% in Atom Tickets. The Company is accounting for its investment in Atom Tickets, a limited liability company, under the equity method of accounting due to the Company's board representation that provides significant influence over the investee.
Tribeca Short List. Tribeca Short List is a subscription video-on-demand service. The Company made an initial investment of $2.1 million during the year ended March 31, 2015, and during the year ended March 31, 2016, the Company made capital contributions to Tribeca Short List of $2.4 million, net of cash acquired of $0.4 million (see below). The Company holds a 75.0% economic interest. Through October 17, 2015, the power to direct the activities that most significantly impact the economic performance of Tribeca Short List was shared equally with Tribeca Enterprises, and accordingly through October 17, 2015, the Company's interest in Tribeca Short List was accounted for under the equity method of accounting. Subsequent to October 17, 2015, the terms of the arrangement increased the Company's power to control the board, and the Company now has the power to direct the activities that most significantly impact the economic performance of Tribeca Short List. Accordingly, the Company has consolidated Tribeca Short List beginning in the quarter ended December 31, 2015, with no gain or loss recognized upon consolidation since the carrying value of the net assets approximated the fair value.

LIONS GATE ENTERTAINMENT CORP.
NOTES TO AUDITED CONSOLIDATED FINANCIAL STATEMENTS — (Continued)
F-20
Available-for-Sale Securities:
The cost basis, unrealized gains (losses) and fair market value of available-for-sale securities are set forth below:
March 31,2016
March 31,2015
(Amounts in thousands)
Cost basis $ 158,916 $ 158,916Gross unrealized gain (loss) (34,938) 3,108Fair value $ 123,978 $ 162,024
Starz. At March 31, 2016 and March 31, 2015, available-for-sale securities consisted of the Company's minority interest in Starz. On March 27, 2015, pursuant to the terms of a stock exchange agreement entered into on February 10, 2015 (the "Exchange Agreement"), the Company exchanged 4,967,695 of its newly issued common shares for 2,118,038 shares of Series A common stock of Starz and 2,590,597 shares of Series B common stock of Starz held by certain affiliates of Dr. John C. Malone, a Director of the Company. The Exchange Agreement placed certain restrictions on the ability to transfer the shares issued by the Company. The Starz shares acquired by the Company represent approximately 15.0% of the total voting power of the issued and outstanding Starz common stock as of March 31, 2016. However, under the Exchange Agreement, the Company granted an irrevocable proxy to Dr. Malone and the affiliates of Dr. Malone to vote the shares the Company acquired except with respect to proposals related to extraordinary transactions, including any proposals related to any sale or issuance of securities, or any business combination, merger, consolidation, liquidation, reorganization, recapitalization, sale or disposition of all or substantially all of Starz's assets or similar extraordinary transaction, whether or not involving the Company.
The Company classifies the Series A common stock of Starz within Level 1 of the fair value hierarchy as the valuation inputs are based on quoted prices in active markets (see Note 10). The Series B common stock of Starz are considered a Level 2 security because the quoted market prices are based on infrequent transactions. Therefore, the fair value of the Series B common stock, which is convertible, at the holder’s option, into Series A common stock of Starz is based on the quoted market price of the Series A common stock, which is an equivalent security other than for the voting rights.
As of March 31, 2016, the Company's investment in Starz was in an unrealized loss position; however, due to the fluctuation of the security's market price in an active market and the short-term duration of the unrealized loss, the Company has the intent and ability to hold the securities until the fair value recovers. As of May 24, 2016, the fair value of the Company's minority interest in Starz was $124.7 million, compared to the Company's original cost basis of $158.9 million.
Cost Method Investments:
Telltale. Telltale Games ("Telltale") is a creator, developer and publisher of interactive software episodic games based upon popular stories and characters across all major gaming and entertainment platforms. In February 2015, the Company invested $40.0 million in Telltale, which consisted of a cash investment in Telltale of $28.0 million in exchange for 2,628,072 of Series D convertible preferred stock, and 361,229 newly issued common shares of the Company with a fair value of approximately $12.0 million in exchange for approximately 1,126,316 existing common shares of Telltale, representing in the aggregate an approximately 14% economic interest in Telltale.
Next Games. Next Games is a mobile games development company headquartered in Helsinki, Finland, with a focus on crafting visually impressive, highly engaging games. In July 2014, the Company invested $2.0 million in Next Games for a small minority ownership interest, and during the year ended March 31, 2016, the Company invested an additional $0.2 million in Next Games.
6. Other Assets
The composition of the Company’s other assets is as follows as of March 31, 2016 and March 31, 2015:

LIONS GATE ENTERTAINMENT CORP.
NOTES TO AUDITED CONSOLIDATED FINANCIAL STATEMENTS — (Continued)
F-21
March 31,2016
March 31,2015
(Amounts in thousands)
Deferred financing costs, net of accumulated amortization $ 21,269 $ 28,060Prepaid expenses and other 57,725 45,537Finite-lived intangible assets 11,350 1,187
$ 90,344 $ 74,784
Deferred Financing Costs. Deferred financing costs primarily include costs incurred in connection with the Company's various debt issuances (see Note 7).
Prepaid Expenses and Other. Prepaid expenses and other primarily include prepaid expenses, security deposits, and other assets.
Finite-lived Intangible Assets. Finite-lived intangible assets consist primarily of noncompete agreements, trademarks and tradenames, and sales agency relationships. The composition of the Company's finite-lived intangible assets and the associated accumulated amortization is as follows as of March 31, 2016 and March 31, 2015:
March 31, 2016 March 31, 2015
GrossCarryingAmount
AccumulatedAmortization
Net CarryingAmount
GrossCarryingAmount
AccumulatedAmortization
Net CarryingAmount
(Amounts in thousands)
Finite-lived intangible assets:Noncompete agreements $ 9,500 $ 449 $ 9,051 $ — $ — $ —Trademarks and trade names 8,600 6,451 2,149 6,600 5,913 687Sales agency relationships 6,200 6,050 150 6,200 5,700 500
$ 24,300 $ 12,950 $ 11,350 $ 12,800 $ 11,613 $ 1,187
The increase in the carrying value of finite-lived intangible assets from March 31, 2015 was primarily due to the November 12, 2015 acquisition of Pilgrim Studios (see Note 11). Amortization expense associated with the Company's intangible assets for the years ended March 31, 2016, 2015 and 2014 was approximately $1.3 million, $1.8 million and $3.7 million, respectively. Amortization expense remaining relating to intangible assets for each of the years ending March 31, 2017 through 2021 is approximately $1.8 million, $1.4 million, $1.4 million, $1.4 million, and $1.4 million, respectively.
7. Corporate Debt
The total carrying values of corporate debt of the Company, excluding film obligations and production loans, were as follows as of March 31, 2016 and March 31, 2015:
March 31, 2016 March 31, 2015 (Amounts in thousands)
Senior revolving credit facility $ 161,000 $ —5.25% Senior Notes 225,000 225,000Term Loan Due 2022 400,000 375,000Convertible senior subordinated notes, net of unamortized discount of $1,800 (March31, 2015 - $3,891) 100,050 114,126
$ 886,050 $ 714,126

LIONS GATE ENTERTAINMENT CORP.
NOTES TO AUDITED CONSOLIDATED FINANCIAL STATEMENTS — (Continued)
F-22
The following table sets forth future annual contractual principal payment commitments of corporate debt as of March 31, 2016:
ConversionPrice PerShare at
March 31,2016 Maturity Date
Year Ended March 31,Debt Type 2017 2018 2019 2020 2021 Thereafter Total (Amounts in thousands)
Senior revolving creditfacility N/A September 2017 $ — $161,000 $ — $ — $ — $ — $ 161,0005.25% Senior Notes N/A August 2018 — — 225,000 — — — 225,000Term Loan Due 2022 N/A March 2022 — — — — — 400,000 400,000Principal amounts ofconvertible seniorsubordinated notes:
January 2012 4.00%Notes $10.26 January 2017 41,850 — — — — — 41,850April 2013 1.25%Notes $29.32 April 2018 — — 60,000 — — — 60,000
$41,850 $161,000 $285,000 $ — $ — $ 400,000 887,850Less aggregate unamortized discount (1,800)
$ 886,050
Senior Revolving Credit Facility
Availability of Funds. The senior revolving credit facility provides for borrowings and letters of credit up to an aggregate of $800 million, and at March 31, 2016, there was $639.0 million available (March 31, 2015 — $800.0 million). The availability of funds is limited by a borrowing base and also reduced by outstanding letters of credit, if any. There were no letters of credit outstanding at March 31, 2016 (March 31, 2015 — none).
Maturity Date. September 27, 2017.
Interest. Interest is payable at an alternative base rate, as defined, plus 1.5%, or LIBOR plus 2.5% as designated by the Company. As of March 31, 2016, borrowings under the senior revolving credit facility bore interest of 2.5% over the LIBOR rate (effective interest rate of 2.94% and 2.68% on borrowings outstanding as of March 31, 2016 and March 31, 2015, respectively).
Commitment Fee. The Company is required to pay a quarterly commitment fee of 0.375% to 0.5% per annum, depending on the average balance of borrowings outstanding during the period, on the total senior revolving credit facility of $800 million less the amount drawn.
Security. Obligations are secured by collateral (as defined in the credit agreement) granted by the Company and certain subsidiaries of the Company, as well as a pledge of equity interests in certain of the Company's subsidiaries.
Covenants. The senior revolving credit facility contains a number of covenants that, among other things, require the Company to satisfy certain financial covenants and restrict the ability of the Company to incur additional debt, pay dividends, make certain investments and acquisitions, repurchase its stock, prepay certain indebtedness, create liens, enter into agreements with affiliates, modify the nature of its business, enter into sale-leaseback transactions, transfer and sell material assets and merge or consolidate. As of March 31, 2016, the Company was in compliance with all applicable covenants.
Change in Control. The Company may also be subject to an event of default upon a change in control (as defined in the credit agreement) which, among other things, includes a person or group acquiring ownership or control in excess of 50% of the Company’s common shares.
5.25% Senior Notes

LIONS GATE ENTERTAINMENT CORP.
NOTES TO AUDITED CONSOLIDATED FINANCIAL STATEMENTS — (Continued)
F-23
Issuance Date. On July 19, 2013, Lions Gate Entertainment Corp. issued $225.0 million aggregate principal amount of 5.25% Senior Secured Second-Priority Notes (the "5.25% Senior Notes").
Interest. Interest is payable semi-annually on February 1 and August 1 of each year at a rate of 5.25% per year, and commenced on February 1, 2014.
Maturity Date. August 1, 2018.
Optional Redemption. Redeemable by the Company, in whole or in part, at a price equal to 100% of the principal amount, plus the Applicable Premium, as defined in the indenture governing the 5.25% Senior Notes, plus accrued and unpaid interest, if any, to the date of redemption. The Applicable Premium amounts to the greater of (i) 1.0% of the principal amount redeemed and (ii) the excess of the present value of the principal amount of the notes redeemed plus interest through the maturity date over the principal amount of the notes redeemed on the redemption date.
Guarantees. The 5.25% Senior Notes are guaranteed by all of the restricted subsidiaries of the Company that guarantee any material indebtedness of the Company or any other guarantor, subject, in the case of certain special purpose producers, to receipt of certain consents.
Security Interest and Ranking. The 5.25% Senior Notes and the guarantees are secured by second-priority liens on substantially all of the Company’s and the guarantors’ tangible and intangible personal property, subject to certain exceptions and permitted liens. The 5.25% Senior Notes rank equally in right of payment with all of the Company’s existing and future debt that is not subordinated in right of payment to the 5.25% Senior Notes, including the Company’s existing convertible senior subordinated notes. The 5.25% Senior Notes are structurally subordinated to all existing and future liabilities (including trade payables) of the subsidiaries that do not guarantee the 5.25% Senior Notes.
Change of Control. The occurrence of a change of control will be a triggering event requiring the Company to offer to purchase from holders some or all of the 5.25% Senior Notes, at a price equal to 101% of the principal amount, plus accrued and unpaid interest, if any, to the date of purchase. In addition, certain asset dispositions will be triggering events that may require the Company to use the excess proceeds from such dispositions to make an offer to purchase the 5.25% Senior Notes at 100% of their principal amount, plus accrued and unpaid interest, if any to the date of purchase.
Covenants. The 5.25% Senior Notes contain certain restrictions and covenants that, subject to certain exceptions, limit the Company’s ability to incur additional indebtedness, pay dividends or repurchase the Company’s common shares, make certain loans or investments, and sell or otherwise dispose of certain assets subject to certain conditions, among other limitations. As of March 31, 2016, the Company was in compliance with all applicable covenants.
Term Loan Due 2022
Issuance Date. On March 17, 2015, the Company entered into a second lien credit and guarantee agreement (the "Credit Agreement"), and pursuant to the Credit Agreement, borrowed a term loan in an aggregate amount of $375 million (the "Term Loan Due 2022"). In May 2015, the Company amended the Credit Agreement governing its Term Loan Due 2022, and pursuant to the amended Credit Agreement, borrowed an additional aggregate amount of $25.0 million.
Interest. Interest on the Term Loan Due 2022 is payable on the last business day of each April, July, October and January at a rate of 5.00% per year.
Maturity Date. The Term Loan Due 2022 matures on March 17, 2022.
Optional Prepayment. The Company may voluntarily prepay the Term Loan Due 2022 at any time, provided that if prepaid (i) prior to March 17, 2016, the Company shall pay to the lenders the present value of all interest payable on the principal amount repaid through March 17, 2016, using a discount rate equal to the one-year treasury rate plus 0.50%; (ii) on or before March 17, 2017, the Company shall pay to lenders a prepayment premium of 2.0% on the principal amount prepaid; (iii) after March 17, 2017 and on or before March 17, 2018, the Company shall pay to lenders a prepayment premium of 1.0% on the principal amount prepaid; and (iv) on or after March 17, 2018, no prepayment premium shall be payable.
Guarantees. Substantially similar to the 5.25% Senior Notes discussed above.

LIONS GATE ENTERTAINMENT CORP.
NOTES TO AUDITED CONSOLIDATED FINANCIAL STATEMENTS — (Continued)
F-24
Security Interest and Ranking. Substantially similar to the 5.25% Senior Notes discussed above.
Change of Control. Substantially similar to the 5.25% Senior Notes discussed above.
Covenants. Substantially similar to the 5.25% Senior Notes discussed above. As of March 31, 2016, the Company was in compliance with all applicable covenants.
Redemption and Repurchase Transactions
Redemption of Term Loan Due 2020. On March 17, 2015, contemporaneously with the issuance of the Term Loan Due 2022, the Company used a portion of the proceeds to redeem its previous Term Loan Due 2020 (see below for definition) (which carried a variable interest rate of LIBOR, subject to a 1.00% floor, plus 4.00%). In conjunction with the early redemption of the Term Loan Due 2020, the Company paid a call premium pursuant to the terms of the agreement governing the Term Loan Due 2020 of $4.5 million.
Redemption of 10.25% Senior Notes. On July 19, 2013, contemporaneously with the issuance of the 5.25% Senior Notes, and a seven-year $225.0 million term loan agreement (the "Term Loan Due 2020"), the Company called for early redemption of the $432.0 million remaining outstanding principal amount of the then outstanding 10.25% Senior Secured Second-Priority Notes (the "10.25% Senior Notes"). In conjunction with the early redemption of the 10.25% Senior Notes, we paid $34.3 million, representing the present value of interest through the first call date of November 1, 2013 and related call premium pursuant to the terms of the indenture governing the 10.25% Senior Notes.
In accounting for each contemporaneous issuance and redemption transaction discussed above, a portion of the issuance and redemption was considered a modification of terms with creditors who participated in both the new issuances and the redeemed debt, and a portion was considered a debt extinguishment. To the extent a portion of the issuance and redemption was considered a modification, the call premium plus the remaining unamortized deferred financing costs and debt discount on the redeemed debt will be amortized over the life of the new issuance, and to the extent a portion of the issuance and redemption was considered an extinguishment, these costs were expensed as a loss on extinguishment of debt. The new issuance costs related to each issuance were capitalized and will be amortized over the life of the new issuance to the extent the issuance and redemption was considered an extinguishment, and expensed as a loss on extinguishment of debt to the extent considered to be a modification of terms.
The tables below set forth the applicable costs associated with (i) the redemption of the Term Loan Due 2020 and (ii) the redemption of the 10.25% Senior Notes, respectively (as discussed above), and the applicable accounting for such:
Redemption of Term Loan Due 2020:
Total
Amortize OverLife of Term
Loan Due 2022
Loss onExtinguishment
of Debt
(Amounts in thousands)
Early redemption/ call premium on Term Loan Due 2020 $ 4,500 $ 2,834 $ 1,666Previously incurred unamortized discount and deferred financingcosts of Term Loan Due 2020 14,420 8,803 5,617
18,920 (1) 11,637 7,283Third party costs incurred to issue the Term Loan Due 2022 4,931 (2) 1,826 3,105
Total $ 23,851 $ 13,463 $ 10,388

LIONS GATE ENTERTAINMENT CORP.
NOTES TO AUDITED CONSOLIDATED FINANCIAL STATEMENTS — (Continued)
F-25
Redemption of 10.25% Senior Notes:
Total
Amortize OverLife of 5.25%Senior Notes
and Term LoanDue 2020
Loss onExtinguishment
of Debt
(Amounts in thousands)
Early redemption/ call premium on 10.25% Senior Notes $ 34,304 $ 13,218 $ 21,086Previously incurred unamortized net discount/premium and deferredfinancing costs of 10.25% Senior Notes 19,825 7,639 12,186
54,129 (1) 20,857 33,272Third party costs incurred to issue the 5.25% Senior Notes and TermLoan Due 2020 6,748 (2) 4,148 2,600
Total $ 60,877 $ 25,005 $ 35,872 (1) Amounts related to the portion of the debt redemption deemed to be a modification of terms, as discussed above, were accounted for as deferred costs, with the remaining amounts expensed as a loss on extinguishment of debt.(2) Third party costs incurred to issue the new debt related to the portion of the debt redemption deemed to be a modification of terms, as discussed above, were expensed as a loss on extinguishment of debt, with the remaining amount capitalized as deferred financing costs of the new issuances.
Other Repurchases of 10.25% Senior Notes. In June 2013, Lions Gate Entertainment, Inc. ("LGEI"), the Company's wholly-owned subsidiary, paid $4.3 million to repurchase $4.0 million of aggregate principal amount (carrying value - $4.0 million) of the 10.25% Senior Notes. The Company recorded a loss on extinguishment during the year ended March 31, 2014 of $0.5 million, which included $0.2 million of deferred financing costs written off.
Convertible Senior Subordinated Notes
Outstanding Amount and Terms. The following table sets forth the convertible senior subordinated notes outstanding and certain key terms of these notes at March 31, 2016 and March 31, 2015:
Convertible SeniorSubordinated Notes Maturity Date
ConversionPrice PerShare at
March 31,2016
March 31, 2016 March 31, 2015
PrincipalUnamortized
Discount
NetCarryingAmount Principal
UnamortizedDiscount
NetCarryingAmount
(Amounts in thousands)
April 2009 3.625% Notes(1) N/A N/A $ — $ — $ — $ 16,167 $ — $ 16,167January 20124.00% Notes January 11, 2017 $10.26 41,850 (1,800) 40,050 41,850 (3,891) 37,959April 20131.25% Notes April 15, 2018 $29.32 60,000 — 60,000 60,000 — 60,000
$101,850 $ (1,800) $100,050 $118,017 $ (3,891) $114,126_______________(1) On March 17, 2015, the April 2009 3.625% Notes were called for redemption and in April 2015, the holders of the notes
converted substantially all of the outstanding principal amounts into common shares.
January 2012 4.00% Notes: In January 2012, LGEI issued approximately $45.0 million of January 2012 4.00% Notes, of which $10.1 million was allocated to the equity component. Interest is payable semi-annually on January 15 and July 15 of each year.
April 2013 1.25% Notes: In April 2013, LGEI issued approximately $60.0 million in aggregate principal amount of April 2013 1.25% Notes. Interest is payable semi-annually on April 15 and October 15 of each year.

LIONS GATE ENTERTAINMENT CORP.
NOTES TO AUDITED CONSOLIDATED FINANCIAL STATEMENTS — (Continued)
F-26
Conversion Features: The convertible senior subordinated notes are convertible, at any time, into the number of common shares of the Company determined by the principal amount being converted divided by the conversion price, subject to adjustment in certain circumstances.
The January 2012 4.00% Notes provide that upon conversion, the Company has the option to deliver, in lieu of common shares, cash or a combination of cash and common shares of the Company. Convertible debt instruments that may be settled in cash upon conversion (including partial cash settlement) are recorded by separately accounting for the liability and equity component (i.e., conversion feature), thereby reducing the principal amount with a debt discount that is amortized as interest expense over the expected life of the note using the effective interest method. The effective interest rate on the liability component of the January 2012 4.00% Notes is 9.56%.
The April 2013 1.25% Notes are convertible only into the Company's common shares and do not carry an option to be settled in cash upon conversion, and accordingly, have been recorded at their principal amount (not reduced by a debt discount for the equity component).
Conversions. The following conversions were completed with respect to the Company's convertible senior subordinated notes, which resulted in a loss on extinguishment of debt in the years ended March 31, 2015 and 2014 of $1.3 million and $3.3 million, respectively (2016 - none):
Year Ended March 31,
2016 2015 2014
(Amounts in thousands, except share amounts)
April 2009 3.625% NotesPrincipal amount converted $ 16,162 $ 24,053 $ 24,289Common shares issued upon conversion 1,983,058 2,937,096 2,943,634Weighted average conversion price per share $ 8.15 $ 8.19 $ 8.25
October 2004 2.9375% NotesPrincipal amount converted $ — $ 99 $ 233Common shares issued upon conversion — 8,634 20,259Weighted average conversion price per share $ — 11.46 $ 11.50
January 2012 4.00% NotesPrincipal amount converted $ — $ — $ 3,150Common shares issued upon conversion — — 299,999Weighted average conversion price per share $ — $ — $ 10.50
TotalPrincipal amount converted $ 16,162 $ 24,152 27,672Common shares issued upon conversion 1,983,058 2,945,730 3,263,892Weighted average conversion price per share $ 8.15 $ 8.20 $ 8.48
Interest Expense. Interest expense recognized for the convertible senior subordinated notes for the years ended March 31, 2016, 2015 and 2014 is presented below:
Year Ended March 31,
2016 2015 2014
(Amounts in thousands)
Contractual interest coupon $ 2,367 $ 3,458 $ 4,751Amortization of discount on liability component and debt issuance costs 2,141 5,200 8,845
$ 4,508 $ 8,658 $ 13,596

LIONS GATE ENTERTAINMENT CORP.
NOTES TO AUDITED CONSOLIDATED FINANCIAL STATEMENTS — (Continued)
F-27
8. Participations and Residuals
The Company expects approximately 72% of accrued participations and residuals will be paid during the one-year period ending March 31, 2017.
Theatrical Slate Participation
On March 10, 2015, the Company entered into a theatrical slate participation arrangement with TIK Films (U.S.), Inc. and TIK Films (Hong Kong) Limited (collectively, "TIK Films"), both wholly owned subsidiaries of Hunan TV & Broadcast Intermediary Co. Ltd. Under the arrangement, TIK Films, in general and subject to certain limitations including per picture and annual caps, will contribute a minority share of 25%, of the Company’s production or acquisition costs of “qualifying” theatrical feature films, released during the three-year period ending January 23, 2018, and participate in a pro-rata portion of the pictures’ net profits or losses similar to a co-production arrangement based on the portion of costs funded. The arrangement excludes among others, any theatrical feature film incorporating any elements from the Twilight, Hunger Games or Divergent franchises. The percentage of the contribution could vary on certain pictures.
Amounts provided from TIK Films are reflected as a participation liability in the Company's consolidated balance sheet and amounted to $61.3 million at March 31, 2016 (March 31, 2015 - $13.6 million). The difference between the ultimate participation expected to be paid to TIK Films and the amount provided by TIK Films is amortized as a charge to or a reduction of participation expense under the individual-film-forecast method.
9. Film Obligations and Production Loans
March 31,2016
March 31,2015
(Amounts in thousands)
Film obligations $ 24,989 $ 55,811Production loans 690,371 600,944
Total film obligations and production loans $ 715,360 $ 656,755
The following table sets forth future annual repayment of film obligations and production loans as of March 31, 2016:
Year Ended March 31, 2017 2018 2019 2020 2021 Thereafter Total (Amounts in thousands)
Film obligations $ 22,098 $ 2,000 $ 1,000 $ — $ — $ — $ 25,098Production loans 641,076 49,295 — — — — 690,371
$ 663,174 $ 51,295 $ 1,000 $ — $ — $ — 715,469Less imputed interest on filmobligations (109)
$715,360
Film Obligations
Film obligations include minimum guarantees, which represent amounts payable for film rights that the Company has acquired and certain theatrical marketing obligations for amounts received from third parties that are contractually committed for theatrical marketing expenditures associated with specific titles.
Production Loans
Production loans represent individual loans for the production of film and television programs that the Company produces. The majority of production loans have contractual repayment dates either at or near the expected completion date, with the exception of certain loans containing repayment dates on a longer term basis, and incur interest at rates ranging from 3.37% to 3.87%.

LIONS GATE ENTERTAINMENT CORP.
NOTES TO AUDITED CONSOLIDATED FINANCIAL STATEMENTS — (Continued)
F-28
10. Fair Value Measurements
Fair Value
Accounting guidance and standards about fair value define fair value as the price that would be received from selling an asset or paid to transfer a liability in an orderly transaction between market participants at the measurement date.
Fair Value Hierarchy
Fair value hierarchy requires an entity to maximize the use of observable inputs and minimize the use of unobservable inputs when measuring fair value. A financial instrument’s categorization within the fair value hierarchy is based upon the lowest level of input that is significant to the fair value measurement. The accounting guidance and standards establish three levels of inputs that may be used to measure fair value:
• Level 1 — Quoted prices in active markets for identical assets or liabilities.
• Level 2 — Observable inputs other than Level 1 prices such as quoted prices for similar assets or liabilities; quoted prices in markets with insufficient volume or infrequent transactions (less active markets); or model-derived valuations in which all significant inputs are observable or can be derived principally from or corroborated by observable market data for substantially the full term of the assets or liabilities. Level 2 liabilities that are not required to be measured at fair value on a recurring basis include the Company’s convertible senior subordinated notes, production loans, 5.25% Senior Notes, and Term Loan, which are priced using discounted cash flow techniques that use observable market inputs, such as LIBOR-based yield curves, swap rates, and credit ratings.
• Level 3 — Unobservable inputs to the valuation methodology that are significant to the measurement of fair value of assets or liabilities. The Company measures the fair value of its investment in Pop's Mandatorily Redeemable Preferred Stock Units using primarily a discounted cash flow analysis based on the expected cash flows of the investment. The analysis reflects the contractual terms of the investment, including the period to maturity, and uses a discount rate commensurate with the risk associated with the investment.
The following table sets forth the assets and liabilities required to be carried at fair value on a recurring basis as of March 31, 2016 and March 31, 2015:
March 31, 2016 March 31, 2015
Level 1 Level 2 Total Level 1 Level 2 Total
Assets: (Amounts in thousands)
Available-for-sale securities (see Note 5):Starz Series A common stock $ 55,768 $ — $ 55,768 $ 72,882 $ — $ 72,882Starz Series B common stock — 68,210 68,210 — 89,142 89,142
Forward exchange contracts (see Note 18) — 9,417 9,417 — 8,335 8,335
Liabilities:Forward exchange contracts (see Note 18) — (748) (748) — (2,024) (2,024)
$ 55,768 $ 76,879 $132,647 $ 72,882 $ 95,453 $168,335

LIONS GATE ENTERTAINMENT CORP.
NOTES TO AUDITED CONSOLIDATED FINANCIAL STATEMENTS — (Continued)
F-29
The following table sets forth the carrying values and fair values of the Company’s investment in Pop's mandatorily redeemable preferred stock units and outstanding debt at March 31, 2016 and March 31, 2015:
March 31, 2016 March 31, 2015(Amounts in thousands)
Carrying Value Fair Value Carrying Value Fair Value (Level 3) (Level 3)
Assets:Investment in Pop's Mandatorily Redeemable Preferred StockUnits $ 98,719 $ 114,500 $ 91,683 $ 110,000
Carrying Value Fair Value Carrying Value Fair Value (Level 2) (Level 2)
Liabilities:April 2009 3.625% Notes — — 16,167 16,167January 2012 4.00% Notes 40,050 41,477 37,959 41,473April 2013 1.25% Notes 60,000 54,188 60,000 53,241Production loans 690,371 690,371 600,944 600,9445.25% Senior Notes 225,000 229,500 225,000 233,438Term Loan 400,000 400,500 375,000 375,938
$ 1,415,421 $ 1,416,036 $ 1,315,070 $ 1,321,201
11. Acquisition
Acquisition of Pilgrim Studios. On November 12, 2015, the Company purchased 62.5% of the membership interests in Pilgrim Media Group, LLC ("Pilgrim Studios"), a worldwide independent reality television producer and distributor. The aggregate purchase price was approximately $201.7 million, net of $7.7 million allocated to certain transactional costs attributable to the noncontrolling shareholder. These costs are included in the general and administrative expense of Pilgrim Studios; however, pursuant to the profit sharing provisions in the operating agreement, the amount is included in net loss attributable to noncontrolling interest in our consolidated statement of income and thus does not impact earnings per share attributable to Lions Gate Entertainment Corp. shareholders.
The purchase price consisted of $144.7 million in cash and 1,517,451 of the Company's common shares, valued at $57.0 million. These shares were valued based on the closing price of the Company’s common shares on the date of closing of the acquisition, discounted to the fair value of the shares considering certain transfer restrictions. The Company incurred approximately $3.4 million of acquisition-related costs that were expensed in general and administrative expenses during the year ended March 31, 2016.
The acquisition was accounted for as a purchase, with the results of operations of Pilgrim Studios included in the Company's consolidated results from November 12, 2015. Revenues and net loss for the period from November 12, 2015 through March 31, 2016 of Pilgrim Studios were $52.5 million and $7.2 million, respectively. The Company made a preliminary allocation of the estimated purchase price of Pilgrim Studios to the tangible and intangible assets acquired and liabilities assumed based on their estimated fair value. Since the initial allocation of the estimated purchase price, the Company has adjusted the preliminary purchase price allocation for new information obtained about facts and circumstances that existed as of the acquisition date, that, if known, would have affected the measurements of the amounts recognized at that date. The preliminary purchase price allocation is subject to revision, as a more detailed analysis of investment in television programs and intangible assets is completed and additional information on the fair value of assets and liabilities becomes available, including receipt of final appraisals of the net assets acquired. A change in the fair value of the net assets may change the amount of the purchase price allocable to goodwill, and could impact the amounts of amortization expense. The Company used DCF analyses, which represent Level 3 fair value measurements, to assess certain components of its purchase price allocation. The preliminary allocation of the purchase price, including the fair value of redeemable noncontrolling interest recognized, is as follows:

LIONS GATE ENTERTAINMENT CORP.
NOTES TO AUDITED CONSOLIDATED FINANCIAL STATEMENTS — (Continued)
F-30
Preliminary allocation of the total purchase consideration (1):(Amounts inthousands)
Cash and cash equivalents $ 15,816Accounts receivable, net 15,248Investment in films and television programs, net 63,387Other assets acquired 7,019Finite-lived intangible assets:
Noncompete agreements 9,500Trade name 2,000
Other liabilities assumed (32,638)Fair value of net assets acquired 80,332Goodwill 211,452Redeemable noncontrolling interest (Note 12) (90,128)
$ 201,656____________________________________________
(1) Since the initial preliminary purchase price allocation, the Company has made purchase price allocation adjustments for an increase in the purchase consideration of $2.9 million, of which $2.0 million represents additional cash consideration as a result of finalizing the valuation of working capital acquired pursuant to the terms of the purchase agreement, and $0.9 million from finalizing the valuation of the Company's shares issued. These adjustments resulted in a decrease to accounts receivable of $0.5 million, increase to intangible assets of $0.2 million, decrease to other liabilities assumed of $4.2 million and an increase in redeemable noncontrolling interest of $1.6 million resulting in a net increase of $0.6 million to goodwill. These adjustments had no material impact on the consolidated statement of income.
Goodwill of $211.5 million represents the excess of the purchase price over the preliminary estimate of the fair value of the underlying tangible and identifiable intangible assets acquired and liabilities assumed. The acquisition goodwill arises from the opportunity for synergies of the combined companies to grow and diversify the Company's television operations by adding nonfiction programming to complement its existing scripted production and syndication operations and leverage the strength of the Company's global distribution infrastructure. The goodwill recorded as part of this acquisition is included in the Television Production segment. Although the goodwill will not be amortized for financial reporting purposes, it is anticipated that substantially all of the goodwill will be deductible for federal tax purposes over the statutory period of 15 years. The noncompete agreements and trade name have a weighted average estimated useful life of eight years.
The following unaudited pro forma condensed consolidated statements of income presented below illustrate the results of operations of the Company as if the acquisition of Pilgrim Studios as described above occurred on April 1, 2014. The information below is based on a preliminary estimate of the purchase price allocation to the assets and liabilities acquired. The statements of income information below includes the statements of income of Pilgrim Studios for the years ended December 31, 2015 and 2014 combined with the Company's statements of income for the years ended March 31, 2016 and 2015.
Year Ended March 31,2016 2015
(Amounts in thousands, except pershare amounts)
Revenues $ 2,468,062 $ 2,537,694Net income attributable to Lions Gate Entertainment Corp. shareholders $ 52,777 $ 178,691Basic Net Income Per Common Share attributable to Lions Gate Entertainment Corp.shareholders $ 0.35 $ 1.27Diluted Net Income Per Common Share attributable to Lions Gate Entertainment Corp.shareholders $ 0.34 $ 1.20
The unaudited pro forma condensed consolidated statements of income do not include adjustments for any restructuring activities, operating efficiencies or cost savings, and exclude certain one-time transactional costs of $7.7 million attributable to the noncontrolling shareholder (see Note 12) expensed in connection with the transaction, as well as $3.4 million of acquisition-related costs that were expensed in general and administrative expenses.

LIONS GATE ENTERTAINMENT CORP.
NOTES TO AUDITED CONSOLIDATED FINANCIAL STATEMENTS — (Continued)
F-31
Goodwill. The changes in the carrying amount of goodwill by reporting segment in the years ended March 31, 2016 and 2015 were as follows:
MotionPictures
TelevisionProduction Total
(Amounts in thousands)
Balance as of March 31, 2014 and 2015 $ 294,367 $ 28,961 $ 323,328Acquisition of Pilgrim Studios — 210,815 210,815Measurement period adjustments for Pilgrim Studios — 637 637
Balance as of March 31, 2016 $ 294,367 $ 240,413 $ 534,780
12. Redeemable Noncontrolling Interests
In connection with the acquisition of a controlling interest in Pilgrim Studios on November 12, 2015, the Company recorded a redeemable noncontrolling interest of $90.1 million, representing 37.5% of Pilgrim Studios. The noncontrolling interest holder has a right to put and the Company has a right to call a portion of the noncontrolling interest, equal to 17.5% of Pilgrim Studios, at fair value, subject to a cap, exercisable five years after the acquisition date of November 12, 2015. In addition, the noncontrolling interest holder has a right to put and the Company has a right to call the remaining amount of noncontrolling interest at fair value, subject to a cap, exercisable seven years after the acquisition date of November 12, 2015. The put and call options have been determined to be embedded in the noncontrolling interest, and because the put rights are outside the control of the Company and require partial cash settlement, the noncontrolling interest holder's interest is presented as redeemable noncontrolling interest outside of shareholders' equity on the Company's unaudited condensed consolidated balance sheet.
In addition, the noncontrolling interest holder is the President and CEO of Pilgrim Studios, who will continue in this role pursuant to an employment contract entered into at the time of closing. Pursuant to the operating agreement, if the employment of the noncontrolling interest holder is terminated before certain dates, under certain circumstances as defined in the operating agreement, the Company can call and the noncontrolling interest holder can put the noncontrolling interest at a discount to fair value. The amount of the discount related to the 17.5% noncontrolling interest is being expensed through the five-year call period, and the portion of the discount related to the remaining noncontrolling interest is being expensed over the seven-year call period. The amounts are included in general and administrative expense of Pilgrim Studios and reflected as an addition to redeemable noncontrolling interest.
Redeemable noncontrolling interest is measured at the greater of (i) the redemption amount that would be paid if settlement occurred at the balance sheet date less the amount attributed to unamortized noncontrolling interest discount, as discussed above, or (ii) the historical value resulting from the original acquisition date value plus or minus any earnings or loss attribution, plus the amount of unamortized noncontrolling interest discount as discussed above. The amount of the redemption value in excess of the historical values of the noncontrolling interest, if any, is recognized as an increase to noncontrolling interest and a charge to retained earnings.
The table below presents the reconciliation of changes in redeemable noncontrolling interest:
Year EndedMarch 31,
2016(Amounts inthousands)
Beginning balance $ —Initial fair value of redeemable noncontrolling interest 90,128Net loss of Pilgrim Studios attributable to noncontrolling interest (7,509)Noncontrolling interest discount accretion 2,030Adjustments to redemption value 5,876Ending balance $ 90,525

LIONS GATE ENTERTAINMENT CORP.
NOTES TO AUDITED CONSOLIDATED FINANCIAL STATEMENTS — (Continued)
F-32
The net loss of Pilgrim Studios attributable to noncontrolling interest includes certain transactional costs of $7.7 million of Pilgrim Studios attributable to the noncontrolling shareholder (see Note 11). These costs are included in the general and administrative expense of Pilgrim Studios, however, pursuant to the profit sharing provisions in the operating agreement, the amount is included in net loss attributable to noncontrolling interest in our consolidated statement of income and thus does not impact earnings per share attributable to Lions Gate Entertainment Corp. shareholders.
13. Capital Stock
(a) Common Shares
The Company had 500 million authorized common shares at March 31, 2016 and March 31, 2015. The table below outlines common shares reserved for future issuance:
March 31,2016
March 31,2015
(Amounts in thousands)
Stock options outstanding, average exercise price $24.55 (March 31, 2015 - $22.22) 15,332 12,215Restricted share units — unvested 1,647 1,662Share purchase options and restricted share units available for future issuance 2,093 7,163Shares issuable upon conversion of April 2009 3.625% Notes at conversion price of $8.15per share at March 31, 2015 — 1,984Shares issuable upon conversion of January 2012 4.00% Notes at conversion price of $10.26per share (March 31, 2015 - $10.38) 4,079 4,032Shares issuable upon conversion of April 2013 1.25% Notes at conversion price of $29.32per share (March 31, 2015 - $29.65) 2,046 2,024Shares reserved for future issuance 25,197 29,080
(b) Share Repurchases
Share Repurchase Plan. On December 17, 2013, our Board of Directors authorized the Company to increase our previously announced share repurchase plan from a total authorization of $150 million to $300 million, and on February 2, 2016, our Board of Directors authorized the Company to further increase its share repurchase plan to $468 million. For the years ended March 31, 2016, 2015 and 2014, the common shares repurchased under the Company's share repurchase plan were as follows:
Fiscal Year Ended Shares Repurchased
AggregateCost ofShares
Weighted Average RepurchasePrice Per Share
(in thousands)
March 31, 2016 3,600,395 $ 73,180 $20.33March 31, 2015 5,026,512 136,501 $27.16March 31, 2014 315,706 8,339 $26.41
Total from December 17, 2013 authorization 8,942,613 $ 218,020 $24.38
Prior to the year ended March 31, 2013, the Company repurchased 6,787,310 common shares at a cost of approximately $65.2 million. To date, approximately $283.2 million of the Company's common shares have been repurchased, leaving approximately $184.7 million of authorized potential purchases.
(c) Dividends
During fiscal years 2016, 2015 and 2014, the Company's Board of Directors declared the following quarterly cash dividends (first quarterly cash dividend declared during the third quarter ended December 31, 2013):
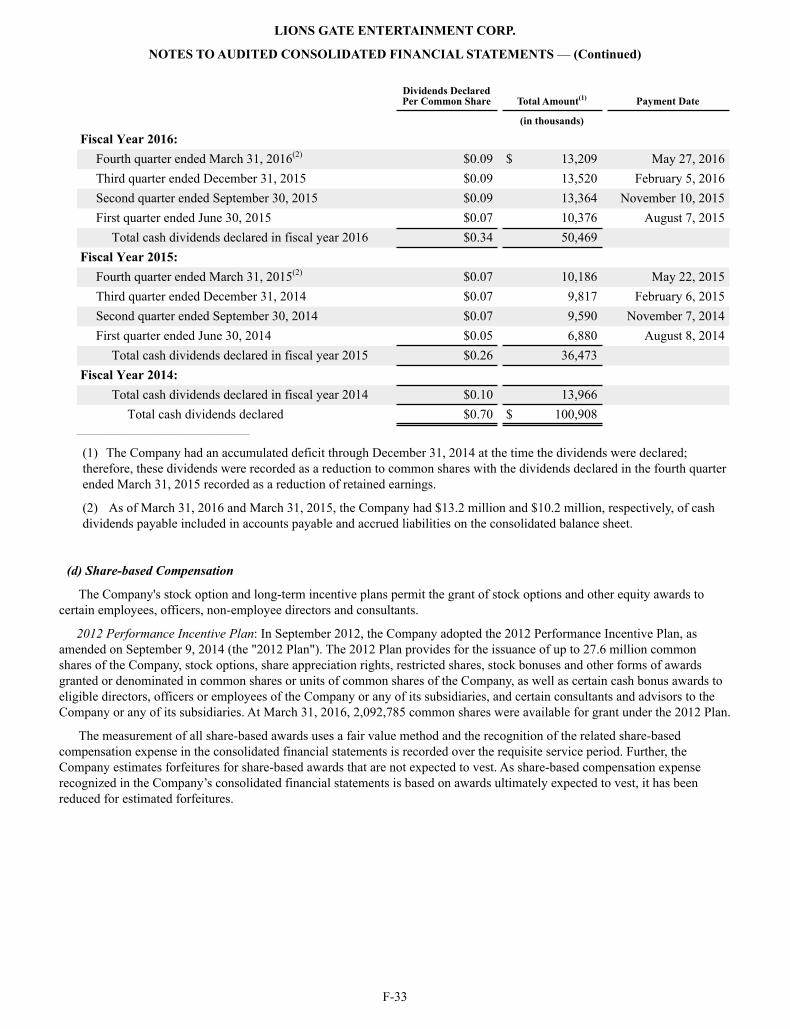
LIONS GATE ENTERTAINMENT CORP.
NOTES TO AUDITED CONSOLIDATED FINANCIAL STATEMENTS — (Continued)
F-33
Dividends DeclaredPer Common Share Total Amount(1) Payment Date
(in thousands)
Fiscal Year 2016:Fourth quarter ended March 31, 2016(2) $0.09 $ 13,209 May 27, 2016Third quarter ended December 31, 2015 $0.09 13,520 February 5, 2016Second quarter ended September 30, 2015 $0.09 13,364 November 10, 2015First quarter ended June 30, 2015 $0.07 10,376 August 7, 2015
Total cash dividends declared in fiscal year 2016 $0.34 50,469Fiscal Year 2015:
Fourth quarter ended March 31, 2015(2) $0.07 10,186 May 22, 2015Third quarter ended December 31, 2014 $0.07 9,817 February 6, 2015Second quarter ended September 30, 2014 $0.07 9,590 November 7, 2014First quarter ended June 30, 2014 $0.05 6,880 August 8, 2014
Total cash dividends declared in fiscal year 2015 $0.26 36,473Fiscal Year 2014:
Total cash dividends declared in fiscal year 2014 $0.10 13,966Total cash dividends declared $0.70 $ 100,908
____________________________________________
(1) The Company had an accumulated deficit through December 31, 2014 at the time the dividends were declared; therefore, these dividends were recorded as a reduction to common shares with the dividends declared in the fourth quarter ended March 31, 2015 recorded as a reduction of retained earnings.
(2) As of March 31, 2016 and March 31, 2015, the Company had $13.2 million and $10.2 million, respectively, of cash dividends payable included in accounts payable and accrued liabilities on the consolidated balance sheet.
(d) Share-based Compensation
The Company's stock option and long-term incentive plans permit the grant of stock options and other equity awards to certain employees, officers, non-employee directors and consultants.
2012 Performance Incentive Plan: In September 2012, the Company adopted the 2012 Performance Incentive Plan, as amended on September 9, 2014 (the "2012 Plan"). The 2012 Plan provides for the issuance of up to 27.6 million common shares of the Company, stock options, share appreciation rights, restricted shares, stock bonuses and other forms of awards granted or denominated in common shares or units of common shares of the Company, as well as certain cash bonus awards to eligible directors, officers or employees of the Company or any of its subsidiaries, and certain consultants and advisors to the Company or any of its subsidiaries. At March 31, 2016, 2,092,785 common shares were available for grant under the 2012 Plan.
The measurement of all share-based awards uses a fair value method and the recognition of the related share-based compensation expense in the consolidated financial statements is recorded over the requisite service period. Further, the Company estimates forfeitures for share-based awards that are not expected to vest. As share-based compensation expense recognized in the Company’s consolidated financial statements is based on awards ultimately expected to vest, it has been reduced for estimated forfeitures.

LIONS GATE ENTERTAINMENT CORP.
NOTES TO AUDITED CONSOLIDATED FINANCIAL STATEMENTS — (Continued)
F-34
The Company recognized the following share-based compensation expense during the years ended March 31, 2016, 2015, and 2014:
Year Ended March 31,2016 2015 2014
(Amounts in thousands)
Compensation Expense:Stock Options $ 31,015 $ 33,452 $ 22,514Restricted Share Units and Other Share-based Compensation 47,163 42,831 33,221Share Appreciation Rights 287 4,027 16,384
78,465 80,310 72,119Impact of accelerated vesting on stock options and restricted share units(1) — 1,194 —Total share-based compensation expense $ 78,465 $ 81,504 $ 72,119
Tax impact(2) (28,632) (29,676) (26,684)Reduction in net income $ 49,833 $ 51,828 $ 45,435
____________________________(1) Represents the impact of the acceleration of certain vesting schedules for stock options and restricted share units pursuant
to the severance arrangements related to the integration of the marketing operations of the Company's Lionsgate and Summit film labels.
(2) Represents the income tax benefit recognized in the statements of income for share-based compensation arrangements.
Stock Options
A summary of option and equity-settled share appreciation rights activity under the various plans as of March 31, 2016, 2015 and 2014 and changes during the years then ended is presented below:
Number of
Weighted-AverageExercise
WeightedAverage
RemainingContractual
AggregateIntrinsic
Value as ofMarch 31,
Options: Shares Price Term In Years 2016
Outstanding at April 1, 2013 8,021,382 $ 12.87 Granted 4,955,889 29.40 CSARs converted to options 733,334 7.56 Exercised (1,598,035) 9.86 Forfeited or expired (18,560) 15.68
Outstanding at March 31, 2014 12,094,010 $ 19.70 Granted 1,765,809 29.49 Exercised (609,160) 14.39 Forfeited or expired (35,963) 17.69
Outstanding at March 31, 2015 13,214,696 $ 21.26 Granted 3,538,346 31.50 Exercised (640,008) 13.01 Forfeited or expired (19,138) 26.54
Outstanding at March 31, 2016 16,093,896 $ 23.83 5.94 $ 54,088,481Outstanding as of March 31, 2016, vested or expected to vest inthe future 16,002,844 $ 23.82 5.92 $ 54,067,625Exercisable at March 31, 2016 8,840,250 $ 19.00 4.80 $ 50,968,223

LIONS GATE ENTERTAINMENT CORP.
NOTES TO AUDITED CONSOLIDATED FINANCIAL STATEMENTS — (Continued)
F-35
The fair value of each option award is estimated on the date of grant using a closed-form option valuation model (Black-Scholes). The following table presents the weighted average grant-date fair value of options granted in the years ended March 31, 2016, 2015 and 2014, and the weighted average applicable assumptions used in the Black-Scholes option-pricing model for stock options granted during the years then ended:
Year Ended March 31,2016 2015 2014
Weighted average fair value of grants $7.64 $10.49 $12.38Weighted average assumptions:
Risk-free interest rate(1) 0.9% - 1.9% 0.3% - 2.0% 0.4% - 2.7%Expected option lives (in years)(2) 3 - 6 years 1 - 6 years 2 - 8 yearsExpected volatility for options(3) 35% 35% - 38% 38% - 45%Expected dividend yield(4) 0.8% - 1.8% 0.8% - 1.0% 0.0% - 0.8%
____________________________(1) The risk-free rate assumed in valuing the options is based on the U.S. Treasury Yield curve in effect applied against the
expected term of the option at the time of the grant.(2) The expected term of options granted represents the period of time that options granted are expected to be outstanding.(3) Expected volatilities are based on implied volatilities from traded options on the Company’s stock, historical volatility of
the Company’s stock and other factors. (4) The expected dividend yield is estimated by dividing the expected annual dividend by the market price of the Company's
stock at the date of grant.
The total intrinsic value of options exercised as of each exercise date during the year ended March 31, 2016 was $15.6 million (2015 — $11.2 million, 2014— $28.0 million).
During the year ended March 31, 2016, 93,210 shares (2015 — 70,243 shares, 2014 — 143,912 shares) were cancelled to fund withholding tax obligations upon exercise of options.
Restricted Share Units
A summary of the status of the Company’s restricted share units as of March 31, 2016, 2015 and 2014, and changes during the years then ended is presented below:
Restricted Share Units:Number of
Shares
WeightedAverage
Grant DateFair Value
Outstanding at April 1, 2013 2,076,801 $ 13.61Granted 1,455,754 28.50Vested (1,358,856) 14.24Forfeited (34,524) 11.04
Outstanding at March 31, 2014 2,139,175 $ 23.38Granted 901,611 29.55Vested (1,360,524) 22.05Forfeited (18,234) 19.41
Outstanding at March 31, 2015 1,662,028 $ 28.10Granted 1,461,521 32.36Vested (1,438,207) 28.22Forfeited (37,910) 30.36
Outstanding at March 31, 2016 1,647,432 $ 31.74
The fair values of restricted share units are determined based on the market value of the shares on the date of grant.

LIONS GATE ENTERTAINMENT CORP.
NOTES TO AUDITED CONSOLIDATED FINANCIAL STATEMENTS — (Continued)
F-36
The following table summarizes the total remaining unrecognized compensation cost as of March 31, 2016 related to non-vested stock options and restricted share units and the weighted average remaining years over which the cost will be recognized:
TotalUnrecognizedCompensation
Cost
WeightedAverage
RemainingYears
(Amounts inthousands)
Stock Options $ 45,486 1.4Restricted Share Units 30,717 1.8Total $ 76,203
Under the Company’s stock option and long term incentive plans, the Company withholds shares to satisfy minimum statutory federal, state and local tax withholding obligations arising from the vesting of restricted share units. During the year ended March 31, 2016, 636,136 shares (2015 — 615,111 shares, 2014 — 577,399 shares) were withheld upon the vesting of restricted share units.
The Company becomes entitled to an income tax deduction in an amount equal to the taxable income reported by the holders of the stock options and restricted share units when vesting or exercise occurs, the restrictions are released and the shares are issued. Restricted share units are forfeited if the employees are terminated prior to vesting.
There were no excess tax benefits realized from tax deductions associated with option exercises and RSU activity for the year ended March 31, 2016 (2015 and 2014 — nil).
Cash-Settled Share-Appreciation Rights
A summary of the status of the Company’s cash-settled share-appreciation rights ("CSARs") as of March 31, 2016, 2015 and 2014, and changes during the years then ended is presented below:
Cash-Settled Share-Appreciation RightsNumber of
Shares
Weighted-Average
Exercise Price
WeightedAverage
Grant DateFair Value
Outstanding at March 31, 2013 958,334 $ 7.04 $ 17.02Granted — — —Exercised (150,000) 5.45 32.16CSARs converted to options (733,334) 7.56 27.52
Outstanding at March 31, 2014 75,000 $ 5.17 $ 21.56Granted — — —Exercised (75,000) 5.17 27.91
Outstanding at March 31, 2015 and March 31, 2016 — $ — $ —
CSARs require that upon their exercise, the Company pay the holder the excess of the market value of the Company's common stock at the time over the exercise price of the CSAR multiplied by the number of CSARs exercised. During the year ended March 31, 2016, there were no CSAR exercises. During the years ended March 31, 2015 and March 31, 2014, the Company paid $1.7 million and $4.0 million, respectively, for the exercise of CSAR shares.
Other Share-Based Compensation
Pursuant to the terms of certain employment agreements, during the year ended March 31, 2016, the Company granted the equivalent of $1.3 million (2015 - $1.7 million; 2014 - $2.0 million) in common shares to certain employees through the term of their employment contracts, which were recorded as compensation expense in the applicable period. Pursuant to this arrangement, for the year ended March 31, 2016, the Company issued 19,578 shares (2015 - 32,503 shares; 2014 - 34,638 shares), net of shares withheld to satisfy minimum tax withholding obligations.

LIONS GATE ENTERTAINMENT CORP.
NOTES TO AUDITED CONSOLIDATED FINANCIAL STATEMENTS — (Continued)
F-37
14. Income Taxes
The components of pretax income, net of intercompany eliminations, are as follows:
Year Ended March 31,2016 2015 2014
(Amounts in thousands)
United States $ (244,178) $ 67,423 $ 122,464International 210,351 145,985 62,496 $ (33,827) $ 213,408 $ 184,960
The Company’s current and deferred income tax provision (benefits) are as follows:
Year Ended March 31,2016 2015 2014
Current provision (benefit): (Amounts in thousands)
Federal $ 6,217 $ 12,000 $ 9,694States 2,480 630 2,366International (155) 5,063 4,950
Total current provision $ 8,542 $ 17,693 $ 17,010Deferred provision (benefit):
Federal $ (77,399) $ 12,335 $ 22,417States (7,632) 3,415 1,784International (38) (1,816) (8,288)
Total deferred provision (benefit) (85,069) 13,934 15,913Total provision (benefit) for income taxes $ (76,527) $ 31,627 $ 32,923
The differences between income taxes expected at U.S. statutory income tax rates and the income tax provision are as set forth below:
Year Ended March 31,2016 2015 2014
(Amounts in thousands)
Income taxes computed at Federal statutory rate of 35% $ (11,840) $ 74,693 $ 64,736Foreign affiliate dividends (59,448) (44,715) (13,027)Foreign and provincial operations subject to different income tax rates (7,142) (1,830) (283)State income tax (3,809) 1,432 3,304Permanent differences 6,583 3,074 (7,618)Other (871) (1,027) (2,159)Increase (decrease) in valuation allowance — — (12,030)
$ (76,527) $ 31,627 $ 32,923
For the years ended March 31, 2014, 2015, and 2016, the tax provision includes a favorable permanent book-tax difference in our Canadian jurisdiction for certain foreign affiliate dividends. Canadian tax law permits such dividends to be received without being subject to tax.
For the year ended March 31, 2014, the tax provision included a discrete benefit of $12.0 million from the reversal of a valuation allowance against the Company's net deferred tax assets in the Canadian tax jurisdiction and other discrete items.
Although the Company is incorporated under Canadian law, the majority of its global operations are currently subject to tax in the U.S. As a result, the Company believes it is more appropriate to use the U.S. Federal statutory rate in its reconciliation of the statutory rate to its reported income tax rate.

LIONS GATE ENTERTAINMENT CORP.
NOTES TO AUDITED CONSOLIDATED FINANCIAL STATEMENTS — (Continued)
F-38
The income tax effects of temporary differences between the book value and tax basis of assets and liabilities are as follows:
March 31, 2016 March 31, 2015 (Amounts in thousands)
Deferred tax assets: Net operating losses $ 77,787 $ 17,273Foreign tax credits 44,672 40,371Investment in film and television obligations 93,699 70,338Accounts payable 42,235 33,687Other assets 27,535 17,538Reserves 17,077 13,070
Total deferred tax assets 303,005 192,277Valuation allowance (10,103) (9,284)Deferred tax assets, net of valuation allowance 292,902 182,993Deferred tax liabilities:
Liabilities — —Accounts receivable (140,941) (113,026)Subordinated notes (1,728) (2,849)Other (15,812) (17,004)
Total deferred tax liabilities $ (158,481) $ (132,879)
Net deferred tax assets $ 134,421 $ 50,114
The Company has recorded valuation allowances for certain deferred tax assets, which are primarily related to state credits and unrealized capital losses in Canada recorded through other comprehensive income, as sufficient uncertainty exists regarding the future realization of these assets.
At March 31, 2016, the Company had U.S. net operating loss carryforwards of approximately $285.2 million available to reduce future federal income taxes which expire beginning in 2028 through 2036. At March 31, 2016, the Company had state net operating loss carryforwards of approximately $254.1 million available to reduce future state income taxes which expire in varying amounts beginning 2024. At March 31, 2016, the Company had Canadian loss carryforwards of $22.5 million which will expire beginning in 2034. At March 31, 2016, the Company had U.K. loss carryforwards of $6.7 million which do not expire. In addition, at March 31, 2016, we had U.S. credit carryforwards related to foreign taxes paid of approximately $44.7 million to offset future federal income taxes that will expire beginning in 2021.
Approximately $133.8 million of net operating loss carryforwards consist of excess tax benefits. An excess tax benefit occurs when the actual tax deduction in connection with a share-based award exceeds the compensation cost expensed for the award. The Company recognizes excess tax benefits associated with the exercise of stock options and vesting of restricted share units directly to shareholders’ equity only when realized. Accordingly, deferred tax assets are not recognized for net operating loss carryforwards resulting from excess tax benefits. At March 31, 2016, deferred tax assets do not include the tax effect of $133.8 million of loss carryovers from these excess tax benefits.

LIONS GATE ENTERTAINMENT CORP.
NOTES TO AUDITED CONSOLIDATED FINANCIAL STATEMENTS — (Continued)
F-39
The following table summarizes the changes to the gross unrecognized tax benefits for the years ended March 31, 2016, 2015, and 2014:
Amounts
in millions
Gross unrecognized tax benefits at March 31, 2013 $ 0.9Increases related to prior year tax positions 2.2Decreases related to prior year tax positions (0.9)Settlements —Lapse in statute of limitations —
Gross unrecognized tax benefits at March 31, 2014 2.2Increases related to prior year tax positions 2.3Decreases related to prior year tax positions —Settlements —Lapse in statute of limitations —
Gross unrecognized tax benefits at March 31, 2015 4.5Increases related to prior year tax positions —Decreases related to prior year tax positions —Settlements —Lapse in statute of limitations —
Gross unrecognized tax benefits at March 31, 2016 $ 4.5
For the years ended March 31, 2016, 2015, and 2014, interest and penalties were not significant. The Company is subject to taxation in the U.S. and various state and foreign jurisdictions. With a few exceptions, the Company is subject to income tax examination by U.S. and state tax authorities for the fiscal years ended March 31, 2008 and forward. However, to the extent allowed by law, the taxing authorities may have the right to examine prior periods where net operating losses (“NOLs”) were generated and carried forward, and make adjustments up to the amount of the NOLs. The Company is not currently subject to examination by the U.K. or Canada tax authorities. Currently, audits are occurring in federal and various state and local tax jurisdictions.
The total amount of unrecognized tax benefits as of March 31, 2015 and March 31, 2016 that, if realized, would affect the Company's effective tax rate are $2.9 million.
Any changes to unrecognized tax benefits recorded as of March 31, 2016 that are reasonably possible to occur within the next 12 months are not expected to be material.
15. Government Assistance
Tax credits earned for film and television production activity for the year ended March 31, 2016 totaled $156.1 million (2015 — $208.2 million; 2014 — $82.0 million) and are recorded as a reduction of the cost of the related film and television program. Accounts receivable at March 31, 2016 includes $257.1 million with respect to tax credits receivable (2015 — $219.2 million).
The Company is subject to routine inquiries and review by regulatory authorities of its various incentive claims which have been received or are receivable. Such inquiries have not resulted in material adjustments.

LIONS GATE ENTERTAINMENT CORP.
NOTES TO AUDITED CONSOLIDATED FINANCIAL STATEMENTS — (Continued)
F-40
16. Segment Information
The Company’s reportable segments are determined based on the distinct nature of their operations and each segment is a strategic business unit that offers different products and services and is managed separately. The Company has two reportable business segments as of March 31, 2016: Motion Pictures and Television Production.
Motion Pictures consists of the development and production of feature films, acquisition of North American and worldwide distribution rights, North American theatrical, home entertainment and television distribution of feature films produced and acquired, and worldwide licensing of distribution rights to feature films produced and acquired.
Television Production consists of the development, production and worldwide distribution of television productions including television series, television movies and mini-series and non-fiction programming.
Segment information by business unit is as follows:
Year Ended March 31,2016 2015 2014
(Amounts in thousands)
Segment revenuesMotion Pictures $ 1,677,482 $ 1,820,149 $ 2,182,902Television Production 669,937 579,491 447,352
$ 2,347,419 $ 2,399,640 $ 2,630,254Gross segment contribution
Motion Pictures $ 184,308 $ 449,760 $ 491,779Television Production 103,998 55,123 29,633
$ 288,306 $ 504,883 $ 521,412Segment general and administration
Motion Pictures $ 80,952 $ 73,501 $ 66,768Television Production 19,783 13,346 12,747
$ 100,735 $ 86,847 $ 79,515Segment profit
Motion Pictures $ 103,356 $ 376,259 $ 425,011Television Production 84,215 41,777 16,886
$ 187,571 $ 418,036 $ 441,897
Gross segment contribution is defined as segment revenue less segment direct operating and distribution and marketing expenses, and excludes purchase accounting and related adjustments, start-up costs of new business initiatives, non-cash imputed interest charge, and backstopped prints and advertising ("P&A") expense. Gross segment contribution amounts for fiscal 2015 reflect the reclassification of $12.5 million of backstopped prints and advertising expense from Motion Pictures distribution and marketing expenses in order to be consistent with the current fiscal year presentation (2014 - none).
Segment profit is defined as gross segment contribution less segment general and administration expenses. The reconciliation of total segment profit to the Company's income (loss) before income taxes is as follows:

LIONS GATE ENTERTAINMENT CORP.
NOTES TO AUDITED CONSOLIDATED FINANCIAL STATEMENTS — (Continued)
F-41
Year Ended March 31,2016 2015 2014
(Amounts in thousands)
Company’s total segment profit $ 187,571 $ 418,036 $ 441,897Share-based compensation expense (78,465) (80,310) (72,119)Restructuring and other items(1) (19,834) (10,725) (7,500)Non-cash imputed interest charge(2) (5,270) — —Purchase accounting and related adjustments(3) (8,430) — —Start-up losses of new business initiatives(4) (10,017) — —Backstopped prints and advertising expense(5) (997) (12,509) —General and administrative expenses for corporate and shared services (76,504) (85,625) (95,791)Depreciation and amortization (13,084) (6,586) (6,539)
Operating income (loss) (25,030) 222,281 259,948Interest expense (54,879) (52,476) (66,170)Interest and other income 1,851 2,790 6,030Loss on extinguishment of debt — (11,664) (39,572)Equity interests income 44,231 52,477 24,724
Income (loss) before income taxes $ (33,827) $ 213,408 $ 184,960
____________________________(1) Restructuring and other items includes restructuring and severance charges, certain transaction related costs, the settlement
of an administrative order, and certain unusual items when applicable.
Amounts in the year ended March 31, 2016 represent professional fees associated with certain strategic transactions including, among others, the acquisition of Pilgrim Studios and certain shareholder transactions, and certain transactional costs of $7.7 million of Pilgrim Studios attributable to the noncontrolling interest shareholder (see Note 11). Pursuant to the profit sharing provisions in the Pilgrim Studios operating agreement, the transactional costs of $7.7 million are included in net loss attributable to noncontrolling interest in the consolidated statement of income and thus does not impact earnings per share attributable to Lions Gate Entertainment Corp. shareholders. In addition, amounts in the year ended March 31, 2016 include pension withdrawal costs of $2.7 million related to an underfunded multi-employer pension plan in which the Company is no longer participating.
Amounts in the year ended March 31, 2015 primarily represent costs related to the move of our international sales and distribution organization to the United Kingdom, and severance costs associated with the integration of the marketing operations of our Lionsgate and Summit film labels, of which approximately $1.2 million are non-cash charges resulting from the acceleration of vesting of stock awards (see Note 13). In addition, the year ended March 31, 2015 includes transaction costs related to a certain shareholder transaction (see Note 22), and costs related to the Starz Exchange transaction (see Note 5).
Amounts in the year ended March 31, 2014 represent the settlement of an administrative order. (2) Non-cash imputed interest charge represents a charge associated with the interest cost of long-term accounts receivable for
Television Production licensed product that become due beyond one-year.(3) Purchase accounting and related adjustments represent the incremental amortization expense associated with the non-cash
fair value adjustments on television assets of $6.5 million included in direct operating expense resulting from the application of purchase accounting and the charge of $1.9 million included in general and administrative expense related to the accretion of the noncontrolling interest discount (see Note 12).
(4) Start-up losses of new business initiatives represent losses associated with the Company's direct to consumer initiatives including its subscription video-on-demand platforms, of which $4.8 million is included in the Company's consolidated general and administrative expense.
(5) Backstopped P&A represents the amount of theatrical marketing expense for third party titles that the Company funded and expensed for which a third party provides a first dollar loss guarantee (subject to a cap) that such expense will be recouped from the performance of the film (which results in minimal risk of loss to the Company). The amount represents the P&A expense incurred net of the impact of expensing the P&A cost over the revenue streams similar to a participation expense (i.e., the P&A under these arrangements are being expensed similar to a participation cost for purposes of measuring segment profit).

LIONS GATE ENTERTAINMENT CORP.
NOTES TO AUDITED CONSOLIDATED FINANCIAL STATEMENTS — (Continued)
F-42
The following table sets forth revenues by media as broken down by segment for the years ended March 31, 2016, 2015, and 2014:
Year Ended March 31,
2016 2015 2014
(Amounts in thousands)
Segment revenues:Motion Pictures
Theatrical $ 314,082 $ 354,050 $ 524,669Home Entertainment 579,802 662,685 829,580Television 205,148 270,214 225,338International 548,200 494,981 543,435Other 30,250 38,219 59,880
Total Motion Pictures revenues $ 1,677,482 $ 1,820,149 $ 2,182,902Television Production
Domestic Television 415,486 415,204 326,061International 190,208 112,385 82,295Home Entertainment 60,231 44,796 34,296Other 4,012 7,106 4,700
Total Television Production revenues $ 669,937 $ 579,491 $ 447,352Total revenues $ 2,347,419 $ 2,399,640 $ 2,630,254
The following table sets forth significant assets as broken down by segment and other unallocated assets as of March 31, 2016 and March 31, 2015:
March 31, 2016 March 31, 2015
MotionPictures
TelevisionProduction Total
MotionPictures
TelevisionProduction Total
(Amounts in thousands)
Significant assets by segmentAccounts receivable $ 557,532 $ 491,757 $ 1,049,289 $ 538,515 $ 353,365 $ 891,880Investment in films and televisionprograms, net 1,092,365 385,931 1,478,296 1,116,909 264,920 1,381,829Goodwill 294,367 240,413 534,780 294,367 28,961 323,328
$ 1,944,264 $ 1,118,101 $ 3,062,365 $ 1,949,791 $ 647,246 $ 2,597,037Other unallocated assets (primarilycash, other assets, and investments) 793,143 695,052Total assets $ 3,855,508 $ 3,292,089
The following table sets forth acquisition of investment in films and television programs as broken down by segment for the years ended March 31, 2016, 2015, and 2014:

LIONS GATE ENTERTAINMENT CORP.
NOTES TO AUDITED CONSOLIDATED FINANCIAL STATEMENTS — (Continued)
F-43
Year Ended March 31,
2016 2015 2014
(Amounts in thousands)
Acquisition of investment in films and television programsMotion Pictures $ 639,875 $ 688,555 $ 597,083Television Production 426,528 323,739 350,999
$ 1,066,403 $ 1,012,294 $ 948,082
Purchases of property and equipment amounted to $18.4 million, $17.0 million and $8.8 million for the years ended March 31, 2016, 2015, and 2014, respectively, all primarily pertaining to purchases for the Company’s corporate headquarters.
Revenue by geographic location, based on the location of the customers, with no other foreign country individually comprising greater than 10% of total revenue, is as follows:
Year Ended March 31,2016 2015 2014
(Amounts in thousands)
Canada $ 55,080 $ 68,969 $ 68,599United States 1,550,207 1,712,087 1,917,615Other foreign 742,132 618,584 644,040 $ 2,347,419 $ 2,399,640 $ 2,630,254
Tangible assets by geographic location are as follows:
March 31,2016
March 31,2015
(Amounts in thousands)
Canada $ 172,574 $ 214,303United States 2,863,075 2,550,713Other foreign 139,308 152,444 $ 3,174,957 $ 2,917,460
Total amount of revenue from one individual customer representing greater than 10% of consolidated revenues for the year ended March 31, 2016 was $290.4 million. No individual customer represented greater than 10% of consolidated revenues for the years ended March 31, 2015 and 2014. Accounts receivable due from one customer was approximately 25% of consolidated gross accounts receivable at March 31, 2016, representing a total amount of gross accounts receivable due from this customer of approximately $272.5 million. At March 31, 2015, accounts receivable due from this customer was approximately 15% of consolidated gross accounts receivable, representing a total amount of gross accounts receivable due from this customer of approximately $144.4 million.
17. Commitments and Contingencies
The following table sets forth our future annual repayment of contractual commitments as of March 31, 2016:

LIONS GATE ENTERTAINMENT CORP.
NOTES TO AUDITED CONSOLIDATED FINANCIAL STATEMENTS — (Continued)
F-44
Year Ended March 31, 2017 2018 2019 2020 2021 Thereafter Total
(Amounts in thousands)Contractual commitments by expectedrepayment date (off-balance sheetarrangements)
Film obligation and production loan commitments(1) $ 290,411 $ 221,842 $ 10,385 $ — $ — $ — $ 522,638Interest payments(2) 34,237 32,563 26,281 20,000 20,000 22,444 155,525Operating lease commitments 14,532 14,183 14,579 14,975 14,912 34,235 107,416Other contractual obligations 71,043 43,212 19,718 6,927 3,650 6,395 150,945
Total future commitments under contractual obligations(3) $ 410,223 $ 311,800 $ 70,963 $ 41,902 $ 38,562 $ 63,074 $ 936,524
____________________________(1) Film obligation commitments include distribution and marketing commitments and minimum guarantee commitments.
Distribution and marketing commitments represent contractual commitments for future expenditures associated with distribution and marketing of films which we will distribute. The payment dates of these amounts are primarily based on the anticipated release date of the film. Minimum guarantee commitments represent contractual commitments related to the purchase of film rights for pictures to be delivered in the future. Production loan commitments represent amounts committed for future film production and development to be funded through production financing and recorded as a production loan liability when incurred. Future payments under these commitments are based on anticipated delivery or release dates of the related film or contractual due dates of the commitment. The amounts include estimated future interest payments associated with the commitment.
(2) Includes cash interest payments on the Company's corporate debt, excluding the interest payments on the senior revolving credit facility as future amounts are not fixed or determinable due to fluctuating balances and interest rates.
(3) Not included in the amounts above are $90.5 million of redeemable noncontrolling interest, as future amounts and timing are subject to a number of uncertainties such that we are unable to make sufficiently reliable estimations of future payments (see Note 12).
Operating Leases. The Company has operating leases for offices and equipment. Certain of the Company's operating leases for its Corporate and United Kingdom offices include certain lease and leasehold improvement incentives. These amounts and the required lease payments are aggregated and amortized on a straight line basis to rent expense over the lease period.
The operating lease for the Company's principal office expires in August 2023. The Company incurred rental expense of $14.2 million during the year ended March 31, 2016 (2015— $13.5 million; 2014 — $10.0 million). The Company earned sublease income of $0.2 million during the year ended March 31, 2016 (2015 — $0.4 million; 2014 — $1.2 million).
Multiemployer Benefit Plans. The Company contributes to various multiemployer pension plans under the terms of collective bargaining agreements that cover its union-represented employees. The Company makes periodic contributions to these plans in accordance with the terms of applicable collective bargaining agreements and laws but does not sponsor or administer these plans. The Company does not participate in any multiemployer benefit plans that are considered to be individually significant, and the largest plans in which the Company participates are funded at a level of 80% or greater. Total contributions made by the Company to multiemployer pension and other benefit plans for the years ended March 31, 2016, 2015 and 2014 were $38.0 million, $20.5 million, and $24.4 million, respectively.
If the Company ceases to be obligated to make contributions or otherwise withdraws from participation in any of these plans, applicable law requires the Company to fund its allocable share of the unfunded vested benefits, which is known as a withdrawal liability. In addition, actions taken by other participating employers may lead to adverse changes in the financial condition of one of these plans, which could result in an increase in the Company's withdrawal liability.
Contingencies. Two purported Lions Gate stockholders initiated legal proceedings in the United States District Court for the Southern District of New York relating to the March 13, 2014 announcement that the Company had entered into an administrative order with the United States Securities and Exchange Commission (the "SEC") that resolved the SEC’s investigation into transactions that the Company announced on July 20, 2010. These actions were captioned Laborers Pension Trust Fund-Detroit & Vicinity v. Lions Gate Entertainment Corp., et al., Case No. 14 CV 5197 (filed July 11, 2014) and Barger v. Lions Gate Entertainment Corp., Case No. 14 CV 5477 (filed July 21, 2014). The actions alleged, among other things, that the Company and certain of its current and former officers and directors violated the federal securities laws by failing to disclose the SEC’s investigation prior to March 13, 2014. On October 28, 2014, the court consolidated the actions under the caption In re Lions Gate Entertainment Corp. Securities Litigation, Case No. 1:14-cv-05197-JGK, and appointed lead plaintiff

LIONS GATE ENTERTAINMENT CORP.
NOTES TO AUDITED CONSOLIDATED FINANCIAL STATEMENTS — (Continued)
F-45
and lead counsel. Lead plaintiff filed a consolidated amended complaint on December 29, 2014 and a second consolidated amended complaint on March 30, 2015. On April 30, 2015, defendants moved to dismiss the action. The court held oral argument on November 5, 2015. On January 22, 2016, the court granted the defendants’ motion to dismiss.
In addition, on May 16, 2014, the Company received a letter from another purported stockholder, Arkansas Teacher Retirement System, demanding that the Company seek to recover damages, including the costs associated with the SEC investigation, and the fine paid, from the directors who were on the Board of Directors (and certain officers) at the time the July 20, 2010 transactions occurred. On August 6, 2014, the Board of Directors created a Special Committee of independent directors (composed of Mr. Frank Giustra and Mr. Gordon Crawford) to consider the demand. On October 1, 2014, the Arkansas Teacher Retirement System filed a petition in the Supreme Court of British Columbia seeking an order granting it leave to prosecute the claims in the name and on behalf of Lions Gate. The Special Committee concluded that commencing an action in British Columbia against the proposed defendants (or any of them) as demanded by the Arkansas Teacher Retirement System would not be in the best interests of the Company, and the Company has taken steps to oppose the petition, including through filing materials in opposition in December 2014 and January 2015. The Arkansas Teacher Retirement System filed materials in reply. The petition was heard on February 1 to 4, 2016. On March 11, 2016, the court found that granting leave to permit a derivative action would not be in the best interests of the Company and dismissed the action.
From time to time, the Company is involved in other claims and legal proceedings arising in the normal course of business. While the resolution of these matters cannot be predicted with certainty, we do not believe, based on current knowledge, that the outcome of any currently pending legal proceedings in which the Company is currently involved will have a material adverse effect on the Company's consolidated financial position, results of operations, or cash flow.
18. Financial Instruments
(a) Credit Risk
Concentration of credit risk with the Company’s customers is limited due to the Company’s customer base and the diversity of its sales throughout the world. The Company performs ongoing credit evaluations and maintains a provision for potential credit losses. The Company generally does not require collateral for its trade accounts receivable. Accounts receivable include amounts receivable from governmental agencies in connection with government assistance for productions as well as amounts due from customers. Amounts receivable from governmental agencies amounted to 24.5% of accounts receivable, net at March 31, 2016 (2015 — 24.7%).
(b) Forward Contracts
The Company enters into forward foreign exchange contracts to hedge its foreign currency exposures on future production expenses denominated in various foreign currencies. As of March 31, 2016, the Company had the following outstanding forward foreign exchange contracts (all outstanding contracts have maturities of less than 24 months from March 31, 2016):
March 31, 2016
Foreign Currency
ForeignCurrencyAmount
US DollarAmount
Weighted AverageExchange Rate Per
$1 USD
(Amounts in
millions)(Amounts in
millions)
British Pound Sterling £17.5 in exchange for $24.7 £0.71Australian Dollar A$56.8 in exchange for $50.6 A$1.12Canadian Dollar C$4.4 in exchange for $2.6 C$1.69
Changes in the fair value representing a net unrealized fair value loss on foreign exchange contracts that qualified as effective hedge contracts outstanding during the year ended March 31, 2016 were losses, net of tax of $0.2 million (2015 - gains, net of tax, of $2.8 million; 2014 - gains, net of tax, of $0.8 million) and are included in accumulated other comprehensive loss, a separate component of shareholders’ equity. Changes in the fair value representing a net unrealized fair value gain on foreign exchange contracts that did not qualify as effective hedge contracts outstanding were $1.3 million during the year ended March 31, 2016 (2015 - $0.4 million and 2014 - nil), and are included in direct operating expenses in the consolidated statements of income. The Company monitors its positions with, and the credit quality of, the financial institutions that are party to its financial transactions.

F-46
As of March 31, 2016, $9.4 million was included in other assets and $0.7 million in accounts payable and accrued liabilities (March 31, 2015 - $8.3 million in other assets and $2.0 million in accounts payable and accrued liabilities) in the accompanying consolidated balance sheets related to the Company's use of foreign currency derivatives. The Company classifies its forward foreign exchange contracts within Level 2 as the valuation inputs are based on quoted prices and market observable data of similar instruments.
During the year ended March 31, 2016, the Company reclassified $3.1 million of gains out of accumulated other comprehensive loss into earnings. As of March 31, 2016, based on the current release schedule, the Company estimates approximately $4.3 million of gains associated with cash flow hedges in accumulated other comprehensive loss to be reclassified into earnings during the one-year period ending March 31, 2017.
19. Supplementary Cash Flow Statement Information
(a) Interest paid during the fiscal year ended March 31, 2016 amounted to $42.7 million (2015 — $38.8 million; 2014 — $63.9 million).
(b) Income taxes paid during the fiscal year ended March 31, 2016 amounted to $10.2 million (2015 — $15.3 million; 2014 — $15.5 million).
The supplemental schedule of non-cash investing and financing activities is presented below:
Year Ended March 31,2016 2015 2014
(Amounts in thousands)
Non-cash investing activities:Issuance of common shares related to Pilgrim Studios acquisition (see Note 11) $ 57,003 $ — $ —Investment in available-for-sale securities (see Note 5) $ — $ 158,916 $ —Investment in cost method investments (see Note 5) $ — $ 12,000 $ —
Non-cash financing activities:Accrued dividends (see Note 13) $ 13,209 $ 10,186 $ 7,066Accrued share repurchases (see Note 13) $ — $ — $ 8,339Conversions of convertible senior subordinated notes (see Note 7) $ 16,162 $ 24,152 $ 27,672

LIONS GATE ENTERTAINMENT CORP.
NOTES TO AUDITED CONSOLIDATED FINANCIAL STATEMENTS — (Continued)
F-47
20. Quarterly Financial Data (Unaudited)
Certain quarterly information is presented below:
FirstQuarter
Second Quarter
Third Quarter
Fourth Quarter
(Amounts in thousands, except per share amounts)
2016 Revenues $ 408,941 $ 476,759 $ 670,522 $ 791,197Operating income (loss) $ 44,165 $ (39,288) $ (9,720) $ (20,187)Net income (loss)(1) $ 40,684 $ (42,069) $ 32,598 $ 11,487Net income (loss) attributable to Lions Gate Entertainment Corp. shareholders(1) $ 40,684 $ (42,069) $ 40,717 $ 10,877Per share information attributable to Lions GateEntertainment Corp. shareholders:Basic income (loss) per share $ 0.28 $ (0.28) $ 0.27 $ 0.07Diluted income (loss) per share $ 0.26 $ (0.28) $ 0.26 $ 0.07
First Quarter
Second Quarter
Third Quarter
FourthQuarter
(Amounts in thousands, except per share amounts)
2015Revenues $ 449,383 $ 552,876 $ 751,299 $ 646,082Operating income $ 47,764 $ 30,488 $ 116,169 $ 27,860Net income(2)(3)(4) $ 43,261 $ 20,781 $ 98,185 $ 19,554Net income attributable to Lions Gate EntertainmentCorp. shareholders $ 43,261 $ 20,781 $ 98,185 $ 19,554Per share information attributable to Lions GateEntertainment Corp. shareholders:Basic income per share $ 0.31 $ 0.15 $ 0.70 $ 0.14Diluted income per share $ 0.30 $ 0.15 $ 0.65 $ 0.14
________________________________________
(1) During the second, third and fourth quarter of fiscal 2016, net income included restructuring and other items, net of tax, of $2.7 million, $11.7 million, and $1.5 million, respectively (see Note 16). For the third quarter of fiscal 2016, net income attributable to Lions Gate Entertainment Corp. shareholders included restructuring and other items, net of tax, of $4.0 million.
(2) During the first, second, third and fourth quarter of fiscal 2015, net income included restructuring and other items, net of tax, of $3.1 million, $0.9 million, $0.5 million, and $3.0 million, respectively (see Note 16).
(3) During the first quarter of fiscal 2015, net income included a gain on sale of equity method investment, net of tax, of $7.2 million (see Note 5).
(4) During the second, third and fourth quarter of fiscal 2015, net income included a loss on extinguishment of debt, net of tax, of $0.4 million, $0.4 million, and $8.1 million, respectively.
21. Consolidating Financial Information — Convertible Senior Subordinated Notes
The January 2012 4.00% Notes and the April 2013 1.25% Notes by their terms, are fully and unconditionally guaranteed by the Company. LGEI, the issuer of the January 2012 4.00% Notes and the April 2013 1.25% Notes that are guaranteed by the Company, is 100% owned by the parent company guarantor, Lions Gate Entertainment Corp.

LIONS GATE ENTERTAINMENT CORP.
NOTES TO AUDITED CONSOLIDATED FINANCIAL STATEMENTS — (Continued)
F-48
The following tables present condensed consolidating financial information as of March 31, 2016 and March 31, 2015, and for the years ended March 31, 2016, 2015 and 2014 for (1) the Company, on a stand-alone basis, (2) LGEI, on a stand-alone basis, (3) the non-guarantor subsidiaries of the Company (including the subsidiaries of LGEI), on a combined basis (collectively, the “Non-guarantor Subsidiaries”) and (4) the Company, on a consolidated basis.
As of March 31, 2016
Lions GateEntertainment
Corp.
Lions GateEntertainment
Inc.Non-guarantor
SubsidiariesConsolidatingAdjustments
Lions GateConsolidated
(Amounts in thousands)BALANCE SHEETAssetsCash and cash equivalents $ 654 $ 28,091 $ 28,997 $ — $ 57,742Restricted cash — 2,906 — — 2,906Accounts receivable, net 676 1,579 1,047,034 — 1,049,289Investment in films and television programs, net — 6,407 1,471,889 — 1,478,296Property and equipment, net — 36,171 7,213 — 43,384Investments 40,072 15,354 408,920 — 464,346Goodwill 10,172 — 524,608 — 534,780Other assets 7,225 56,159 32,357 (5,397) 90,344Deferred tax assets 1,502 121,725 11,194 — 134,421Subsidiary investments and advances 1,598,137 1,504,398 3,094,974 (6,197,509) —
$ 1,658,438 $ 1,772,790 $ 6,627,186 $ (6,202,906) $ 3,855,508Liabilities and Shareholders’ Equity (Deficiency)Senior revolving credit facility $ 161,000 $ — $ — $ — $ 161,0005.25% Senior Notes 225,000 — — — 225,000Term Loan 400,000 — — — 400,000Accounts payable and accrued liabilities 22,165 89,903 265,630 — 377,698Participations and residuals — 3,663 603,695 — 607,358Film obligations and production loans — — 715,360 — 715,360Convertible senior subordinated notes — 100,050 — — 100,050Deferred revenue — 4,833 323,411 — 328,244Intercompany payable — 1,906,899 2,415,792 (4,322,691) —Redeemable noncontrolling interests — — 90,525 — 90,525Shareholders’ equity (deficiency) 850,273 (332,558) 2,212,773 (1,880,215) 850,273
$ 1,658,438 $ 1,772,790 $ 6,627,186 $ (6,202,906) $ 3,855,508

LIONS GATE ENTERTAINMENT CORP.
NOTES TO AUDITED CONSOLIDATED FINANCIAL STATEMENTS — (Continued)
F-49
Year Ended March 31, 2016
Lions GateEntertainment
Corp.
Lions GateEntertainment
Inc.Non-guarantor
SubsidiariesConsolidatingAdjustments
Lions GateConsolidated
(Amounts in thousands) STATEMENT OF INCOMERevenues $ — $ 23,683 $ 2,324,170 $ (434) $ 2,347,419EXPENSES:
Direct operating — 563 1,414,781 — 1,415,344Distribution and marketing — 6,497 655,292 — 661,789General and administration 6,530 159,128 118,123 (1,549) 282,232Depreciation and amortization — 9,284 3,800 — 13,084
Total expenses 6,530 175,472 2,191,996 (1,549) 2,372,449OPERATING INCOME (LOSS) (6,530) (151,789) 132,174 1,115 (25,030)Other expenses (income):
Interest expense 38,609 220,609 175,975 (380,314) 54,879Interest and other income (209,419) (172) (172,056) 379,796 (1,851)Loss on extinguishment of debt — — — — —
Total other expenses (income) (170,810) 220,437 3,919 (518) 53,028INCOME (LOSS) BEFORE EQUITY INTERESTSAND INCOME TAXES 164,280 (372,226) 128,255 1,633 (78,058)Equity interests income (loss) (113,199) 182,694 46,719 (71,983) 44,231INCOME (LOSS) BEFORE INCOME TAXES 51,081 (189,532) 174,974 (70,350) (33,827)Income tax provision (benefit) 872 (76,333) 65,526 (66,592) (76,527)NET INCOME (LOSS) 50,209 (113,199) 109,448 (3,758) 42,700
Less: Net loss attributable to noncontrollinginterests — — — 7,509 7,509
Net income (loss) attributable to Lions GateEntertainment Corp. shareholders $ 50,209 $ (113,199) $ 109,448 $ 3,751 $ 50,209
Year Ended
March 31, 2016
Lions GateEntertainment
Corp.
Lions GateEntertainment
Inc.Non-guarantor
SubsidiariesConsolidatingAdjustments
Lions GateConsolidated
(Amounts in thousands) STATEMENT OF COMPREHENSIVE INCOME(LOSS)NET INCOME (LOSS) 50,209 (113,199) 109,448 (3,758) 42,700Foreign currency translation adjustments, net of tax (3,056) (4,334) (6,457) 10,791 (3,056)Net unrealized loss on available-for-sale securities,net of tax benefit of ($403) (37,643) — (37,643) 37,643 (37,643)Net unrealized gain on foreign exchange contracts,net of tax (193) — (193) 193 (193)COMPREHENSIVE INCOME (LOSS) 9,317 (117,533) 65,155 44,869 1,808
Less: Comprehensive loss attributable tononcontrolling interest — — — 7,509 7,509
Comprehensive income (loss) attributable to LionsGate Entertainment Corp. shareholders $ 9,317 $ (117,533) $ 65,155 $ 52,378 $ 9,317

LIONS GATE ENTERTAINMENT CORP.
NOTES TO AUDITED CONSOLIDATED FINANCIAL STATEMENTS — (Continued)
F-50
Year Ended March 31, 2016
Lions GateEntertainment
Corp.
Lions GateEntertainment
Inc.Non-guarantor
SubsidiariesConsolidatingAdjustments
Lions GateConsolidated
(Amounts in thousands)STATEMENT OF CASH FLOWSNET CASH FLOWS PROVIDED BY (USED IN)OPERATING ACTIVITIES $ (49,146) $ 7,730 $ 22,410 $ — $ (19,006)INVESTING ACTIVITIES:
Investment in equity method investees — (7,863) (8,126) — (15,989)Purchase of Pilgrim Studios, net of cashacquired of $15,816 — — (126,892) — (126,892)Purchases of other investments — (750) — — (750)Purchases of property and equipment — (18,311) (122) — (18,433)
NET CASH FLOWS PROVIDED BY (USED IN)INVESTING ACTIVITIES — (26,924) (135,140) — (162,064)FINANCING ACTIVITIES:
Senior revolving credit facility - borrowings 605,500 — — — 605,500Senior revolving credit facility - repayments (444,500) — — — (444,500)Term Loan - borrowings, net of deferredfinancing costs of $964 24,036 — — — 24,036Convertible senior subordinated notes -repurchases — (5) — — (5)Production loans - borrowings — — 572,572 — 572,572Production loans - repayments — — (483,145) — (483,145)Repurchase of common shares (73,180) — — — (73,180)Dividends paid (47,447) — — — (47,447)Exercise of stock options 6,097 — — — 6,097Tax withholding required on equity awards (24,205) — — — (24,205)
NET CASH FLOWS PROVIDED BY (USED IN)FINANCING ACTIVITIES 46,301 (5) 89,427 — 135,723NET CHANGE IN CASH AND CASHEQUIVALENTS (2,845) (19,199) (23,303) — (45,347)FOREIGN EXCHANGE EFFECTS ON CASH — — 392 — 392CASH AND CASH EQUIVALENTS —BEGINNING OF PERIOD 3,499 47,290 51,908 — 102,697CASH AND CASH EQUIVALENTS — END OFPERIOD $ 654 $ 28,091 $ 28,997 $ — $ 57,742

LIONS GATE ENTERTAINMENT CORP.
NOTES TO AUDITED CONSOLIDATED FINANCIAL STATEMENTS — (Continued)
F-51
As of March 31, 2015
Lions GateEntertainment
Corp.
Lions GateEntertainment
Inc.Non-guarantor
SubsidiariesConsolidatingAdjustments
Lions GateConsolidated
(Amounts in thousands)BALANCE SHEETAssetsCash and cash equivalents $ 3,499 $ 47,290 $ 51,908 $ — $ 102,697Restricted cash — 2,508 — — 2,508Accounts receivable, net 617 7,933 883,330 — 891,880Investment in films and television programs, net — 6,402 1,375,427 — 1,381,829Property and equipment, net — 24,938 1,713 — 26,651Investments 40,072 9,229 388,997 — 438,298Goodwill 10,172 — 313,156 — 323,328Other assets 8,109 61,409 11,180 (5,914) 74,784Deferred tax assets 10,524 32,252 7,338 — 50,114Subsidiary investments and advances 1,385,522 1,378,571 2,571,801 (5,335,894) —
$ 1,458,515 $ 1,570,532 $ 5,604,850 $ (5,341,808) $ 3,292,089Liabilities and Shareholders’ Equity (Deficiency)Senior revolving credit facility $ — $ — $ — $ — $ —5.25% Senior Notes 225,000 — — — 225,000Term Loan 375,000 — — — 375,000Accounts payable and accrued liabilities 16,228 86,472 229,773 — 332,473Participations and residuals — 3,417 468,244 — 471,661Film obligations and production loans — — 656,755 — 656,755Convertible senior subordinated notes — 114,126 — — 114,126Deferred revenue — 7,722 267,065 — 274,787Intercompany payable — 1,530,299 2,547,928 (4,078,227) —Redeemable noncontrolling interests — — — — —Shareholders’ equity (deficiency) 842,287 (171,504) 1,435,085 (1,263,581) 842,287
$ 1,458,515 $ 1,570,532 $ 5,604,850 $ (5,341,808) $ 3,292,089

LIONS GATE ENTERTAINMENT CORP.
NOTES TO AUDITED CONSOLIDATED FINANCIAL STATEMENTS — (Continued)
F-52
Year Ended March 31, 2015
Lions GateEntertainment
Corp.
Lions GateEntertainment
Inc.Non-guarantor
SubsidiariesConsolidatingAdjustments
Lions GateConsolidated
(Amounts in thousands)STATEMENT OF INCOMERevenues $ — $ 29,631 $ 2,370,730 $ (721) $ 2,399,640EXPENSES:
Direct operating — 6,909 1,308,866 — 1,315,775Distribution and marketing — 1,243 590,248 — 591,491General and administration 11,325 159,908 92,754 (480) 263,507Depreciation and amortization — 4,048 2,538 — 6,586
Total expenses 11,325 172,108 1,994,406 (480) 2,177,359OPERATING INCOME (LOSS) (11,325) (142,477) 376,324 (241) 222,281Other expenses (income):
Interest expense 33,830 188,789 134,054 (304,197) 52,476Interest and other income (172,520) (2,881) (131,112) 303,723 (2,790)Loss on extinguishment of debt 6,739 4,925 — — 11,664
Total other expenses (income) (131,951) 190,833 2,942 (474) 61,350INCOME (LOSS) BEFORE EQUITY INTERESTSAND INCOME TAXES 120,626 (333,310) 373,382 233 160,931Equity interests income (loss) 59,327 402,959 52,988 (462,797) 52,477INCOME (LOSS) BEFORE INCOME TAXES 179,953 69,649 426,370 (462,564) 213,408Income tax provision (1,828) 10,322 63,447 (40,314) 31,627NET INCOME (LOSS) 181,781 59,327 362,923 (422,250) 181,781
Less: Net loss attributable to noncontrollinginterests — — — — —
Net income (loss) attributable to Lions GateEntertainment Corp. shareholders $ 181,781 $ 59,327 $ 362,923 $ (422,250) $ 181,781
Year Ended
March 31, 2015
Lions GateEntertainment
Corp.
Lions GateEntertainment
Inc.Non-guarantor
SubsidiariesConsolidatingAdjustments
Lions GateConsolidated
(Amounts in thousands)STATEMENT OF COMPREHENSIVE INCOME(LOSS)NET INCOME (LOSS) 181,781 59,327 362,923 (422,250) 181,781Foreign currency translation adjustments, net of tax (844) (3,554) (1,902) (91) (6,391)Net unrealized gain on available-for-sale securities,net of tax charge of $404 — — 2,705 — 2,705Net unrealized gain (loss) on foreign exchangecontracts, net of tax — — 2,842 — 2,842COMPREHENSIVE INCOME (LOSS) 180,937 55,773 366,568 (422,341) 180,937
Less: Comprehensive loss attributable tononcontrolling interest — — — — —
Comprehensive income (loss) attributable to LionsGate Entertainment Corp. shareholders $ 180,937 $ 55,773 $ 366,568 $ (422,341) $ 180,937

LIONS GATE ENTERTAINMENT CORP.
NOTES TO AUDITED CONSOLIDATED FINANCIAL STATEMENTS — (Continued)
F-53
Year Ended March 31, 2015
Lions GateEntertainment
Corp.
Lions GateEntertainment
Inc.Non-guarantor
SubsidiariesConsolidatingAdjustments
Lions GateConsolidated
(Amounts in thousands)STATEMENT OF CASH FLOWSNET CASH FLOWS PROVIDED BY (USED IN)OPERATING ACTIVITIES $ 171,222 $ 62,901 $ (137,614) $ — $ 96,509INVESTING ACTIVITIES:
Proceeds from the sale of equity methodinvestees — — 14,575 — 14,575Investment in equity method investees — (4,655) (18,075) — (22,730)Purchases of other investments (28,000) (2,000) — — (30,000)Purchases of property and equipment — (14,939) (2,074) — (17,013)
NET CASH FLOWS PROVIDED BY (USED IN)INVESTING ACTIVITIES (28,000) (21,594) (5,574) — (55,168)FINANCING ACTIVITIES:
Senior revolving credit facility - borrowings 778,500 — — — 778,500Senior revolving credit facility - repayments (876,119) — — — (876,119)Term Loan - borrowings, net of deferredfinancing costs of $4,315 370,685 — — — 370,685Term Loan - repayments (229,500) — — — (229,500)Convertible senior subordinated notes -repurchases — (16) — — (16)Production loans - borrowings — — 631,709 — 631,709Production loans - repayments — — (449,648) — (449,648)Repurchase of common shares (144,840) — — — (144,840)Dividends paid (33,353) — — — (33,353)Exercise of stock options 6,839 — — — 6,839Tax withholding required on equity awards (20,062) — — — (20,062)
NET CASH FLOWS PROVIDED BY (USED IN)FINANCING ACTIVITIES (147,850) (16) 182,061 — 34,195NET CHANGE IN CASH AND CASHEQUIVALENTS (4,628) 41,291 38,873 — 75,536FOREIGN EXCHANGE EFFECTS ON CASH (1) — 1,470 — 1,469CASH AND CASH EQUIVALENTS —BEGINNING OF PERIOD 8,128 5,999 11,565 — 25,692CASH AND CASH EQUIVALENTS — END OFPERIOD $ 3,499 $ 47,290 $ 51,908 $ — $ 102,697

LIONS GATE ENTERTAINMENT CORP.
NOTES TO AUDITED CONSOLIDATED FINANCIAL STATEMENTS — (Continued)
F-54
Year Ended
March 31, 2014
Lions GateEntertainment
Corp.
Lions GateEntertainment
Inc.Non-guarantor
SubsidiariesConsolidatingAdjustments
Lions GateConsolidated
(Amounts in thousands)STATEMENT OF INCOME
Revenues $ 6,748 $ 26,113 $ 2,606,551 $ (9,158) $2,630,254EXPENSES:
Direct operating (254) (3,331) 1,372,199 767 1,369,381Distribution and marketing 2 3,058 736,401 — 739,461General and administration 9,968 163,110 82,309 (462) 254,925Depreciation and amortization — 2,218 4,321 — 6,539
Total expenses 9,716 165,055 2,195,230 305 2,370,306OPERATING INCOME (LOSS) (2,968) (138,942) 411,321 (9,463) 259,948Other expenses (income):
Interest expense 18,718 111,956 43,349 (107,853) 66,170Interest and other income (69,552) (3,945) (40,027) 107,494 (6,030)Loss on extinguishment of debt 2,600 36,972 — — 39,572
Total other expenses (income) (48,234) 144,983 3,322 (359) 99,712INCOME (LOSS) BEFORE EQUITYINTERESTS AND INCOME TAXES 45,266 (283,925) 407,999 (9,104) 160,236Equity interests income (loss) 98,244 403,443 29,467 (506,430) 24,724INCOME (LOSS) BEFORE INCOME TAXES 143,510 119,518 437,466 (515,534) 184,960Income tax provision (8,527) 21,274 78,086 (57,910) 32,923NET INCOME (LOSS) 152,037 98,244 359,380 (457,624) 152,037
Less: Net loss attributable to noncontrollinginterests — — — — —
Net income (loss) attributable to Lions GateEntertainment Corp. shareholders $ 152,037 $ 98,244 $ 359,380 $ (457,624) $ 152,037
Year Ended
March 31, 2014
Lions GateEntertainment
Corp.
Lions GateEntertainment
Inc.Non-guarantor
SubsidiariesConsolidatingAdjustments
Lions GateConsolidated
(Amounts in thousands)STATEMENT OF COMPREHENSIVEINCOME (LOSS)
NET INCOME (LOSS) 152,037 98,244 359,380 (457,624) 152,037Foreign currency translation adjustments, net oftax 5,102 1,665 26,348 (28,821) 4,294Net unrealized gain on foreign exchange contracts,net of tax — (661) 1,469 — 808COMPREHENSIVE INCOME (LOSS) 157,139 99,248 387,197 (486,445) 157,139Less: Comprehensive loss attributable tononcontrolling interest — — — — —Comprehensive income (loss) attributable to LionsGate Entertainment Corp. shareholders $ 157,139 $ 99,248 $ 387,197 $ (486,445) $ 157,139

LIONS GATE ENTERTAINMENT CORP.
NOTES TO AUDITED CONSOLIDATED FINANCIAL STATEMENTS — (Continued)
F-55
Year Ended
March 31, 2014
Lions GateEntertainment
Corp.
Lions GateEntertainment
Inc.Non-guarantor
SubsidiariesConsolidatingAdjustments
Lions GateConsolidated
(Amounts in thousands)STATEMENT OF CASH FLOWSNET CASH FLOWS PROVIDED BY (USED IN)OPERATING ACTIVITIES $ (512,508) $ 727,357 $ 37,663 $ — $ 252,512INVESTING ACTIVITIES:
Proceeds from the sale of equity method investees — — 9,000 — 9,000Investment in equity method investees — (750) (16,500) — (17,250)Distributions from equity method investee inexcess of earnings — — 4,169 — 4,169Repayment of loans receivable — — 4,275 — 4,275Purchases of property and equipment — (8,384) (415) — (8,799)
NET CASH FLOWS PROVIDED BY (USED IN)INVESTING ACTIVITIES — (9,134) 529 — (8,605)FINANCING ACTIVITIES:
Senior revolving credit facility - borrowings 409,120 463,100 — — 872,220Senior revolving credit facility - repayments (311,501) (801,574) — — (1,113,075)Term Loan and 5.25% Senior Notes - borrowings,net of deferred financing costs of $6,860 440,640 — — — 440,64010.25% Senior Notes - repurchases andredemptions — (470,584) — — (470,584)Convertible senior subordinated notes -borrowings — 60,000 — — 60,000Production loans - borrowings — — 532,416 — 532,416Production loans - repayments — — (517,874) — (517,874)Pennsylvania Regional Center credit facility -repayments — — (65,000) — (65,000)Dividends paid (6,900) — — — (6,900)Exercise of stock options 11,972 — — — 11,972Tax withholding required on equity awards (23,077) — — — (23,077)
NET CASH FLOWS PROVIDED BY (USED IN)FINANCING ACTIVITIES 520,254 (749,058) (50,458) — (279,262)NET CHANGE IN CASH AND CASHEQUIVALENTS 7,746 (30,835) (12,266) — (35,355)
FOREIGN EXCHANGE EFFECTS ON CASH (210) — (1,106) — (1,316)CASH AND CASH EQUIVALENTS —BEGINNING OF PERIOD 592 36,834 24,937 — 62,363CASH AND CASH EQUIVALENTS — END OFPERIOD $ 8,128 $ 5,999 $ 11,565 $ — $ 25,692

LIONS GATE ENTERTAINMENT CORP.
NOTES TO AUDITED CONSOLIDATED FINANCIAL STATEMENTS — (Continued)
F-56
22. Related Party Transactions
MHR Affiliates
As per the terms of that certain registration rights agreement dated as of October 22, 2009 by and among the Company and certain investment funds of Mark Rachesky (collectively, the “MHR Affiliates”), as amended on February 3, 2016, the Company has reimbursed the MHR Affiliates for certain costs related to the registration and offering of the Company’s common shares offered by the MHR Affiliates on Form S-3 dated April 7, 2015. Such costs, amounting to approximately $1.0 million, are included in general and administration expense in the consolidated statement of income for the year ended March 31, 2015. The registration and offering was disclosed by the Company on a Current Report on Form 8-K dated April 7, 2015.
In November 2015, the Company was advised that each of Liberty Global Incorporated Limited (“Liberty”), a limited company organized under the laws of the United Kingdom and a wholly-owned subsidiary of Liberty Global plc, and Discovery Lightning Investments Ltd. (“Discovery”), a limited company organized under the laws of the United Kingdom and a wholly-owned subsidiary of Discovery Communications, Inc., agreed to each purchase 5,000,000 common shares, no par value per share, of the Company (“common shares”) from funds affiliated with MHR Fund Management, LLC (“MHR Fund Management”). In connection with the purchases, the Company entered into separate registration rights agreements with each of Liberty and Discovery, and amended the registration rights agreement with MHR Fund Management, which provide Liberty, Discovery and MHR Fund Management (together with certain of their affiliates) with certain registration rights, subject to the terms and conditions set forth therein. The Company also entered into an underwriting agreement with J.P. Morgan Securities LLC, as underwriter, Liberty, Discovery and Bank of America, N.A. in connection with a registered underwritten secondary public offering of the common shares. Among other transaction costs, the Company has incurred expenses on behalf of MHR Fund Management for certain costs related to the registration and offering of the common shares. Such costs, amounting to approximately $0.8 million, are included in general and administration expense in the consolidated statement of income for the year ended March 31, 2016. Mark H. Rachesky, the Chairman of the Board of the Company, is the principal of MHR Fund Management, which holds approximately 20.5% of the Company’s outstanding common stock as of May 23, 2016. The registration and offering were disclosed by the Company on Current Reports on Form 8-K dated November 10, 2015 and November 13, 2015.
Atom Tickets
During the year ended March 31, 2015, the Company made initial investments of approximately $4.3 million in MovieFriends, LLC ("Atom Tickets"), a theatrical movie discovery service. During the year ended March 31, 2016, the Company participated in an equity offering of Atom Tickets and subscribed for an additional $7.9 million. The Company owns an interest of approximately 19.5% in Atom Tickets. Gordon Crawford, a director of the Company, is an investor in Atom Tickets. Additionally, Phyllis Yaffe, a director of the Company, was appointed to its board of directors as a result of the Company's investment.

LIONS GATE ENTERTAINMENT CORP.
NOTES TO AUDITED CONSOLIDATED FINANCIAL STATEMENTS — (Continued)
F-57
Transactions with Equity Method Investees
In the ordinary course of business, we are involved in related party transactions with equity method investees. These related party transactions primarily relate to the licensing and distribution of the Company's films and television programs, for which the impact on the Company's consolidated balance sheets and consolidated statements of income is as follows (see Note 2 and Note 5):
March 31,
2016 2015(Amounts in thousands)
Consolidated Balance SheetsAccounts receivable(1) $ 14,573 $ 27,218
Accounts payable and accrued liabilities(2) $ 4,000 $ —Participations and residuals(3) 11,716 9,929Deferred revenue(4) 63,442 18,123
Total due to related parties $ 79,158 $ 28,052
Year Ended March 31,
2016 2015 2014(Amounts in thousands)
Consolidated Statements of IncomeRevenues(1) $ 47,682 $ 59,819 $ 51,919Direct operating expense(3) $ 12,309 $ 13,904 $ 32,700Distribution and marketing expenses(5) $ 1,210 $ 827 $ 2,132
__________________________________
(1) Represents primarily revenues and accounts receivable from EPIX and Pop from the licensing of films and television programs. Also includes revenues from FEARnet for fiscal 2014. (2) Represents accrued capital contributions to Pop.(3) Represents participation expense and participations payable associated with the distribution of certain theatrical titles for Roadside Attractions and Pantelion Films.(4) Represents deferred revenue from licensing arrangements discussed in footnote 1 above for EPIX.(5) Represents distribution fees incurred related to Roadside Attractions in connection with the theatrical release of certain films.