Embed Size (px)
Citation preview
Abstract (250 max): 247 Manuscript (4500 max): 4499 Tables & Figures: 2 Tables/3 Figures
Title: You’ll feel better in the morning: Slow wave activity and overnight mood regulation in interepisode bipolar disorder
Authors: Adriane M. Soehner, PhD1, Katherine A. Kaplan, PhD2, Jared M. Saletin, PhD3, Lisa S. Talbot, PhD4, Ilana S. Hairston, PhD5, June Gruber, PhD6, Polina Eidelman, PhD7, Matthew P. Walker, PhD8, Allison G. Harvey, PhD8
1Department of Psychiatry, University of Pittsburgh School of Medicine, Pittsburgh, PA 2Department of Psychiatry, Stanford University School of Medicine, Stanford, CA 3Department of Psychiatry and Human Behavior, Alpert Medical School of Brown University, Providence, RI
4San Francisco Veterans Affairs Medical Center, San Francisco, CA 5School of Behavioral Sciences, Academic College of Tel Aviv - Jaffa, Jaffa, Israel 6Department of Psychology, University of Colorado, Boulder, Boulder, CO 7Cognitive Behavior Therapy and Science Center, Oakland, CA 8Department of Psychology, University of California, Berkeley, Berkeley, CA Corresponding Author: Adriane Soehner Department of Psychiatry University of Pittsburgh School of Medicine Loeffler Building, Rm 302 121 Meyran Ave Pittsburgh, PA 15213 Email: [email protected] Financial Support: This research was supported by National Institute of Mental Health (A.S., grant numbers K01MH111953, T32MH089919, T32MH018269), (A.H., R34MH080958), (M.W., R01MH9353). Conflict of Interest: None
2
Abstract
Background: Sleep disturbances are prominent correlates of acute mood episodes and inadequate
recovery in bipolar disorder (BD), yet the mechanistic relationship between sleep physiology and
mood remains poorly understood. Using a series of pre-sleep mood inductions and overnight sleep
recording, this study examined the relationship between overnight mood regulation and a marker of
sleep intensity (non-rapid eye movement sleep slow wave activity; NREM SWA) during the
interepisode phase of BD.
Methods: Adults with interepisode BD type 1 (BD; n=20) and healthy adult controls (CTL; n=23)
slept in the laboratory for a screening night, a neutral mood induction night (baseline), a happy
mood induction night, and a sad mood induction night. NREM SWA (0.75-4.75Hz) was derived
from overnight sleep EEG recordings. Overnight mood regulation was evaluated using an affect
grid pleasantness rating post-mood induction (pre-sleep) and the next morning.
Results: Overnight mood regulation did not differ between groups following the sad or happy
inductions. SWA did not significantly change for either group on the sad induction night compared
to baseline. In BD only, SWA on the sad night was related to impaired overnight negative mood
regulation. On the happy induction night, SWA increased relative to baseline in both groups, though
SWA was not related to overnight mood regulation for either group.
Conclusions: These findings indicate that SWA disruption may play a role in sustaining negative
mood state from the previous night in interepisode BD. However, positive mood state could
enhance SWA in bipolar patients and healthy adults.
3
Introduction
Bipolar disorder (BD) is characterized by mood regulation impairment, oscillating between
persistently elevated or irritable mood and sustained periods of depressed mood (APA, 2013). Even
between episodes, individuals with BD remain seriously symptomatic (Joffe et al., 2004) and exhibit
significant mood lability (Aas et al., 2014). Though sleep disturbances are among the most prominent
correlates of mood episodes and inadequate recovery in BD (Harvey, 2008), it remains unclear how
specific aspects of sleep physiology may relate to negative and positive mood dysregulation.
Disrupted sleep homeostasis is a hypothesized contributor to sleep and mood impairments
in affective disorders (Borbely and Wirz-Justice, 1982). Sleep homeostasis is a physiological sleep
regulatory process defined by increasing pressure to sleep during extended wakefulness, followed by
dissipating sleep intensity across the sleep period (Borbely et al., 2016). The amount of slow wave
activity (SWA; EEG power density 0.75–4.75 Hz) during non-rapid eye movement (NREM) sleep is
the best-characterized marker of sleep intensity (Borbely et al., 2016). The S-deficiency hypothesis of
depression proposes that deficient build-up of sleep pressure and reduced sleep intensity (SWA) may
produce or sustain depressed mood (Borbely and Wirz-Justice, 1982). In accord with this hypothesis,
SWA deficits and reduced visually-staged slow wave sleep (SWS; NREM stage 3 and 4) are generally
observed in unipolar depression relative to controls (See Armitage, 2007 for review). Moreover,
selective slow-wave sleep deprivation can have an antidepressant effect among unipolar depressed
patients (Cheng et al., 2015, Landsness et al., 2011), which may be due to a “resetting” of waking
sleep pressure and greater SWA rebound the next night (Landsness et al., 2011). While the precise
mechanisms linking SWA and depressed mood remain to be delineated, research suggests that
increased sleep intensity may facilitate cortical plasticity in brain regions supporting a host of
cognitive-affective processes implicated in affective disorders (Huber et al., 2008, Tononi, 2009).
SWA has been less extensively studied in BD. Only one study in bipolar depression (n = 8

4
per group) has measured SWA, reporting no differences relative to matched controls (Mendelson et
al., 1987). However, studies assessing visually-staged sleep indicate lower SWS in bipolar depression
relative to healthy adults, at levels akin to unipolar depression (Asaad et al., 2016, Fossion et al., 1998,
Gillin et al., 1979, Linkowski et al., 1986). While no studies to date have selectively deprived slow-
wave sleep in bipolar depression, sleep deprivation also has antidepressant effects in bipolar
depression and can induce (hypo)mania in a subset of cases (Benedetti and Colombo, 2011). SWS
deficits in (hypo)mania may be comparable to depression (Asaad et al., 2016, Linkowski et al., 1986),
though findings are inconsistent (Hudson et al., 1988). While altered SWS has not been observed in
interepisode BD (Eidelman et al., 2010, Knowles et al., 1986, Sitaram et al., 1982), one study reported
that higher baseline SWS predicted greater mania symptom severity at 3-month follow-up (Eidelman
et al., 2010).
Overall, there is some support for SWS deficits in bipolar depression and (hypo)mania. This
raises the possibility that BD patients, like their unipolar depressed counterparts, may be vulnerable
to mood-related changes in sleep intensity. Initial prospective findings in interepisode BD, along
with the well-documented antidepressant response to sleep deprivation, suggest that altered sleep
intensity could play a role in generating or sustaining mood disturbance in BD. However, whether
waking mood affects sleep intensity remains unclear. Initial experimental work in healthy adults
suggests that pre-sleep affect may alter slow wave sleep (Talamini et al., 2013). Among those with
affective disorders, who are more vulnerable to mood regulation impairments, it is important to
disambiguate whether acute change in waking mood produces SWA deficits and/or whether
deficient SWA maintains mood disturbances overnight. The interepisode phase of BD provides
unique opportunity to experimentally probe such relationships.
The aim of the present study was to examine whether adults with interepisode BD
experience experimentally-induced mood disruptions in SWA, and whether deficient SWA is related
5
to impaired overnight mood regulation. This study involved further analysis of an existing dataset
(Eidelman et al., 2010, Talbot et al., 2009). Adults with interepisode BD and healthy adult controls
spent 4 nights in the sleep laboratory: 1 screening night, 1 neutral (baseline) mood induction night, 1
negative (sad) mood induction night, and 1 positive (happy) mood induction night. The first aim was
to assess whether interepisode bipolar patients and healthy adults exhibited an overnight reduction
in negative and positive mood following the sad and happy mood inductions, respectively. Due to
documented mood regulation deficits in interepisode BD (e.g., Aas et al., 2014), it was hypothesized
that the bipolar group would exhibit a smaller overnight change in mood. The second aim was to
evaluate the effects of the sad and happy mood inductions on SWA relative to baseline. Based on
evidence of reduced SWA in depression and (hypo)mania, we predicted that SWA would be lower
after both mood inductions relative to baseline in the bipolar group, but not in the control group.
The final aim was to assess associations between SWA and overnight changes in mood on the sad
and happy induction nights. We predicted that lower SWA would be associated with impaired
overnight mood regulation in bipolar patients.
Methods
Participants
Participants included: 20 adults with interepisode DSM-IV-TR bipolar disorder type I (BD)
and 23 healthy adult controls (CTL) with no history of psychiatric or sleep disorders. Participants
were drawn from a larger protocol, results from which have been described in previous reports (e.g.,
Eidelman et al., 2010, Talbot et al., 2009). All procedures contributing to this work comply with the
ethical standards of relevant national and institutional committees on human experimentation and
with the Helsinki Declaration of 1975, as revised in 2008. Inclusion criteria for all participants were:
(a) negative for narcolepsy, sleep apnea (AHI>5), restless leg syndrome or periodic limb movement
disorder (PLMA>15) on the basis of polysomnography; (b) met criteria for interepisode symptom

6
cutoffs based on prior research (Chengappa et al., 2003; Thompson et al., 2005): a score of ≤7 on the
Young Mania Rating Scale (YMRS; Young et al., 1978) and a score of ≤ 11 on the Inventory of
Depressive Symptomatology–Clinician Rated (ISD-C; Rush et al., 1996); (c) had no history of severe
head trauma, stroke, neurological disease, or severe medical illness. BD were included if they: (a) met
DSM–IV–TR bipolar I disorder (American Psychiatric Association, 2000); (b) did not meet criteria
for substance or alcohol abuse or dependence in the past 3 months; (c) were under the care of a
psychiatrist. CTL could not meet DSM–IV–TR criteria for any lifetime Axis I disorder.
In order to be included in the present analysis, participants had to meet criteria for BD type
I, and complete the baseline (neutral mood induction) and at least one mood induction (sad or
happy) sleep recording. From the original sample (BD n=28; CTL n=28), 4 BD participants had BD
type II. Additional participants were excluded on the basis of poor quality sleep recording/excessive
EEG artifact on the baseline night (BD=2; CTL=4) or both mood induction nights (BD=2,
CTL=1). For the sad induction night, additional participants were lost to dropout (BD=1) or poor
quality recordings (BD=2; CTL=2), leading to a total of 17 BD and 21 CTL participants for sad
night analyses. Similarly, for the happy induction night additional participants were lost to dropout
(BD=1; CTL=1) or poor quality recordings (BD=3; CTL=1), leading to a total of 16 BD and 21
CTL participants for happy night analyses.
Clinical Functioning Measures
Structured Clinical Interview for DSM-IV (SCID; First et al., 1997). DSM-IV-TR Axis I diagnoses
were confirmed using the SCID.
Manic and Depressive Symptoms. Current symptoms of mania were measured using the 11-item,
clinician rated Young Mania Rating Scale (YMRS; Young et al., 1978). Current symptoms of
depression were assessed using the 30-item, clinician-rated Inventory of Depressive
Symptomatology (IDS-C; Rush et al., 1996). YMRS (≤7) and IDS-C (≤ 11) scores were used to

7
confirm current interepisode status (i.e., neither currently manic nor depressed) for both groups.
Illness Course. BD course characteristics were assessed using a validated charting procedure
(National Institute of Mental Health retrospective Life-Charting Methodology; Denicoff et al., 1997,
Leverich and Post, 1997). Age of BD onset, illness duration, and the number of lifetime manic and
depressive episodes were derived.
Medication Tracking and Dosage. Medication name and dosage were recorded at each visit.
Medication effects were examined using an approach developed for neuroimaging research (Phillips
et al., 2008a). Each medication was re-categorized by medication class, and dose was categorized as
0(no medication), 1(low), or 2(high) based on published parameters and chlorpromazine-equivalent
mean effective daily doses (Davis and Chen, 2004, Sackeim, 2001). A composite measure of
medication load was created for each participant by summing across dosage strength codes and
classes (Almeida et al., 2009).
Sleep Measures
Duke Structured Interview for Sleep Disorders (DSISD; Edinger et al., 2004). The DSISD is a semi-
structured interview that assesses research diagnostic criteria for sleep disorders; it has good
reliability and validity (Edinger, 2009).
Polysomnography (PSG). Sleep was recorded using overnight PSG with a Compumedics 802
Siesta system (Compumedics, Charlotte, NC). PSG involves the continuous and simultaneous
recording of EEG, electrooculogram (EOG), and electromyogram (EMG) to score sleep. Recording
channels included four EEG derivations (C3/A2, C4/A1, O1/A2, O2/A1), two EOG leads, and
two submental EMG sensors. On the first overnight visit, heart rate, blood oxygen, nasal and oral
air flow, thoracic and abdominal effort, and leg motion were monitored. PSG data were staged in
30-second epochs using standard Rechtscaffen & Kales criteria (Rechtschaffen, 1968).
Power Spectral Analysis. Sleep EEG analyses were performed offline in MATLAB R2011b

8
(Mathworks, Natick, MA) and EEGLAB11 (http://sccn.ucsd.edu/eeglab/). Power spectral analysis
was carried out in accordance with published methods (van der Helm et al., 2011). EEG channels
were re-referenced to the average of the left and right mastoid (A1, A2), run through high-pass
(0.5Hz) and low-pass (55Hz) Finite Impulse Response (FIR) filtering, and split into 5-second
epochs. EEG recordings were visually inspected for 5-second epochs containing muscle, cardiac and
eye-movement artifacts; artifact-laden epochs were manually rejected. Power spectral density
(µV2/Hz) was calculated using a Fast Fourier Transform (FFT) on each hamming-windowed 5-
second epoch at 128Hz, yielding a frequency resolution of 0.2Hz. FFT results were sorted according
to sleep stage and averaged across NREM (stages 2-4). NREM SWA was defined as integrated
power in the 0.75-4.75 Hz range. Relative SWA (expressed as a percentage) was derived by dividing
SWA by the integrated power of the entire spectrum. For each night, values ±3.0 standard
deviations were Winsorized (<1% of all data). Relative SWA derived from the central EEG
derivation C4 was used for hypothesis testing.
Mood Ratings
Affect Grid. The affect grid (Russell et al., 1989) is a self-report rating of pleasure on the
horizontal axis (–4=extremely unpleasant, 0=neutral, 4=extremely pleasant) and arousal on the vertical axis
(–4=extremely low arousal, 0=neutral, 4=extremely high arousal); it has adequate reliability and validity
(Russell et al., 1989).
Mood Induction
Mood Induction. The mood induction technique was adapted from well-validated procedures
(Albersnagel, 1988, Eich et al., 1994, Stein et al., 2000, Williams et al., 2002) that combine continuous
music with autobiographical recall. For the happy and sad mood inductions, participants were told
that they would listen to a selection of music to assist them in developing a happy (or sad) mood,
and then were then instructed to try hard to develop an intense mood state by concentrating on

9
ideas and images that make them feel happy (or sad). For the neutral induction, participants were
asked to focus on neutral topics (e.g., directions to a familiar place or the layout of furniture at
home) while listening to the classical music. See Supplemental Methods regarding music selection.
Procedure
At the first laboratory visit, participants completed written informed consent. Participants
were then administered the SCID, DSISD, YMRS, IDS-C, and life chart to assess diagnostic status,
symptom severity, and clinical course. Eligible participants were provided with an instruction sheet
for the day prior to subsequent overnight lab visits; these included: (1) restrict caffeine intake to <2
cups coffee (or equivalent) before noon and (2) refrain from taking over-the-counter medications.
For all overnight visits, participants arrived at the laboratory 2 hours prior to their habitual
bedtime. Overnight visit eligibility was then assessed by a clinician, including compliance with
overnight instructions, medication use, and interepisode status using the YMRS and IDS-C. If
YMRS or IDS-C scores exceeded interepisode cut-offs, a safety assessment was completed before
the participant was sent home (without completing the overnight). Overnight visits were each
approximately 2 weeks apart; some participants did not complete all visits (see Supplemental
Procedures for details).
At the first overnight, participants underwent full clinical polysomnography to assess for
sleep disorders (e.g., sleep apnea, PLMD). At the three subsequent overnight visits, mood inductions
were administered. A neutral mood induction was administered at the second overnight visit, and
then the order of the happy and sad inductions was counterbalanced between the third and fourth
overnight visits. In order to reduce demand effects, participants were told that they were engaging in
two different experiments at these visits, a music study and a sleep study.
At each mood induction overnight visit (neutral, sad, happy), PSG equipment was first
attached, followed by the mood induction administration in a private room. During mood

10
inductions, participants rated their current affect, pleasure, and arousal at baseline, and every 5
minutes thereafter, using a computerized version of the Affect Grid. The neutral mood induction
was 15 minutes for all participants and there was no mood cut-off at the end. Affect Grid mood
thresholds of at least -3 (pleasure) for the sad induction and +3 (pleasure) for the happy induction
were set based on previous methods (Eich et al., 1994). Mood inductions ended at these thresholds,
or at 40 minutes after the start of the induction. The final Affect Grid of the mood induction was
used as the pre-sleep (post-induction) measure. Immediately after the mood induction, participants
were escorted to the laboratory bedroom and allowed to sleep. Participants were awakened at the
time they requested (approx. 9:00am at the latest). To mitigate the effects of sleep inertia upon
morning mood reports, participants completed the Affect Grid roughly 20 minutes after awakening.
Participants were debriefed at the end of their last visit.
Analytic Approach
Analyses were conducted in SPSS 20.0 (IBM Corporation, Somers, NY, 2012). Affect Grid
pleasantness ratings were used to evaluate mood just prior to each mood induction (pre-induction),
at the end of each mood induction (post-induction) and the morning following the mood induction
(morning). A 2 (Group; BD vs. CTL) X 3 (Time; pre-induction, post-induction, morning) repeated-
measures analysis of variance (ANOVA) was conducted for each the sad and happy mood
inductions. Overnight mood change was evaluated using a difference score (morning – post-
induction affect grid pleasantness rating).
The effect of pre-sleep sad and happy mood inductions on SWA was examined using a series
of 2 (Night; neutral vs. sad or happy mood induction) x 2 (Group; BD vs. CTL) repeated-measures
ANOVA models. The neutral mood induction was used as a baseline night. As a few individuals did
not complete both the happy and sad mood induction overnights, separate ANOVAs compared
each mood induction (sad, happy) to baseline, to maximize statistical power.

11
In each group, spearman’s rho correlation analyses evaluated whether SWA on the sad or
happy mood induction nights was associated with overnight mood change (morning – post-
induction affect grid pleasantness ratings) that same night.
On an exploratory basis, we conducted an analysis with sleep architecture variables
paralleling the main sleep aims. Exploratory spearman rho correlations were also conducted to
examine effects of illness course characteristics (see Supplemental Results), pre-sleep arousal, and
medication load on SWA. The significance level was set at p<0.05 (two-sided) for all analyses.
Results
Baseline Demographic and Clinical Characteristics
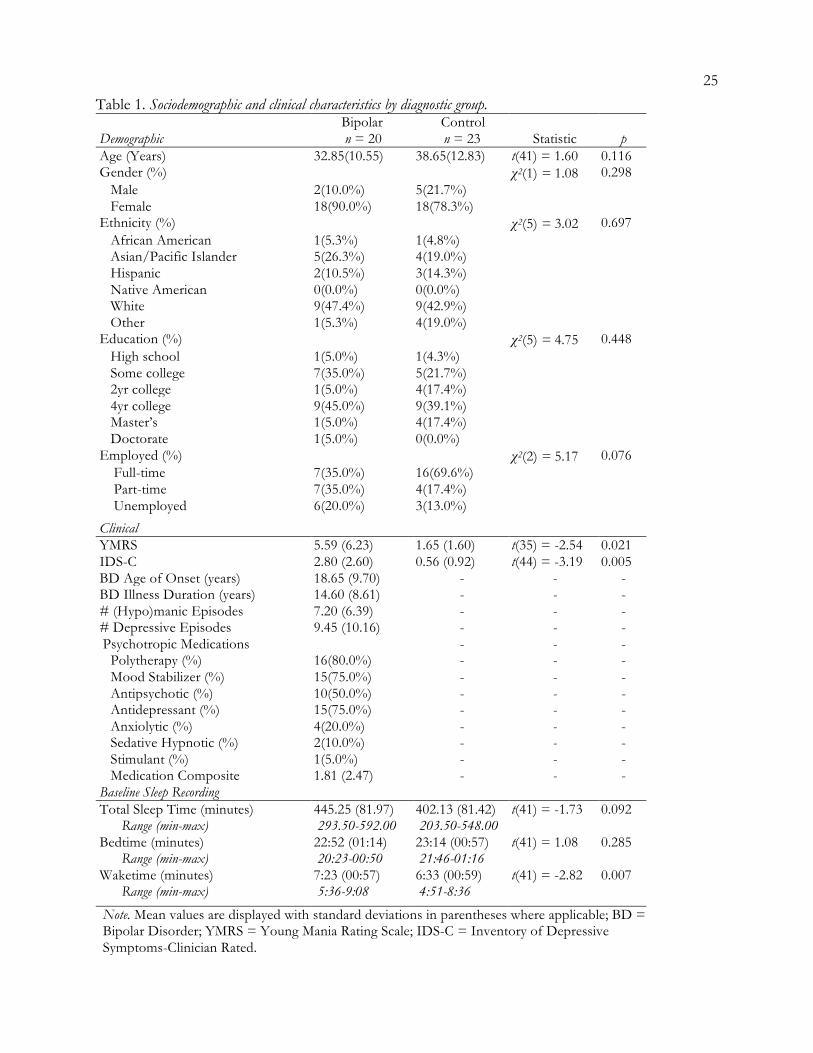
The two groups did not significantly differ on any sociodemographic characteristics (Table
1). While BD exhibited significantly higher baseline manic and depressive symptoms (ps<0.05),
scores were well below established interepisode cut-offs. Baseline (neutral induction night) bedtime
and sleep duration sleep did not significantly differ between groups, though waketime was later in
BD than CTL (p<0.05). Spearman correlation analyses assessed whether age, sex, depressive or
manic symptoms scores were meaningfully associated with any mood or sleep EEG outcomes. No
significant correlations emerged; therefore, these variables were not included as covariates in
subsequent analyses.
Sad Mood Induction
Overnight Mood Regulation. There was neither a significant main effect of Group, F(1,36)=2.61,
p=0.115, nor a significant Group X Time interaction effect, F(1,36)=0.44, p=0.513, on affect grid
mood ratings across the sad mood induction overnight (Figure 1a). However, there was a significant
main effect of Time, F(1, 36)=92.70, p<0.001. Posthoc paired samples t-tests confirmed a significant
increase in negative mood from pre- to post-mood induction, t(36)=9.68, p<0.001, and a significant
overnight decrease in negative mood from post-induction to morning, t(36)=-8.15, p<0.001.

12
Mood Induction Effects on SWA. Figure 2a illustrates SWA means on the baseline and sad
mood induction overnights. There were no significant effects SWA across Group, F(1,36)=2.27,
p=0.140, Night, F(1,36)=1.13 p=0.295, or Group X Night, F(1,36)=0.42, p=0.520.
SWA-Overnight Mood Regulation Associations. Sad mood induction night SWA positively
correlated with overnight mood change on the affect grid (r=0.56, p=0.018; Figure 3a) in BD such
that higher SWA was related to greater improvement in negative mood; this association was not
observed in CTL (r=0.34, p=0.143; Figure 3b).
Happy Mood Induction
Overnight Mood Regulation. There was neither a significant main effect of Group, F(1,
41)=0.32, p=0.575, nor a significant Group X Time interaction effect, F(1,35)=0.92, p=0.343, on
mood ratings across the happy mood induction overnight (Figure 1b). There was a significant main
effect of Time, F(1, 35)=27.61, p<0.001. Posthoc paired samples t-tests confirmed a significant
increase in positive mood from pre- to post-mood induction, t(36)=-4.79, p<0.001, and a significant
overnight reduction in positive mood from post-induction to morning, t(36)=4.80, p<0.001.
Mood Induction Effects on SWA. Figure 2b shows SWA on the baseline and happy mood
induction overnights. There was a significant main effect of Night, F(1,35)=5.64, p=0.023, whereby
SWA increased on the happy mood induction night relative to baseline in both groups. Effects of
Group, F(1,35)=0.00, p=0.996, and Group X Night, F(1,35)=1.25, p=0.271, were non-significant.
SWA-Overnight Mood Regulation Associations. On the happy mood induction night, overnight
mood change on the affect grid was not significantly correlated with SWA for both BD (r=0.02,
p=0.430; Figure 3c) and CTL (r=-0.14, p=0.543; Figure 3d).
Sleep Architecture
Table 2 reports results from repeated measures ANOVAs evaluating sleep architecture
variables (TST, TWT, N1, N2, SWS, REM) on the neutral vs. happy or sad induction nights.

13
Baseline night means differ slightly between the sad and happy mood induction nights since a few
individuals did not participate in both mood nights and a repeated measures analysis of variance
excludes a participant if there is missing data on any of the observation points. Baseline sleep
architecture has been described in previous reports from the full sample (Eidelman et al., 2010,
Talbot et al., 2009). There were no significant effects of Group, Night or Group X Night for TST,
N1, N2, or SWS (all p>0.05). There was a Group effect for TWT, such that BD had greater TWT
than CTL at baseline relative to both the sad night and happy nights (both p<0.05). There was a
main effect of Night for sad night REM sleep relative to baseline, such that both groups had greater
REM relative to baseline (p<.05). Sleep architecture variables did not correlate with overnight mood
change on the sad or happy nights (all p>0.05) with the exception of SWS. Paralleling SWA findings,
sad night SWS was positively correlated with overnight negative mood change in BD (r=0.61,
p=0.009), but not CTL (r=-0.27, p=0.259).
Pre-Sleep Arousal Ratings
No significant differences were observed between BD and CTL on post-induction affect
grid arousal ratings for the sad (-1.41 vs. -1.55; t(35)=-0.23, p=0.822) and happy mood induction
nights (-0.81 vs. -0.33; t(35)=-0.61, p=0.543). Post-induction arousal ratings did not correlate with
SWA on the mood induction nights for either group (ps>0.05).
Medication Effects
In BD, medication load did not significantly differ between baseline versus the sad (4.29 vs.
4.12; F(1,16)=1.31, p=0.269) and happy mood induction nights (4.44 vs. 4.38; F(1,15)=0.14,
p=0.718). Medication load and SWA were not significantly correlated on the baseline and sad mood
induction nights (ps>0.05). Higher medication load correlated with lower happy night SWA at a
trend level (r=-0.45, p=0.083).
Discussion

14
This study tested relationships between overnight mood regulation impairment, sleep
intensity (indexed by SWA), and interepisode BD diagnosis. Findings included that: (1) overnight
mood regulation in interepisode BD did not significantly differ from healthy adults, (2) inducing a
positive mood state prior to sleep increased SWA relative to baseline across all participants, and (3)
lower SWA was associated with attenuated overnight regulation of negative mood, but not positive
mood, in bipolar patients.
Taking findings from the sad mood induction first, the prediction that the bipolar group
would exhibit impaired overnight mood regulation was not supported. Both the bipolar and control
groups exhibited intact overnight mood regulation, with negative mood prior to sleep generally
regularizing to a neutral rating by the morning. This is consistent with previous research indicating
that negative mood typically improves overnight in healthy adults (Cartwright et al., 2003, Cartwright
et al., 1998). Impaired mood regulation in interepisode BD might only be evident after shorter spans
of time during waking hours, though to our knowledge this question has not yet been systematically
investigated. The present findings indicate that overnight mood regulation capabilities in interepisode
BD may generally be comparable to healthy adults.
The sad mood induction did not have differential effects on SWA across the two groups.
However, lower SWA on the sad mood induction night was related to attenuated overnight
improvement in negative mood for bipolar patients only. This coheres with predictions of the S-
deficiency hypothesis (Borbély, 1982), which proposes that deficient SWA may sustain depressed
mood. Exploratory sleep architecture analyses further support this notion; lower sad night SWS also
correlated with impaired overnight negative mood regulation in BD. A lack of correlation with REM
sleep and other NREM stages suggest a specific role for sleep intensity (SWA/SWS) in overnight
regulation of negative mood, consistent with prior reports (Cheng et al., 2015). These results raise
the possibility that slow-wave deficits in BD might sustain negative mood overnight.

15
Predictions for the happy mood induction night were generally not supported. On average,
positive mood state prior to sleep decreased to a neutral rating by morning for both groups, thus the
bipolar group did not exhibit impaired overnight mood regulation relative to controls. Also contrary
to our hypothesis, both groups exhibited increased SWA following the happy mood induction.
Positive affect has previously been observed to be beneficial for sleep quality and efficiency in some
studies (Ong et al., 2013, Steptoe et al., 2008), though this is the first study to our knowledge that has
explored the effects of positive mood on SWA. Finally, there was not a significant association
between SWA and overnight change in positive mood. The absence of a statistically significant
relationship between SWA and overnight change in positive mood, in the presence of both positive
mood-induced SWA changes and a reduction in positive mood from night to morning, raises the
possibility that SWA may not be driving overnight change in positive mood. Perhaps overnight
changes in positive versus negative mood are driven by different sleep-wake regulatory mechanisms.
Tightly controlled forced desynchrony and constant routine protocols have determined that there is
a circadian pattern in positive affect (Boivin et al., 1997, Murray et al., 2002), while there is less
evidence for a clear 24-hr rhythm in negative affect (Boivin et al., 1997). Thus, overnight change in
positive mood may primarily be modulated by circadian, rather than homeostatic, factors.
Overall, these results may indicate differing associations between mood state and SWA.
Though sad mood did not induce changes in SWA, lower SWA correlated with attenuated overnight
improvement in negative mood in BD, adding to existing literature supporting the relevance of sleep
homeostatic mechanisms for negative mood regulation. There was greater inter-individual variation
in sad night SWA among BD (Figure 3a-b). Inter-individual differences in vulnerability to SWA
disruption, and its impact on negative mood, may be linked to genetic susceptibility to affective
disorders. For example, PER3 polymorphisms more prevalent in affective disorders are also related
to inter-individual differences in homeostatic sleep pressure (Artioli et al., 2007, Dallaspezia et al.,

16
2016). Conversely, the happy mood induction led to increased SWA relative to baseline in both
groups, but SWA was uncorrelated with overnight change in positive mood. Effects of positive
mood on central and peripheral physiology (Admon and Pizzagalli, 2015, Shiota et al., 2011) may
acutely bolster SWA, separate from circadian mechanisms proposed to govern 24-hr fluctuation in
positive mood. Relevant to depression, and other psychiatric conditions with SWA deficiencies (e.g.,
schizophrenia; Hoffmann et al., 2000), increasing pre-sleep positive mood may be means of
enhancing SWA, as an alternative to sleep deprivation. However, further work is necessary to
delineate the potentially distinct physiological mechanisms underpinning links between negative and
positive mood with SWA.
While a key strength of this study is its unique combination of experimental mood
manipulation with repeated within-subject PSG sleep assessments in BD, several limitations merit
consideration. Only central sleep EEG derivations were analyzed. SWA deficits can be more
pronounced in prefrontal and frontal areas (Plante et al., 2012, Werth et al., 1997), thus future studies
of sleep in BD would benefit from utilizing hdEEG to explore topographic hypotheses. Sex
differences in SWA are sometimes observed in unipolar depression, with some reports observing
greater SWA in females (e.g., Plante et al., 2012). While sex differences in SWA were not observed
here, this may be due to the predominantly female sample and resulting lack of power to detect sex
effects. Prior sleep and wakefulness also impact SWA (Borbély and Achermann, 2000). As this study
was not initially designed to assess SWA, participants were not instructed to keep a regular sleep-
wake schedule before sleep monitoring; future studies should address this design limitation. This was
a medicated sample of bipolar participants. Though medication load was not significantly associated
with overnight mood change, medication could be affecting sleep physiology. Because this study was
conducted across a span of several months, an unmedicated sample would be unfeasible and unsafe.
More broadly, research on severe mental illness would be seriously hindered and lack generalizability

17
if done in only medication-free samples (Phillips et al., 2008b). The present findings remain clinically
important given that the vast majority of BD patients are medicated.
In summary, the present findings provide preliminary support for a relationship between
mood and sleep intensity(indexed by SWA) in interepisode BD. Lower SWA was associated with
impaired overnight regulation of pre-sleep negative mood in BD, but not in controls. Pre-sleep
positive mood increased SWA in both groups relative to baseline, though SWA was not related to
overnight change in positive mood. The present findings suggest a potential interplay between mood
and sleep intensity that may carry relevance for the management of mood dysregulation and sleep-
wake disturbances in interepisode BD.

18
References
Aas, M., Pedersen, G., Henry, C., Bjella, T., Bellivier, F., Leboyer, M., Kahn, J. P., Cohen,
R. F., Gard, S., Aminoff, S. R., Lagerberg, T. V., Andreassen, O. A., Melle, I. & Etain, B.
(2014). Psychometric properties of the Affective Lability Scale (54 and 18-item version) in patients
with bipolar disorder, first-degree relatives, and healthy controls. J Affect Disord 172C, 375-380.
Admon, R. & Pizzagalli, D. A. (2015). Corticostriatal pathways contribute to the natural time
course of positive mood. Nat Commun 6, 10065.
Albersnagel, F. A. (1988). Velten and musical mood induction procedures: a comparison with
accessibility of thought associations. Behav Res Ther 26, 79-96.
Almeida, J. R., Akkal, D., Hassel, S., Travis, M. J., Banihashemi, L., Kerr, N., Kupfer, D. J.
& Phillips, M. L. (2009). Reduced gray matter volume in ventral prefrontal cortex but not
amygdala in bipolar disorder: significant effects of gender and trait anxiety. Psychiatry Res 171, 54-68.
American Psychiatric Association (2000). Diagnostic and statistical manual of mental disorders (4th
Edition, Text revision). American Psychiatric Association: Washington, D.C.
APA (2013). Diagnostic and statistical manual of mental disorders: DSM-5. American Psychiatric
Association: Washington, D.C.
Armitage, R. (2007). Sleep and circadian rhythms in mood disorders. Acta Psychiatr Scand Suppl, 104-
15.
Artioli, P., Lorenzi, C., Pirovano, A., Serretti, A., Benedetti, F., Catalano, M. & Smeraldi, E.
(2007). How do genes exert their role? Period 3 gene variants and possible influences on mood
disorder phenotypes. Eur Neuropsychopharmacol 17, 587-94.
Asaad, T., Sabry, W., Rabie, M. & El-Rassas, H. (2016). Polysomnographic characteristics of
bipolar hypomanic patients: Comparison with unipolar depressed patients. J Affect Disord 191, 274-9.

19
Benedetti, F. & Colombo, C. (2011). Sleep deprivation in mood disorders. Neuropsychobiology 64,
141-51.
Boivin, D. B., Czeisler, C. A., Dijk, D. J., Duffy, J. F., Folkard, S., Minors, D. S., Totterdell,
P. & Waterhouse, J. M. (1997). Complex interaction of the sleep-wake cycle and circadian phase
modulates mood in healthy subjects. Archives of General Psychiatry 54, 145-52.
Borbely, A. & Wirz-Justice, A. (1982). Sleep, sleep deprivation and depression. Human Neurobiology
1, 205-210.
Borbély, A. A. (1982). A two process model of sleep regulation. Hum Neurobiol 1, 195-204.
Borbély, A. A. & Achermann, P. (2000). Homeostasis of human sleep and models of sleep
regulation. . In Principles and Practice of Sleep Medicine (ed. M. H. Kryger, R. T. and W. C. Dement), pp.
377–390. W. B. Saunders: Philadelphia.
Borbely, A. A., Daan, S., Wirz-Justice, A. & Deboer, T. (2016). The two-process model of sleep
regulation: a reappraisal. J Sleep Res 25, 131-43.
Cartwright, R., Baehr, E., Kirkby, J., Pandi-Perumal, S. R. & Kabat, J. (2003). REM sleep
reduction, mood regulation and remission in untreated depression. Psychiatry Res 121, 159-67.
Cartwright, R., Luten, A., Young, M., Mercer, P. & Bears, M. (1998). Role of REM sleep and
dream affect in overnight mood regulation: a study of normal volunteers. Psychiatry Res 81, 1-8.
Cheng, P., Goldschmied, J., Casement, M., Kim, H. S., Hoffmann, R., Armitage, R. &
Deldin, P. (2015). Reduction in delta activity predicted improved negative affect in Major
Depressive Disorder. Psychiatry Res 228, 715-8.
Dallaspezia, S., Locatelli, C., Lorenzi, C., Pirovano, A., Colombo, C. & Benedetti, F. (2016).
Sleep homeostatic pressure and PER3 VNTR gene polymorphism influence antidepressant response
to sleep deprivation in bipolar depression. J Affect Disord 192, 64-9.

20
Davis, J. M. & Chen, N. (2004). Dose response and dose equivalence of antipsychotics. J Clin
Psychopharmacol 24, 192-208.
Denicoff, K. D., Smith-Jackson, E. E., Disney, E. R., Suddath, R. L., Leverich, G. S. & Post,
R. M. (1997). Preliminary evidence of the reliability and validity of the prospective life-chart
methodology (LCM-p). J Psychiatr Res 31, 593-603.
Edinger, J. D., Bonnet, M. H., Bootzin, R. R., Doghramji, K., Dorsey, C. M., Espie, C. A.,
Jamieson, A. O., McCall, W. V., Morin, C. M. & Stepanski, E. J. (2004). Derivation of research
diagnostic criteria for insomnia: report of an American Academy of Sleep Medicine Work Group.
Sleep 27, 1567-96.
Edinger, J. D., Wyatt, J. K., Olsen, M. K., Stechuchak, K. M., Carney, C. E., Chiang, A., et al
(2009). Reliability and validity of the Duke Structured Interview for Sleep Disorders for insomnia
screening. In 23rd Annual Meeting of the Associated Professional Sleep Societies, LLC.
Eich, E., Macaulay, D. & Ryan, L. (1994). Mood dependent memory for events of the personal
past. Journal of Experimental Psychology: General 123, 201-215.
Eidelman, P., Talbot, L. S., Gruber, J., Hairston, I. & Harvey, A. G. (2010). Sleep architecture
as correlate and predictor of symptoms and impairment in inter-episode bipolar disorder: taking on
the challenge of medication effects. J Sleep Res 19, 516-24.
First, M., Spitzer, R., Gibbons, M. & Williams, J. (1997). Structured Clinical Interview for DSM IV
Axis 1 Disorders: clinician version. American Psychiatric Press: Washington, DC.
Fossion, P., Staner, L., Dramaix, M., Kempenaers, C., Kerkhofs, M., Hubain, P., Verbanck,
P., Mendlewicz, J. & Linkowski, P. (1998). Does sleep EEG data distinguish between UP, BPI or
BPII major depressions? An age and gender controlled study. J Affect Disord 49, 181-7.

21
Gillin, J. C., Duncan, W., Pettigrew, K. D., Frankel, B. L. & Snyder, F. (1979). Successful
separation of depressed, normal and insomniac subjects by EEG sleep data. Archives of General
Psychiatry 36, 85-90.
Harvey, A. G. (2008). Sleep and circadian rhythms in bipolar disorder: seeking synchrony, harmony,
and regulation. Am J Psychiatry 165, 820-9.
Hoffmann, R., Hendrickse, W., Rush, A. J. & Armitage, R. (2000). Slow-wave activity during
non-REM sleep in men with schizophrenia and major depressive disorders. Psychiatry Res 95, 215-25.
Huber, R., Maatta, S., Esser, S. K., Sarasso, S., Ferrarelli, F., Watson, A., Ferreri, F.,
Peterson, M. J. & Tononi, G. (2008). Measures of cortical plasticity after transcranial paired
associative stimulation predict changes in electroencephalogram slow-wave activity during
subsequent sleep. J Neurosci 28, 7911-8.
Hudson, J. I., Lipinski, J. F., Frankenburg, F. R., Grochocinski, V. J. & Kupfer, D. J. (1988).
Electroencephalographic sleep in mania. Arch Gen Psychiatry 45, 267-73.
Joffe, R. T., MacQueen, G. M., Marriott, M. & Trevor Young, L. (2004). A prospective,
longitudinal study of percentage of time spent ill in patients with bipolar I or bipolar II disorders.
Bipolar Disorders 6, 62-6.
Knowles, J. B., Cairns, J., MacLean, A. W., Delva, N., Prowse, A., Waldron, J. &
Letemendia, F. J. (1986). The sleep of remitted bipolar depressives: comparison with sex and age-
matched controls. Can J Psychiatry 31, 295-8.
Landsness, E. C., Goldstein, M. R., Peterson, M. J., Tononi, G. & Benca, R. M. (2011).
Antidepressant effects of selective slow wave sleep deprivation in major depression: a high-density
EEG investigation. J Psychiatr Res 45, 1019-26.
Leverich, G. S. & Post, R. M. (1997). The NIMH Life Chart Manual for Recurrent Affective Illness: The
LCM-S (Self Version). NIMH Monograph, Biological Psychiatry Branch.

22
Linkowski, P., Kerkhofs, M., Rielaert, C. & Mendlewicz, J. (1986). Sleep during mania in
manic-depressive males. Eur Arch Psychiatry Neurol Sci 235, 339-41.
Mendelson, W. B., Sack, D. A., James, S. P., Martin, J. V., Wagner, R., Garnett, D., Milton,
J. & Wehr, T. A. (1987). Frequency analysis of the sleep EEG in depression. Psychiatry Res 21, 89-94.
Murray, G., Allen, N. B. & Trinder, J. (2002). Mood and the circadian system: investigation of a
circadian component in positive affect. Chronobiol Int 19, 1151-69.
Ong, A. D., Exner-Cortens, D., Riffin, C., Steptoe, A., Zautra, A. & Almeida, D. M. (2013).
Linking stable and dynamic features of positive affect to sleep. Ann Behav Med 46, 52-61.
Phillips, M. L., Travis, M. J., Fagiolini, A. & Kupfer, D. J. (2008a). Medication effects in
neuroimaging studies of bipolar disorder. American Journal of Psychiatry 165, 313-20.
Phillips, M. L., Travis, M. J., Fagiolini, A. & Kupfer, D. J. (2008b). Medication effects in
neuroimaging studies of bipolar disorder. Am J Psychiatry 165, 313-20.
Plante, D. T., Landsness, E. C., Peterson, M. J., Goldstein, M. R., Riedner, B. A., Wanger,
T., Guokas, J. J., Tononi, G. & Benca, R. M. (2012). Sex-related differences in sleep slow wave
activity in major depressive disorder: a high-density EEG investigation. BMC Psychiatry 12, 146.
Rechtschaffen, A. (1968). A Manual of Standardized Terminology, Techniques and Scoring System for Sleep
Stages of Human Subjects. Brain Information Service/Brain Research Institute: Los Angeles (University
of California).
Rush, A. J., Gullion, C. M., Basco, M. R., Jarrett, R. B. & Trivedi, M. H. (1996). The
Inventory of Depressive Symptomatology (IDS): Psychometric properties. Psychological Medicine 26,
477-486.
Russell, J. A., Weiss, A. & Mendelsohn, G. A. (1989). Affect Grid: A single-item scale of pleasure
and arousal. Journal of Personality and Social Psychology 57, 493-502.
23
Sackeim, H. A. (2001). The definition and meaning of treatment-resistant depression. J Clin
Psychiatry 62 Suppl 16, 10-7.
Shiota, M. N., Neufeld, S. L., Yeung, W. H., Moser, S. E. & Perea, E. F. (2011). Feeling good:
autonomic nervous system responding in five positive emotions. Emotion 11, 1368-78.
Sitaram, N., Nurnberger, J. I., Jr., Gershon, E. S. & Gillin, J. C. (1982). Cholinergic regulation
of mood and REM sleep: potential model and marker of vulnerability to affective disorder. Am J
Psychiatry 139, 571-6.
Stein, K. D., Goldman, M. S. & Del Boca, F. K. (2000). The influence of alcohol expectancy
priming and mood manipulation on subsequent alcohol consumption. Journal of Abnormal Psychology
109, 106-115.
Steptoe, A., O'Donnell, K., Marmot, M. & Wardle, J. (2008). Positive affect, psychological well-
being, and good sleep. J Psychosom Res 64, 409-15.
Talamini, L. M., Bringmann, L. F., de Boer, M. & Hofman, W. F. (2013). Sleeping worries
away or worrying away sleep? Physiological evidence on sleep-emotion interactions. PLoS One 8,
e62480.
Talbot, L. S., Hairston, I. S., Eidelman, P., Gruber, J. & Harvey, A. G. (2009). The effect of
mood on sleep onset latency and REM sleep in interepisode bipolar disorder. J Abnorm Psychol 118,
448-58.
Tononi, G. (2009). Slow wave homeostasis and synaptic plasticity. J Clin Sleep Med 5, S16-9.
van der Helm, E., Yao, J., Dutt, S., Rao, V., Saletin, J. M. & Walker, M. P. (2011). REM sleep
depotentiates amygdala activity to previous emotional experiences. Curr Biol 21, 2029-32.
Werth, E., Achermann, P. & Borbely, A. A. (1997). Fronto-occipital EEG power gradients in
human sleep. J Sleep Res 6, 102-12.

24
Williams, J. M. G., Healy, H., Eade, J., Windle, G., Cowen, P. J., Green, M. W. & Durlach,
P. (2002). Mood, eating behaviour and attention. Psychological Medicine 32, 469-481.
Young, R., Biggs, J., Ziegler, V. & Meyer, D. (1978). A rating scale for mania: reliability, validity
and sensitivity British Journal of Psychiatry 133, 429-425.
25
Table 1. Sociodemographic and clinical characteristics by diagnostic group.
Demographic Bipolar n = 20
Control n = 23 Statistic p
Age (Years) 32.85(10.55) 38.65(12.83) t(41) = 1.60 0.116 Gender (%) χ2(1) = 1.08 0.298 Male 2(10.0%) 5(21.7%) Female 18(90.0%) 18(78.3%) Ethnicity (%) χ2(5) = 3.02 0.697 African American 1(5.3%) 1(4.8%) Asian/Pacific Islander 5(26.3%) 4(19.0%) Hispanic 2(10.5%) 3(14.3%) Native American 0(0.0%) 0(0.0%) White 9(47.4%) 9(42.9%) Other 1(5.3%) 4(19.0%) Education (%) χ2(5) = 4.75 0.448 High school 1(5.0%) 1(4.3%) Some college 7(35.0%) 5(21.7%) 2yr college 1(5.0%) 4(17.4%) 4yr college 9(45.0%) 9(39.1%) Master’s 1(5.0%) 4(17.4%) Doctorate 1(5.0%) 0(0.0%) Employed (%) χ2(2) = 5.17 0.076 Full-time 7(35.0%) 16(69.6%) Part-time 7(35.0%) 4(17.4%) Unemployed 6(20.0%) 3(13.0%)
Clinical YMRS 5.59 (6.23) 1.65 (1.60) t(35) = -2.54 0.021 IDS-C 2.80 (2.60) 0.56 (0.92) t(44) = -3.19 0.005 BD Age of Onset (years) 18.65 (9.70) - - - BD Illness Duration (years) 14.60 (8.61) - - - # (Hypo)manic Episodes 7.20 (6.39) - - - # Depressive Episodes 9.45 (10.16) - - - Psychotropic Medications - - - Polytherapy (%) 16(80.0%) - - - Mood Stabilizer (%) 15(75.0%) - - - Antipsychotic (%) 10(50.0%) - - - Antidepressant (%) 15(75.0%) - - - Anxiolytic (%) 4(20.0%) - - - Sedative Hypnotic (%) 2(10.0%) - - - Stimulant (%) 1(5.0%) - - - Medication Composite 1.81 (2.47) - - - Baseline Sleep Recording Total Sleep Time (minutes) Range (min-max)
445.25 (81.97) 293.50-592.00
402.13 (81.42) 203.50-548.00
t(41) = -1.73 0.092
Bedtime (minutes) Range (min-max)
22:52 (01:14) 20:23-00:50
23:14 (00:57) 21:46-01:16
t(41) = 1.08 0.285
Waketime (minutes) Range (min-max)
7:23 (00:57) 5:36-9:08
6:33 (00:59) 4:51-8:36
t(41) = -2.82 0.007
Note. Mean values are displayed with standard deviations in parentheses where applicable; BD = Bipolar Disorder; YMRS = Young Mania Rating Scale; IDS-C = Inventory of Depressive Symptoms-Clinician Rated.

26
Table 2. Sleep architecture on the mood induction nights. Sad Mood Induction Analysisa
Baseline Sad Night Group Night
Group X Night
Sleep Variable Bipolar Control Bipolar Control F p F p F p TST 442.74(85.66) 412.69(71.29) 438.93(93.61) 414.67(149.16) 2.37 0.133 0.28 0.597 0.23 0.63 TWT 62.71(61.33) 26.76(36.06) 55.62(71.08) 25.43(24.47) 7.49 0.010 0.15 0.701 0.07 0.793 N1 9.66(6.59) 8.77(7.47) 10.95(5.51) 5.52(4.10) 1.89 0.178 0.93 0.341 0.69 0.413 N2 80.44(45.66) 73.57(33.18) 98.00(39.09) 94.36(32.27) 1.12 0.296 0.63 0.432 0.16 0.696 SWS 97.56(40.14) 95.40(34.80) 82.26(60.52) 82.83(30.63) 0.01 0.932 1.90 0.177 0.02 0.894 REM 80.44(45.67) 73.57(33.1) 98.00(39.09) 94.36(32.37) 0.31 0.584 6.32 0.017 0.05 0.834
Happy Mood Induction Analysisb
Baseline Happy Night Group Night Group X
Night Sleep Variable Bipolar Control Bipolar Control F p F p F p TST 453.03 (85.5) 399.78(84.96) 418.72(102.46) 377.21(84.96) 3.75 0.061 3.47 0.071 0.15 0.703 TWT 60.34(58.84) 25.97(36.30) 41.47(30.97) 26.14(31.25) 5.68 0.023 1.29 0.264 1.33 0.256 N1 41.09(36.49) 35.60(34.68) 36.09(28.74) 25.60(13.82) 0.92 0.344 2.24 0.143 0.25 0.621 N2 206.09(70.72) 195.69(65.64) 198.91(71.56) 179.00(63.57) 0.60 0.446 1.28 0.266 0.20 0.656 SWS 106.72(43.23) 90.21(35.36) 94.87(37.55) 83.02(34.39) 2.28 0.139 1.37 0.250 0.08 0.776 REM 99.13(50.60) 78.29(35.81) 86.22(50.55) 84.67(52.46) 0.64 0.428 0.20 0.657 1.76 0.194 Note. Mean (standard deviation) are presented. Units are minutes for all variables. TST = total sleep time; TWT = total wake time; N1 = NREM Stage 1; N2 = NREM Stage 2; SWS = Slow wave sleep or NREM Stages 3 and 4; aBipolar n = 17, Control n = 21; b Bipolar n = 16, Control n = 21.