Embed Size (px)
Citation preview

NR
RI/
TR
-2012
/24
DEVELOPMENT OF A BED PERMEABILITY TEST FOR
IRON ORE SINTERING
By David J. Englund May 2012 Technical Report NRRI/TR-2012/24 Natural Resources Research Institute University of Minnesota Duluth 5013 Miller Trunk Highway Duluth, MN 55811-1442 Coleraine Minerals Research Laboratory One Gayley Avenue PO Box 188 Coleraine, MN 55722

Recommended Citation Englund, D.J., 2012, Development of a Bed Permeability Test for Iron Ore Sintering : University of Minnesota Duluth, Natural Resources Research Institute, Coleraine Minerals Research Laboratory, Technical Report NRRI/TR-2012/24, 35 p. Natural Resources Research Institute University of Minnesota, Duluth 5013 Miller Trunk Highway Duluth, MN 55811-1442 Telephone: 218-720-4272 Fax: 218-720-4329 e-mail: [email protected] Web site: http://www.nrri.umn.edu/egg ©2012 by the Regents of the University of Minnesota All rights reserved. The University of Minnesota is committed to the policy that all persons shall have equal access to its programs, facilities, and employment without regard to race, color, creed, religion, national origin, sex, age, marital status, disability, public assistance status, veteran status, or sexual orientation.
This publication is accessible from the home page of the Coleraine Minerals Research Laboratory or Economic Geology Group of the Center for Applied Research and Technology Development at the Natural Resources Research Institute, University of Minnesota, Duluth (www.nrri.umn.edu/cartd/cmrl or http://www.nrri.umn.edu/egg) as a PDF file readable with Adobe Acrobat 6.0.
Date of release: May 2012

1
Table of Contents PAGE
# Summary and Recommendations 3 Objective 4 Introduction 4 Equipment 4 General Test Procedure 6 Discussion of Results 6
Definition of Terms in Results Tables 7 Wet Mix Bulk Density 8 Wet Mix Void Fraction 8 Averaged JPU (Japanese Permeability Unit) 8 Granulation Index 9 Mean Granule Diameter 9 Percent Compaction 9 JPU vs. Granulation Index 9
Summary 10 Recommendations 10 References 11 Tables Table 1 Component Size Analysis 12 Table 2 Un-Granulated Mass Averaged -20M and Mean Particle Size 12 Table 3a Permeability Tests 6” x 16” Cell – Blend I – Granulation Drum 13 Table 3b Permeability Tests 6” x 16” Cell – Blend II – Granulation Drum 14 Table 3c Permeability Tests 3” x 8” Cell – Blend II – 18-inch Balling Disc 3/16” Lifters 15 Table 3d Permeability Tests 3” x 8” Cell – Blend II – 18-inch Balling Disc 1/2” Lifters 16 Table 4 Optimum Moisture Range by Bed Characteristic 17 Figures Figure 1 Sinter Cement Mixer – Dry Mixing 18 Figure 2 Sinter Granulation Drum 18 Figure 3 18-Inch Balling Disc 18 Figure 4 Granulation Drum Water Spray Bar 18 Figure 5 Sinter Granulation Drum Lifter Detail 19 Figure 6 Balling Disc Lifter Detail 19 Figure 7 3” x 22” Cell 19 Figure 8 3” x 8” and 6” x 16” Cells 19 Figure 9 Balling Disc with Load and Water Spray Addition 20 Figure 10 Wet Mix Bulk Density vs. Mix Moisture Content in 6” x 16” Cell 21 Figure 11 Wet Mix Bulk Density vs. Mix Moisture Content in 3” x 8” Cell 21 Figure 12 Combined Cell Data for Wet Mix Bulk Density vs. Mix Moisture 22 Figure 13 Mix Void Fraction vs. Mix Moisture in 6” x 16” Cell 23 Figure 14 Mix Void Fraction vs. Mix Moisture in 3” x 8” Cell 23 Figure 15 Combined Cell Data for Wet Mix Void Fraction vs. Mix Moisture 24 Figure 16 Averaged JPU vs. Mix Moisture in 6” x 16” Cell 25
2
Table of Contents (cont’d) PAGE #
Figure 17 Averaged JPU vs. Mix Moisture in 3” x 8” Cell 25 Figure 18 Combined Cell Data for Average JPU vs. Mix Moisture with Prior Sinter Pot Data 26 Figure 19 Granulation Index vs. Mix Moisture in 6” x 16” Cell 27 Figure 20 Granulation Index vs. Mix Moisture in 3” x 8” Cell 27 Figure 21 Combined Cell Data for Granulation Index vs. Mix Moisture 28 Figure 22 Mass Averaged Granule Diameter vs. Mix Moisture in 6” x 16” Cell 29 Figure 23 Mass Averaged Granule Diameter vs. Mix Moisture in 3” x 8” Cell 29 Figure 24 Combined Cell Data for Mean Granule Diameter vs. Mix Moisture 30 Figure 25 Percent Compaction in Bed vs. Mix Moisture in 6” x 16” Cell 31 Figure 26 Percent Compaction in Bed vs. Mix Moisture in 3” x 8” Cell with
Prior Sinter Pot Data 31 Figure 27 Average JPU vs. Granulation Index for Combined Data Points 32 Appendix Sinter Permeability Test Procedure 33

3
Summary: A sinter mix permeability measurement test was developed and used to evaluate two sinter mix blends and two granulation methods. Two permeability cell sizes were also evaluated. The test appears capable of distinguishing between bed characteristics resulting from moisture and mix composition changes. A permeability cell of 3-inches diameter by 8-inches high offers the advantage of shorter test times and less material consumption. However, it does not simulate the full sinter bed height. The small cell can be used to rapidly screen tests, identifying conditions of interest, which should be followed up with tests in a cell of equal bed height, for characterization under anticipated sintering conditions. Two granulation methods were employed, determined by sample size. An 18-inch balling disc was used for test charges less than 5 lbs, and the sinter granulation drum was used for samples in excess of 30 lbs. There are some differences between granules produced by disc vs. drum. Using the drum offers the advantage of being consistent with the sinter pot trials in which the drum is used. The permeability test is an evaluation of bed void fraction, resistance to flow and granule properties, generally as a function of moisture content. Since granule size is shown to improve with increasing moisture, it is possible to establish optimum moisture beyond acceptable sintering range. Excessive water in the mix results in condensation in the bed, leading to mud and poor permeability. Knowledge of the relationship between Japanese Permeability Unit (JPU) and moisture content is helpful in determining optimum moisture content that will produce good quality sinter. The test should prove useful in evaluating new mixes or proposed changes to existing mixes. Recommendations: The test procedure and equipment proved useful in understanding bed permeability factors, with regard to cold mix conditions. However, the program has not fully evaluated a range of blends representing a range in mix compositions, so test sensitivity to blend properties has not been established. A follow-up program could be conducted to evaluate 3-4 significantly different sinter blends, to demonstrate test response to blend composition. A program of this nature would require a new sinter component inventory at the Coleraine Minerals Research Laboratory (CMRL). Additional testing could be carried out comparing balling disc product with granulation drum product so that both devices produce similar granulation characteristics at varied sample sizes. Residence time in the granulation unit might also be evaluated in this program. Cell diameter was specified around sample size constraints in combination with cell height; increased diameter should decrease wall leakage effects. The 18-inch balling disc could be further modified with variable speed drive and additional lifter variations as part of the goal to produce granulation characteristics similar to the granulation drum.

4
Objective: The program objective was to develop a sinter bed characterization test. The test would quantify properties such as bed bulk density, void fraction, and permeability using the JPU equation, which can be used to optimize airflow, combustion, and productivity in the sintering process. The test would also be used for comparisons between alternative mix blends and their effect on granulation, permeability, and ultimately, productivity. Introduction: CMRL commissioned a new sinter facility in 20101; however, the installation did not include a means for quantifying bed permeability and mix granulation characteristics. A typical sinter pot test requires 250 lbs of material, and if several tests are required to establish optimum conditions for production rate, as much as 1000 lbs of components might be consumed in the process. Since large quantities of material are consumed at full pot scale, it was desirable to develop a bed characterization test to minimize the number of pots fired. Most often, moisture content is the driving factor on granulation and productivity. However, there may be projects where the goal is component replacement in the mix. In this case, it is desirable to know what impact a component change will have on productivity. This study, conducted in 2011, was aimed at developing a bed characterization test. The work carried out was based on the same mix used in 2010, identified as Blend I; however, during the course of the work, two components were exhausted. A second blend, Blend II, was developed from the remaining materials, and used to complete the program. The ore components were not identified by source for reasons of confidentiality. Burned lime was added as a binder (2.2%wt) in all tests. The reader is referred to the 2010 report for details on test conditions and results. This report discusses development of a permeability test procedure by which sinter bed characteristics were quantified, and used to identify optimum conditions for sintering. The study was successful in achieving the goal. However, there is room for additional research, to develop expertise in application of the test to a wider range of sinter mixes, and possible improvements to the granulation equipment, such as lifter arrangement and rotation speed.
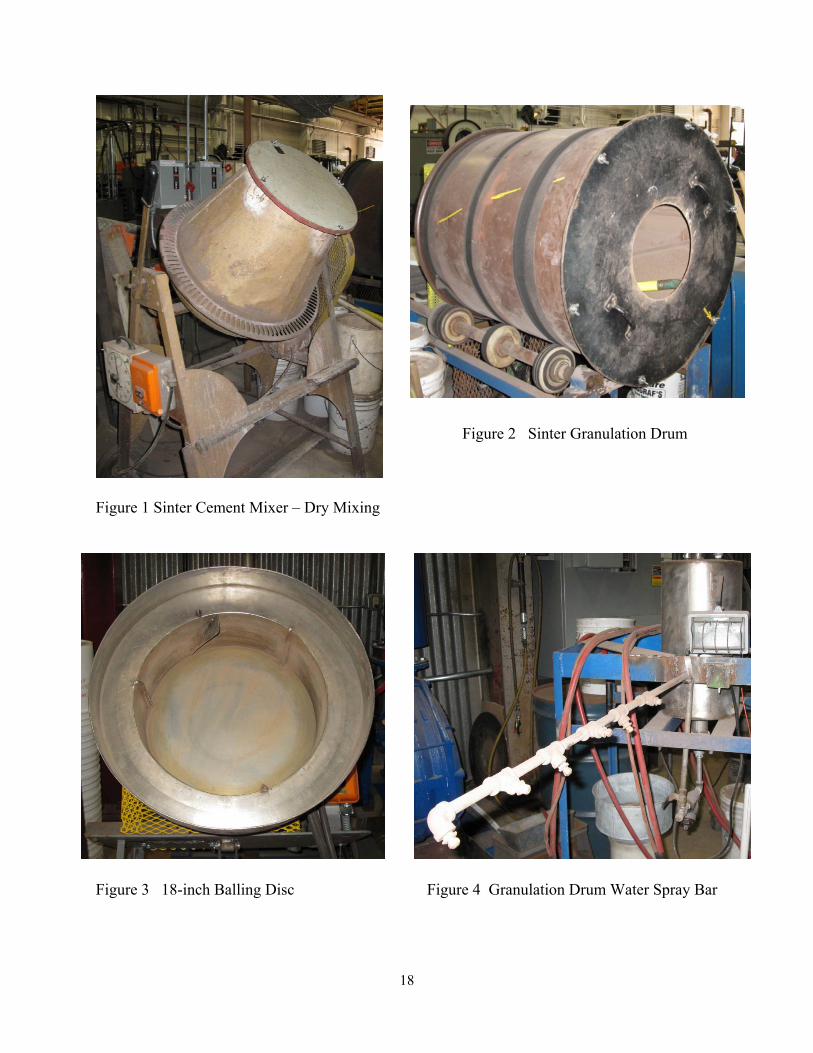
Equipment: The test requires a container or “Cell” in which the wet mix is loaded. The cell is mounted on a stand connected to the sinter pot exhaust system, and air flow is induced through the bed over a range of pressures. Air flow is measured and used in determination of the JPU. The stand and support were fabricated and plumbed into the sinter wind box, so that the sinter suction blower and sinter control system could be used to run the test. Two cells were fabricated from PVC pipe, a 6-inch diameter by 16-inch high unit, and a 3-inch diameter by 8-inch high unit. The 16-inch unit required about 33 lbs of mix, and the 8-inch unit required about 5.5 lbs. Dry mixing was accomplished in the sinter cement mixer, see Figure 1. Granulation and water addition were carried out in one of two ways. The standard granulation drum was used to

5
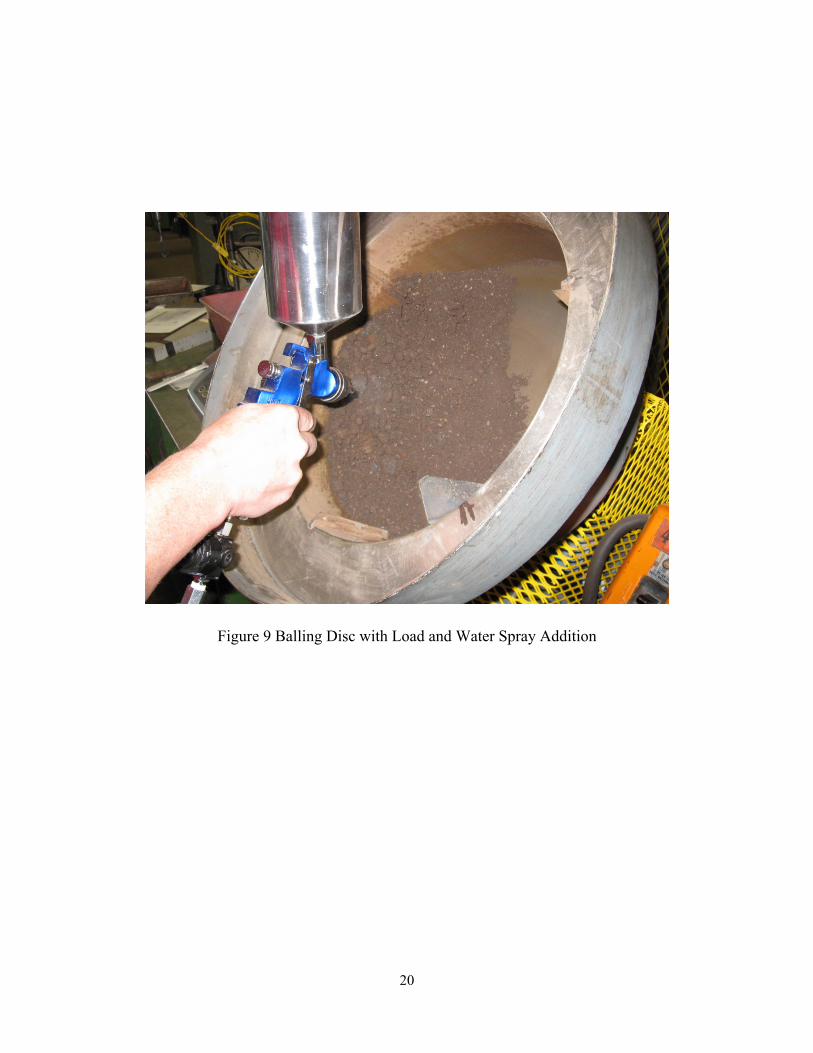
granulate single charges (>30 lbs) when using the 16-inch cell, see Figure 2. For charges less than 6 lbs, required by the 8-inch cell, an 18-inch balling disc was reconditioned with lifters and used for granulation, see Figure 3. A 5-lb charge had insufficient sample volume for the sinter granulation drum. Water was added by means of pressurized spray, in the sinter drum; the spray bar had five nozzles to distribute water uniformly across the bed, see Figure 4. In the balling disc, hand sprays were used initially, but were replaced by a hand-held pressurized paint sprayer, see Figure 9. The granulation drum lifter arrangement is shown in Figure 5. In the balling disc, two lifter series were carried out, one using 3/16” lifters on 120o spacing, and a second series using 1/2" lifters on the same spacing. Figure 6 provides detail of the 3/16” and 1/2” lifters. Disc speed was constant at 26 rpm, and the pan was set at 32o from horizontal. In Figure 3, another single lifter is shown near the top of the disc. This lifter was added after completion of this work, for a client’s program. Its purpose was to promote additional mixing and to minimize particle size segregation in the bed. Figures 7 and 8 show three permeability cells, the 3” x 8” and 6” x 16” used in this study, and a 3” x 22”cell, developed at a later time. The advantage of the 3” x 8” cell is shorter test time and minimal consumption of sample, but it requires a balling disc for granulation. The 6” x 16” unit takes longer to perform, but can use the sinter granulation drum, which should produce granules similar to those in sinter pot trials. It will be shown that the granulation characteristics were slightly different between the drum and the disc. The 3” x 22” cell charge was also granulated in the balling disc, because the small sample volume was too small for the drum. In regard to granulation methods, there are three points to consider:
1. If the permeability test is conducted in parallel with sinter pot firing, sinter drum granulation product can be utilized; however, this method prevents determining optimum water addition in advance of sinter pot firing and will not minimize the number of pots fired.
2. The balling disc was selected for small sample volumes because of availability. A small scale granulation drum could be fabricated, but was not envisioned in this program. 3. Based on subsequent tests in a client’s program, the inclination now is toward using a cell equal to full bed height tested in the pot trials. Choice of drum or disc is dependent on cell volume and charge weight.
6
General Test Procedure: Dry Mixing: The test sequence began by weighing mix components and dry mixing in a
cement mixer. In order to save time, a single weighing/mixing step was performed with sufficient mix for multiple permeability tests by splitting the dry mixed product into charges. If binder was required, such as burned lime, it was not added at this step, but rather was added to the mix during granulation. Residence time in the cement mixer was six minutes in this study.
Granulation: Burned lime was mixed into the dry-mixed charge using a riffle mixer.
The riffled mix was then placed in either the granulation drum, or the balling disc, dependent on charge weight. Granulation drum water was added by the pressurized spray bar. Total drum residence time was 5 minutes (including water addition). In the balling disc, total residence time was also 5 minutes. Initially, a hand-held pump spray was used to add water in the disc. This was replaced by a pressurized paint sprayer system, which gave a more uniform application, see Figure 9. A sample of the granulated mix (± 1000 gm) was taken for moisture determination. This sample, when dry, provided material for particle density measurement on the granulated mix, and on a portion of the mix crushed to pass 100 mesh, to eliminate particle porosity. Permeability Test: The remaining wet mix was loaded in the permeability cell, which contained a 2” hearth layer. The sinter Programmable Logic Controller (PLC) was programed with a permeability test sequence, which comprised stepping through six pressures and measuring air flow at each pressure setting. For these tests, pressure settings were 10, 20, 30, 40, 50, and 60 in.H2O. Airflow was measured and averaged at each pressure setting. The sequence then repeated itself three times for a total of four measurement cycles. Bed shrinkage from pressure loading was manually recorded. This test sequence was repeated for a series of moisture additions. The permeability test is functional, but has not been fully investigated. Additional test work could be performed, for example, evaluating the role of lifters in the balling disc, the effect of granulation time, and the effect of cell height. Discussion of Results: Table 1 provides size distributions for the blend components. Table 2 provides calculated “dry mix properties,” Mass Averaged Mean Size from fractions in the interval -9 mm +0.83 mm (-3/8”x20M), and Mass Averaged %wt. passing 20M (0.83mm). These two parameters were used in the bed permeability characterization plots that follow. Mean granule diameter was based on the arithmetic average of the screen sizes bracketing each respective mass fraction in the structure performed on the moisture determination sample. Use of the term granule diameter does not imply a spherical shape to the granules. It is based solely on the screen sizes containing each mass fraction. Tables 3a-b contain results using the 6” x 16” cell, Tables 3c-d contain
7
results from the 3” x 8” cell. Tables 3a and 3b are divided by mix composition, whereas Tables 3c and 3d are divided by lifter size in the balling disc. Table 4 presents a comparison of optimum moisture based on various bed characteristics.
Definitions of Terms in Results Tables: Percent Compaction = shrinkage in bed depth during permeability test. Compaction % = ((Heightstart-Heightend)/Heightstart)*100
Wet Mix Bulk Density = Bulk density determined by wet weight of mix and bed volume before and after test (shrinkage), using weight charged to cell. Density (wet) at start =ρ1
Density (wet) at end = ρ1a
Dried Granules Bulk Density = Density measured on dried granules using air pycnometer (will include closed particle voids and internal particle porosity). Dried Granules -100Mesh Density = Density measured on dried granules crushed to pass 100 mesh, using air pycnometer (to eliminate closed voids and internal particle porosity) = ρ0
Density of Moist Granules = Adjusts Dried Granule -100M Density for moisture content in mix as follows.2, 3, 4, 5 100/((100-w)/ρ0 + w/ρw) = ρ2, where w = % wt. moisture, ρw = density of water
Void Fraction = Void volume fraction in sinter mix. Void Fraction Start of test = 1- ρ1/ρ2
Void Fraction End of test = 1- ρ1a/ρ2 (effect of shrinkage)
Average void fraction is used in plots
Japanese Permeability Unit = JPU (m3/min) = F/(A(H/S)
0.6
Where F = flow m3/min, A = bed area m2, H = bed height mm, S = suction pressure mmH2O, calculated for starting height, and ending height, and then averaged for plots. Mean Granule Diameter (9 x 0.83 mm) = Mass fraction averaged by mean screen interval size in +20M (0.83mm) fractions. Granulation Index6 = Means to quantify fines agglomerated in granules ((Dry Mix -20M – Granulated Mix -20M)/Dry Mix -20M)*100
8
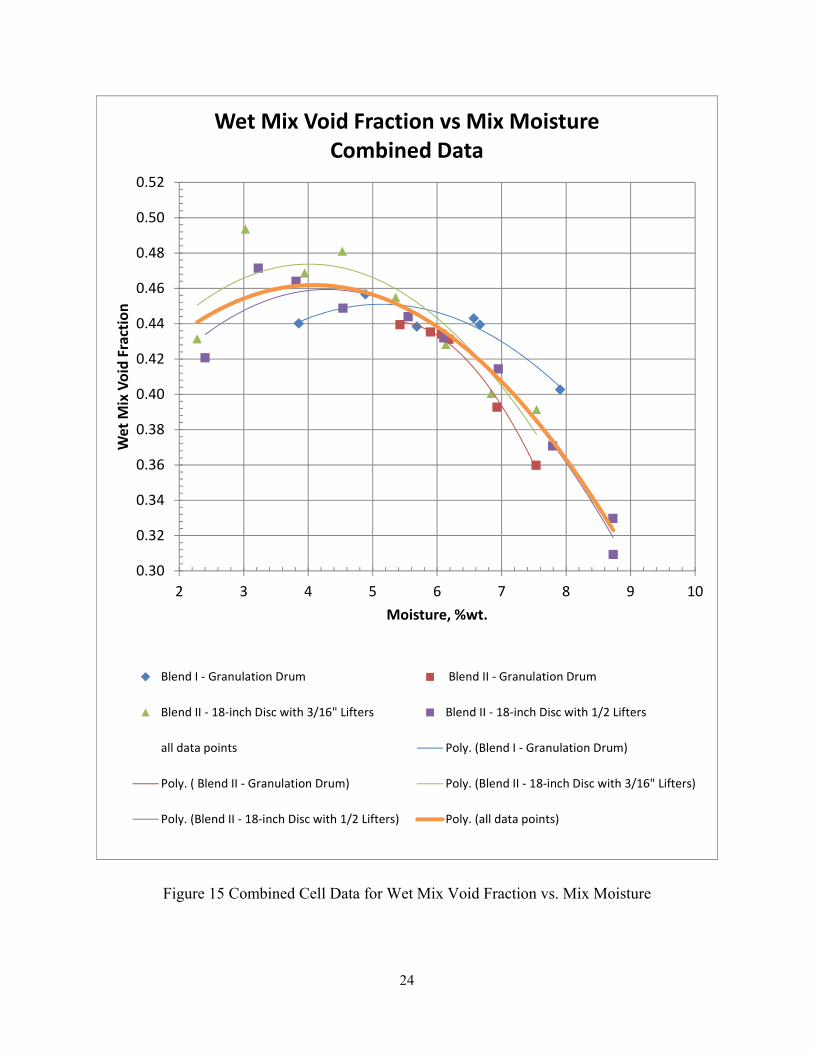
All plots referenced in the discussion show trend lines generated using 2nd order polynomial option. Plots were generated grouping data by cell size separately, and then combined in a third plot for each comparison. For the 6” x 16” plots, the series are grouped by blend composition with granulation in sinter drum. In the 3” x 8” plots, the series are grouped by lifter size (same blend), with granulation in the balling disc. It is possible that some of the differences between series may be attributable to granulation method; more tests are required to confirm this observation. Wet Mix Bulk Density Figures 10- 12: Figure 10 plots bulk density with moisture content in the 16-inch cell. A minimum bulk density occurs in Blend I between 6 and 6.5% moisture, and in Blend II a minimum occurs near 6%. It seems likely that curve shape results from effect of water on granulation. At low moisture content, less than 5%, there is insufficient moisture to promote granulation, and, hence, fines can fill voids, increasing density. As moisture content increases, granulation improves and void fraction increases. At excessive moisture, greater than 7.5%, granules may deform, developing more plasticity, and thus density begins to increase again. In the sinter firing tests with this blend, optimum moisture was targeted at 6.5%, the result of numerous pot tests. Figure 11 plots data from the 8-inch cell. The greater number moisture test points resulted in more sharply defined curves. In this plot, minimum density occurs at 5.5% moisture. The minimums are based on the trend lines; looking at the data points, one can imagine that the minimum may actually occur over a relatively large range of moisture, 4.5 to 6.5%, which is more apparent when all the data are combined in Figure 12. Wet Mix Void Fraction Figures 13-15: Void fraction is plotted against moisture in these plots; under these conditions void fraction reaches a maximum. In Figure 13 (16-inch cell), the curves are broad, and, ideally, more tests should have been conducted between 4 and 5.5% moisture. In Figure 14, the curves are well defined, indicating maximum void fraction of 0.46-0.48 between 3.5 and 4.5% moisture content. The curve regressed from all data points produces a maximum void fraction of 0.46 at 4% moisture in Figure 15. Averaged JPU Figures 16 – 18: JPU values were calculated for each test based on the starting and ending bed height, which were then averaged. The average is plotted in these figures. Differences in magnitude of JPU values between 16-inch and 8-inch cells are related to cell area and height, and resulting air flow. In Figure 16, the curve for Blend I is reasonably well-defined, indicating a maximum JPU around 7.5% moisture. For Blend II, the curve is nearly flat; several additional moisture levels on the lower end would help define the curve. From experience with this mix in sinter trials, these mixes cannot be sintered at moisture levels exceeding 7-7.3%. With moisture content greater than 7.3%, the cakes are poorly fired, and exhibit much channeling, suggesting mud formation from condensation and resulting in pockets of low permeability.

9
Figure 17 plots 8-inch cell data. Again, the curves are well-defined, and maximum JPU occurs between 6 and 6.2%, which is consistent with the targets derived in the earlier sinter pot trials. Figure 18 combines the data, and includes the sinter pot trial data, as moisture vs. productivity on the secondary y-axis. This illustrates that earlier work arrived at an optimum moisture setting, consistent with the permeability tests conducted after-the-fact. The benefit in the earlier work could have been realized in fewer tests, and less material consumed. Granulation Index Figures 19-21: Correspondence with Dr. M. M. Zhang6, led to the definition of a “Granulation Index (GI),” which is a measure of the relative loss in -20 mesh material as a result of granulation (see term definitions on pg 7). The 16-inch/granulation drum data produced a relatively steep slope for increasing index with increasing moisture. This may be a characteristic of the granulation drum, see Figure 19, whereas in Figure 20, the 8-inch /balling disc data exhibited less slope, indicating less of an effect with water. The effect of lifter size does not seem to make much difference. However, there could be other factors that were not investigated, which might be manipulated to increase granulation in the disc. These include disc angle, disc rpm, # of lifters, lifter orientation in disc, and residence time. A variable speed drive is required to change disc rpm. Figure 21 plots the combined data; it is observed that GI continues to increase with increasing water addition. However, it is emphasized that sinter mixes in excess of 7.5% will not sinter uniformly, resulting in very poor quality and low productivity. Mass Averaged Mean Granule Diameter Figures 22-24: A mass averaged mean particle size was determined from dried granule screen structures. The particle size is based on the sum of the arithmetic mean for each screen interval in the structure, multiplied by the mass fraction on the interval, down to +20M. The -20M fractions are ignored. Thus, the mean size is based on the overall size interval -9mm to +0.83mm (+20M). A comparison of Figures 22 and 23 indicates the granulation drum to have a more significant increase in size with moisture addition, although when plotted together, the data are closely grouped, see Figure 24. Plots such as these may be useful in evaluating granulation equipment modifications, such as lifter design, number and placement, and water addition with regard to nozzle arrangement. Percent Compaction Figures 25-26: These two plots attempt to relate shrinkage with moisture content; Figure 25 does not show a trend. Figure 26 may be indicating increased shrinkage with increasing moisture, but the correlations are poor. The sinter pot tests plotted in Figure 17 are shown here for comparison with permeability cell data. JPU vs. Granulation Index Figure 27: This plot relates JPU and GI. The indication is that there is an upper limit on GI beyond which JPU begins to fall off. In practical terms, this is driven by moisture content and its effect in the granulation devices used throughout this study. It would be interesting to evaluate several types of granulation devices to see if granule growth could be improved within the operating moisture range of 5-7%.
10
Summary: A sinter mix permeability measurement test was developed and used to evaluate two sinter mix blends and two granulation methods. Two permeability cell sizes were also evaluated. The test appears capable of distinguishing between bed characteristics resulting from moisture and mix composition changes. A permeability cell 3 inches in diameter by 8 inches high offers the advantage of shorter test times and less material consumption. However, it does not simulate the full sinter bed height. The small cell can be used to rapidly screen tests, identifying conditions of interest, which should be followed up with tests in a cell of equal bed height, for characterization under anticipated sintering conditions. Two granulation methods were employed, determined by sample size. An 18-inch balling disc was used for test charges less than 5 lbs, and the sinter granulation drum was used for samples in excess of 30 lbs. There are some differences between granules produced by disc vs. drum; using the drum offers the advantage of being consistent with the sinter pot trials in which the drum is used. The permeability test is an evaluation of bed void fraction, resistance to flow, and granule properties, generally as a function of moisture content. Since granule size is shown to improve with increasing moisture, it is possible to establish an optimum moisture beyond acceptable sintering range. Excessive water in the mix results in condensation in the bed leading to mud and poor permeability. Knowledge of the relationship between JPU and moisture content is helpful in determining optimum moisture content that will produce good quality sinter. The test should prove useful in evaluating new mixes or proposed changes to existing mixes. Recommendations: The test procedure and equipment proved useful in understanding bed permeability factors, with regard to cold mix conditions. However, the program has not fully evaluated a range of blends representing a range in mix compositions, so test sensitivity to blend properties has not been established. A follow-up program could be conducted to evaluate 3-4 significantly different sinter blends, to demonstrate test response to blend composition. A program of this nature would require a new sinter component inventory at CMRL. Additional testing could be carried out comparing balling disc product with granulation drum product so that both devices produce similar granulation characteristics at varied sample sizes. Residence time in the granulation unit might also be evaluated in this program. Cell diameter was specified for sample size constraints in combination with cell height; increased diameter should decrease wall leakage effects. The 18-inch balling disc could be further modified with variable speed drive and additional lifter variations as part of the goal to produce granulation characteristics similar to the granulation drum.

11
References: 1. Shallow vs. Deep Bed Sintering, Coleraine Minerals Research Laboratory, Report NRRI/TR-2010-18, 9/1/2010, D. J. Englund 2. Granulation of Iron Ore Sinter Feeds, P.W. Roller and B.A. Firth, BHP Tech. Bull. 1981 3. The Measurement of Void Fraction in Bed of Granulated Iron Ore sinter Feed, W.J. Rankin and P. W. Roller, Transactions ISIJ, Vol. 25, 1985 4. Influence of Water Condensation on the Permeability of Sinter Beds, W.J. Rankin and P. W. Roller, Transactions ISIJ, Vol. 27, 1987 5. Effect of Raw Mixture Properties on Bed Permeability during Sintering, E. Kasai, W.J. Rankin, and J. F. Gannon, ISIJ International, Vol. 29, 1989 6. Correspondence with M. Zhang – Research Engineer, Raw Materials & Ironmaking, ArcelorMittal USA, East Chicago, Indiana

12
Table 1 Component Size Analysis, %wt On Size
Mean Screen Interval Size mm7.9 5.75 4.015 2.845 2.005 1.409 1.0005
mesh 3 4 6 8 10 14 20 28 35 48 65 100 150 200 270 325 -325 Totalsmm 6.8 4.7 3.33 2.36 1.65 1.168 0.833 0.589 0.417 0.295 0.208 0.147 0.104 0.074 0.053 0.044
Sinter OresA 5.1 14.7 11.9 8.9 1.7 9.9 8 3.3 2.8 2.6 3.2 6.1 7.6 7.5 4 0.9 1.8 100B 33.6 4.6 3.9 2.9 0.5 4 4.4 3.5 3.9 4 3.5 4.4 3.9 4.2 3.5 1.4 13.8 100C 10.2 6.9 6.5 6.8 2.8 9.1 6.3 5.8 5.5 6.1 5.5 4.4 3.4 2.6 1.8 0.5 15.8 100D 11.4 7.6 9.8 8.6 3.6 8.2 8.1 4.7 4.3 4 3.7 4.8 4.9 6.1 6.5 2.6 1.1 100E 18.8 7.6 8.1 7.1 2.8 6.1 5.9 3.7 4 4.3 3.6 3.7 2.6 2.2 1.8 0.6 17.1 100ConcentrateF 0 0 0 0 0 0 2.1 2.3 5.4 11.8 18.5 20.5 18.1 12.6 6.1 1.1 1.5 100Pellet Chips/FinesG 4.5 27 18.9 9.4 2.4 8.3 4.6 1.8 1.3 1.1 0.7 0.6 0.7 0.7 1.2 0.8 16 100H 0.2 6.4 10.3 11.3 3.9 15.7 11.4 4.6 3.2 2.3 1.4 1.4 1.7 1.7 2.3 1.3 20.9 100Taconite TailingI 0.3 0.7 2.4 4.8 4 13.2 16.1 9.6 9.6 9.8 7.2 6.8 5.1 2.8 2 0.7 4.9 100
Limestone 0 0 3.7 16.9 5.6 19.9 18.3 7.3 5.3 3.9 2.7 2.4 1.5 1.1 0.8 0.4 10.2 100Burned Lime 0 0 0 0 0 0 0 0 0 0 0 0 0 0.6 0.8 0.8 97.7 99.9Dolomite 0.1 0.1 1.9 5.4 3.5 22.7 20.4 10 8.1 5.9 3.8 4 4.4 2.4 1.8 0.2 5.3 100Coke 0 0 4.4 11.7 4.2 15.2 15.4 8.9 8.5 7 4.8 4.5 3.3 2.9 2.2 0.8 6.2 100
Table 2 Un-Granulated Mass Averaged %wt -20M and Mass Averaged Mean Particle Size Between 9mm and 0.83mm
Blend I Blend IIMass Wt'd mean Test Series 1-4b 4c-4f
Component (-9mm+0.83mm) %wt-20M %wt+20M %wt, Test %A 2.23 39.8 60.2 11.28 19.11B 3.27 46.1 53.9 9.77 0.00C 1.90 51.4 48.6 2.26 3.82D 2.24 42.7 57.3 21.05 0.00E 2.65 43.6 56.4 9.77 16.56ConcentrateF 0.02 97.9 2.1 15.79 26.75Pellet Chips/FinesG 3.15 24.9 75.1 2.26 3.95H 1.53 40.8 59.2 2.26 3.82Taconite TailingI 0.72 58.5 41.5 0.75 1.15
Limestone 1.21 35.6 64.4 12.08 12.08Burned Lime 0.00 99.9 0 2.23 2.23Dolomite 0.84 45.9 54.1 4.27 4.27Coke 0.96 49.1 50.9 6.25 6.25
100.00 100.00
Calculated Sinter Blend Mass Wt'd Mean Size in -9mm+0.83mm fractions 1.72 1.27Calculated Sinter Blend Mass Wt'd %wt-20M 53.09 58.72

13
Table 3a Permeability Tests 6" x 16" Cell
Cement Mixer 6 minutes - Granulation Drum 5 minutesBlend I - Granulation Drum
Test # PT-002-A PT-002-B PT-003-a PT-004-a PT-004-bDate 2/1/2011 2/2/2011 2/2/2011 2/2/2011 2/7/2011 2/8/2011
gms water added 1800 2342 2342 533 406 240%wt Moist 5.68 6.57 7.91 6.66 4.89 3.85
6x16" Cell Suction Pressure Flow (Averaged from 4 pressure cycles)Bed Area, m2 Dp, in H2O Dp Pa m3/min m3/min m3/min m3/min m3/min m3/min
0.0182 10 2480 0.399 0.546 0.557 0.443 0.287 0.00020 4960 0.651 0.810 0.826 0.697 0.459 0.144
3x8" Cell 30 7440 0.827 1.003 1.015 0.879 0.605 0.215Bed Area, m2 40 9920 0.971 1.143 1.175 1.033 0.729 0.268
0.0046 50 12400 1.102 1.312 1.311 1.160 0.840 0.31460 14880 1.221 1.366 1.425 1.280 0.937 0.351
Starting Bed Height, Wet Mix, m 0.3556 0.3556 0.3556 0.3556 0.3556 0.3556Ending Bed Height, Wet Mix, m 0.3302 0.3458 0.3458 0.3461 0.3461 0.3437
% Compaction1 7.14 2.77 2.77 2.68 2.68 3.35Wet Mix Bulk Density, gm/cm3
Starting Bed Height,p1 1.8191 1.8455 1.9178 1.8267 1.9055 1.9545Ending Bed Height, p1a 1.9588 1.8978 1.9722 1.8767 1.9578 2.0220
Dried Granules Bulk Density2, gm/cm3 3.9373 3.9567 3.9540 3.9291 3.9393 3.8857
Dried Granules -100 Mesh Density3, gm/cm3,p0 4.1021 4.1016 4.1147 4.0217 4.1594 4.0334
Density Moist Granules, gm/cm3, p2 3.487 3.407 3.301 3.348 3.603 3.611100/[(100-w)/p0 + w/pw)] w = %wt moisture, p0 = density dried granules, pw = density water
Void Volume Fraction (1-p1/p2) 0.478 0.458 0.419 0.454 0.471 0.459Void Volume Fraction (1-p1a/p2) 0.438 0.443 0.403 0.439 0.457 0.440
Pressure, inH2OJPU Based on Starting Bed Height 10 0.37 0.50 0.51 0.41 0.26 0.00
20 0.91 1.13 1.16 0.98 0.64 0.2030 1.48 1.79 1.81 1.57 1.08 0.3840 2.06 2.43 2.49 2.19 1.55 0.5750 2.67 3.18 3.18 2.81 2.04 0.7660 3.30 3.70 3.86 3.46 2.54 0.95
Average 1.80 2.12 2.17 1.90 1.35 0.48
JPU Based on Ending Bed Height 10 0.39 0.51 0.52 0.42 0.27 0.0020 0.95 1.15 1.18 0.99 0.65 0.2130 1.54 1.82 1.84 1.60 1.10 0.3940 2.15 2.47 2.54 2.23 1.57 0.5850 2.79 3.24 3.23 2.86 2.07 0.7860 3.45 3.76 3.92 3.52 2.58 0.97
Average 1.88 2.16 2.21 1.94 1.37 0.49
Averaged JPU 1.84 2.14 2.19 1.92 1.36 0.48Granulation
mass weighted mean diameter (-9x+0.83mm), mm 3.94 4.58 4.88 3.83 3.17 3.08Granulated -20M %wt 13.52 12.75 9.07 23.59 32.48 45.79
Un-Granulated Mass Ave -20M %wt 53.09 53.09 53.09 53.09 53.09 53.09Granulation Index 74.53 75.98 82.91 55.57 38.82 13.74
Notes:1. ((starting Height - Ending Height)/starting Height)*1002. Measurement includes internal voids.3. Crushed to -100 mesh to remove internal voids.

14
Table 3b Permeability Tests 6" x 16" Cell
Cement Mixer 6 minutes - Granulation Drum 5 minutes Blend II - Granulation Drum
Test # PT-004-c PT-004-d PT-004-e PT-004-f PT-004-g PT-004-hDate 2/8/2011 2/8/2011 2/14/2011 2/15/2011 2/15/2011 2/23/2011
gms water added 697 870 959 1048 1138 1048%wt Moist 5.43 5.90 6.18 6.07 7.53 6.93
6x16" Cell Suction PressureBed Area, m2 Dp, in H2O Dp Pa m3/min m3/min m3/min m3/min m3/min m3/min
0.0182 10 2480 0.394 0.411 0.463 0.443 0.462 0.49220 4960 0.613 0.625 0.688 0.650 0.665 0.712
3x8" Cell 30 7440 0.780 0.785 0.858 0.801 0.818 0.873Bed Area, m2 40 9920 0.925 0.919 0.990 0.920 0.945 1.009
0.0046 50 12400 1.041 1.027 1.114 1.022 1.056 1.14360 14880 1.166 1.111 1.231 1.124 1.157 1.260
Starting Bed Height, Wet Mix, m 0.3556 0.3556 0.3556 0.3556 0.3556 0.3556Ending Bed Height, Wet Mix, m 0.3461 0.3493 0.3445 0.3469 0.3453 0.3429
% Compaction1 2.68 1.79 3.13 2.46 2.90 3.57Wet Mix Bulk Density, gm/cm3
Starting Bed Height,p1 1.8951 1.9300 1.8916 1.9160 2.0839 1.8881Ending Bed Height, p1a 1.9470 1.9649 1.9524 1.9640 2.1459 1.9578
Dried Granules Bulk Density2, gm/cm3 3.8324 3.8991 3.9000 3.9591 3.9068 3.7444
Dried Granules -100 Mesh Density3, gm/cm3,p0 4.0474 4.1193 4.0864 4.1303 4.1471 3.8633
Density Moist Granules, gm/cm3, p2 3.473 3.479 3.432 3.471 3.352 3.224100/[(100-w)/p0 + w/pw)]
Void Volume Fraction (1-p1/p2) 0.454 0.445 0.449 0.448 0.378 0.414Void Volume Fraction (1-p1a/p2) 0.439 0.435 0.431 0.434 0.360 0.393
Pressure, inH2OJPU Based on Starting Bed Height 10 0.36 0.38 0.43 0.41 0.43 0.45
20 0.86 0.88 0.96 0.91 0.93 1.0030 1.39 1.40 1.53 1.43 1.46 1.5640 1.96 1.95 2.10 1.95 2.01 2.1450 2.52 2.49 2.70 2.48 2.56 2.7760 3.16 3.01 3.33 3.04 3.13 3.41
Average 1.71 1.68 1.84 1.70 1.75 1.89
JPU Based on Ending Bed Height 10 0.37 0.38 0.44 0.42 0.43 0.4620 0.87 0.88 0.98 0.92 0.95 1.0230 1.41 1.42 1.56 1.45 1.49 1.5940 1.99 1.97 2.14 1.98 2.04 2.1950 2.57 2.52 2.75 2.52 2.61 2.8360 3.21 3.04 3.40 3.09 3.19 3.48
Average 1.74 1.70 1.88 1.73 1.78 1.93
Averaged JPU 1.72 1.69 1.86 1.72 1.77 1.91Granulation
mass weighted mean diameter (-9x+0.83mm), mm 3.42 3.92 4.00 4.08 4.55 4.40Granulated -20M %wt 28.26 23.52 19.98 21.25 16.50 25.02
Un-Granulated Mass Ave -20M %wt 58.72 58.72 58.72 58.72 58.72 58.72Granulation Index 51.87 59.95 65.97 63.81 71.91 57.39
Notes:1. ((starting Height - Ending Height)/starting Height)*1002. Measurement includes internal voids.3. Crushed to -100 mesh to remove internal voids.

15
Table 3c Permeability Tests 3" x 8" Cell
Cement mixer 6 minutes split into charges - 18 inch balling disc - 3 lifters 3/16"Blend II - 18-inch Disc with 3/16" Lifters
Test # PT-005a PT-005b PT-005c PT-005d PT-005e PT-005f PT-005g PT-005hDate 3/11/2011 3/11/2011 3/11/2011 3/14/2011 3/14/2011 3/14/2011 3/14/2011 3/15/2011
gms water added 0 20 40 60 80 100 120 140%wt Moist 2.28 3.03 3.95 4.53 5.36 6.14 6.84 7.54
6x16" Cell Suction PressureBed Area, m2 Dp, in H2O Dp Pa m3/min m3/min m3/min m3/min m3/min m3/min m3/min m3/min
0.0182 10 2480 0.003 0.055 0.154 0.188 0.224 0.234 0.246 0.22420 4960 0.003 0.178 0.241 0.275 0.312 0.327 0.329 0.313
3x8" Cell 30 7440 0.000 0.224 0.297 0.339 0.380 0.406 0.415 0.387Bed Area, m2 40 9920 0.000 0.277 0.360 0.399 0.445 0.472 0.481 0.448
0.0046 50 12400 0.000 0.316 0.412 0.447 0.496 0.528 0.541 0.50160 14880 0.000 0.349 0.458 0.491 0.542 0.578 0.588 0.544
Starting Bed Height, Wet Mix, m 0.1524 0.1524 0.1524 0.1524 0.1524 0.1524 0.1524 0.1524Ending Bed Height, Wet Mix, m 0.1492 0.1508 0.1524 0.1508 0.1508 0.1524 0.1524 0.1524
% Compaction1 2.08 1.04 0.00 1.04 1.04 0.00 0.00 0.00Wet Mix Bulk Density, gm/cm3
Starting Bed Height,p1 2.1782 1.9492 1.9649 1.8964 1.9469 2.0212 2.0012 2.0012Ending Bed Height, p1a 2.2243 1.9695 1.9647 1.9161 1.9672 2.0209 2.0009 2.0009
Dried Granules Bulk Density2, gm/cm3 3.9438 3.9146 3.8501 3.9702 3.9677 3.9183 3.9541 3.9464
Dried Granules -100 Mesh Density3, gm/cm3,p0 4.1966 4.2738 4.1587 4.2330 4.2340 4.2362 4.0292 4.0419
Density Moist Granules, gm/cm3, p2 3.912 3.889 3.698 3.692 3.609 3.534 3.338 3.288100/[(100-w)/p0 + w/pw)]
Void Volume Fraction (1-p1/p2) 0.443 0.499 0.469 0.486 0.461 0.428 0.400 0.391Void Volume Fraction (1-p1a/p2) 0.431 0.494 0.469 0.481 0.455 0.428 0.401 0.391
Pressure, inH2OJPU Based on Starting Bed Height 10 0.02 0.33 0.95 1.15 1.38 1.44 1.51 1.38
20 0.03 1.65 2.25 2.56 2.91 3.05 3.06 2.9130 0.00 2.66 3.53 4.03 4.51 4.82 4.93 4.5940 0.00 3.91 5.09 5.63 6.27 6.65 6.79 6.3250 0.00 5.11 6.65 7.21 8.00 8.52 8.73 8.0960 0.00 6.28 8.24 8.83 9.76 10.40 10.59 9.80
Average 0.01 3.32 4.45 4.90 5.47 5.81 5.93 5.52
JPU Based on Ending Bed Height 10 0.02 0.34 0.95 1.16 1.39 1.44 1.51 1.3820 0.03 1.66 2.25 2.57 2.92 3.05 3.06 2.9130 0.00 2.67 3.53 4.05 4.54 4.82 4.93 4.5940 0.00 3.93 5.09 5.67 6.31 6.65 6.79 6.3250 0.00 5.14 6.65 7.25 8.05 8.52 8.73 8.0960 0.00 6.32 8.24 8.89 9.82 10.40 10.59 9.80
Average 0.01 3.34 4.45 4.93 5.51 5.81 5.93 5.52
Averaged JPU 0.01 3.33 4.45 4.92 5.49 5.81 5.93 5.52Granulation
mass weighted mean diameter (-9x+0.83mm), mm 3.65 3.62 3.37 3.95 4.23 4.07 4.26 4.61Granulated -20M %wt 38.74 34.71 36.07 26.70 26.85 28.53 27.17 22.23
Un-Granulated Mass Ave -20M %wt 58.72 58.72 58.72 58.72 58.72 58.72 58.72 58.72Granulation Index 34.02 40.89 38.57 54.53 54.28 51.42 53.73 62.15
Notes:1. ((starting Height - Ending Height)/starting Height)*1002. Measurement includes internal voids.3. Crushed to -100 mesh to remove internal voids.

16
Table 3d Permeability Tests 3" x 8" Cell
Cement mixer 6 minutes split into charges - 18 inch balling disc - 3 lifters 1/2"Blend II - 18-inch Disc with 1/2 Lifters
Test # PT-006a PT-006b PT-006c PT-006d PT-006e PT-006f PT-006g PT-006h PT-006i PT-006jDate 3/28/2011 3/28/2011 3/28/2011 3/28/2011 3/29/2011 3/29/2011 3/29/1982 3/29/2011 3/29/2011 3/29/2011
gms water added 0 20 40 60 80 100 120 140 140 140%wt Moist 2.40 3.23 3.81 4.54 5.55 6.10 6.95 7.79 8.73 8.73
6x16" Cell Suction PressureBed Area, m2 Dp, in H2O Dp Pa m3/min m3/min m3/min m3/min m3/min m3/min m3/min m3/min m3/min m3/min
0.0182 10 2480 0.002 0.123 0.167 0.200 0.251 0.253 0.249 0.225 0.153 0.18520 4960 0.001 0.198 0.258 0.291 0.348 0.348 0.344 0.310 0.224 0.262
3x8" Cell 30 7440 0.002 0.246 0.323 0.367 0.440 0.439 0.433 0.382 0.274 0.320Bed Area, m2 40 9920 0.084 0.300 0.384 0.426 0.512 0.511 0.501 0.442 0.320 0.362
0.0046 50 12400 0.124 0.346 0.435 0.479 0.573 0.572 0.561 0.496 0.353 0.40160 14880 0.138 0.378 0.476 0.520 0.628 0.624 0.614 0.544 0.383 0.437
Starting Bed Height, Wet Mix, m 0.1524 0.1524 0.1524 0.1524 0.1524 0.1524 0.1524 0.1524 0.1524 0.1524Ending Bed Height, Wet Mix, m 0.1461 0.1508 0.1508 0.1484 0.1492 0.1492 0.1524 0.1508 0.1524 0.1524
% Compaction1 4.17 1.04 1.04 2.60 2.08 2.08 0.00 1.04 0.00 0.00Wet Mix Bulk Density, gm/cm3
Starting Bed Height,p1 2.1056 1.9253 1.9297 1.9044 1.8935 1.9058 1.9680 2.0411 2.2140 2.1344Ending Bed Height, p1a 2.1969 1.9454 1.9498 1.9552 1.9336 1.9461 1.9678 2.0624 2.2138 2.1341
Dried Granules Bulk Density2, gm/cm3 3.9652 3.8703 3.8824 3.8412 3.9282 3.9424 3.9667 3.9470 4.0028 3.9528
Dried Granules -100 Mesh Density3, gm/cm3,p0 4.0719 4.0410 4.0625 4.0357 4.0689 4.0674 4.0792 4.0584 4.0615 4.0248
Density Moist Granules, gm/cm3, p2 3.792 3.680 3.638 3.547 3.477 3.426 3.360 3.277 3.205 3.184100/[(100-w)/p0 + w/pw)]
Void Volume Fraction (1-p1/p2) 0.445 0.477 0.470 0.463 0.455 0.444 0.414 0.377 0.309 0.330Void Volume Fraction (1-p1a/p2) 0.421 0.471 0.464 0.449 0.444 0.432 0.414 0.371 0.309 0.330
Pressure, inH2OJPU Based on Starting Bed Height 10 0.01 0.76 1.03 1.23 1.54 1.56 1.53 1.38 0.94 1.14
20 0.01 1.85 2.40 2.71 3.24 3.24 3.20 2.89 2.08 2.4430 0.03 2.93 3.83 4.36 5.23 5.21 5.14 4.53 3.25 3.8040 1.18 4.24 5.41 6.01 7.22 7.21 7.06 6.23 4.52 5.1250 2.00 5.59 7.01 7.72 9.25 9.23 9.05 8.01 5.69 6.4660 2.48 6.80 8.58 9.35 11.30 11.24 11.05 9.79 6.89 7.86
Average 0.95 3.69 4.71 5.23 6.30 6.28 6.17 5.47 3.90 4.47
JPU Based on Ending Bed Height 10 0.01 0.76 1.03 1.25 1.56 1.58 1.53 1.39 0.94 1.1420 0.01 1.86 2.41 2.75 3.28 3.28 3.20 2.91 2.08 2.4430 0.03 2.94 3.86 4.43 5.30 5.28 5.14 4.56 3.25 3.8040 1.21 4.26 5.45 6.11 7.31 7.30 7.06 6.27 4.52 5.1250 2.05 5.62 7.06 7.84 9.37 9.35 9.05 8.06 5.69 6.4660 2.55 6.85 8.63 9.50 11.45 11.38 11.05 9.85 6.89 7.86
Average 0.98 3.72 4.74 5.32 6.38 6.36 6.17 5.51 3.90 4.47
Averaged JPU 0.96 3.70 4.73 5.27 6.34 6.32 6.17 5.49 3.90 4.47Granulation
mass weighted mean diameter (-9x+0.83mm), mm 3.74 3.41 3.43 3.48 3.72 3.81 4.07 4.10 4.16 5.73Granulated -20M %wt 35.45 34.69 34.51 23.83 30.23 31.86 30.65 27.18 31.20 11.13
Un-Granulated Mass Ave -20M %wt 58.72 58.72 58.72 58.72 58.72 58.72 58.72 58.72 58.72 58.72Granulation Index 39.63 40.92 41.22 59.42 48.51 45.74 47.81 53.70 46.87 81.05
Notes:1. ((starting Height - Ending Height)/starting Height)*1002. Measurement includes internal voids.3. Crushed to -100 mesh to remove internal voids.

17
Table 4 Optimum Moisture Range by Bed Characteristic
6x16 Cell 3 x 8 CellGranulation Drum 18" Balling Disc
Moisture Range, % Moisture Range, %Wet Mix Bulk Density minimum 6 - 6.5 5.2 - 5.7
Wet Mix Void Fraction maximum 4.7 - 5.5 3.7 - 4.5
Average JPU maximum 6.5 - 7.5 6 - 6.5
Granulation Index linear increasing with moisture
Mean Granule Diameter linear slightly increasing with moisture
Compaction NA inconclusive relationships in data
18
Figure 1 Sinter Cement Mixer – Dry Mixing
Figure 3 18-inch Balling Disc Figure 4 Granulation Drum Water Spray Bar
Figure 2 Sinter Granulation Drum

19
Figure 5 Sinter Granulation Drum Lifter Detail Figure 6 Balling Disc Lifter Detail
Figure 7 3” x 22” Cell Figure 8 3” x 8” and 6” x 16” Cells
20
Figure 9 Balling Disc with Load and Water Spray Addition

21
Figure 10 Wet Mix Bulk Density vs. Mix Moisture Content in 6” x 16” Cell
Figure 11 Wet Mix Bulk Density vs. Mix Moisture Content in 3” x 8” Cell
1.85
1.90
1.95
2.00
2.05
2.10
2.15
2.20
2.0 2.5 3.0 3.5 4.0 4.5 5.0 5.5 6.0 6.5 7.0 7.5 8.0 8.5
Wet M
ix Den
sity, gm/cm
3
Moisture, %wt.
Wet Mix Bulk Density vs Mix Moisture6 inch x 16 inch Cell ‐ Granulation Drum
Blend I ‐ Granulation Drum Blend II ‐ Granulation DrumPoly. (Blend I ‐ Granulation Drum) Poly. ( Blend II ‐ Granulation Drum)
1.85
1.90
1.95
2.00
2.05
2.10
2.15
2.20
2.25
2.0 2.5 3.0 3.5 4.0 4.5 5.0 5.5 6.0 6.5 7.0 7.5 8.0 8.5 9.0 9.5
Wet M
ix Den
sity, gm/cm
3
Moisture, %wt.
Wet Mix Bulk Density vs Mix Moisture3 inch x 8 inch Cell ‐ Balling Disc
Blend II ‐ 18‐inch Disc with 3/16" Lifters Blend II ‐ 18‐inch Disc with 1/2 Lifters
Poly. (Blend II ‐ 18‐inch Disc with 3/16" Lifters) Poly. (Blend II ‐ 18‐inch Disc with 1/2 Lifters)

22
Figure 12 Combined Cell Data for Wet Mix Bulk Density vs. Mix Moisture
1.85
1.90
1.95
2.00
2.05
2.10
2.15
2.20
2.25
2 3 4 5 6 7 8 9 10
Wet M
ix Den
sity, gm/cm
3
Moisture, %wt.
Wet Mix Bulk Density vs Mix MoistureCombined Data
Blend I ‐ Granulation Drum Blend II ‐ Granulation Drum
Blend II ‐ 18‐inch Disc with 3/16" Lifters Blend II ‐ 18‐inch Disc with 1/2 Lifters
all data points Poly. (Blend I ‐ Granulation Drum)
Poly. ( Blend II ‐ Granulation Drum) Poly. (Blend II ‐ 18‐inch Disc with 3/16" Lifters)
Poly. (Blend II ‐ 18‐inch Disc with 1/2 Lifters) Poly. (all data points)

23
0.30
0.32
0.34
0.36
0.38
0.40
0.42
0.44
0.46
0.48
0.50
0.52
2.0 2.5 3.0 3.5 4.0 4.5 5.0 5.5 6.0 6.5 7.0 7.5 8.0 8.5 9.0 9.5
Wet M
ix Void Fractio
n
Moisture, %wt.
Wet Mix Void Fraction vs Mix Moisture3 inch x 8 inch Cell ‐ Balling Disc
Blend II ‐ 18‐inch Disc with 3/16" Lifters Blend II ‐ 18‐inch Disc with 1/2 Lifters
Poly. (Blend II ‐ 18‐inch Disc with 3/16" Lifters) Poly. (Blend II ‐ 18‐inch Disc with 1/2 Lifters)
Figure 13 Mix Void Fraction vs. Mix Moisture in 6” x 16” Cell
Figure 14 Mix Void Fraction vs Mix Moisture in 3” x 8” Cell
0.30
0.32
0.34
0.36
0.38
0.40
0.42
0.44
0.46
0.48
2.0 2.5 3.0 3.5 4.0 4.5 5.0 5.5 6.0 6.5 7.0 7.5 8.0 8.5
Wet M
ix Void Fractio
n
Moisture, %wt.
Wet Mix Void Fraction vs Mix Moisture6 inch x 16 inch Cell ‐ Granulation Drum
Blend I ‐ Granulation Drum Blend II ‐ Granulation Drum
Poly. (Blend I ‐ Granulation Drum) Poly. ( Blend II ‐ Granulation Drum)
24
Figure 15 Combined Cell Data for Wet Mix Void Fraction vs. Mix Moisture
0.30
0.32
0.34
0.36
0.38
0.40
0.42
0.44
0.46
0.48
0.50
0.52
2 3 4 5 6 7 8 9 10
Wet M
ix Void Fractio
n
Moisture, %wt.
Wet Mix Void Fraction vs Mix MoistureCombined Data
Blend I ‐ Granulation Drum Blend II ‐ Granulation Drum
Blend II ‐ 18‐inch Disc with 3/16" Lifters Blend II ‐ 18‐inch Disc with 1/2 Lifters
all data points Poly. (Blend I ‐ Granulation Drum)
Poly. ( Blend II ‐ Granulation Drum) Poly. (Blend II ‐ 18‐inch Disc with 3/16" Lifters)
Poly. (Blend II ‐ 18‐inch Disc with 1/2 Lifters) Poly. (all data points)

25
Figure 16 Averaged JPU vs. Mix Moisture in 6” x16” Cell
Figure 17 Averaged JPU vs. Mix Moisture in 3” x 8” Cell
0.00
0.20
0.40
0.60
0.80
1.00
1.20
1.40
1.60
1.80
2.00
2.20
2.40
2.0 2.5 3.0 3.5 4.0 4.5 5.0 5.5 6.0 6.5 7.0 7.5 8.0 8.5
Average JPU
Moisture, %wt.
Averaged JPU vs Mix Moisture6 inch x 16 inch Cell ‐ Granulation Drum
Blend I ‐ Granulation Drum Blend II ‐ Granulation Drum
Poly. (Blend I ‐ Granulation Drum) Poly. ( Blend II ‐ Granulation Drum)
0.00
0.50
1.00
1.50
2.00
2.50
3.00
3.50
4.00
4.50
5.00
5.50
6.00
6.50
7.00
2.0 2.5 3.0 3.5 4.0 4.5 5.0 5.5 6.0 6.5 7.0 7.5 8.0 8.5 9.0 9.5
Average JPU
Moisture, %wt.
Averaged JPU vs Mix Moisture3 inch x 8 inch Cell ‐ Balling Disc
Blend II ‐ 18‐inch Disc with 3/16" Lifters Blend II ‐ 18‐inch Disc with 1/2 Lifters
Poly. (Blend II ‐ 18‐inch Disc with 3/16" Lifters) Poly. (Blend II ‐ 18‐inch Disc with 1/2 Lifters)

26
Figure 18 Combined Cell Data for Average JPU vs. Mix Moisture with Prior Sinter Pot Data
26
28
30
32
34
36
38
40
42
44
46
48
50
52
0.00
0.50
1.00
1.50
2.00
2.50
3.00
3.50
4.00
4.50
5.00
5.50
6.00
6.50
7.00
2 3 4 5 6 7 8 9 10
mt/m
2 ‐24hr
Aveerage JP
U
Moisture, %wt.
Average JPU vs Mix MoistureCombinedData
Blend I ‐ Granulation Drum Blend II ‐ Granulation Drum
Blend II ‐ 18‐inch Disc with 3/16" Lifters Blend II ‐ 18‐inch Disc with 1/2 Lifters
13 Inch Bed Sinter Pot Series 24 Inch Bed Sinter Pot Series
Poly. (Blend I ‐ Granulation Drum) Poly. ( Blend II ‐ Granulation Drum)
Poly. (Blend II ‐ 18‐inch Disc with 3/16" Lifters) Poly. (Blend II ‐ 18‐inch Disc with 1/2 Lifters)

27
Figure 19 Granulation Index vs. Mix Moisture in 6” x 16” Cell
Figure 20 Granulation Index vs. Mix Moisture in 3” x 8” Cell
0
10
20
30
40
50
60
70
80
90
2.0 2.5 3.0 3.5 4.0 4.5 5.0 5.5 6.0 6.5 7.0 7.5 8.0 8.5 9.0 9.5
Granu
latio
n Inde
x %
Moisture, %wt.
Granulation Index vs Mix Moisture3 inch x 8 inch Cell ‐ Balling Disc
Blend II ‐ 18‐inch Disc with 3/16" Lifters Blend II ‐ 18‐inch Disc with 1/2 Lifters
Poly. (Blend II ‐ 18‐inch Disc with 3/16" Lifters) Poly. (Blend II ‐ 18‐inch Disc with 1/2 Lifters)
0
10
20
30
40
50
60
70
80
90
2.0 2.5 3.0 3.5 4.0 4.5 5.0 5.5 6.0 6.5 7.0 7.5 8.0 8.5
Granu
latio
n Inde
x %
Moisture, %wt.
Granulation Index vs Mix Moisture6 inch x 16 inch Cell ‐ Granulation Drum
Blend I ‐ Granulation Drum Blend II ‐ Granulation Drum
Poly. (Blend I ‐ Granulation Drum) Poly. ( Blend II ‐ Granulation Drum)

28
Figure 21 Combined Cell Data for Granulation Index vs. Mix Moisture
0.00
10.00
20.00
30.00
40.00
50.00
60.00
70.00
80.00
90.00
2 3 4 5 6 7 8 9 10
Granu
latio
n Inde
x
Moisture, %wt.
Granulation Index vs Mix MoistureCombined Data
Blend I ‐ Granulation Drum Blend II ‐ Granulation Drum
Blend II ‐ 18‐inch Disc with 3/16" Lifters Blend II ‐ 18‐inch Disc with 1/2 Lifters
all data points Poly. (Blend I ‐ Granulation Drum)
Poly. ( Blend II ‐ Granulation Drum) Poly. (Blend II ‐ 18‐inch Disc with 3/16" Lifters)
Poly. (Blend II ‐ 18‐inch Disc with 1/2 Lifters) Poly. (all data points)

29
Figure 22 Mass Averaged Granule Diameter vs. Mix Moisture in 6” x 16” Cell
Figure 23 Mass Averaged Granule Diameter vs. Mix Moisture in 3” x 8” Cell
0
1
2
3
4
5
6
2.0 2.5 3.0 3.5 4.0 4.5 5.0 5.5 6.0 6.5 7.0 7.5 8.0 8.5
Diameter, m
m
Moisture, %wt.
Mass Ave. Mean Granule Diameter vs Mix Moisture6 inch x 16 inch Cell ‐ Granulation Drum
Blend I ‐ Granulation Drum Blend II ‐ Granulation Drum
Poly. (Blend I ‐ Granulation Drum) Poly. ( Blend II ‐ Granulation Drum)
0
1
2
3
4
5
6
7
2.0 2.5 3.0 3.5 4.0 4.5 5.0 5.5 6.0 6.5 7.0 7.5 8.0 8.5 9.0 9.5
Diameter, m
m
Moisture, %wt.
Mass Ave. Mean Granule Diameter vs Mix Moisture3 inch x 8 inch Cell ‐ Balling Disc
Blend II ‐ 18‐inch Disc with 3/16" Lifters Blend II ‐ 18‐inch Disc with 1/2 Lifters
Poly. (Blend II ‐ 18‐inch Disc with 3/16" Lifters) Poly. (Blend II ‐ 18‐inch Disc with 1/2 Lifters)

30
Figure 24 Combined Cell Data for Mean Granule Diameter vs. Mix Moisture
0
1
2
3
4
5
6
7
2 3 4 5 6 7 8 9 10
Diameter, m
m
Moisture, %wt.
Mass Ave. Mean Granule Diameter vs Mix Moisture Combined Data
Blend I ‐ Granulation Drum Blend II ‐ Granulation Drum
Blend II ‐ 18‐inch Disc with 3/16" Lifters Blend II ‐ 18‐inch Disc with 1/2 Lifters
all data points Poly. (Blend I ‐ Granulation Drum)
Poly. ( Blend II ‐ Granulation Drum) Poly. (Blend II ‐ 18‐inch Disc with 3/16" Lifters)
Poly. (Blend II ‐ 18‐inch Disc with 1/2 Lifters) Poly. (all data points)

31
Figure 25 Percent Compaction in Bed vs. Mix Moisture in 6” x16” Cell
` Figure 26 Percent Compaction in Bed vs. Mix Moisture in 3” x 8” Cell
with Prior Sinter Pot Data
0
1
2
3
4
5
6
7
8
2.0 2.5 3.0 3.5 4.0 4.5 5.0 5.5 6.0 6.5 7.0 7.5 8.0 8.5
Compa
ction, %
Moisture, %wt.
% Compaction in Bed vs Mix Moisture6 inch x 16 inch Cell ‐ Granulation Drum
Blend I ‐ Granulation Drum Blend II ‐ Granulation Drum
Poly. (Blend I ‐ Granulation Drum) Poly. ( Blend II ‐ Granulation Drum)
0
1
2
3
4
5
6
2.0 2.5 3.0 3.5 4.0 4.5 5.0 5.5 6.0 6.5 7.0 7.5 8.0 8.5 9.0 9.5
Compa
ction, %
Moisture, %wt.
% Compaction, vs Mix Moisture3 inch x 8 inch Cell ‐ Balling Disc
Blend II ‐ 18‐inch Disc with 3/16" Lifters Blend II ‐ 18‐inch Disc with 1/2 Lifters
13 Inch Sinter Bed Tests 24 Inch Bed Sinter Tests
Poly. (Blend II ‐ 18‐inch Disc with 3/16" Lifters) Poly. (Blend II ‐ 18‐inch Disc with 1/2 Lifters)

32
Figure 27 Average JPU vs. Granulation Index for Combined Data Points
0.00
1.00
2.00
3.00
4.00
5.00
6.00
7.00
0 20 40 60 80 100
Average JPU
Granulation Index
JPU vs Granulation IndexCombined Data
Blend I ‐ Granulation Drum Blend II ‐ Granulation Drum
Blend II ‐ 18‐inch Disc with 3/16" Lifters Blend II ‐ 18‐inch Disc with 1/2 Lifters
Poly. (Blend I ‐ Granulation Drum) Poly. ( Blend II ‐ Granulation Drum)
Poly. (Blend II ‐ 18‐inch Disc with 3/16" Lifters) Poly. (Blend II ‐ 18‐inch Disc with 1/2 Lifters)

33
Appendix

34
Sinter Permeability Test Procedure General Guidelines
1. Dry mix sinter components in sinter cement mixer for 6 minutes:
a) A bulk sample sufficient to split into individual test charges can be mixed as one sample.
i) 6” x 16” cell requires a 33 lb charge (dry basis) per test. ii) 3” x 8” cell requires a 2300 gm charge (dry basis) per test.
b) If burned lime is used in the mix, it cannot be dry-mixed with the bulk mix; it must be added to the charge at time of granulation. Riffle mixing was used in these tests.
i) Alternatively, a single 33-lb mix can be charged to cement mixer containing lime. (Granulation must begin immediately following lime addition)
2. Granulation is accomplished using the sinter granulation drum (charge >25 lbs) or the 18-inch balling disc (charges up to 5500 gm).
a) Water addition is accomplished in the granulation drum with the pressurized spray system. Recommended granulation time is 5 minutes (total time including water addition). b) Water addition in balling disc is accomplished with hand held pressurized paint sprayer.
3. Moisture sample is taken from granulated mix after granulation, and remaining mix is weighed. 4. Load permeability pot, first with hearth layer (pre-weighed to yield 2” depth or desired depth). Then wet mix is carefully loaded into the pot, using appropriate funnels. Remaining mix is weighed, and weight of mix in pot is determined by difference. Note: In some programs it is desirable to run the permeability test in conjunction with the pot firing test. In this situation, a portion of the granulated mix is split out, weighed, and the pot loaded. Again, weight in pot is determined by difference. A permeability test is run after firing the pot; the wet mix is stored in a sealed container to prevent evaporation during firing. This procedure requires assembly and disassembly of the permeability cell mount on the sinter exhaust system. 5. Set the PLC to permeability mode and run the test. It is recommended to use the standard settings for pressure and times; however, pressures can be changed if desired. This test will cycle

35
a total of four times. It is necessary to manually write down flow at each pressure setting, (they are not stored), before beginning the next cycle. After each cycle, note and record shrinkage in the bed occurring under the pressure loads. This test is repeated as many times as desired to fully evaluate moisture addition, binders, etc. 6. Moisture determination is made for each test. Once moisture determination is done, gently riffle split (once) and screen one of the half splits: (Mesh 3, 4, 6, 8, 10, 20,-20). This is the granulated mix structure. From granulated mix structure, prepare a 175 gm sample from representative fractions. This sample is for density determination using air pycnometer “As Is Density.” Crush the second half split to -100 mesh and determine density with air pycnometer “100 Mesh Density.”