Embed Size (px)
Citation preview

Ekonomia versus środowisko– konkurencyjność
czy komplementarność
Economy versus the environment
– competitiveness
or complementarity
INSTYTUT EKONOMIKI ROLNICTWAI GOSPODARKI ŻYWNOŚCIOWEJPAŃSTWOWY INSTYTUT BADAWCZY
Pantone 348C;
Pantone 382C;
Pantone 108 C.
MONOGRAFIE PROGRAMU
WIELOLETNIEGO23ISBN 978-83-7658-605-2
WARSZAWA 2016
MO
NO
GR
AFI
E PR
OG
RA
MU
WIE
LOLE
TNIE
GO
N
R 2
3

Ekonomia versus środowisko− konkurencyjność
czy komplementarność
Economy versus the environment− competitiveness
or complementarity


Ekonomia versus środowisko– konkurencyjność
czy komplementarność
Economy versus the environment
– competitiveness
or complementarity
Warszawa 2016
Redakcja:
prof. dr hab. Andrzej Kowalski
dr Marek Wigier
dr Barbara Wieliczko
ROLNICTWO POLSKIE I UE 2020+WYZWANIA, SZANSE, ZAGROŻENIA, PROPOZYCJE

Publikacj� zrealizowano w ramach Programu Wieloletniego 2015-2019 „Rolnictwo polskie i UE 2020+. Wyzwania, szanse, zagro�enia, propozycje”. Celem opracowania jest prezentacja i analiza relacji mi�dzy celami �rodowiskowymi a ekonomicznymi w rolnictwie, gospodarce �ywno�ciowej i w rozwoju obszarów wiejskich. Autorzy poszczególnych rozdzia�ów próbuj� odpowiedzie� na pytanie, na ile cele �rodowiskowe i ekonomiczne s� wobec siebie konkurencyjne, a na ile komplementarne, oraz wskazuj� po��dany kierunek kszta�towania relacji mi�dzy �rodowiskiem a gospodark�. Recenzenci: doc dr Plamena Yovchevska, Instytut Ekonomiki Rolnictwa, Sofia dr hab. Agnieszka Wrzochalska, prof. Instytutu Ekonomiki Rolnictwa i Gospodarki �ywno�ciowej – Pa�stwowego Instytutu Badawczego Korekta: Joanna Gozdera Katarzyna Mikulska Barbara Paw�owska Redakcja techniczna Leszek �lipski Projekt ok�adki IERiG�-PIB ISBN 978-83-7658-605-2 Instytut Ekonomiki Rolnictwa i Gospodarki �ywno�ciowej – Pa�stwowy Instytut Badawczy ul. �wi�tokrzyska 20, 00-002 Warszawa tel.: (22) 50 54 444 faks: (22) 50 54 757 e-mail: [email protected] http://www.ierigz.waw.pl

Spis tre�ci
1 Wprowadzenie ................................................................................................................... 11 Prof. dr hab Andrzej Kowalski, dr Marek Wigier, dr Barbara Wieliczko
2 Sovereignty, Food Security and Sustainable Development: Environmental and Economic Challenges ................................................................................................. 18
Bernardo Reynolds Pacheco de Carvalho
Introduction ............................................................................................................... 18 2.1
Analytic structure and methodology .......................................................................... 20 2.2
Models discussion and revision of key concepts ....................................................... 21 2.3
Alternatives for intervention based on the models presented: concepts 2.4 and hypothesis to be explored ................................................................................... 26
Cases studies for food policy: sovereignty, food security and sustainable 2.5 development ............................................................................................................... 29
Conclusions ............................................................................................................... 33 2.6
References ............................................................................................................................ 34
3 Internalizacja efektów zewn�trznych w rolnictwie ........................................................... 37 Dr Barbara Wieliczko
Wst�p ......................................................................................................................... 37 3.1
Efekty zewn�trzne ..................................................................................................... 38 3.2
Efekty zewn�trzne a rolnictwo .................................................................................. 39 3.3
Podsumowanie i wnioski ........................................................................................... 43 3.4
Bibliografia ........................................................................................................................... 44
4 Environmental consulting as a factor of agricultural development in Serbia .................. 46 Ph.D. Branko Mihailovi�, Prof. Drago Cvijanovi�, prof. Ana Langovi�-Mili�evi�
Introduction ............................................................................................................... 46 4.1
Ecological consulting and modern agriculture .......................................................... 47 4.2
Consultants for a quality management system .......................................................... 48 4.3
Organic production and rural development ............................................................... 52 4.4
Conclusion ................................................................................................................. 54 4.5
References ............................................................................................................................ 55
5 Ekonomika gospodarstwa rolnego a �rodowisko przyrodnicze ........................................ 56 Dr Wioletta Wrzaszcz
Wprowadzenie ........................................................................................................... 56 5.1
Funkcje rolnictwa a cele gospodarstwa rolnego ........................................................ 57 5.2
Mechanizm rynku a model gospodarstwa rolnego .................................................... 60 5.3
Relacje mi�dzy celami gospodarstwa rolnego ........................................................... 63 5.4

Wnioski ...................................................................................................................... 69 5.5
Bibliografia ........................................................................................................................... 69
6 The CAP 2004-2013 direct payment scheme’s impact on sustainability of agriculture in Lithuania ....................................................................................................................... 74
Dr Artiom Volkov, dr Jolanta Droždz
CAP direct payment scheme: 2003 reform towards sustainability ............................ 74 6.1
Methodology .............................................................................................................. 75 6.2
Outcomes ................................................................................................................... 80 6.3
Conclusions ............................................................................................................... 83 6.4
References ............................................................................................................................ 83
7 Economic and social preconditions of development in the Czech rural areas: acceleration of global influence and local changes .......................................................... 87
Prof. PhDr. ing. Vra Majerová, CSc., ing. Jií Sálus, dr Teodora Stoeva, dr Ekaterina Valcheva
Introduction ............................................................................................................... 87 7.1
Shaping relation to the environment in historical context ......................................... 87 7.2
Large-scale socialist agriculture and its environmental consequences ..................... 88 7.3
Environment as a prerequisite for rural development ............................................... 89 7.4
Compared with conventional and organic farming from an economic 7.5 and environmental point of view ............................................................................... 91
The influence of social factors on soil quality in the Czech Republic ...................... 92 7.6
The influence of social factors on the business of farming 7.7 in the Czech Republic ................................................................................................ 94
Opinions and attitudes of the population concerning the environment ..................... 94 7.8
Conclusion ................................................................................................................. 96 7.9
References ............................................................................................................................ 98
8 Impact of economics and agriculture over the environmental protection in Bulgaria ... 101 Dr Teodora Stoeva, dr Ekaterina Valcheva
Introduction ............................................................................................................. 101 8.1
Material and methods .............................................................................................. 101 8.2
Results and discussions ........................................................................................... 101 8.3
Conclusion ............................................................................................................... 105 8.4
References .......................................................................................................................... 105
9 Wp�yw programów rolno�rodowiskowych jako instrumentów polityki na warto�� dodan� w polskich gospodarstwach rolnych ..................................................................... 106
Dr Agata Sielska, mgr Aleksandra Paw�owska Wst�p ....................................................................................................................... 106 9.1

�ród�a danych i metodologia ................................................................................... 107 9.2
Wyniki bada ........................................................................................................... 111 9.3
Podsumowanie i wnioski ......................................................................................... 115 9.4
Bibiografia .......................................................................................................................... 116
10 An assessment of the impacts of reducing ammonia emissions from livestock farming by covering existing manure storage facilities in Hungary .............................. 118
Dr Norbert Potori, dr Róbert Garay, dr János Sávoly, dr József Fogarasi
Introduction ............................................................................................................. 118 10.1
Legislative background and literature review ......................................................... 118 10.2
Methodology and Data ............................................................................................ 121 10.3
Results ..................................................................................................................... 123 10.4
Conclusions ............................................................................................................. 125 10.5
References .......................................................................................................................... 126
11 Animal and vegetable waste development in agriculture, food processing and households of the European Union ........................................................................... 129
Dr in�. Ivan Masár
Introduction ............................................................................................................. 129 11.1
Methodology ............................................................................................................ 130 11.2
Results ..................................................................................................................... 131 11.3
Reasons of food waste occurrence ........................................................................... 137 11.4
Possible solutions to food waste reduction .............................................................. 138 11.5
Conclusions ............................................................................................................. 138 11.6
References .......................................................................................................................... 139
12 Susze w Polsce a sytuacja gospodarstw rolnych na glebach o jako�ci poni�ej �redniej 140 Prof. dr hab. Wojciech Józwiak, dr Marek Zieli�ski, prof. dr hab. Wojciech Zi�tara
Wst�p ....................................................................................................................... 140 12.1
Sytuacja gospodarstw rolnych osób fizycznych funkcjonuj�cych w gminach 12.2szczególnie dotkni�tych suszami ........................................................................................ 141
Podsumowanie i wnioski ......................................................................................... 147 12.3
Bibiografia .......................................................................................................................... 149
13 Resilience of Romanian agriculture – an overview ........................................................ 150 Dr Monica Mihaela Tudor
Introduction ............................................................................................................. 150 13.1
Methodological approach ........................................................................................ 150 13.2
Last financial crisis in Romania – an overview ....................................................... 151 13.3
Romanian agriculture at a glance ............................................................................ 153 13.4

Romanian agriculture as a resilience factor ............................................................. 155 13.5
Final remarks ........................................................................................................... 158 13.6
References .......................................................................................................................... 158
14 Ocena mo�liwo�ci substytucji �ruty sojowej GM krajowymi ro�linami bia�kowymi w aspekcie bilansu paszowego ........................................................................................ 160
Dr Piotr Szajner, mgr Wies�aw Dzwonkowski
Wst�p ....................................................................................................................... 160 14.1
Prawne aspekty GMO na �wiecie i w Polsce .......................................................... 161 14.2
Rozwój �wiatowej produkcji ro�lin GMO i ich znaczenie w bilansie bia�kowym . 163 14.3
Krajowy rynek pasz wysokobia�kowych ................................................................. 166 14.4
Bibliografia ......................................................................................................................... 172
15 Priorities of sustainable development of agriculture and rural areas within the region of eastern Serbia .............................................................................................................. 173
Prof. Jonel Subi�, dr Vesna Popovi�, mgr Marko Jelo�nik
Introduction ............................................................................................................. 173 15.1
Data sources and methodology ................................................................................ 175 15.2
Challenges and opportunities for regional agriculture and rural development ...... 176 15.3
Recommendations for priority measures to support agriculture and rural 15.4development ........................................................................................................................ 183
Conclusions ............................................................................................................. 188 15.5
References .......................................................................................................................... 188
16 Expected changes of farmers innovation activity in 2014-2020 ..................................... 192 Prof. dr Dimitre Nikolov, assoc. prof. dr M. Anastasova-Chopeva
Introduction ............................................................................................................. 192 16.1
Theoretical problems of the research ....................................................................... 192 16.2
Data and methodology ............................................................................................. 194 16.3
Results ..................................................................................................................... 196 16.4
Conclusions ............................................................................................................. 202 16.5
References .......................................................................................................................... 203
17 Investment attractiveness of bioeconomy: case of Ukraine ............................................ 205 Prof. Mykola Talavyria, dr Viktoriia Baidala, dr Vira Butenko
Introduction ............................................................................................................. 205 17.1
Data and methodology ............................................................................................. 206 17.2
Main results ............................................................................................................. 208 17.3
Conclusion ............................................................................................................... 213 17.4
References .......................................................................................................................... 213

18 Competitiveness and comparative advantages of Ukraine’s agriculture sector in trade with the European Union ................................................................................... 215
Dr Yuriy Trokoz
Introduction ............................................................................................................. 215 18.1
Analysis of recent researches and methodology ...................................................... 216 18.2
General overview of Ukraine’s trade with the EU-28 ............................................. 222 18.3
Conclusions and recommendations for further research ......................................... 229 18.4
Reference ............................................................................................................................ 229
19 Ukrainian agricultural products competitiveness on European market in time of financial challenges ..................................................................................................... 231 Sergey Grygorev
Introduction ............................................................................................................. 231 19.1
Trade development between Ukraine and the EU ................................................... 231 19.2
Poultry trade between Ukraine and the EU ............................................................. 235 19.3
Poultry production cost comparison in different countries ..................................... 239 19.4
Time of financial challenges in Ukraine and Ukrainian poultry competitiveness 19.5 on the European market ........................................................................................... 241
Summary .................................................................................................................. 243 19.6
References .......................................................................................................................... 245
20 �� ������� ��������� � ���������� � ������ �� ����������� ������� ��������� ����!���� "��������� #��� ��� ................................................................ 246 Prof. ������� ��������, dr �������� ���������
$��%���� ................................................................................................................. 246 20.1
&����'���� � ������� ���(��! �� ����� .......................................................... 247 20.2
)� ���*���� ������� ........................................................................................... 248 20.3
)�������� ��%�*��� �� �� ���(������� ��������� ..................................... 250 20.4
/��%��;�� � ������� �� ������, ��<�� � ����%� ......................................... 254 20.5
=��� ��� � ......................................................................................................................... 256
21 Podsumowanie ................................................................................................................ 257


11
Prof. dr hab Andrzej Kowalski, dr Marek Wigier, dr Barbara Wieliczko Instytut Ekonomiki Rolnictwa i Gospodarki �ywno�ciowej – PIB, Warszawa
1 Wprowadzenie
Wa�n� cz��ci� wspó�cze�nie prowadzonych bada naukowych oraz for-mu�owanych na ich podstawie prognoz jest ocena �wiatowych mo�liwo�ci pro-dukcji �ywno�ci i jej wp�ywu na �rodowisko naturalne. Racjonalne gospodaro-wanie zasobami przyrodniczymi w produkcji rolniczej jest jednak praktyk�, któ-ra nie narodzi�a si� wspó�cze�nie. Nauka rolnicza zawsze wskazywa�a na ko-nieczno�� zachowania zasobów gleby i otoczenia rolnictwa dla przysz�ych po-kole. Globalny problem ochrony �rodowiska, z jakim mamy do czynienia, ma lokalne uwarunkowania w ka�dym regionie i w ka�dym kraju. Dlatego poza ce-lami ekonomicznymi produkcji �ywno�ci warto definiowa� inne kryteria – eko-logiczne, spo�eczne, kulturowe, waloryzuj�ce koszty produkcji, przetwórstwa i handlu. Mo�e to by� podstaw� do rozwi�zania wielu obecnych problemów rol-nictwa i obszarów wiejskich. Powinno si� do tego przyczyni� rozszerzanie ryn-ków zbytu na produkty rolno-spo�ywcze, rozwój logistyki, informacji, handlu zagranicznego, przetwarzania i konserwacji �ywno�ci oraz uwzgl�dnienie w strategii producentów innych kryteriów poza warto�ciami handlowymi i od-�ywczymi towarów. Nale�y podkre�li�, �e nie istniej� globalne rozwi�zania problemów �ywno�ciowych bez tworzenia lokalnych warunków rozwoju. Go-dzenie lokalnych interesów z pozytywnymi (dzi�ki post�powi naukowo-technicznemu) skutkami wprowadzania nowych metod produkcji w rolnictwie, przetwórstwie i dystrybucji �ywno�ci prowadzi do optymalizacji powi�za w �acuchu rolno-�ywno�ciowym.
Niniejsza monografia kontynuuje zapocz�tkowany pod koniec XX wieku trend bada interdyscyplinarnych, rozszerzaj�cych „sektorowe” podej�cie do problemów ekonomiczno-spo�eczno-�rodowiskowych, na rzecz ich wspólnej i kompleksowej analizy. Charakterystyczna dla publikacji wielow�tkowo�� uka-zywania problemów polityki ekonomicznej i ekologicznej w poszczególnych krajach ukazuje je w �cis�ym zwi�zku z dzia�aniami Wspólnej Polityki Rolnej UE oraz kontekstem globalnym. Prezentowany materia� mo�e s�u�y� nie tylko dyskusji naukowej, ale mo�e by� tak�e pomocny przy podejmowaniu przysz�ych rozstrzygni�� politycznych. Przydatne w tym mo�e okaza� si� porównanie do-�wiadcze ró�nych krajów i ocena wprowadzanych rozwi�za. Wszystkie kraje maj� podobne problemy: jak chroni� naturalne �rodowisko cz�owieka, jak za-

12
pewni� najbardziej efektywne wykorzystanie gleby, jak chroni� klimat, ale ró�-nie staraj� si� je rozwi�zywa�.
Autorzy poszczególnych rozdzia�ów monografii staraj� si� odpowiedzie� na wiele pyta, m.in. o to, czy intensyfikacja produkcji rolnej i produkcji �yw-no�ci (jako odpowied@ na wzrastaj�ce potrzeby �wiata) nie stoi w sprzeczno�ci z konieczno�ci� ochrony przestrzeni na której dzia�a rolnictwo? czy s� to cele konkurencyjne czy komplementarne? jaki jest rzeczywisty udzia� produkcji rol-niczej w degradacji naturalnego �rodowiska? czy wprowadzanie nowych metod produkcji, jej mechanizacja, chemizacja, wykorzystywanie osi�gni�� biotechno-logii, nie zak�óca równowagi ekologicznej? czy „zdrowa �ywno��” jest napraw-d� zdrowa i jakim kosztem mo�e by� wytwarzana? oraz co zrobi�, aby polityka �ywno�ciowa pastw i ugrupowa takich jak UE mog�a sprosta� nie tylko wspó�czesnym, ale tak�e i przysz�ym potrzebom? Prezentowana monografia stanowi dorobek naukowy mi�dzynarodowej konferencji naukowej pt. „Ekono-mia versus �rodowisko – konkurencyjno�� czy komplementarno��” zorganizo-wanej przez Instytut Ekonomiki Rolnictwa i Gospodarki Qywno�ciowej – Pa-stwowy Instytut Badawczy w dniach 23-25 listopada 2015 r. w Jachrance ko�o Warszawy w ramach upowszechniania wyników bada Programu Wieloletniego 2015-2019 IERiGQ-PIB „Rolnictwo polskie i UE 2020+. Wyzwania, szanse, zagro�enia, propozycje”.
G�ównym w�tkiem przedstawionych na konferencji oraz w niniejszej pu-blikacji prac naukowców s� relacje mi�dzy �rodowiskiem a rozwojem gospodar-czym, pomi�dzy wydatkami na ochron� �rodowiska a ich wp�ywem na gospodar-k�. Zdaniem prof. Bernardo Reynoldsa Pacheco de Carvalho z Uniwersytetu w Lizbonie rozwój gospodarki �ywno�ciowej jest silnie uzale�niony od poziomu wymiany handlowej z zagranic�, co w konsekwencji przenosi si� na poziom kon-sumpcji i mo�liwo�ci zrównowa�onego rozwoju (rozdzia� 2). Z�o�ono�� i ró�no-rodno�� efektów zewn�trznych, w tym cz�ste opó@nienie w czasie i nieliniowo�� wyst�pienia efektów zewn�trznych w rolnictwie s� powa�nymi ograniczeniami przy ich szacowaniu. Prof. Carvalho, prognozuj�c rozwój europejskiej gospodarki �ywno�ciowej w perspektywie do 2050 roku, dowodzi, �e przysz�a strategia musi poszukiwa� nowej równowagi w zmieniaj�cych si� okoliczno�ciach politycznych, demograficznych i �rodowiskowych. Wy��cznie biznesowe podej�cie do produk-cji �ywno�ci ma swoje strukturalne ograniczenia, nie rozwi�zuje fundamental-nych problemów rozwoju i tworzenia optymalnych relacji mi�dzy rolnictwem, �rodowiskiem a innymi sektorami gospodarki. Dlatego warto definiowa� cele po-lityczne uwzgl�dniaj�ce inne ni� dotychczas kryteria.
Dr Barbara Wieliczko w artykule pt. „Internalizacja efektów zewn�trznych w rolnictwie” (rozdzia� 3) wskazuje na przyczyny ich wyst�powania. Jej zdaniem

13
s� to przede wszystkim nierozerwalne wspó�zale�no�ci mi�dzy podmiotami go-spodarczymi oraz brak lub s�abe prawa w�asno�ci. Dzia�alno�� jednej strony wp�ywa na funkcje u�yteczno�ci drugiej, przy czym rynek nie wycenia tego od-dzia�ywania. Inn� przyczyn� s� tak�e wysokie koszty transakcyjne stworzenia modelu kompensacji efektów zewn�trznych. W ramach instrumentarium WPR dostrzega si� problem generowania przez rolnictwo pozytywnych i negatywnych efektów zewn�trznych. Wydaje si� jednak, �e w nieco wi�kszym stopniu promuje si� zwi�kszanie skali produkowanych pozytywnych efektów zewn�trznych uto�-samianych z dobrami publicznymi. Cel ten próbuje si� osi�gn�� poprzez wsparcie w formie p�atno�ci rolno-�rodowiskowych za realizacj� dzia�a uznawanych za sprzyjaj�ce bioró�norodno�ci i kondycji �rodowiska naturalnego.
Zdaniem dr. Branka Mihailovicia i prof. Drago Cvijanovicia (rozdzia� 4) z Instytutu Ekonomiki Rolnictwa w Serbii liberalizacja gospodarki wymusza nie tylko otwarcie na mi�dzynarodow� konkurencj�, lecz tak�e bardziej rygory-styczne warunki dla biznesu, a to z kolei wymusza lepsze zrozumienie i wdro-�enie przepisów w dziedzinie ochrony �rodowiska, ochrony zdrowia i bezpie-czestwa produktów. Równie� prof. Jonel Subi�, dr Vesna Popovi�, mgr Marko Jelo[nik z tego� Instytutu w artykule pt. „Priorytety zrównowa�onego rozwoju rolnictwa i obszarów wiejskich w regionie wschodniej Serbii” (rozdzia� 15) do-wodz�, �e stymulatorami procesu zrównowa�onego rozwoju s�: podzia� na stre-fy produkcji rolnej, pog��bianie rozwoju us�ugi dla rolnictwa wspieraj�cych dzia�ania z zakresu ochrony ro�lin, wdra�anie systemu monitoringu i doradztwa technicznego dla rolników, zdefiniowanie ram prawnych dla wdra�ania produk-cji zintegrowanej, wdro�enie systemu irygacji, wzmocnienie systemu tworzenia stowarzysze i grup producentów, lepsza ochrona pochodzenia geograficznego lokalnych produktów rolnych, oraz ustanowienie i wdra�anie lokalnych strategii zrównowa�onego rozwoju rolno-kulturowego i wiejskiego.
Na koncepcj� wielofunkcyjno�ci rolnictwa zwraca uwag� tak�e dr Wiolet-ta Wrzaszcz z IERiGQ-PIB w artykule pt. „Ekonomika gospodarstwa rolnego a �rodowisko przyrodnicze” (rozdzia� 5). Wykazuje przy tym, �e w koncepcji tej coraz wi�ksz� uwag� koncentruje si� nie tyle na celach ekonomiczno- -produkcyjnych, co na ochronie i potrzebach �rodowiska oraz spo�ecznych us�u-gach �wiadczonych przez rolnictwo. Aby zrealizowa� cele rolnictwa zrównowa-�onego, niezb�dna jest akceptacja spo�eczna, która wymaga zmiany sposobu my-�lenia oraz szerszego spojrzenia na dzia�alno�� rolnicz� oraz na jego otoczenie ekonomiczne i instytucjonalne. W podobnym duchu wypowiada si� tak�e prof. V\ra Majerová z Uniwersytetu w Pradze w artykule pt. „Uwarunkowania ekonomiczne i spo�eczne rozwoju w czeskiej wsi: przyspieszenie globalnego wp�ywu i lokalnych zmian” (rozdzia� 7), która dowodzi, �e w Czechach ro�nie

14
liczba gospodarstw domowych zainteresowanych zakupem �ywno�ci ekologicz-nej, mimo �e jest ona dro�sza od produktów standardowych. Jednym z motywów zmieniaj�cych si� preferencji klientów jest prze�wiadczenie, �e przyczynia si� to do dba�o�ci o �rodowisko, czyst� wod� i zmniejszenie jej zanieczyszczenia. lo-kalne wytwarzanie okre�lonych artyku�ów rolno-�ywno�ciowych mo�e przynie�� pozytywne efekty dla spo�eczno�ci wiejskiej i poprawi� stan �rodowiska natural-nego na wsi.
Efekty WPR w zakresie ochrony �rodowiska w wielu krajach europej-skich s� jednak odmienne i cz�sto dalekie od zak�adanych celów. Dr Artiom Volkov i dr Jolanta Droždz z Litewskiego Instytutu Ekonomiki Rolnictwa w ar-tykule pt. „Wp�yw p�atno�ci bezpo�rednich WPR 2004-2013 na system zrów-nowa�onego rolnictwa na Litwie” (rozdzia� 6) wykazuj�, �e ukierunkowanie �rodków WPR na dzia�ania z zakresu zrównowa�enia by�o bardzo atrakcyjne przede wszystkim dla rolników, którzy liczyli g�ównie na finansowe wsparcie zewn�trzne i nie zamierzali inwestowa� w zmian� struktury swojej produkcji. Polityka publiczna w tym zakresie spowodowa�a intensywny rozwój upraw mo-nokulturowych, przyczyni�a si� do degradacji gleb, wi�kszego zu�ycia nawozów mineralnych oraz doprowadzi�a do spadku produkcji zwierz�cej.
Dr Teodora Stoeva i dr Ekaterina Valcheva z Akademii Rolniczej w P�owdiw przedstawiaj� jak znacz�ce, cz�sto negatywne oddzia�ywanie na �rodowisko naturalne ma gospodarka rolna (rozdzia� 8). Wp�ywa na to m.in. nieumiej�tne, nadmierne stosowanie nawozów mineralnych, niew�a�ciwa agro-technika, co w rezultacie pogarsza jako�� zasobów wodnych i gleby. W Bu�garii na jako�� �rodowiska oddzia�uje równie� du�e zu�ycie energii przez przemys� i miasta (jeden z najwy�szych w UE wska@nik energoch�onno�ci gospodarki), co po�rednio równie� pogarsza stan �rodowiska na obszarach wiejskich. Du�ym problemem jest równie� utylizacja �mieci.
Dr Agata Sielska i mgr Aleksandra Paw�owska z IERiGQ-PIB dowodz�, �e wyst�puje statystycznie istotny wp�yw programów rolno-�rodowiskowych na zró�nicowanie warto�ci dodanej w polskich gospodarstwach rolnych (rozdzia� 9). Stwierdzaj� istnienie zale�no�ci warto�ci dodanej od typu rolniczego i klasy wielko�ci ekonomicznej. Wy�sza �rednia warto�� dodana wyst�puje w gospo-darstwach, które specjalizuj� si� w uprawach trwa�ych i nie otrzymuj� dop�at rolno-�rodowiskowych. Wy�sz� �redni� warto�� dodan� uzyskuj� równie� go-spodarstwa specjalizuj�ce si� w uprawach ogrodniczych, chowie krów mlecz-nych i mieszane, które nie otrzymuj� dop�at do obszarów o niekorzystnych wa-runkach gospodarowania.
Ocen� skutków strukturalnych ogranicze zanieczyszcze powietrza, spowodowanych chowem zwierz�t gospodarskich na W�grzech przedstawili

15
(rozdzia� 10) dr Norbert Potori, dr Róbert Garay, dr János Sávoly, dr József Fo-garasi z W�gierskiego Instytutu Ekonomiki Rolnictwa. Ich zdaniem nowe zo-bowi�zania na�o�one na kraje unijne b�d� mia�y wp�yw na konkurencyjno�� produkcji zwierz�cej. Generalnie mo�e nast�pi� spadek pog�owia zwierz�t, przede wszystkim byd�a. W konsekwencji mog� wyst�pi� zaburzenia na unij-nym rynku produktów pochodzenia zwierz�cego. Podobn� problematyk� po-dejmuje tak�e dr Ivan Masár z Narodowego Instytutu Ekonomiki Rolnictwa i Gospodarki Qywno�ciowej w Bratys�awie. W artykule pt. „Odpady w produk-cji zwierz�cej, ro�linnej, przemy�le spo�ywczym i gospodarstwach domowych w krajach UE” rozwa�a (rozdzia� 11), jak wzrost produkcji rolniczej i �ywno-�ciowej szkodzi �rodowisku oraz dlaczego marnujemy �ywno��. Jego zdaniem istnieje wobec tego podstawowy dylemat: czy zwi�ksza� produkcj� przez jej intensyfikacj�, czy zmniejsza� marnotrawstwo �ywno�ci, a mo�e trzeba robi� i jedno, i drugie.
Prof. Wojciech Józwiak, dr Marek Zieliski i prof. Wojciech Zi�tara z IERiGQ-PIB w rozdziale pt. „Susze w Polsce, a sytuacja gospodarstw rolnych na glebach o jako�ci poni�ej �redniej” (rozdzia� 12), podkre�laj�, �e ekstremalne zjawiska klimatyczne, jak powodzie, huragany i susze na du�ych obszarach mo-g� by� zarówno pocz�tkiem nowej trwa�ej tendencji, jak równie� okresowych anomalii pogodowych, wyst�puj�cych zawsze na wielu kontynentach. Niezale�-nie od konkluzji nie mo�na jednak pomin�� faktów, �e w Polsce w ubieg�ym wieku �rednia temperatura wzros�a o ok. 1°C, i cho� nie stwierdzono wielolet-nich zmian sumy opadów atmosferycznych, to bilans wodny w glebach charak-teryzuje ujemna tendencja z powodu wzrostu temperatur i oddzia�ywania pro-mieniowania s�onecznego.
Dr Monica Tudor z Rumuskiej Akademii Nauk w artykule po�wi�conym �ywotno�ci rumuskiego rolnictwa (rozdzia� 13) zauwa�a, �e mo�liwo�ci zrów-nowa�anego jego rozwoju i rozwoju obszarów wiejskich zale�� od tempa prze-mian w�asno�ciowych, restrukturyzacji i modernizacji gospodarstw, a tak�e ich umiej�tno�ci adaptacji do zmieniaj�cego si� otoczenia. Rumunia, po obaleniu dawnego systemu spo�eczno-gospodarczego, musia�a w istocie odradza� pry-watne rolnictwo, które w w porównaniu z innymi ga��ziami gospodarki stosun-kowo najlepiej poradzi�o sobie z kryzysem w wi�kszo�ci regionów i dzi�ki temu korzystnie oddzia�ywa�o na ogóln� sytuacj� gospodarcz� kraju.
Dr Piotr Szajner i mgr Wies�aw Dzwonkowski z IERiGQ-PIB, oceniaj�c mo�liwo�ci substytucji �ruty sojowej GMO krajowymi ro�linami bia�kowymi w aspekcie bilansu paszowego (rozdzia� 14), twierdz�, �e uprawa ro�lin zmody-fikowanych genetycznie jest bardziej op�acalna ni� odmian tradycyjnych. S� one odporne na herbicydy i szkodniki oraz infekcje wirusowe, bakteryjne i grzybo-

16
we. Mniej szkodz� im zmiany klimatyczne. Modyfikacja genetyczna poprawia sk�ad zawartych w nich kwasów t�uszczowych oraz aminokwasów, zmienia zawarto�� w�glowodanów i witamin oraz zwi�ksza ilo�� suchej masy. Wyko-rzystanie pasz wysokobia�kowych (w tym importowanej �ruty sojowej GMO) zwi�zane jest �ci�le z tendencjami w produkcji zwierz�cej. Odwrót od GMO wydaje si� wi�c niemo�liwy, a skutki zakazu stosowania tego rodzaju ro�lin w paszach by�yby niekorzystne dla rolnictwa, przemys�u spo�ywczego i dla konsumentów. Pogorszy�aby si� konkurencyjno�� polskich producentów �ywno�ci.
Prof. dr Dimitre Nikolov oraz prof. dr Minka Anastasova-Chopeva z In-stytutu Ekonomiki Rolnictwa w Sofii omawiaj� problem osi�gni�cia równowagi mi�dzy wzrostem produkcji rolnej a potrzebami �rodowiska w artykule pt. „Przewidywane zmiany w dzia�aniach innowacyjnych rolników w latach 2014- -2010” (rozdzia� 16). Dowodz� przy tym, �e najwi�ksz� aktywno�� we wprowa-dzaniu innowacji wykazuj� du�e gospodarstwa, w tym b�d�ce w�asno�ci� firm, mniejsz� spó�dzielcze, a najmniej wprowadzaniem innowacji zainteresowani s� rolnicy indywidualni, prowadz�cy ma�e gospodarstwa. Ich zdaniem optymi-zmem napawa fakt, �e du�� aktywno�� i zainteresowanie post�pem technicznym wykazuj� gospodarstwa m�odych, dobrze wykszta�conych rolników. Martwi jednak, �e w�ród motywów wprowadzania innowacji na pierwszym miejscu s� wyniki ekonomiczne, a na ostatnim troska o ochron� �rodowiska. Najwa�niej-szym bod@cem do wprowadzania gospodarki przyjaznej dla �rodowiska s� do-p�aty obszarowe, które wymuszaj� wprowadzanie do produkcji metod niezagra-�aj�cych naturze.
Prof. Mykola Talavyria, dr Viktoria Baidala z Uniwersytetu w Kijowie oraz dr Vira Butenko z Uniwersytetu w Charkowie na Ukrainie w artykule pt. „Atrakcyjno�� inwestycyjna biogospodarki: przypadek Ukrainy” (rozdzia� 17) dowodz�, �e niezb�dna w tym zakresie jest czynna strategia rozwoju. Zadaniem autorów zapewni ona zrównowa�ony rozwój, wzrost konkurencyjno�ci gospo-darki, bezpieczestwa finansowego kraju i wzrost poziomu �ycia. Aktywno�� inwestycyjna we wszystkich sektorach biogospodarki mo�e by� realizowana przez wszystkich uczestników tego procesu – w�adze lokalne i pastwowe, przedsi�biorstwa oraz spo�eczestwo.
Problem konkurencyjno�ci i przewag komparatywnych sektora rolnego Ukrainy wobec rolnictwa Unii Europejskiej przedstawi� dr Yuriy Trokoz z Na-rodowego Instytutu Nauk o ^rodowisku w Kijowie w artykule pt. „Konkuren-cyjno�� i porównanie zalet ukraiskiego sektora rolnego w handlu z Uni� Euro-pejsk�” (rozdzia� 18). Problem ten wydaje si� by� istotnym, poniewa� Ukraina po zbli�eniu z UE zmienia kierunki swojego eksportu rolnego, a g�ównymi od-

17
biorcami staj� si� kraje unijne. Jednak, jak wiadomo, konkurencyjno�� handlu zagranicznego produktami rolno-spo�ywczymi nie jest warto�ci� sta��. Zmienia si� w zale�no�ci od koniunktury na rynkach �wiatowych, urodzaju, kosztów produkcji itp. Dr Sergey Grygoryev i prof. Sergey Niko�ajewicz Kwasha w arty-kule pt. „Konkurencyjno�� ukraiskich produktów rolnych na rynku europej-skim w czasach wyzwa finansowych” (rozdzia� 19) dowodz� jednak, �e pomi-mo kryzysu politycznego i finansowego na Ukrainie, sytuacja rolnictwa jest re-latywnie lepsza, ni� innych ga��zi gospodarki. Decyduj� o tym ni�sze ni� w in-nych krajach koszty, szczególnie koszty pracy. Producenci rolni s� sk�onni do sprzeda�y swoich artyku�ów po ni�szych cenach, co czyni je bardziej atrakcyj-nymi i konkurencyjnymi. Rolnictwo wci�� jeszcze pozostaje mocnym punktem ukraiskiej gospodarki.
Tom koczy rozdzia� podsumowuj�cy, na temat konkurencyjno�ci i kom-plementarno�ci, b�d�cy zbiorem najwa�niejszych wniosków z przedstawionych w poprzednich rozdzia�ach artyku�ów. Dzi�ki nim jeste�my bogatsi o nowe do-�wiadczenia, wiedz� i informacje o problemach ró�nych regionów naszego kon-tynentu. Nie ulega w�tpliwo�ci, �e wsz�dzie, w wi�kszym ni� dotychczas stop-niu, docenia si� znaczenie zrównowa�onego rozwoju i równowagi mi�dzy wzro-stem produkcji �ywno�ci a ochron� �rodowiska. Przedstawione artyku�y przy-bli�aj� nam obraz zagro�e dla �rodowiska w ró�nych regionach Europy, opisu-j� podejmowane w poszczególnych krajach dzia�ania i wdro�one systemy praw-ne, których celem jest ograniczenie zagro�e, wreszcie prognozuj� przeobra�e-nia w zakresie produkcji rolnej i �rodowiska, cho� sytuacja w poszczególnych krajach jest bardzo zró�nicowana. Zdajemy sobie równie� spraw� z tego, �e pomimo obszerno�ci opracowania, nie uda�o nam si� wyczerpa� listy pyta zwi�zanych z analizowanym zagadnieniem. Jedno jest jednak pewne – tematyka tej publikacji jest na tyle wa�na, �e uznajemy, i� zagadnienia te powinny by� przedmiotem dalszych bada, merytorycznych dyskusji, a wnioski powinny by� przekazywane spo�eczestwu, administracji i politykom. Pozostawiamy zatem sobie mo�liwo�� kontynuacji dyskusji na powy�szy temat. Szans� tak� stwarza nam realizowany w latach 2015-2019 przez Instytut Ekonomiki Rolnictwa i Go-spodarki Qywno�ciowej – Pastwowy Instytut Badawczy Program Wieloletni pt. „Rolnictwo Polskie i UE 2020+. Wyzwania, szanse, zagro�enia, propozycje”. Dyskusj� na ten temat b�dziemy kontynuowa� na forum organizowanych przez Instytut seminariów i konferencji naukowych, jak równie� w serii wydawniczej Programu Wieloletniego. Tym samym zach�camy wszystkich czytelników do �ledzenia wyników naszych bada i docieka naukowych m.in. poprzez stron� internetow� Instytutu: www.ierigz.waw.pl

18
Bernardo Reynolds Pacheco de Carvalho University of Lisbon. Instituto Superior de Agronomia, Lisboa
2 Sovereignty, Food Security and Sustainable Development: Environmental and Economic Challenges
Introduction 2.1
Economic development is still the main challenge the human kind is fac-ing, mainly in regard to the basic needs and sustainability concerns, but immedi-ately linked with freedom of choice and quality of life improvements.
Recently, the concerns about freedom of choice and security in our socie-ty are again strongly present meaning, frequently, that more freedom implies less security and/or more security less freedom. The recent reflection in policy analysis and role of agriculture in the development process, regarding food secu-rity matters, also points out that “security” should also mean, in most of the times, more freedom of choice and not the reverse. The discussion in this paper will be focus on finding key aspects and concerns that can be convergent, repre-senting different points of view but essentially looking into the same issues and dimensions that need to be taken into consideration in policy analysis.
Economics and environment can be two different dimensions of the ecosys-tems on which human kind depends, the first immediately related with efficient choices regarding the economic rationale, mainly focused in the short run period, and the second (more evident in the long run) looking to the impact of human activ-ity (“foot print” measures) in natural resources. Sustainability is, probably, the “key factor” to be under analysis, dealing with complementary and /or competing issues between economic rationale and environmental impact. Time and space are, proba-bly, the most important variables that need to be taken into the “equation system” analysis dealing with sustainability need (social and economic rational, and natural resources use with their respective impacts (over time and space)).
Sovereignty in food matters appeared with international relevance and in-stitutional normative “wording” exactly at the same time with “food security” concept and definition at the UN/FAO meeting in 1996. This reference is bring-ing into discussion a new vision about the food system, related with the right to produce and consume under a local perspective and eco-related rationale. It was born under a family farming perspective, integrating production and consump-tion right to choose, respecting culture, tradition and environment. Most of the time it was viewed as one biased perspective not favourable to trade improve-

19
ments and modern technology implementation. But let us look to the essential aspects of those concerns that can be identifiable as the “core/fundamentals” of this new perspective used for significant social groups. It seems obvious that two aspects are necessary conditions for sovereignty concerns: freedom of choice and space relations, especially the social relations linked with “power” and “property rights” that are expressed as “territorial considerations”.
From social analysis the “territorial notion” has always been controver-sial. But it is always a relation between a referential space (and time) and an es-tablished relationship of certain power “appropriated” by someone. Any society produces a “territory” and depends from a certain “territory”. At the same time freedom of choice over a certain space relationship defines clearly degrees of freedom and responsibility for each one of us and for collective actions within a certain society. The food sector and the agricultural sector are among the cru-cial economic and social areas in the European construction, but also responsible for the administration of great share of territorial resources in any country.
Economic policy, public but also private, should play a determinant role re-garding the main sustainability questions in the development process, within the human development systems. Food and agricultural policy in the European Union has been one of the most successful cases in the EU integration solving the “food security equation”, providing guarantees of sufficient food intake for all in the re-gion with reasonable quality. However the social security systems, social inclusion, public but also private initiatives, have played an important role to provide guaran-tees of reasonable food security across the different societies, regions and families, and deserve attention. The interactions among both areas of policy intervention open new opportunities that are now starting to be explored.
The multifunctionality of the agricultural sector has been assumed as cru-cial for development and sustainability objectives. What is neither obvious, nor present in most food policy analyses and case studies is the structural changes of the food systems. According to the author [Carvalho 2014], Europe and OECD countries are living on an output surplus capacity phase, mainly in food produc-tion (but also in several other sectors).
Taking this point of view that has been demonstrated at macro and micro levels, the food consumption research area and literature review also provide evidence of the demand constraints at micro and macro levels. For example, the Engler’s curve relating income growth with food consumption levels provides evidence of the limits on consumption markets. Many other references can be offered in relation to the demand constraints, but in the current discussion what will be stressed is the need to introduce the notion of “consumption space” re-garding markets and development objectives.

20
Within a development perspective some other referential elements need to be kept in mind. Accordingly with the author’s view, based on conceptual and theoretical models, but also real experiences and case studies, the models used stands providing arguments, rationale, facts and empirical evidences showing how important it is to provide the economic policy for the most correct “regula-tory environment”. In most cases wherever markets can function in reasonable conditions, the most efficient system and correct “business environment” should be “pro-market oriented”. Regulation and markets are most of the time assumed to be two different approaches to the economic system, the first based on gov-ernment intervention and the second resulting from the “natural” interaction of the economic agents. Today there is a significantly consensual and convergent perspective that there is a need to have as many as possible markets working whenever and wherever they can function in reasonable conditions, but also the need to have different forms of regulations providing the best “business envi-ronment”. The most important message is to assume that regulation is most of the time a necessary condition (not sufficient) for success, but regulation that facilitates business and provides and “enhanced environment for business” in a market oriented economy.
Analytic structure and methodology 2.2
In this paper the main goal is to look for convergent perspec-tives/diagnosis in the food system and in the development process allowing the design an analysis of possible policy solutions to strength food security achievements and sustainability in the development process. “Economy versus environment” challenges are a starting point for looking into the dynamics of the food system and searching for actions at local and global policy measures for sustainable changes able to achieve the most successful trend in development and quality of live for a certain referential population (most of the times at coun-try level, but also at regional and local levels). Three different referential models are discussed:
A – Basic Sustainable Development Model; B – Induced Changes and Innovation Model – general equilibrium per-
spective; C – Demand Constraints and New Demands. From the discussion of the three different approaches to better understand
and explore alternatives for intervention in the food system, actions and policies, the author provides a short revision on key concepts and derives some hypothe-sis to be explored under empirical conditions and testing rational procedures. To start providing evidences and facts that can support the rationale presented, two

21
case studies are used. One based on the experience of Portugal, a relatively de-veloped country, well “fed” with some of the best food consumption characteris-tics, but with limits on markets and evolving from an isolated perspective to a very open economy. On the other extreme there is a very small country in Af-rica, São Tomé e Principe, one of the poorest countries, but with relative good conditions in food consumption in the past and today based on a very open and international related solutions (international cooperation) with clear challenges in terms of lacking autonomy and sustainable development processes.
In both country case studies, the international community plays a key role, where demand constraints have been relaxed based on the trade possibilities, but where sustainability and “trade offs” between economic development, sustaina-bility and freedom of choice (risks and vulnerabilities) need to be considered. The data presented and the arguments discussed previously (based on the third approach, demand constraints and new demands, that are not fully explored here, but deserving some attention in the future), at least show the importance of the international trade. However, the hypothesis of having other solutions to help to solve the “demand constraints”, such as the importance of the lo-cal/global development cannot be rejected and cannot be tested directly. That means that concepts and considerations such as territorial considerations and sovereignty (freedom of choice under a certain space and time) will stay under theoretical and analytic discussion with great potential for helping to achieve a “better world”.
Models discussion and revision of key concepts 2.3
Sustainability concerns are not new and can be found in the literature at least since the XIX century (for example with Thomas Malthus, in food mat-ters). Conservation and environmental issues are not exclusive matters from the last decades, but a referential moment was the United Nations Conference on the Human Environment, 1972 in Stockholm.
Referential model A
The most traditional and frequent model dealing with sustainability and development can be represented in the Fig. 1 below.

22
Figure 1. Referential models – model A – sustainable development model
Source: Author’s elaboration.
Referential model B
The second model used in the present analysis is based on Hayami and Ruttan (1985) work and hypothesis, with its roots in the idea of the Induced Change rationale in the economy. That is, the technical and institutional changes are always a result of induced process based on economic rationality. The author in his previous work [Carvalho 2004] also used the same analytic structure, but introducing some important changes, related with the role of markets and gov-ernments. First, considering markets as an institution (but also more than that), meaning that markets are not necessarily a result of human construction but al-most a natural phenomenon which can be found in the nature and other biologi-cal systems. Secondly, considering that governments are also institutions (but also more than that), in the sense that should be viewed as a special type of insti-tutions, first of all representing a very broad set of institutions in itself, and sec-ondly with a determinant role in terms of decisions and relevance in defining the rules of the “game”. Recently, the discussion evolves, and a broad concept starts to be used, dealing with a notion of “systemic governance” which includes gov-ernments but also all other forms of defining the decision-making process and respective application and implementation of the decisions assumed by any eco-nomic unit, at individual and collective levels and at micro and macro/collective levels. The Figure 2 represents the “state of the art” regarding the previous anal-ysis and more recent applications.

23
Figure 2. Referential models – model B – induced changes and innovation model
Source: Carvalho (2004) and author’s elaboration.
The most recent discussion using the sustainability model and the induced innovation rationale, called ICI – induced changes and innovation model, which indeed can be viewed as a “general equilibrium model”, can be combined to produce a new structure to allow for a more complete perspective centered on environment/ecology plus a territorial equilibria focus where markets and gov-ernance questions should be viewed as part of it. As an alternative, both, markets and governance can be included under the institutional factors. The most im-portant issue here is the “merging” effort to joint analysis of induced innovation rational with the “sustainability” dimension. The figure 3 below offers this new perspective to be discussed and used for policy analysis and sustainable devel-opment inquiries.
Figure 3. Referential Models – model B2
– induced changes and innovation model+sustainability
Source: Carvalho (2004) and author’s elaboration.

24
In this new formulation, centered on “ecology” and “territorial equilibri-um”, supply and demand are considered within its economic rationale, but also within its impact on nature (“foot print”) and “institutional environment”. Local and global levels need to be considered, mainly in terms of sustainable devel-opment issues. The short and long run perspectives can be used, but on long term perspective, environment and territorial equilibria need to be achieved, and economic and environment’s matters necessarily need to be convergent. In short run conditions, “trade off” relations need to be analyzed and considered, since economic results can have important externalities and environmental impact (negative ones) that need to be taken into account as costs associated to the pro-duction/economic decisions (which, much of the time, markets cannot take into account).
Referential model C – demand constraints and new demands
Demand is the new “driving force” in the modern economy, where pro-duction capacity is now beyond consumption possibilities; new demands arrive every day, but some constraints are present, such as the “time frame” and the “value of time”. The author [Carvalho 2014] provided a general definition for “production”, where a “modern view” is needed to include a chain perspective, where the last step is the “production of utility”, present or future utility to someone, that is, the consumption process in itself. Indeed, with this perspective, “consumption” is the last step in the production chain and chain value creation.
Chain value studies are becoming more and more important, allowing to focus on the essential objective, “creation of value” and at the same time looking on the market functioning characteristics, power relations along the chain and respective distribution of the value creation process.
In the food sector, EU-15 is clearly achieving a new equilibrium in pro-duction and consumption, with almost no growth in both sides at global levels in relative terms. Demand growth depends on more consumers (population), and per capita income growth/ consumption growth per capita. In the food sector, in per capita terms, in many products, it is evident the “plateau” and /or decreasing levels of consumption (Engel’s law, 1857). The “saturation levels” in consump-tion is becoming more evident in many products and in food overall, since there is a limited capacity to consume. In other words, it can be said that food is the first consumption need to be “solved” in any development process. There are specific characteristics in the food production process, but demand behaviour also has specific characteristics. For example, it is well known that food demand is price inelastic. It is also well known that the budget share on food for families of high income is much lower than those with low income levels. Income elas-

25
ticities for many products, for example new products entering into the market, will tend to have a “logistics curve” behaviour (“Pacheco’s curve”). But for all food products, and for aggregated food item, a high income level means also low income elasticity. In real context there is no “space” for significant growth in food demand at high income levels. This also means that industrialized econ-omies, more developed ones, will not provide significant food market growth and always lower growth with higher income levels.
The analysis of demand constraints and respective analytic models in re-gard to technical /technological and institutional change processes can be ex-plored to provide a powerful tool to understand the food system behaviour. It is also important to look into the “theory of constraints” (TOC) as a paradigm in management, looking always at any manageable system as being limited in achieving more of its goals by a very small number of constraints. All those per-spectives can be connected and explored in more detail. Here the focus is to identify and point out some of the measures for food policy that can help to pro-vide “demand constraints relaxation”. Again, it is assumed that in any situation there is a possibility to “relax” constraints and in a systemic view there are al-ways some (few) factors that are the most limitative. For a broad categorization it is possible to point out the following measures/type of measures (for food pol-icy intervention). A. Enlargement of markets measures in general (income distribution possibili-
ties, for example); B. Logistics and information; C. Infrastructures; D. Trade improvement measures, in special the international trade; E. Processing and conservation; F. Adding value strategies; G. Co-generation of value.
The great majority of the factors pointed out above are quite clear in terms of demand impact possibilities. Here a brief comment is provided in regard to the last ones. Today many of the possible strategies to “create value” in the food and agricultural systems will have to rely on other dimensions beyond nutrition-al value of food (such as ludic, historical, cultural, ecological and sustainability dimensions) and/or explore other “uses” for the outcomes of the agricultural sec-tor such as non-food utilization industries and the “services of nature” related to the ecological and sustainability/environmental dimensions.
The last one, co-generation of value, very much related with local and re-gional development objectives is based on the “closed” overall cycle of produc-tion, utility generation and immediate/short chain consumption by final consum-

26
ers. That is, there are possibilities to generate value with food production, avail-ability of land, labour and “local consumption space”, where the ones involved in the value creation can participate in great manner in its local consumption with short chains. Value created is reflected immediately in “income genera-tion”, with increasing demand, turning potential demand into “effective de-mand”. That means, the production is very well connected with consumption, which is realized using short chain and local/regional based consumption.
Alternatives for intervention based on the models presented: 2.4 concepts and hypothesis to be explored
All those concepts and concerns about environment and sustainability de-rived from the United Nations Conference on Human Environment in 1972 have been used and received increasing attention. Recently the climate change evi-dence, biodiversity loses and other ecosystems challenges have been under a strong pressure from the public and scientific evidences raised by research. Along with those new challenges raised, mainly due to and as a consequence of human impact on the environment, social and economic problems continue to deserve a special attention, mainly where lack of improvements seems to be permanent and related to the human basic needs such as enough “food” and basic nutritional needs satisfaction.
Food and nutritional security are a very old dilemma to the human society, however it is necessary to recognize the huge improvements of the food sys-tems, mainly between 1950 and 1990’s but at the same time, it is important to recognize the new paradox (contradiction of the food system not solved and with permanent character) after middle 1980’s, and definitely after 1990’s where there is enough food to feed everyone in the world, but the estimations of hunger is maintained around the interval of 800 million to one billion people in the last 20 years [Carvalho 2013][FAO].
With regard to several “paradoxes” in the food systems, the conceptual evolution around hunger and food system dynamics “produced” some new “approaches”. It is consensual to say that today much more importance is given to a systemic agricultural research approach and food policy intervention, as well as, a clear “chain value analysis” related with markets functions and regu-lation needs. The first links us immediately with the increasing consciousness of the “multi-functionality” outcomes from agricultural activities, and the sec-ond beyond the need of an integrated analysis, looking to market functions, efficiency conditions but also benefits (and created value) distribution along the chain value.

27
Two different concepts appeared in the international arena, which might be considered crucial for sustainable development goals. The first one is the food security concept, linked with human security concerns very much present after the II World War. The second one is the “food sovereignty” linked with freedom of choice (or lack of freedom) in production and consumption, basically under a family farming structure. Both received special attention and were “con-secrated” at the World Forum in 1996 (FAO World Food Summit).
The World Food Summit [FAO 1996] referential definition is the follow-ing: “Food security exists when all people, at all times, have access to sufficient, safe and nutritious food to meet their dietary needs and food preferences for an active and healthy life”. Based on that worldwide accepted definition and follow up discussion, the author proposed a similar definition with a clear definition of axis for analysis and intervention, such as the following: Food security means ability to access food in physical and economic terms to achieve a healthy diet in permanent and continuous way. It implies diminishing risks and uncertainties in the food system, at least in the following dimensions: A. Availability; B. Access; C. Consumption/quality, efficiency, nutritional and utilization forms; D. Stability; E. Vulnerability and Resilience of the Food Systems.
Food sovereignty indeed appeared very much motivated from the failures of previous policies, appealing to productivity growth and trade, but failing agri-cultural development and sustainable development, very much global and corpo-rate based regime (what has been termed the “corporate food regime”). Some-times it can be considered as a concept reaching beyond food security, but what is important to consider here are the common roots and goals. Let us start with the most common definition [Wikipedia 2016 www.wikipedia.org/wiki/food_ sover-eignty]: “Food sovereignty is the right of people to healthy and culturally appro-priate food produced through ecologically sound and sustainable methods, and their right to define their own food and agriculture systems. It puts those who produce, distribute and consume food at the heart of food systems and policies rather than the demands of markets and corporations. It defends the interests and inclusion of the next generation. It offers a strategy to resist and dismantle the current corporate trade and food regime, and directions for food, farming, pasto-ral and fisheries systems determined by local producers. Food sovereignty prior-itizes local and national economies and markets and empowers peasant and fam-ily farmer-driven agriculture, artisanal fishing, pastoralist-led grazing, and food

28
production, distribution and consumption based on environmental, social and economic sustainability”.
According to “La Via Campesina” (in www.foodsecurecanada.org/who-we-are/what-food-sovereignty, 2016, March) “Food Sovereignty is the right of peoples to healthy and culturally appropriate food produced through ecological-ly sound and sustainable methods, and the right to define their own food agricul-tural systems”. What can be said in a very short definition is that food sover-eignty refers to the right to produce food on one’s own territory.
Looking to both definitions and origin roots it is clear that they seem clearly different, however diminishing risks and uncertainties (security) and freedom of choice associated with development, growth, and sustainability, re-call the need to achieve higher security levels (and respective public and private policy needs) which implies providing higher protection, autonomy to people, and lowers the vulnerability of systems. Without going into tiny details, what seems obvious is the need to consider time and space factors in both definitions and “territorial” dimension in the food systems.
The notion of “territorial dimension” has always been polemic. But it is always a relation between a certain space (and time) and an established relation-ship of certain power “appropriated” for someone. What is extraordinary in rela-tion to the “territorial notion” is the linkage with any society and human behav-iour “any society produces a territory and depends on a certain territory”.
From the international discussion and evolution of concepts, our objective of showing “common grounds” and “common roots” in regard to development and sustainability objectives as well as interfaces with environment and econom-ic relations, points out that territorial questions need to be considered central to the discussion and immediately the sovereignty (and/or the freedom of choice over a certain space) dimension. Food security and food sovereignty discussion are good examples of different approaches to the same type of concerns which are crucial and also central to any sustainable development policy. Indeed, risks and uncertainties in the food system (food security) are already a sufficient um-brella including all the other concerns, but different approaches and specifica-tions also have specific aspects that need and deserve more attention.
Another important consideration derived from the previous discussion, with the experience of using the different models presented, is the need to look to the local/global development linkages and balance. Demand constraints relax-ing measures (globalization) and technology changes are at the center of the de-velopment process in the industrialized economies, but for an inclusive devel-opment (and sustainable) dimension, but also to solve global demand con-
29
straints, which are now obvious in the EU-15 space (and other more developed economies), local development is a necessary condition.
Local/global relation analysis platform is certainly an important bench-marking initiative, promoting an inclusive and sustainable development process. Food systems are a good starting point to focus on relevant economic relations that need to be well known, such as demand constraints, the local development needs without diminishing the needs for more international relationships.
Cases studies for food policy: sovereignty, food security 2.5and sustainable development
The literature review is already well served with several references related to those problems, and more recently with food sovereignty issues, research and discussions. It is useful to note that into governmental policy, specifically into food policy agenda, this notion is entering the political arena. In September 2008 Ecuador became the first to introduce this concern into the constitution, and many others did the same afterwards such as Venezuela, Mali, Bolivia, Nepal, Senegal and Egypt (2014 constitution), according to Wikipedia information. In Europe the issue also deserves attention. In Austria (2011), a huge meeting occurred, with more than 34 countries involved and more than 400 people from different origins to discuss food sovereignty in Europe. What is evident is the failure of the food system in many situations, and the failure of the most com-mon policies of production growth. The “green revolution” success story, mostly related with plant breeding and crop yields growth mainly between 1960 and 1980’s is the most significant example of the need for an integrated policy and global development perspective, but based on local grounds. Criticisms have been present and need to be better understood.
In the present effort, two different countries are studied and discussed. One European country, Portugal, which will be used as an example for more de-veloped economy, and a very small country, developing economy in Africa, São Tomé e Principe, but both with great improvements in the agro-food system and/or food consumption, both very open to stronger international relations and trade, but both showing signs for policy concern in relation to risks and vulnera-bilities in the food systems.
Portugal case study overview
Portugal last year’s growth was impressive in the agro-food sector and in trade. For the first time in many decades trade balance has been positive since 2013 up to 2015, and the agri-food sector contribution has been important.

30
Table 1. Comparative growth rates for the agroforestry and fisheries sector and the economy in 2000-2011 period (% in current prices)
Imports Exports Agriculture 4.0 10.9 Fisheries 4.3 6.1 Food, beverage and tobacco industries 4.8 8.0 Forestry -1.8 5.0 Forest industries 1.6 4.4 Agri-food sector 4.6 8.2 Forest sector 1.1 4.4 Agroforestry and fisheries sector 3.8 6.2 Economy – goods 2.3 4.0 Economy – goods and services 2.6 4.6
Source: GPP estimates from National Acconts, INE in Carvalho (2014).
Table 2. Self-sufficient rates in Portugal, before and after EU integration, measured
in % of local production in regard to consumption. GAA% - degree of self-sufficiency Before EU – GAA % After EU – GAA%
Cereals 47.0 27.0 Wheat 37.0 11.5 Rice 63.0 53.0 Corn 47.0 29.2 Roots and tubers 94.2 58.7 Horticulture+fruits 178.8 166.4 Bovine meat 96.2 52.2 Swine meat 100.7 51.3 Chicken meat 100.0 93.0 Bovine+goats 100.0 79.8 Milk 100.0 106.2 Fish 102.1 41.1
Source: data from GPP/Ministry of Agriculture in Carvalho (2014).
The challenges still continue in regard to export growth and import substi-tution (under a crisis perspective, since it is neither possible, nor feasible to have all the “economic space” with trade surplus). However, it is important to stress the degree of openness of the economy and specifically in regard to the agri-food related sectors. The table 3 below clarifies this point presenting the ratio for “economy openness” (which means the relation of the export+import value in relation to the adding gross value in each sector).

31
Table 3. Degree of openness of selected agro-industrial sectors for Portugal
Econ. total Farm prod., forest and
fish
Food+bev., and tobacco
industry Textiles Wood material, paper
and printing services
1995 62.63 46.60 221.29 212.47 142.34 2000 71.28 63.71 219.20 259.22 160.66 2005 67.22 77.16 205.15 246.13 178.01 2010 71.19 112.97 257.77 272.74 202.15 2012 80.33 131.07 302.44 277.27 239.82 2013 81.90 121.80 308.95 284.69 247.55
Source: Pordata (2016) and author’s data treatment.
The first column shows the global situation for the economy, as a refer-ence, but the following columns show the agri-food related sectors, strongly open, above the average and growing significantly.
São Tomé e Principe case study overview
São Tomé e Principe is a very small country in the middle of the Atlantic, just on the equator about 500 km off the West African cost. It is a very interest-ing country from the edaphoclimatic point of view with rainfall varying from less than 800 mm to more than 3,000 mm. It is a country with a population get-ting close to 200 thousand people, growing significantly but with relative good index of wellbeing life conditions (in the year 2000 with 65.1 years for expec-tancy of life at birth when the average for the world was 66.9). It is also a coun-try with very low per capita income, but with very good conditions for agricul-tural and food production. However, food consumption and nutritional situation is still very challenging for many families.
Table 4. Daily consumption evolution in caloric, protein and fat contents,
in per capita terms, EMD – equivalent man per day, between 2002 and 2014. Data obtained from different research work performed at CIAT-CD/REDISA-CPLP
Local Year Calories (kcal/EM/day)
Proteins (g/EM/day)
Fat (g/EM/day)
Observations
Água-Grande 2002 2682.10 113.70 n.d. Santo S. (2008) Água-Grande 2004 2780.08 94.94 n.d. Tavares (2005) Água-Grande 2008 3354.40 147.30 23.73 Santo S. (2008) Água-Grande 2011 2650.75 n.d. n.d. Almeida (2011) Água-Grande 2014 3601.26 125.21 95.86 Silva (2014)
Source: Silva (2014).
The Center for Tropical Agriculture Research – Cooperation and Devel-opment (CIAT-CD)/University of Lisbon, today with the support on a Network for Food Security and Sustainable Development (REDISA-CPLP) has been able

32
to promote several studies on food consumption and food policy in this country. The table 4 is a good example of those studies which, in general, shows a signif-icant improvement on food consumption. However, food imports including in-ternational food aid have been the important source of available food consump-tion, with impact on consumption habits and local production.
Food consumption evolution needs to be evaluated, not only in regard to global consumption levels but also in regard to other aspects, such as local im-pact and interaction with local production possibilities, mainly when habits are evolving not in harmonic conditions with natural resource base.
Table 5. Daily consumption evolution in Kcal per capita per day in STP,
between 2001 up to 2010, with classification of the origin of products, in national or international origin, local production and imports
Kcal/day/Years 2001 2002 2003 2004 2005 2006 2007 2008 2009 2010
National Products (Kcal/dia)
1514 1428 1398 1159 1163 2031 1342 1399 1316 1250
Imported Products (Kcal/dia)
1082 1320 968 1133 1639 1322 1279 1329 1764 1809
Total 2596 2748 2366 2292 2802 3353 2621 2728 3080 3059
National Products (%)
58.32
51.97
59.09
50.57
41.51
60.57
51.20
51.28
42.73
40.86
Imported Products (%)
41.68
48.03
40.91
49.43
58.49
39.43
48.80
48.72
57.27
59.14
Source: INE-STP in Silva (2014).
The Table 5 provides a comparison between local sources and interna-tional sources of food for the first decade of the XXI century. The table 6 below provides also information in caloric intake (2014), but also in protein and fat consumption levels, looking to the general situation but also to the two most im-portant districts, representing more than 50% of the total population. What can be seen is a very good global situation with more than 3000 kilocalories per cap-ita per day food availability.
Both tables are consistent showing a growing share of international food supply, more or less changing in 10 years from 60:40 to 40:60 ratios between local supply and international supply. Last table shows that this ratio is still maintained in more recent times. Protein source are clearly more important for local reference, but for fat sources the reverse holds.

Table
Con-sump-tion
National prod. Imported prod. Total National prod. (%) Imported prod. (%)
Source:
Tsupplytion antion sy
C2.6
T“Econoissues of the presenttime. Tis impowelfareinto thbut demsuch as
Trelationamplesthe fooat loca
e 6. Daily co(the
e Mé-Zochpopulation
ÁCalories Kcal/EM/d 1473.47
2127.79
3601.26 40.92
59.08
Silva (201
There is ny. The quend economystems. Th
Conclusion
The articlomy versubasically “food facted lookin
The need tortant to le and sus
he internatmand cons promotinThe two cns and tras also streod systemal/global su
onsumptione two most phi (45 000 inn, in terms Água-Grande
Protein g/EM/d 76.9
48.33
125.23 61.41
38.59
14)
no doubt thestions nowmic develohe answer
ns
e promoteus environlinked to tctor” as a ng to diffeto differenlook to thstainable dtional oppnstraints sng local dcountry caade for foess the nee
ms and to tustainable
n in Kcal, ppopulated)nhabitants)of Nationa
Fat Cag/EM/d Kc30.93 14
64.95 19
95.88 3332.26 42
67.74 57
hat internaw are inevopment, mis not stra
es a broadnment – cothe food snecessary
erent devent approache commondevelopmeportunitieshould be evelopmeases overvood availaed to lookthe need oe developm
33
proteins an), Agua Gr), represen
al ProductsMé-
alories Pcal/EM/d g/442.08 69
924.86 40
366.94 12.83 62
7.17 37
ational travitable rel
mainly in raightforwa
d discussioompetitivesecurity quy conditioelopment ches and pn groundsent shoulds, trade is surpassed
ent alternatview stresability andk carefullyof explorinment dyna
nd fat in STrande (73 0nting more and ImporZóchi
Protein Fat/EM/d g/EM9.55 28.54
0.93 61.92
10.48 90.462.95 31.5
7.05 68.4
de plays alated to threlation to ard and de
on about reness or couestions anon for sustmodels an
perspectives and cond converg
playing ad looking tives. ss the reled consumpy to the ring food poamics.
TP for two d00 inhabitathan 50%
rted Produ
CalorieM/d Kcal/EM4 1457.77
2 2026.32
6 3484.1 5 41.84
5 58.16
a very relehe impact
the nationserves fut
relevant aomplemennd concerntainable dnd concepes can be jcerns. Fre
ge in foodan importalso to o
evance of ption. Howisks and volicy inter
different diants) of the tota
ucts in 2014General
es ProteinM/d g/EM/d75 73.225
25 44.63
117.8662.13
37.87
evant role on local pnal food pture attent
aspects unntarity”, thrns. The evdevelopmept evolutiojustifiable
eedom of d terms. Ltant contriother appro
the internwever, thovulnerabilrventions
istricts
l 4
n Fat d g/EM/d 5 29.735
64.835
6 94.57 31.44
68.56
in food produc-produc-ion.
nder the hematic vidence ent was on over e, but it choice,
Looking ibution, oaches,
national ose ex-lities of aiming

34
References
1. ANSA – Agência Nacional de Segurança Alimentar de Cabo Verde (2013). Anuário de Segurança Alimentar de 2010-11. Praia, Cabo Verde.
2. Baleiras, R.N. (2014). Território e Desenvolvimento Económico: Falhas In-stitucionais (Territory and Economic Development: Institutional Failures). Publicação Ocasional do CFP (Ocasional Paper of the CEF) – Conselho das Finanças Públicas (Council of Public Finance), no. 3/2014. Lisboa.
3. Carvalho, B.P. de et al. (2004). Cooperação e Desenvolvimento: Oportuni-dades e Desafios para o Século XXI. Série de Estudos de Desenvolvimento e Gestão de Sistemas. vol. 10(3). ISA/CIAT – Instituto Superior de Agrono-mia, Secção de Agronomia Tropical – Departamento de Agro-Indústrias e Agronomia Tropical da Universidade Técnica de Lisboa e Centro de Inves-tigação de Agronomia Tropical – Cooperação e Desenvolvimento. Lisboa.
4. Carvalho, B.P. de, Costa, D. and Carvalho, N. (2009). Global Challenges and Local Solutions: Wine Sector Changes in Europe and in Portugal. IAMA, 19th Annual Forum and Symposium. Budapeste. Hungary.
5. Carvalho, B.P. de, Costa, D. e Leite, I. (2011). Global Food Outlook: Global Challenges and Local Solutions. IFAMA, 21st Annual World Forum and Symposium. Frankfurt, Germany.
6. Carvalho, B.P. de, (2012). Food Security: Global Challenges and Local So-lutions. SEDGES – Série de Estudos de Desenvolvimento e Gestão de Siste-mas. Vol. 18 (3). ISA/CIAT – Instituto Superior de Agronomia Tropical. Centro de Investigação de Agronomia Tropical – Cooperação e Desenvolvi-mento. Paper presented at XIII World Congress of Rural Sociology, 29 July up to 4 August 2012. Lisbon (http://irsa2012.com/event/wcrs-2012/).
7. Carvalho, B.P. de, (2013). Science Meets Reality: Economic Efficiency, Mar-kets, Institutions and Food Security. International Journal on Food System Dynamics 4(2), 88-105. University of Bonn. Alemanha.
8. Carvalho, B.P. de (2014). Regulations, Markets and Economic Efficiency: Sustainable Development and Food Security. Institute of Agricultural and Food Economics. National Research Institute. Warsaw, Poland.
9. FAO, Food and Agriculture Organization of the United Nations (2002). Trade Reforms and Food Security. Economic and Social Economic Depart-ment. FAO Document Repository, PDF version (available in www.fao.org, link described below).
10. FAOSTAT 2012 and 2013. On line data bases. 11. FAO (2009-12). The State of Food and Agriculture. Rome. 12. FAO (2010-12). The State of Food Insecurity in the World.Rome.

35
13. Ferrão, J.E.M., (2005). A Aventura das Plantas e os Descobrimentos Portu-gueses. Edição do IICT – Instituto de Investigação Científica Tropical, Fundação Berardo e Chaves Ferreira – Publicações S.A. Lisboa. (The Adven-ture of Plants and the Portuguese Discoveries booklet in English on a con-densed version is published by the same author).
14. Hayami, Y. e Ruttan, V. (1985). Agricultural Development: an International Perspective. The John Hopkins Univesity Press. Baltimore and London.
15. Maxwell, Simon, Frankenberger, T., (1992). Household Food Security: Con-cepts, Indicators and Measurements. A Technical Review. Unicef, New York, IFAD, Rome. (www.ifad.org/hfs/tools/hfspubindex.htm).
16. Mellor, J.W., Johnston, B.F., (1984). The World Food Equation: Interrela-tionships among Development, Employment and Food Consumption. Journal of Economic Literature, vol. 22, pp. 531-74.
17. PNUD (1994). Relatório do Desenvolvimento Humano 1994. Publicado para o Programa das Nações Unidas para o Desenvolvimento pela Tricontinental Editora, Lisboa.
18. Santo, Severino E.,Carvalho, B.P. de, (2012). Food Consumption, Food Chains and Market Evolution in São Tome e Principe. Proceedings of the 6th International European Forum – Igls Forum in Systems Dynamics and Inno-vation in Food Networks 2012. University of Bonn. Austria.
19. Simon, G-A., (2012). Food Security: Definition, Four Dimensions, History. University of Roma Tre. Faculty of Economics. Master in Human Develop-ment and Food Security. Rome. (www.fao.org/filesadmin/templates/ERP/unit/F$D.pdf).
20. Silva, C. (2014). Segurança Alimentar em São Tomé e Principe: Estudo de Caso nos Distritos de Agua-Grande e Mé-Zochi. Dissertação de Mestrado em Eng. Al-imentar. Instituto Superior de Agronomia. Universidade de Lisboa. Lisboa.
21. UNDP (2003). Commission on Human Security. Human Security Now. New York 2003.
22. World Bank (1986). World Development Report. Washington D.C. 23. World Bank (2000). Cabo Verde Study on Food Security and Regulatory
Agency Needs. Basic study supporting the creation of ANSA – Agência de Segurança Alimentar em Cabo Verde in 2002. (Project leader: Bernardo Pacheco de Carvalho).
36
Digital references: 24. http://www.fao.org/docrep/w7442e/w7442e04.html
(accessed on 09.03.2015): Chapter 2. Food security: concepts and measure-ment.
25. http://cultivarbiodiversidade.blogspot.pt/2012/09/conceito-de-soberania-alimentar.html (accessed on 23.03.2015).
26. http://www.acordinternational.org/acord/pt/acord/pt/nossas-actividades/meios-de-subsistncia-e-soberania (accessed on 23.03.2015).
27. http://www.realimentar.org/v1/ (accessed on 23.03.2015). 28. http://pordata.pt 29. http://www.sho.int/mediacentre/factsheets/fs311/en/. 30. http://www.unep.org/Documents.Multilingual/Default.asp
(accessed on March 2016) 31. http://www.wikipedia.org/wiki/food_sovereignty (accessed on March 2016) 32. http://www.foodsecurecanada.org/who-we-are/what-food-sovereignty
(accessed on 2016, March)

37
Dr Barbara Wieliczko Instytut Ekonomiki Rolnictwa i Gospodarki �ywno�ciowej – PIB, Warszawa
3 Internalizacja efektów zewn�trznych w rolnictwie
Wst�p 3.1
Coraz bardziej widoczne i odczuwalne zmiany klimatu oraz zanieczysz-czenie �rodowiska wp�ywaj� na polityk� pastwa i prowadz� do wdra�ania in-strumentów maj�cych na celu ograniczenie negatywnych skutków dzia�alno�ci cz�owieka. Skutki te, jako niekorzystne i niezamierzone, nale�y uzna� za efekty zewn�trzne. Problem ten dotyczy równie� rolnictwa. Tak�e w zakresie efektów o charakterze spo�ecznym rolnictwo mo�e odgrywa� znacz�c� rol� – zarówno pozytywn�, jak i negatywn� – w zwi�zku z takimi kwestiami, jak bezpiecze-stwo �ywno�ciowe, dobrostan zwierz�t czy �ywotno�� obszarów wiejskich.
Efekty zewn�trzne obejmuj� zarówno koszty, jak i korzy�ci dotykaj�ce strony, które nie s� bezpo�rednio zaanga�owane w dany proces produkcyjny lub konsumpcj�. Oznacza to, i� dotycz� znacznie szerszego zakresu zjawisk ekono-miczno-spo�ecznych ni� tylko kwestie �rodowiskowe. W przypadku negatyw-nych efektów zewn�trznych zachodzi potrzeba ich internalizacji, najogólniej polegaj�ca na uwzgl�dnieniu ich w decyzjach producentów i konsumentów. W zwi�zku z tym nale�y ka�dorazowo stara� si� stworzy� kombinacj� instru-mentów internalizacji, uwzgl�dniaj�c zarówno rozwi�zania czysto rynkowe (prywatne), jak i ró�ne formy interwencji publicznej.
Celem referatu jest prezentacja instrumentów internalizacji efektów ze-wn�trznych stosowanych w rolnictwie i analiza roli Wspólnej Polityki Rolnej w procesach z tym zwi�zanych. W pierwszej cz��ci referatu przedstawiono naj-wa�niejsze problemy definicyjne zwi�zane z efektami zewn�trznymi oraz ich cechy. W drugiej cz��ci omówiono problematyk� dotycz�c� efektów zewn�trz-nych w rolnictwie i ich internalizacji oraz znaczenie WPR w tym procesie.
Ju� na wst�pie nale�y jednak zaznaczy�, i� problem internalizacji efektów zewn�trznych nie jest zadaniem �atwym do zrealizowania ze wzgl�du na z�o�o-no�� i ró�norodno�� efektów zewn�trznych, w tym cz�ste opó@nienie w czasie i nieliniowo�� wyst�powania tych efektów. Te cechy efektów zewn�trznych wymuszaj� szersze podej�cie do szacowania ich skali i warto�ci, ni� analiza marginalna. Wci�� istniej�ce ograniczenia w szacowaniu efektów zewn�trznych stanowi� barier� dla optymalnego kszta�towania instrumentów polityki s�u��-cych internalizacji tych efektów.

38
Efekty zewn�trzne 3.2
Istnieje szereg ró�nych typów efektów zewn�trznych oraz sposobów ich podzia�u. Niew�tpliwie jednak bezspornie akceptowanym najprostszym podzia-�em jest wyró�nienie efektów negatywnych i pozytywnych. Negatywne efekty zewn�trzne to koszty zwi�zane z dan� dzia�alno�ci� gospodarcz�, które obci��a-j� inny podmiot ni� ten, który prowadzi t� dzia�alno��. Natomiast pozytywne efekty zewn�trzne to korzy�ci zwi�zane z dan� dzia�alno�ci� gospodarcz�, które uzyskuje inny podmiot ni� ten, który j� prowadzi.
W�ród innych, bardziej z�o�onych podzia�ów wyró�nia si� m.in.: � Istotne efekty zewn�trzne – efekty zewn�trzne, których skala jest na tyle du-
�a, �e wymagaj� podj�cia okre�lonych dzia�a. � Pareto istotne efekty zewn�trzne – efekty zewn�trzne, których skala jest na
tyle du�a i ma znaczenie dla optimum Pareto, �e wymagaj� podj�cia okre�lo-nych dzia�a.
� Kaldor-Hicks istotne efekty zewn�trzne – efekty zewn�trzne, w odniesieniu do których mo�liwa jest zmiana, któr� beneficjenci zrekompensuj� podmio-tom trac�cym [Tisdell 2003].
� Statyczne i dynamiczne efekty zewn�trzne. � Pieni��ne efekty zewn�trzne – efekty zewn�trzne, których warto�� da si� wy-
razi� w pieni�dzu. Natomiast w przypadku rolnictwa najcz��ciej stosowanym podzia�em
efektów zewn�trznych jest wyró�nianie efektów �rodowiskowych oraz efektów spo�ecznych. W�ród �rodowiskowych efektów zewn�trznych wymienia si�: ja-ko�� i dost�pno�� wody, jako�� powietrza, jako�� gleb, stabilno�� klimatu, kraj- obraz, bioró�norodno��, odporno�� na powodzie i po�ary. W przypadku spo-�ecznych efektów zewn�trznych wyró�nia si�: bezpieczestwo �ywno�ciowe, bezpieczn� �ywno��, zdrowie i dobrostan zwierz�t, �ywotno�� obszarów wiej-skich [Cooper i in. 2009].
W kontek�cie internalizacji efektów zewn�trznych wa�n� kwesti� s� ce-chy charakteryzuj�ce wyst�puj�ce efekty. Cechy te obejmuj�: � Wyst�powanie: pewne; mo�liwe przy znanych czynnikach determinuj�cych;
mo�liwe przy nie w pe�ni znanych czynnikach determinuj�cych. � Cz�stotliwo�� wyst�powania: regularny; sporadyczny. � Termin wyst�powania: natychmiastowy; odsuni�ty w czasie. � Zapobieganie: mo�liwe do unikni�cia; niemo�liwe do unikni�cia. � Trwa�o�� skutków: odwracalne; nieodwracalne [Gupta i Prakash 1993].
39
Wyst�powanie efektów zewn�trznych warunkowane jest ró�norakimi przyczynami. W�ród g�ównych przyczyn prowadz�cych do pojawiania si� efek-tów zewn�trznych nale�y wyró�ni�: 1. Nierozerwalne wspó�zale�no�ci mi�dzy podmiotami oraz brak lub s�abe pra-
wa w�asno�ci – dzia�alno�� jednej strony wp�ywa na funkcj� u�yteczno�ci drugiej strony, przy czym rynek nie wycenia tego oddzia�ywania.
2. Wysokie koszty transakcyjne wypracowania modelu kompensacji efektów zewn�trznych1.
Efekty zewn�trzne a rolnictwo 3.3
Efekty zewn�trzne dotycz�ce rolnictwa, zarówno te �rodowiskowe, jak i spo�eczne, mog� mie� ró�ne @ród�o i skal� oddzia�ywania. W zwi�zku z tym mo�na wyró�ni� nast�puj�ce kategorie efektów zewn�trznych: � Efekty zewn�trzne generowane poza rolnictwem maj�ce wp�yw na rolnictwo. � Efekty zewn�trzne generowane przez rolnictwo maj�ce wp�yw na inne sekto-
ry gospodarki. � Efekty zewn�trzne ograniczaj�ce si� do rolnictwa [Tisdell 2007].
Istnieje szereg ró�nych sposobów internalizacji efektów zewn�trznych. Obejmuj� one zarówno instrumenty prywatne, jak i publiczne. W�ród instru-mentów prywatnych wymienia si� kodeksy post�powania ustalane przez dan� grup� podmiotów oraz presj� spo�eczn�. Natomiast w�ród instrumentów pu-blicznych znajduj� si� mechanizmy nakazowo-kontrolne, instrumenty polityki bud�etowej, w tym podatki, oraz instrumenty quasi-rynkowe. Nale�y doda�, �e liczne badania dotycz�ce negatywnych �rodowiskowych efektów zewn�trznych, a zw�aszcza emisji zanieczyszcze, wskazuj� na to, i� najefektywniejszym spo-sobem ograniczenia tych emisji jest wprowadzenie podatku [Pizer 1999]. Roz-wi�zanie to jednak bywa trudne do wprowadzenia ze wzgl�du na opór podmio-tów, które mia�yby by� nim obj�te. Natomiast w przypadku UE dodatkowym problemem jest to, �e decyzja o wprowadzeniu jakiegokolwiek podatku obejmu-j�cego ca�� Wspólnot� musi by� podj�ta jednomy�lnie. By� mo�e w wielu przy-padkach najlepszym rozwi�zaniem w celu skutecznej internalizacji efektów ze-wn�trznych by�oby zastosowanie jednocze�nie kilku instrumentów. Jednak�e badania w tym zakresie s� nadal bardzo ograniczone [Christiansen i Smith 2009].
Rolnictwo generuje zarówno pozytywne, jak i negatywne efekty ze-wn�trzne. Wydaje si�, i� instrumenty prywatne mog� mie� niewielkie zastoso-wanie w zwi�zku z istnieniem du�ej liczby ma�ych podmiotów, które trudno 1 Znacznie szerzej problematyka efektów zewn�trznych zosta�a przedstawiona w monografii [Prandecki i in. 2015].

40
zjednoczy� w celu wypracowania wspólnych kodów post�powania i mog� by� odporne na presj� spo�eczn� ze wzgl�du na ma�� skal� swojego dzia�ania, a cz�-sto równie� nie maj� bezpo�redniego kontaktu z konsumentami. W zwi�zku z tym w celu internalizacji efektów zewn�trznych generowanych przez rolnic-two nale�y zastosowa� instrumenty publiczne. Mo�na wykorzysta� instrumenty polityki zach�caj�ce rolników do zmian w ich zachowaniu i stosowanych prak-tykach, obejmuj�ce dzia�ania z zakresu doradztwa rolniczego, instrumenty regu-lacyjne i instrumenty ekonomiczne [Pretty i in. 2001].
Wybór sposobu internalizacji efektów zewn�trznych zale�y od skali wyst�-puj�cych barier ich internalizacji oraz od poziomu kosztów zwi�zanych z internali-zacj�, w tym kosztów transakcyjnych. Jednak�e wybór metody internalizacji efek-tów zewn�trznych jest utrudniony przez ograniczenia dotycz�ce dost�pnej wiedzy na temat skali wyst�puj�cych efektów zewn�trznych oraz ich wyceny. Co wi�cej, wybór sposobu internalizacji efektów zewn�trznych jest zdeterminowany przez polityczne, spo�eczne, �rodowiskowe i ekonomiczne ograniczenia.
W przypadku rolnictwa UE koszty internalizacji efektów zewn�trznych obejmuj� koszty: � Ponoszone bezpo�rednio przez rolnika: zwi�zane z obowi�zuj�cymi regula-
cjami, normami i standardami – w ramach WPR, np.: zazielenienie, wymogi wzajemnej zgodno�ci.
� Ponoszone bezpo�rednio przez spo�eczestwo: zwi�zane ze wspieraniem sek-tora w celu zwi�kszenia skali generowanych dóbr publicznych i/lub ograni-czenia zakresu negatywnych efektów zewn�trznych.
Nale�y zaznaczy�, i� proces wyboru odpowiednich instrumentów interna-lizacji wyst�puj�cych efektów zewn�trznych jest z�o�ony i wieloetapowy. Pierwszy etap obejmuje okre�lenie skali tych efektów. Konieczne jest równie� okre�lenie, jak wielka b�dzie przysz�a skala generowanych efektów zewn�trz-nych przy utrzymaniu dotychczasowej polityki. Szacunki te nale�y zderzy� z oczekiwaniami spo�ecznymi i w przypadku gdy oka�e si�, i� niezb�dne jest ograniczenie skali wyst�puj�cych efektów negatywnych lub potrzebne jest zwi�kszenie skali efektów pozytywnych, niezb�dne jest okre�lenie kosztów pod-j�cia dzia�a s�u��cych zmianie poziomu generowanych efektów zewn�trznych. Dopiero wtedy mo�liwe jest dokonanie optymalnego wyboru instrumentów s�u-��cych tej zmianie (rys. 1). Kluczowym problemem dostosowania instrumentów internalizacji efektów zewn�trznych wydaje si� problem oszacowania skali wy-st�puj�cych efektów zewn�trznych i ich wycena. Istniej�ce metody wyceny s�

41
nadal niedoskona�e i cz�sto trudne do wdro�enia w odniesieniu do ca�o�ci go-spodarki, a ich dok�adno�� dodatkowo ogranicza asymetria informacji2.
Rysunek 1. Uproszczony schemat wyboru instrumentów internalizacji
efektów zewn�trznych
!ród�o: opracowanie w�asne na podstawie [Westhoek i in. 2012].
W ramach instrumentarium WPR dostrzega si� problem generowania przez rolnictwo pozytywnych i negatywnych efektów zewn�trznych (tab. 1). Wydaje si�, i� w nieco wi�kszym stopniu promuje si� zwi�kszanie skali produ-kowanych pozytywnych efektów zewn�trznych uto�samianych z dobrami pu-blicznymi. Cel ten próbuje si� osi�gn�� poprzez wsparcie w formie p�atno�ci rolno-�rodowiskowych za realizacj� dzia�a uznawanych za sprzyjaj�ce bioró�-norodno�ci i kondycji �rodowiska naturalnego. Te instrumenty s� szczegó�owo kszta�towane na poziomie pastw cz�onkowskich, a nawet regionów, w przy-padku pastw tworz�cych odr�bne programy rozwoju obszarów wiejskich. Jest to w�a�ciwe podej�cie, gdy� zbyt ogólne podej�cie powoduje brak efektywno�ci takich instrumentów [Westhoek i in. 2012]. W zwi�zku z tym dziwi zbyt ujed-nolicone podej�cie do tzw. zazielenienia p�atno�ci bezpo�rednich. Przyjmuj�c jednakowe kryteria dla ca�ej UE, z góry ograniczono efektywno�� tego instru-mentu. Fakt, i� pastwa cz�onkowskie maj� znaczn� swobod� w okre�laniu za- 2 Przyk�ad zastosowania metody ujawnionych preferencji w szacowaniu dóbr publicznych generowanych przez rolnictwo UE mo�na znale@� np. w pracy [Madureira i in. 2013].
Skala obecnie generowanych przez rolnictwo efektów zewn�trznych i skala efektów zewn�trznych generowanych poza rolnictwem, które wp�ywaj� na funkcjonowanie rolnictwa.
Przysz�a skala obu wy�ej wymienionych kategorii efektów zewn�trznych przy obecnie prowadzonej polityce.
Oczekiwania spo�eczne.
Koszt zmniejszenia skali generowanych negatywnych efektów/ zwi�kszenia skali wytwarzania efektów pozytywnych.
Wybór optymalnych instrumentów s�u��cych zwi�kszeniu/zmniejszeniu skali generowanych efektów zewn�trznych.

42
sad spe�nienia warunku dotycz�cego utrzymywania na u�ytkach rolnych obszaru proekologicznego, nie zmienia faktu, i� dobór jednakowych dla ca�ej UE prak-tyk rolniczych korzystnych dla klimatu i �rodowiska nie gwarantuje uzyskania optymalnych rezultatów, gdy� nie uwzgl�dnia regionalnych potrzeb poszczegól-nych pastw.
Tabela 1. WPR a internalizacja efektów zewn�trznych w rolnictwie
Instrument Efekty negatywne
Efekty pozytywne Komentarz
P�atno�ci bezpo�rednie (bez zazielenienia)
- +/- Krajobraz, bezpieczestwo �ywno�ciowe
Zazielenienie + +? Skala oddzia�ywania Wymogi wzajemnej zgodno�ci + + Efekty �rodowiskowe Dzia�ania rolno-�rodowiskowe + + Skala oddzia�ywania P�atno�ci ONW - + Krajobraz Wsparcie inwestycyjne +/- +/- Typ inwestycji Transfer wiedzy +/- +/- Ograniczenie/zwi�kszenie
skali efektów Leader i inne instrumenty niezwi�zane bezpo�rednio z rolnictwem
+ + Witalno�� obszarów wiejskich
!ród�o: opracowanie w�asne.
Nale�y równie� zwróci� uwag� na fakt, i� dotychczas ani WPR, ani inne obszary polityki UE nie uwzgl�dniaj� problemu emisji gazów cieplarnianych przez rolnictwo. Dopiero w 2016 roku w planie prac Komisji Europejskiej zna-laz�o si� stwierdzenie, i� KE przed�o�y projekt rozwi�za odnosz�cych si� do „wspólnego wysi�ku redukcyjnego dla sektorów nieobj�tych systemem handlu uprawnieniami do emisji” [Komisja Europejska 2015a]. Obecnie sektory nale-��ce w UE do najwi�kszych emitentów CO2 obj�te s� Europejskim Systemem Handlu Emisjami. Wydaje si� jednak, i� do rolnictwa trudno by�oby bezpo�red-nio przenie�� taki system ze wzgl�du na zbyt du�� liczb� ma�ych podmiotów [Wieliczko 2016].
Zapewne dalszy kierunek dzia�a w zakresie WPR dotycz�cych internali-zacji efektów zewn�trznych generowanych przez rolnictwo b�dzie wyznacza� koncepcja gospodarki o obiegu zamkni�tym (ang. circular economy). W 2015 roku KE przedstawi�a dokument pt. „Zamkni�cie obiegu – plan dzia�ania UE do-tycz�cy gospodarki o obiegu zamkni�tym” [Komisja Europejska 2015b]. Przed-stawiony w nim plan dzia�a zak�ada wzrost konkurencyjno�ci gospodarki UE dzi�ki zwi�kszeniu efektywno�ci wykorzystania surowców naturalnych i dotyczy zarówno produkcji i konsumpcji, jak i gospodarki odpadami. W dokumencie tym

43
wspomina si� równie� o rolnictwie w kontek�cie odpadów organicznych, które mog� by� wykorzystywane w rolnictwie, co umo�liwi ograniczenie konieczno�ci stosowania nawozów mineralnych. Równie� w odniesieniu do ponownego wyko-rzystywania wody zwraca si� uwag� na recykling substancji pokarmowych po-zwalaj�cy na ograniczenie stosowania nawozów mineralnych.
W koncepcji gospodarki o obiegu zamkni�tym du�o uwagi po�wi�ca si� tak�e kwestii wykorzystywania produktów ubocznych danego typu produkcji jako surowców stosowanych przez inne bran�e. Rolnictwo ma tu szerokie pole dzia�ania. Z jednej strony odchody zwierz�t w postaci gnojówki czy gnojowicy mog� by� stosowane do nawo�enia pól uprawnych, a z drugiej strony odpady sektora przemys�u rolno-spo�ywczego mog� by� u�ywane jako pasza dla zwie-rz�t – np. wys�odki czy m�óto.
Drugim wa�nym aspektem kszta�tuj�cym kierunek dzia�a WPR w od-niesieniu do efektów zewn�trznych b�dzie realizacja unijnej strategii bioró�no-rodno�ci 2020. ^redniookresowy przegl�d tej strategii dokonany w 2015 roku wskazuje na to, �e rolnicze ekosystemy nadal ulegaj� destrukcji. Wci�� 70% wyst�puj�cych w UE gatunków ro�lin i zwierz�t zagro�onych jest utrat� w�a-snego habitatu [European Commission 2015]. W raporcie tym w odniesieniu do celu dotycz�cego zwi�kszenia zaanga�owania rolnictwa i le�nictwa w utrzymanie i wzmacnianie bioró�norodno�ci stwierdzono, i� nie odnotowano znacz�cego wzrostu w okresie 2007-2012 w stosunku do okresu 2001-2006, a co za tym idzie konieczne s� intensywniejsze starania o realizacj� tego celu. KE wyra�a przekonanie, �e realizacja przyj�tych celów uda si� dzi�ki wysi�-kom pastw cz�onkowskich we wdra�aniu instrumentów WPR przewidzianych na lata 2014-2020. Nawet je�li rzeczywi�cie uda si� zrealizowa� te cele, to nie wyczerpie zada stoj�cych przed UE i jej rolnictwem w zakresie ochrony bio-ró�norodno�ci.
Podsumowanie i wnioski 3.4
Wspólna Polityka Rolna zawiera szereg instrumentów odnosz�cych si� do efektów zewn�trznych generowanych przez sektor rolny. Instrumenty te obej-muj� zarówno �rodowiskowe, jak i spo�eczne efekty zewn�trzne zwi�zane z rol-nictwem. Instrumenty WPR maj� zró�nicowany charakter (np. wymogi, wspar-cie dla rolników generuj�cych dodatkowe dobra publiczne) oraz skal� stosowa-nia w rolnictwie UE (powszechnie obowi�zuj�ce zasady wzajemnej zgodno�ci, wymogi zazielenienia obowi�zuj�ce okre�lonej wielko�ci gospodarstwa i do-browolnie stosowane instrumenty rolno-�rodowiskowe). To zró�nicowanie sto-sowanych instrumentów pozwala na zwi�kszenie skuteczno�ci realizacji celów WPR w zakresie internalizacji efektów zewn�trznych.

44
Trudno jednak oceni� ich skuteczno�� i efektywno�� z uwagi na brak pe�-nego obrazu skali i warto�ci tych efektów. Niew�tpliwie jednak nie obejmuj� one w pe�ni wszystkich generowanych przez rolnictwo efektów, a indywidualne wdra�anie dzia�a rolno-�rodowiskowych nie gwarantuje wytwarzania pozy-tywnych efektów zewn�trznych o znacz�cej skali. Dotyczy to równie� tzw. za-zielenienia p�atno�ci bezpo�rednich, które z jednej strony nie obejmuj� wszyst-kich rolników, a z drugiej strony nie gwarantuj� znacz�cego pozytywnego wp�ywu na stan �rodowiska naturalnego i zrównowa�enia produkcji rolnej.
Kwestie zwi�zane ze spo�ecznymi efektami zewn�trznymi odnosz�cymi si� do rolnictwa wydaj� si� by� szerzej uwzgl�dnione w instrumentarium WPR. Doty-czy to przede wszystkim bezpieczestwa �ywno�ci i bezpieczestwa �ywno�cio-wego oraz �ywotno�ci obszarów wiejskich. Sama skala �rodków przekazywanych na rozwój obszarów wiejskich wspiera utrzymanie ich �ywotno�ci, jednak�e efek-tywno�� tych dzia�a wydaje si� niewielka. Bezpieczestwo �ywno�ciowe jest jed-nym z kluczowych celów WPR i wydaje si�, �e jest to równie� najlepiej realizowa-ne zadanie tej polityki. Mniej skuteczna wydaje si� WPR w zapewnianiu bezpie-czestwa �ywno�ci, cho� w tym przypadku kluczowe wydaj� si� inne obszary poli-tyki, a zw�aszcza dzia�ania z zakresu zdrowia publicznego.
Wydaje si�, i� WPR b�dzie w kolejnych latach coraz powa�niej podej-mowa�a problem zarówno pozytywnych, jak i negatywnych efektów zewn�trz-nych generowanych przez rolnictwo. Wynika to z coraz bardziej widocznego wyst�powania zmian klimatycznych, które stanowi� wyzwanie zarówno dla ca-�ej gospodarki, jak i dla samego rolnictwa. Zapewne zmiany w polityce rolnej UE b�d� sz�y w kierunku w��czenia rolnictwa do budowy w UE gospodarki o obiegu zamkni�tym.
Bibliografia
1. Christiansen V., Smith S., Externality-correcting taxes and regulation, Insti-tute of Fiscal Studies, IFS Working Paper W09/16.
2. Cooper T., Hart K., Baldock D., Provision of Public Goods through Agricul-ture in the European Union, Report Prepared for DG Agriculture and Rural Development, Contract no. 30-CE-0233091/00-28, Institute for European Environmental Policy, London 2009.
3. European Commission, Report from the Commission to the European Par-liament and the Council. The Mid-Term Review of the EU Biodiversity Strategy to 2020, Brussels 2015.
4. Gupta A.K., Prakash A., On Internalization of Externalities, Indian Institute of Management Working Paper no. 1126, Ahmedabad 1993.

45
5. Komisja Europejska, Komunikat Komisji do Parlamentu Europejskiego, Ra-dy, Europejskiego Komitetu Ekonomiczno-Spo�ecznego i Komitetu Regio-nów. Program prac Komisji na 2016 r. Czas na nieprzeci�tne dzia�ania, COM(2015) 610 final, 2015a.
6. Komisja Europejska, Komunikat Komisji do Parlamentu Europejskiego, Ra-dy, Europejskiego Komitetu Ekonomiczno-Spo�ecznego i Komitetu Regio-nów. Zamkni�cie obiegu – plan dzia�ania UE dotycz�cy gospodarki o obiegu zamkni�tym, COM(2015) 614 final, 2015b.
7. Madureira L., Lima Santos J., Ferreira A., Guimarães H., Espinosa M., Gomez y Paloma S., Feasibility Study on the Valuation of Public Goods and Externalities in EU Agriculture, European Commission Joint Research Cen-tre Institute for Prospective Technological Studies, Luxembourg 2013.
8. Pizer W.A., The Optimal Choice of Climate Change Policy in the Presence of Uncertainty, „Resource and Energy Economics”, 1999, vol. 21, no. 3-4, s. 255-87.
9. Prandecki K. (red.), Gajos E., Buks J., Z bada� nad rolnictwem spo�ecznie zrównowa�onym (32). Efekty zewn�trzne i dobra wspólne w rolnictwie – identyfikacja problemu, Program Wieloletni 2015-2019, nr 7, IERiGQ-PIB, Warszawa 2015.
10. Pretty J., Brett C., Gee D., Hine R., Mason Ch., Morison J., Raymenti M., Van Der Bijl G., Dobbs T., Policy Challenges and Priorities for Internaliz-ing the Externalities of Modern Agriculture, „Journal of Environmental Planning and Management”, 44(2), s. 263-283, 2001.
11. Tisdell C., Notes on Market Failure and the Paretian (Kaldor-Hicks) Rele-vance and Irrelevance of Unfavourable Externalities, „Economics, Ecology and the Environment” Working Paper no. 89, The University of Queensland, 2003.
12. Tisdell C., Policy Choices about Agricultural Externalities and Sustainabil-ity: Diverse Approaches, Options and Issues, „Economics, Ecology and the Environment” Working Paper no. 146, The University of Queensland, 2007.
13. Westhoek H., Overmars K.P., Van Zeits H., The provision of public goods by agriculture: Critical questions for effective and efficient policy making, „Environmental Science & Policy” 2013, vol. 32, s. 5-13.
14. Wieliczko B., Czy w rolnictwie UE mo�na zastosowa� system handlu emi-sjami?, maszynopis, Warszawa 2016.

46
Ph.D., Branko Mihailovi�, Institute of Agricultural Economics, Prof. Drago Cvijanovi�, prof. Ana Langovi�-Mili�evi� Faculty of Hotel Management and Tourism
4 Environmental consulting as a factor of agricultural development in Serbia3
Introduction
In agro-business sector, the consulting represents one of the most im-portant factors of business modernization. In support of this statement we should state a confirmed fact that investments in the consulting (and agricultural re-searches) bring around 40% of an average rate of earnings, which is “much more than other investments in agricultural development” [Van den Ban and Hawkins et al. 1996]. The consulting services market research in Serbia has determined that there is significant demand for the consulting services in agro-complex, in the field of production standardization [Mihailovi� 2007]. In accordance with the companies’ needs in agro-complex of Serbia, it is useful to formulate some directives for a consultant’s selection in this field, and especially for realization of quality management system in the organic food production.
In implementation of the quality management system, some of the com-panies in agro-complex of Serbia decide to depend on their own personnel, but some of them use the external consultants’ services. Selecting consultants is very important for an organization as they should ensure that a resulting system of the quality management be capable to fulfil all goals, which the organization had planned in the best and the most efficient way. Even when we use the con-sultants' services for the quality management system, inclusion and devotion of the organization’s top management are key factors for realization of the quality management system.
This international standard was dedicated to providing instructions regard-ing the factors that should be considered, when choosing a consultant for the quality management system. This standard can be used by the organizations for the quality management system in selecting a consultant capable to fulfil their special needs, expectations and goals, while realizing the quality management
3 Paper is a part of research within the project no. III 46006 – Sustainable agriculture and rural development in the function of accomplishing strategic objectives of the Republic of Serbia in the Danube region, financed by the Ministry of Education, Science and Technological Devel-opment of the Republic of Serbia.

47
system. It could be also used by: a) consultants for the quality management sys-tem, as the instructions for consulting on the quality management system, and b) consulting organizations, for a consultant’s selection for the quality management system [Directives for a consultant’s selection for the quality management sys-tem and his services use 2005].
Ecological consulting and modern agriculture 4.1
Ecological factor gets its significance, which creates a demand for special consulting services regarding projection and installing of equipment for reduc-tion/elimination of pollution. The investments value on the global ecological market has increased from USD 379 milliard in 1995, to USD 518 milliard in 2000 [Jankovi� 2006]. At the same time, it is important to emphasize also the existence of increasing specialization of consultants for specific fields. Aiming to fulfil the organic production standards, it is necessary that consultants have new highly-specialized knowledge. The consultants’ specialization (so-called SMS – Subject Matter Specialist) means knowing well the specific fields, like socio-economic consulting, ecological consulting, as well as getting to know with new regulations and standards in the EU.
The research results [Socially responsible business in Serbia 2005] point out to underdeveloped consciousness on socially-responsible business, although some positive moves are noticeable, in sense of compatibility development with up-to-date business concepts in developed market economies. For mass applica-tion of the previous concept it is necessary to apply a triple bottom line princi-ple, which appreciates economic, social and ecological criteria [Djuri[in 2006].
The consulting organizations offer depends on needs, i.e. demand on the consulting services market [Mihailovi� 2007]. At the same time, the offer is in-fluenced also by human resources potential of the consulting organization. The most important are experience and expertise of the consultants to be used to comply with the clients requirements regarding the ecological management. The most significant support of consulting services is noticeable also in the field of ecological clusters’ formation.
In Serbia, the initiatives for clusters forming are also present in the ecolo-gy field. Companies – members of the Serbian Ecological Cluster are authorized for taking over and recycling of specific types of hazardous and non-hazardous wastes. It is important to point out that all the companies – members of the clus-ter fulfill every technical condition to operate without other members.
The experience has shown that the most chance for success have those clusters (initiatives), which have a consensus on mutual goals and activities, which have a clear frame for cooperation and are based on own initiative.

48
In Serbian economy, during the Pilot Clusterization Program, these are, at the same time, the biggest problems. Successful work of a cluster is limited by high level of the members’ distrust, lack of understanding of cluster concept, a desire for horizontal association without readiness for deeper cooperation, insisting on individual problems and fear of loosing the autonomy in business decision- -making. At the same time, absence and underdevelopment of institutional and infrastructural support largely hinder these processes in Serbian economy. The cooperation between universities, scientific-research organizations and economy sectors, is not sufficiently developed [Program for development of business in-cubators and clusters in the Republic of Serbia 2006].
Consultants for a quality management system 4.2
The standards give the production a common language. In this way com-munication is easier, and marketing more successful. The standardization helps producers to insure a product which is required and can be sold, while helps buyers to get the quality they want. Big supermarket associations introduce the quality standards, which the production has to fulfil. Those standards refer to bio-chemical characteristics, external look (mass, colour and size of fruits) and presence of harmful matters (nitrates and heavy metals, pesticides’ residuals, phyto-hormones). There are primarily EUREGAP 13 for agricultural production and HACCP in processing industry [Presna et al. 2006]. Those standards ap-peared as consumers reaction to a phenomenon of unsafe food during the live-stock diseases epidemic (mad cow disease, foot-and-mouth disease), as well as of fear from introducing the genetically modified food. The EUREGAP is the standard which covers all main aspects of production, like managing land, crops growing and gathering. It also deals with pollution issues, labour treatment and environment protection. It follows the production from sowing (analyzes origin of seeds and soil history), through growing (follows the use of herbicides, pesti-cides and fertilizers – quantity, type, quality, place and method of application), irrigation and gathering (hygiene level and a way of storing), to packing, transport and placing a product on a store shelves.
The standard HACCP represents a system which identifies, assesses and controls risks important to food safety. The risk includes biological, chemical or physical agents in food, with potential to have unfavourable impact on human health. The needs for applying HACCP are related to the following factors: in-creasing number of polluters, increasing care for health due to hygienic food contamination, increasing risk of diseases caused by chemical problems in food production, new technologies and life styles. Moreover, the world trade requires the international harmonization. The HACCP provides numerous advantages.

49
The most important are the following: providing a preventive system for food production, more effective and more efficient supervision by the government with less inspection, responsibility for food safety transfers to industry, helping food producers to be more competitive on the global market. In Serbia small and medium companies in the field of fruit processing are a stimulus for higher or-ganic production. The HACCP standard (hazard analysis of critical control points in production) in Serbia has introduced 12 companies in the field of fruits and vegetables processing (Malina Produkt, Mondi Food, Sirogojno, Hibrid, Libertas, Flora, Vuli� Vuli�, Jevremovac ABD, Zadrugar), while the firm Liber-tas from Sabac, which deals, except processing, with growing fruits and vegeta-bles, has got the first EUREGAP certificate in Serbia. However, still high per-centage of Serbian producers and processors of food have introduced the food safety standards poorly or not at all.
In accordance with the professional integrity criteria, the companies in agro-complex should consider the following moral principles, when choosing a consultant for the quality management system. The consultant should [Direc-tives for selection of a consultant for the quality management system and its ser-vices use 2005]: � avoid or report any conflict of interests, which can have an impact to a busi-
ness; � keep safety of information, got or taken from companies; � keep its independence from certification body/registration of the quality
management system or accreditation bodies; � keep impartiality during the certification/registering body by the organization; � provide a real assessment of costs for provided consulting services; � not make unnecessary dependence on its services; � not offer services if he does not have necessary competence.
Taking into consideration that in Serbia there is a great demand for con-sulting services in the field of introduction and implementation of standards in production and quality management, we have to access the necessary profes-sional competence of the consulting organization for this type of consulting pro-jects. The factors determining professional competence are to some extent modi-fied compared to previously stated determinants of a consultant’s competence. When choosing a consultant for the quality management system, the organiza-tion should evaluate if the consultant has the competence which suits to the size and specifity of the services to be provided. The competence is defined in ISO 9000, as a demonstrated ability for application of knowledge and skills. As such, it comprises: personal characteristics, education, general knowledge and skills, knowledge and skills specific for the quality management and the organization,

50
work experience, keeping and improving the competence [Directives for selec-tion of a consultant for the quality management system and its services use 2005]. The personal characteristics contribute to a success in the consultant’s activity related to the quality management system. Generally, the consultants for the quality management system should have numerous personal characteristics, which will help them during their work in a given company. The consultants for the quality management system should have adequate education, necessary for implementation of knowledge and skills in regard to the consulting services be-ing provided. Besides, the consultants for the quality management system are expected to understand and apply the relevant international standards (ISO 9000, Systems for quality management – Groundwork and dictionary; ISO 9001, Sys-tems for the quality management – Requirements; ISO 9004, Systems for the quality management – Guideline for performances’ improvement; ISO 19011, Guideline for checking the quality management system and/or a system for the environment management), as well as other relevant international standards. Al-so, the consultants must know other standards necessary for their services.
The consultants for the quality management system should have a general knowledge on: a) standardization, systems for certification and accrediting on the national and international level, b) processes and procedures for the national certification of products, systems and personnel. The consultants for the quality management system must know some appropriate principles, methodologies and procedures and be capable to apply them. The next list points out to such fields where the consultant’s experience and ability can be useful: principles of quality management; tools and techniques for permanent improvement; adequate statis-tical techniques; methodologies and techniques for checking; principles of the quality economy; team work techniques; PDCA (Plan-Do-Check-Act) method-ology; methodology of policy development; techniques of a process mapping; techniques for problems solving; techniques for tracking satisfaction of us-ers/employees; brainstorming methods. Being familiar with legal requirements and other regulations, which refer to the organization activities and the consult-ant’s workload, are important for the consulting in regard to the quality man-agement system. However, it cannot be expected from the consultants for the quality management system to have the experience in application of this knowledge before starting their services. The relevant knowledge in this field considers typical requirements from the law and other regulations for the organ-ization’s products (for example, from ISO 9001).
The companies in Serbian agro-complex agree on one thing: the consult-ing services price issue cannot be more important than professional integrity and professional competence of the consultant [Mihailovi� 2011]. On a scale of

51
1 to 5 (1 – the least important criteria of a consultant’s selection, 5 – the most important criteria of a consultant’s selection) of a consulting service price has the lowest average grade (3.8), opposite to the professional competence with the highest grade (4.66). The results of the empirical research coincide with recom-mendation of some international consultants association. For example, the Inter-national Federation of Consulting Engineers – FIDIC, suggests the clients to choose a consultant, according to his ability, not the price. A consultant, as a rule, forms a price and collects the service in accordance to a common practice in the profession, by which the consulting services’ payment is negotiated before the business starts. If the price departs (it is higher or lower) from the usual mar-ket price, than it is necessary to inform the client about the deviation reasons. The analysis of the required price often opens a question of a project task form and personnel necessary for its realization, so it should also be considered and determined at the beginning of negotiations. In that way at the start we can elim-inate unfavourable occurrences. Otherwise, such occurrences can seriously dis-rupt setting good relations between a consultant and a client. The tiniest misun-derstandings can jeopardize implementation of contracted business.
During the analysis of a consultant’s offer, before it is accepted, a compa-ny’s management/client pays special attention to its correctness, i.e. if it includes some unnecessary and unfavourable items: � Consultants suggest too expensive approach (e.g. broad data collection, using
more samples than necessary, elaboration of oversized number of alterna-tives, supply of expensive patent systems or equipment – hardware, etc.).
� Proposal of the project anticipates engagement of highly-professional and more expensive experts (more senior consultants) than necessary in that case.
� Consultants suggest their people for jobs the client can do by himself or with some training and directing [Kubr 1995].
The consulting services, connected to ecology and the environment re-quirements, are relatively new, but in the future this segment of the consulting services market will have more significance. This conclusion is based on the fact that this sector strengthens in many countries, which have joined the EU. What is sure, is that those services are interdisciplinary. The consulting organizations, whose basic activity is accounting, managerial and engineering consulting are present also in this market segment.
The manager’s task is to change production, marketing, as well as the use of products or services, or to perform the activities in accordance with scientific and technical acknowledgements, in order to prevent a serious or irreversible degrada-tion of the environment. At the same time, it is necessary to measure the effect of environmental protection, to perform regularly the environment protection check-

52
ing and assessment of adjustment with the internal requirements of a company, le-gal requirements and other regulations. In this way providing contribution to pre-serve the favourable conditions for the organic production development in Serbia.
Organic production and rural development 4.3
The organic agriculture is based on application of specific methods of the organic production. It gets its significance by bringing a man closer to nature, from which he had departed; it makes almost complete harmony with the envi-ronment preservation requirements and finally, it provides the population with food products made by natural processes, using organic and mineral matter [Kati� et al. 2008].
Accordingly, the organic production goals are the following: production of sufficient amounts of high-quality food; keeping up and increasing long-term fertility and biological activity of land by using biological and mechanical methods adjusted to local conditions; protection and keeping up biodiversity in nature and agriculture, on a farm and its vicinity, by using sustainable produc-tion systems; maintaining and preserving the genetic biodiversity by paying at-tention to genetic resources management on the farm, recognizing domestic knowledge and traditional producing system significance, their protection and application in education [Mihailovi� et al. 2007].
The Republic of Serbia has very favourable conditions for setting up this type of production. The environment is preserved, especially in mountain regions, which occupy 71.5% of central part of the Republic of Serbia, or 51.7% of the en-tire republic territory [Kati� et al. 2008]. Most of these areas have high-quality wa-ter, clean air and are remote from highways and other sources of the environment pollution. Accordingly, the organic production is realized under very high criteria and it is regulated by special decisions. These regulatory rules exist in Serbia, too, and are well coordinated with the EU legislation. In 2009 the area of collecting wild plant species from natural habitats, by the organic production method amount-ed to around 1,000,000 hectares, while arable land cultivated using the organic pro-duction methods amounted to around 1,200 hectares. The organic production is based on an essential connection between agriculture and nature, with a focus on respecting the natural balance. The organic production and supply of health-safety food creates pre-conditions for motivating export and improvement of socially-economic position of rural environment and the national economy.
The reformed policy of rural development had set up the LEADER initia-tive, as a leading approach in distribution of support and had significantly sim-plified procedures. A new policy of rural development is harmonized with the declaration of Sustainable Development Leading Principles (those principles

53
require a balance and complementarity between the economy, the environment and the society. Basic “axes” of the rural development policy in the period up to 2013 were [Bogdanov 2007]: � Measures of improvement i.e. increase of the agrarian sector competitive-
ness. It comprises: human resources (training and informing, young farmers, early retirement, using consulting services); physical capital (investments in farms, processing/marketing, agricultural infrastructure); quality of agricul-tural production and products (temporary assistance for adoption of the standards, improvement of food quality, promotion of food quality improve-ment). Within this axis, as special measures for new member-countries are anticipated the special transitional measures: support to semi-natural hus-bandries, in the process of reform (husbandries which produce for their own use and some of the production they sell); support to establishment of pro-ducers associations; support to consulting development.
� Improvement of the environment and rural environment through support to land management. Payments within this axis aim to encircle the measures linked to the environment protection and sustainable land use. These pay-ments are made within the EU struggle against the climatic changes, strug-gles for biodiversity improvement and water quality, decrease of risks from natural disasters, etc. Some of the measures comprise: mountain regions with developmental constraints, care for animals, support to non-productive in-vestments, afforestation, etc.
� Economic diversification and improvement of life quality in rural areas. A basic purpose of the third axis is to improve life conditions and to encourage population in remote rural areas to stay there, which is a challenge as these areas struggle with depopulation. In order to make rural areas a more attractive place for living, it is necessary to generate new opportunities for employment, especially for young women, as well as for improvement of physical and social infrastructure. The life quality measures comprise: organizing and infrastructure, renewal and development of village, education. The economic diversification comprises di-recting husbandries to non-agricultural activities and services, along with concur-rently strengthening of relations between agriculture and other sectors of rural economy, support for small enterprises and tourism development.
� So called “horizontal” component or the fourth axis of financing and imple-mentation of the rural development policy – LEADER approach represents a specific methodology of the rural development support realization. An idea, on which the LEADER is based, is that development plans and the local de-velopment strategies (which should be innovative, integrated and participa-tory) should be a result of the local actors’ agreement.

54
The programs of rural development support can have more significant ef-fects if they are focused on competitiveness, innovations and employment in ru-ral areas. Implementing the local strategies (LEADER approach), through stimu-lation of the local population interests by their active participation and by creat-ing the local action groups (LAG), a social capital in these areas can be signifi-cantly increased. The integrative approaches in the local development have shown useful in the previous period, especially in sense of the local capacities building and assistance to the government agencies and the Ministry of Agricul-ture, Forestry and Water Management of the Republic of Serbia. A positive im-pact is reflected, first of all, in creating the adequate measures of support and more quality assessment of the local development specific measures and their results.
Conclusion 4.4
Liberalization of domestic economy means not just the international com-petition, but also stricter business conditions. New terms of business competition imply understanding and implementation of regulations in the field of the envi-ronment protection, health care, product safety, protection of producers and ade-quacy of products. The managers in Serbia have no sufficient business experi-ence in market conditions, so they need support in knowledge, skills and intro-duction to the organic production standards. Consulting appears to be a good form of supporting our companies characterised by insufficient managerial abili-ties and skills. Consulting helps the companies to understand and accept the standards referring the organic production. Accordingly, this paper pointed out to the significance of the consulting services in the organic production affirma-tion in Serbia and identification of its development limit. The contribution of consulting to the organic production development was also analysed in the con-text of compatibility with socially-responsible business and a concept of sustain-able development in Serbia.
In Serbian companies has dominated the production orientation which has not accepted the market requirements. Domestic companies have lost a brand and the traditional markets. Coming out from the crisis requires a constitution of market-oriented companies, which implies a series of structural changes, directed to im-provement of business efficiency and adjustment to the market requirements. Devel-opment of companies in the transition conditions requires much expertise, abilities and skills in comparison with developed market economies, where great knowledge and experience are accumulated. Modern production implies modern technologies. In that sense, aiming to fulfill the EU standards, it is necessary for the consultants to have new, highly-specialized knowledge.

55
References
1. Bogdanov, N., Small rural households in Serbia and rural non-agricultural economy, UNDP, Belgrade, 2007.
2. Društveno odgovorno poslovanje u Srbiji, Stratedžik Marketing, januar-jun, Beograd, 2005.
3. Djuri[in, D., Tranzicija, stabilizacija i održivi razvoj: Perspektiva Srbije, Uvodni referat, Milo[erski ekonomski forum 2006: Evropski prioriteti i re-gionalna saradnja, Savez ekonomista Srbije, Milo[er (2006).
4. Jankovi�, D., Organizacioni modeli poljoprivrednog savetodavstva u Nema- �koj, Ekonomika poljoprivrede, Broj TB (13-667), p. 581-588 (2006).
5. Kati�, B., Cvijanovi�, D., Cicea, C., Organska proizvodnja u funkciji zaštite životne sredine u Srbiji – stanje i regulativa, Ekonomika poljoprivrede, vol. 55, br. 3, p. 267-276 (2008).
6. Kubr, M., Kako odabrati i koristiti konsultante: Vodi� za klijente, (Prevod), Ekonomski Institut, Beograd, 1995.
7. Mihailovi�, B., Uloga konsaltinga u restrukturiranju preduze�a u tranziciji, monografija, Institut za ekonomiku poljoprivrede, Beograd, 2007.
8. Mihailovi�, B., Razvoj konsultantskih usluga u Srbiji i njihov uticaj na per-formanse preduze�a u agrokompleksu, monografija, Institut za ekonomiku poljoprivrede, Beograd, 2011, p. 117-168.
9. Mihailovi�, B., Savi�, M., Kati�, B., Konsalting, održivi razvoj i organska proizvodnja: perspektiva Srbije. Industrija, br. 4, p. 81-94 (2007).
10. Presna, M.B., Brankovi�, A., Sav[i�, R., Sveže vo�e i povr�e 2006: Konku-rentnost privrede Srbije, Jefferson Institute, Beograd, 2006.
11. Program za razvoj poslovnih inkubatora i klastera u Republici Srbiji 2007- -2010, Republika Srbija, Ministarstvo privrede, Beograd, decembar, 2006.
12. Smernice za izbor konsultanata za sistem menadžmenta kvalitetom i ko-riš�enje njihovih usluga, Standard Srbije i Crne Gore, JUS ISO 10019, 2005.
13. The Tradability of Consulting Services and Its Implications for Developing Countries, UNCTAD, New York and Geneva, 2002.
14. Van den Ban A.W., Hawkins H.S., Agricultural Extension, Blackwell Sci-ence, UK, 1996.
56
Dr Wioletta Wrzaszcz Instytut Ekonomiki Rolnictwa i Gospodarki �ywno�ciowej – PIB, Warszawa
5 Ekonomika gospodarstwa rolnego a �rodowisko przyrodnicze
Wprowadzenie 5.1
Wynik ekonomiczny to niew�tpliwie g�ówny cel dzia�alno�ci gospodar-czej, w tym tak�e dzia�alno�ci rolnej. Prowadzenie dzia�alno�ci rolnej wymaga zaanga�owania ró�nych czynników produkcji, a jej efektem powinno by� odpo-wiednie ich wynagrodzenie. Ekonomika gospodarstwa rolnego sprowadza si� do stosowania metod umo�liwiaj�cych podejmowanie decyzji, które zapewniaj� najkorzystniejsze efekty w danych warunkach gospodarowania. Podstaw� ra-chunku ekonomicznego jest zasada racjonalnego gospodarowania, wed�ug której nale�y d��y� do maksymalnego efektu b�d@ minimalnego nak�adu. W przypad-ku tego pierwszego wariantu post�powanie producenta rolnego prowadzi do uzyskania najwi�kszego efektu z danych nak�adów, w drugim za� dany efekt jest zapewniany przy jak najmniejszym zu�yciu nak�adów. Niezale�nie od wariantu dzia�anie podmiotu gospodarczego zgodnie z zasad� racjonalno�ci prowadzi do tzw. rozwi�za optymalnych – zapewniaj�cych maksymalizacj� przyj�tego celu. W uj�ciu klasycznym producent rolny, kieruj�c si� wy��cznie ekonomicznymi przes�ankami, realizuje cel ekonomiczny, jednocze�nie pomijaj�c spo�eczne i �rodowiskowe koszty zewn�trzne produkcji rolnej. Cho� koszty te powstaj�, to nie maj� bezpo�redniego prze�o�enia na rachunek ekonomiczny producenta rol-nego, lecz ponoszone s� przez jego otoczenie. Klasyczny rachunek ekonomicz-ny polega na zestawieniu tylko tych kosztów i efektów, które podlegaj� wycenie rynkowej.
Poza kwestiami ekonomicznymi dotycz�cymi prowadzenia dzia�alno�ci rolnej coraz wi�kszego znaczenia nabiera jako�� i rodzaj praktyk rolniczych w kontek�cie ich wp�ywu na �rodowisko przyrodnicze. Potrzeb� poszanowania stanu �rodowiska przyrodniczego i praw przyrody przy prowadzeniu dzia�alno-�ci gospodarczej uzasadnia nasze zobowi�zanie mi�dzypokoleniowe – koniecz-no�ci zachowania zasobów przyrodniczych dla kolejnych pokole, co jednocze-�nie powinno wpisywa� si� w etyk� zawodow� producenta rolnego. Uwzgl�d-nienie �rodowiska przyrodniczego w dzia�alno�ci rolnej to warunek konieczny jej kontynuacji. Odpowiedni stan �rodowiska przyrodniczego to elementarna podstawa dzia�alno�ci rolniczej, bez której jej prowadzenie nie by�oby mo�liwe.

57
Cho� stwierdzenie to wydaje si� bezdyskusyjne, w praktyce gospodarczej ilo�� i jako�� wody oraz gleby, a tak�e stan bioró�norodno�ci ekosystemu zazwyczaj nie s� brane pod uwag�. Ze wzgl�du na przesuni�cie w czasie �rodowiskowych skutków bie��cych decyzji produkcyjnych, cz�sto w procesie podejmowania decyzji gospodarczych pomijana jest kwestia zasobów przyrody – ich ilo�ci i jako�ci, oraz znaczenia w kszta�towaniu przysz�ych wyników produkcyjno-ekonomicznych gospodarstwa rolnego.
Wychodz�c naprzeciw z�o�onym wyzwaniom, jakim musz� sprosta� pro-ducenci rolni, zarówno �rodowisko naukowe, jak i instytucje rz�dowe i pozarz�-dowe eksponuj� argumenty przemawiaj�ce za potrzeb� wielofunkcyjnego i zrównowa�onego rozwoju rolnictwa. W celu zwi�kszenia �wiadomo�ci rolni-ków oraz zach�cenia ich do wieloaspektowego podej�cia do dzia�alno�ci rolnej szczególnego znaczenia nabiera ekspozycja konkretnych technik i technologii produkcji, które u�atwi�yby realizacj� ró�nych celów gospodarstwa rolnego.
Celem artyku�u jest przedstawienie relacji mi�dzy celami ekonomicznymi i �rodowiskowymi gospodarstw rolnych oraz czynników je kszta�tuj�cych. Pod uwag� wzi�to ró�ne zwi�zki mi�dzy celami gospodarstwa rolnego, zarówno te o charakterze komplementarnym, jak i konkurencyjnym. Skupiono si� zarówno na czynnikach endo-, jak i egzogenicznych, które wp�ywaj� na zbie�n� oraz rozbie�n� realizacj� badanych celów jednostki gospodarczej. Artyku� obejmuje ró�ne podej�cia do bada oraz g�ówne konkluzje z tego zakresu.
Funkcje rolnictwa a cele gospodarstwa rolnego 5.2
Wielofunkcyjno�� rolnictwa to zagadnienie spo�eczno-ekonomiczne, któ-re stosunkowo niedawno sta�o si� przedmiotem bada ekonomicznych. Pod tym poj�ciem kryje si� zjawisko polegaj�ce na tym, �e poza podstawow� funkcj� rolnictwa, jak� jest wytwarzanie produktów (surowców) �ywno�ciowych, wy-twarza ono tak�e dobra i us�ugi maj�ce znaczenie dla otoczenia gospodarstwa rolnego. Innymi s�owy, w rolnictwie wyst�puje zjawisko nierozdzielno�ci funk-cji rynkowych i nierynkowych. Efektem dzia�alno�ci rolnej jest wi�c wi�zka funkcji, z których cz��� przejawia si� na rynku (podlegaj� one wycenie rynko-wej), inne za�, mimo swego znaczenia dla spo�eczestwa, nie s� przedmiotem takich transakcji. Brak wyceny rynkowej cz��ci funkcji4 jakie pe�ni rolnictwo powoduje, �e nie tylko ich odbiorcy, lecz tak�e dostarczyciele – rolnicy – nie dostrzegaj� wytwarzanych dóbr i us�ug pozaprodukcyjnych. To stanowi podsta-w� ideowo-polityczn� i merytoryczn� – uzasadnienie celowego publicznego wsparcia pozakomercyjnych funkcji rolnictwa [Wilkin 2010].
4 Klasyfikacj� funkcji rolnictwa przedstawia Huylenbroeck et al. [2007].

58
Wspó�cze�nie wielofunkcyjno�� rolnictwa nabra�a szczególnego znacze-nia za spraw� dwóch okoliczno�ci, a mianowicie zagro�enia dostarczania dóbr publicznych na skutek nadmiernej industrializacji rolnictwa, a tak�e rosn�cej �wiadomo�ci spo�eczestwa w zakresie znaczenia tych dóbr [Zegar 2012; Zhang et al. 2007]. To uzasadnia potrzeb� wype�niania nie tylko funkcji produkcyjno-ekonomicznych – zwi�zanych z wytwarzaniem dóbr �ywno�ciowych, lecz tak�e funkcji kulturowych, spo�ecznych i �rodowiskowych5. Z racji pe�nionych ró�-nych funkcji przez rolnictwo, jego wielofunkcyjno�� jest atrybutem zrównowa-�onego rozwoju [Czudec 2009; Wilkin 2010; Wilkin 2011].
Wielofunkcyjno�� nale�y analizowa� na ró�nych poziomach, gdzie jed-nym z nich jest poziom gospodarstwa rolnego. Funkcje rolnictwa przek�adaj� si� na konkretne cele poszczególnych gospodarstw rolnych. Za�o�one cele s� czyn-nikiem porz�dkuj�cym cz�stkowe dzia�ania ludzi, s� one punktem wyj�cia ra-cjonalnego cyklu czynno�ci zarz�dczych, a finalnie p�aszczyzn� odniesienia dla uzyskanych rezultatów [Kulawik 1995]. Cele gospodarstwa rolnego najogólniej mo�na podzieli� na produkcyjne, akumulacyjne, ekonomiczne czy te� �rodowi-skowe6, które maj� wymiar zarówno mikro-, jak i makroekonomiczny. Dla pro-ducenta rolnego jako jednostki gospodarczej priorytetowe s� cele ekonomiczne, czyli dochód z prowadzonej dzia�alno�ci – co znajduje gruntowne uzasadnienie mikroekonomiczne – natomiast w dalszej kolejno�ci i w ró�nym zakresie reali-zowane s� cele o szczególnym znaczeniu makroekonomicznym, dotycz�ce do-starczania us�ug dla spo�eczno�ci i �rodowiska. Istotn� rol� odgrywa tu hierar-chizacja celów oraz ich realizacja w czasie [Zi�tara 1987]. Wa�n� kwesti� staje si� pewna proporcja w zakresie wype�niania ró�nych celów wpisuj�cych si� w tradycyjne (rynkowe) rozumienie jednostki gospodarczej oraz tych, które do-tychczas nie znalaz�y odniesienia w mechanizmach rynkowych. Z pewno�ci� do tej drugiej kategorii kwalifikuj� si� cele �rodowiskowe. Cele pozaekonomiczne, które odzwierciedlaj� relacje rolnika z otoczeniem, najcz��ciej s� trudne do po-miaru ilo�ciowego [Kulawik 1995].
W zwi�zku z cz�stym pomijaniem znaczenia wp�ywu produkcji rolnej na stan �rodowiska przyrodniczego istotna jest ekspozycja argumentów przemawia-j�cych za maksymalizacj� us�ug �wiadczonych przez rolnictwo na rzecz �rodo-wiska oraz minimalizacj� �rodowiskowych kosztów zewn�trznych generowa-nych przez t� dzia�alno�� gospodarcz�. Wskazujemy trzy g�ówne argumenty.
Po pierwsze, �rodowisko przyrodnicze jest niezast�pionym czynnikiem produkcji. Klasyczna klasyfikacja czynników produkcji rolnej obejmuje triad�, 5 Sobiecki [2007] wyodr�bnia tak�e funkcj� przechowywania zasobów si�y roboczej, kultu-rowo-cywilizacyjn�, osadniczo-wiejsk� oraz turystyczn�, por. [Wilkin 2009]. 6 Przegl�d klasyfikacji celów gospodarstwa rolnego przedstawia Sielska [2012].

59
w sk�ad której wchodzi ziemia, praca i kapita�. Mimo i� �rodowisko przyrodnicze bezpo�rednio nie jest tu wymieniane, to na pierwszym miejscu wskazywana jest ziemia – jeden z g�ównych komponentów �rodowiska przyrodniczego. Znaczenie ziemi w produkcji rolnej jest nie do przecenienia i nie do podwa�enia. Podstawo-wa klasyfikacja nie wyró�nia tak�e bioró�norodno�ci, która warunkuje chocia�by podstawowe procesy glebowe, a dalej jej �yzno�� i produkcyjno��. Trudno dopa-trze� si� w klasycznej klasyfikacji uj�cia chocia�by wody, czy te� powietrza, acz-kolwiek bez tych komponentów �rodowiska dzia�alno�� rolnicza nie ma racji by-tu. Pozostaje wi�c tu miejsce do zasadnego uzupe�nienia klasycznej teorii ekono-miki rolnictwa b�d@ rozwa�ania czynników produkcji rolnej na gruncie innych nurtów ekonomicznych uwypuklaj�cych znaczenie �rodowiska przyrodniczego. Odno�nie trzeciego elementu sk�adowego przedstawionej triady czynników pro-dukcji – kapita�u – je�li rozwa�ymy jego warto�� nie tylko w uj�ciu materialnym, lecz tak�e pozamaterialnym, wyszczególniaj�c kapita� naturalny, warto�� �rodo-wiska przyrodniczego tak�e mo�e by� uj�ta w ramach klasycznej klasyfikacji.
W zwi�zku z tym, �e �rodowisko przyrodnicze warunkuje mo�liwo�� prowadzenia produkcji rolnej, naruszenie jego równowagi oraz naturalnych procesów ekosystemowych wywo�uje dotkliwe skutki przyrodnicze, a nast�pnie produkcyjno-ekonomiczne dla rolnika, a w dalszej kolejno�ci produkcyjno- -ekonomiczne dla ogó�u spo�eczestwa. Istotn� rol� odgrywa tu czynnik czasu (relacja przyczyna/czynnik – efekt), a tak�e wiedza i ludzka wyobra@nia.
Po drugie, �rodowisko przyrodnicze jest dobrem wspólnym, a jednocze�nie dobrem publicznym7. ^rodowisko przyrodnicze jest dobrem wspólnym, gdy� ma wielu u�ytkowników, w tym rolników, turystów, mieszkaców. ^rodowisko przy-rodnicze jest u�ytkowane przez obecne pokolenia, powinno by� tak�e u�ytkowane przez przysz�e pokolenia. W tym uj�ciu konsumpcja dobra przez jednego u�ytkow-nika mo�e pozbawi� innych mo�liwo�ci konsumpcji tego samego dobra, a zatem mog� wyst�pi� konsekwencje konsumowania konkretnego dobra przez jednego u�ytkownika, kosztem kolejnego odbiorcy (np. problem jako�ci wody). Z drugiej strony, �rodowisko przyrodnicze jest dobrem publicznym, które charakteryzuje si� brakiem mo�liwo�ci wy��czenia tego dobra z konsumpcji (nie mo�e zapobiec u�y-waniu dobra przez innych), a konsumpcja dobra przez jedn� osob� nie pozbawia in-nych osób mo�liwo�ci konsumpcji tego samego dobra. Przyk�adowo dotyczy to bio-ró�norodno�ci oraz krajobrazu. Z za�o�enia �rodowisko przyrodnicze to dobro do-st�pne oraz przeznaczone dla wszystkich, jednak w praktyce – na skutek nieprzemy-�lanego u�ytkowania – wiele jego komponentów traci ten charakter. Skutki konkret- 7 Zob. [Samuelson 1954; Holcombe 1997; Jakubowski 2012], a tak�e publikacje podkre�laj�-ce znaczenie rolnictwa w kontek�cie dostarczania dóbr publicznych i dóbr wspólnych [Pran-decki et al. 2015; Ma�a�ewska 2015; Maciejczak 2009; Baum 2011].
60
nego sposobu konsumpcji danego dobra determinuj� zmian� rodzaju tego dobra – w tym przypadku �rodowiska przyrodniczego.
Po trzecie, prowadzenie dzia�alno�ci rolnej wymaga zaanga�owania pod-stawowego komponentu �rodowiska przyrodniczego i przestrzeni fizycznej, ja-kim jest ziemia8. To specyficzny rodzaj dobra, gdy� ziemia jest przyk�adem do-bra prywatnego i publicznego. Wi�kszo�� zasobów ziemi rolnej jest w dyspozy-cji rolników indywidualnych i stanowi ich w�asno�� prywatn�. W�asno�� ta jest podstawowym prawem rzeczowym, które pozwala w�a�cicielowi korzysta� z rzeczy i rozporz�dza� ni� z wy��czeniem innych osób. Jednak w przypadku ziemi kwestia jest bardziej z�o�ona, gdy� nie jest ona wy��cznie dobrem prywat-nym, lecz istotnym zasobem przyrody, w uj�ciu globalnym wspólnie u�ytkowa-nym przez ró�ne podmioty i formy �ycia. Ograniczono�� tego zasobu uwypukla potrzeb� jej nale�ytej ochrony.
Ziemia nie jest jedynie czynnikiem produkcji, podstaw� przestrzenn� dzia�alno�ci gospodarczej [Czy�ewski i Henisz 2001], sk�adnikiem maj�tku trwa�ego w uj�ciu bilansowym czy dobrem prywatnym w uj�ciu rodzajowym, lecz miejscem naturalnych procesów produkcyjno-�rodowiskowych, warto�ci� kulturow� i symboliczn� [B��d 2010]. Wed�ug Schumachera ziemia jest naj-wi�kszym bogactwem cz�owieka. Cz�owiek jest dzieckiem przyrody i powinien respektowa� jej prawa, gdy� jest on zarazem producentem, jak i konsumentem [Wilkin 2010 za Schumacher 1981]. Warto�� u�ytkowa ziemi zmienia si� pod wp�ywem zabiegów agrotechnicznych, a jako�� tych zabiegów wp�ywa na �y-wotno�� mikroorganizmów, które dalej determinuj� urodzajno�� gleby [Singh et al. 2011]. Ziemia nie znosi lenistwa, niechlujstwa i nieuczciwego do niej sto-sunku. To rolnik kszta�tuje �ywe organizmy, za� one – p�odno�� plonów rolnych [Manteuffel 1987]. Ziemia powinna by� odpowiednio traktowana w procesie produkcji rolnej poprzez praktyki rolne zapewniaj�ce zachowanie wysokiej jej jako�ci, a tak�e w�a�ciw� agrotechnik� chroni�c� zdolno�ci produkcyjne, regulu-j�c� stosunki wodne, zabezpieczaj�c� ziemi� antyerozyjnie, itp. Takie praktyki umo�liwiaj� utrzymanie krajowych zasobów naturalnych i krajowego potencja�u produkcyjnego ziemi [Tomczak 2006]. Skutkiem poprawnego gospodarowania ziemi� s� rozleg�e korzy�ci zewn�trzne, chocia�by takie, jak ochrona bioró�no-rodno�ci oraz stabilizacja klimatu.
Mechanizm rynku a model gospodarstwa rolnego 5.3
Otoczenie gospodarstwa rolnego ma znacz�cy wp�yw na sposób zarz�-dzania nim. Gospodarstwo rolne, jako podmiot gospodarczy i uczestnik mecha-nizmu rynkowego, dostosowuje si� do zasad w nim obowi�zuj�cych, czerpi�c 8 Wieloaspektow� analiz� czynnika ziemi przedstawia Majchrzak [2014].

61
z tego tytu�u okre�lone korzy�ci ekonomiczne, jak równie� ponosz�c bezpo�red-nie i po�rednie skutki funkcjonowania w warunkach rynkowych.
Rynek jest doskona�ym narz�dziem stymulowania efektywno�ci mikroek-onomicznej, pos�uguj�c si� mechanizmem konkurencji oraz motywem podmio-tów gospodarczych, jakim jest maksymalizacja korzy�ci. Je�li spojrzymy na ry-nek z punktu widzenia efektywno�ci spo�ecznej (makroekonomicznej) oraz uwzgl�dniaj�c czynnik czasu przy ocenie jego funkcjonowania, to doskona�o�� rynku zostaje podwa�ona [Zegar 2007]. Rynek nie jest w stanie dostarczy� nie-zb�dnych ilo�ci dóbr publicznych oraz nie mo�e upora� si� z kosztami ze-wn�trznymi, co jest traktowane jako przejaw jego u�omno�ci (ang. market failu-re) [Bekle et al. 2013]9.
Mechanizm rynku stymuluje industrialny kierunek rozwoju gospodarstw, czyli podporz�dkowanie jego organizacji, technik i technologii produkcji oraz ekonomiki wy��cznie zasadom tradycyjnie rozumianej konkurencji rynkowej. W�ród cech tego modelu mo�na wymieni� niekwestionowany wzrost poziomu produkcji rolnej, a tak�e wydajno�ci pracy i intensywno�ci gospodarowania za-sobami produkcyjnymi w rolnictwie [Zegar 2012]. By�a to zas�uga zwi�kszone-go zu�ycia �rodków produkcji pochodzenia przemys�owego oraz zaanga�owania zasobów �rodowiska przyrodniczego, a tak�e wdro�enia post�pu genetycznego i organizacyjnego. W efekcie poda� przekracza�a potrzeby rynkowe, a sytuacja ekonomiczna rolników nie uleg�a poprawie (szybki wzrost produkcji wywo�a� spadek cen, a tym samym obni�enie realnych dochodów rolników). Rolnicy, by zwi�kszy� swe dochody, musieli produkowa� i sprzedawa� coraz wi�cej, na czym polega�a podstawowa sprzeczno�� rolnictwa industrialnego [Wo� i Zegar 2002; Wo� i Zegar 2004; Wo� 2004]. Nasilenie intensywno�ci gospodarowania w celu maksymalizacji korzy�ci ekonomicznych ci�gn��o za sob� coraz wi�ksze zaanga�owanie zasobów naturalnych i pojawienie si� skutków spo�ecznych (an-tyfunkcje spo�eczne i �rodowiskowe) [Runowski 2007].
Gospodarstwo rolne, realizuj�c w takich warunkach cele ekonomiczne, zwi�zane z ci�g�ym d��eniem do podniesienia efektywno�ci ekonomicznej, wytwa-rza efekty zewn�trzne o charakterze spo�ecznym i �rodowiskowym – tak dodatnie, jak i ujemne. Uroda rynku jednak powoduje, �e ujemne efekty wytwarzane s� w nadmiarze, za� dodatnie w niedoborze. Kryterium efektywno�ci mikroekono-micznej doprowadza do nadeksploatacji wi�kszo�ci dóbr �rodowiskowych i naru-sza równowag� globaln�. Mimo oczywistych efektów produkcyjnych rolnictwa industrialnego powstaje szereg problemów spo�ecznych i gospodarczych (zwi�za-nych tak�e z obni�eniem walorów od�ywczych produktów �ywno�ciowych), jak 9 Barier� w stosowaniu rynkowych metod w rozwi�zywaniu negatywnych efektów zewn�trz-nych jest cz�sto ich wysoki koszt transakcyjny [Wilkin 2010].

62
równie� �rodowiskowych. Z czasem post�puje degradacja gleby, zanieczyszczenie wody, a tak�e jej niedostatek dla potrzeb komunalnych oraz rolnictwa, zmniejsze-nie bioró�norodno�ci, czyli uszczuplenie nieodnawialnych zasobów przyrody, zu-bo�enie struktury krajobrazowej, zanieczyszczenie atmosfery wraz z post�puj�cymi zmianami klimatycznymi oraz obni�enie jako�ci produktów �ywno�ciowych. Cho� koszty zewn�trzne s� generowane i przewa�aj� nad korzy�ciami zewn�trznymi, to nie podlegaj� wycenie rynkowej oraz pomijane s� w rachunku produkcyjno-ekonomicznym producenta rolnego. Gospodarstwo rolne eksternalizuje efekty ze-wn�trzne – obci��a �rodowisko przyrodnicze oraz kolejne pokolenia.
Alternatyw� dla rolnictwa industrialnego jest model rolnictwa zrównowa-�onego. Rozwój spo�eczno-gospodarczy nie mo�e ogranicza� si� jedynie do maksymalizacji wzrostu gospodarczego w danym czasie, lecz powinien obej-mowa� �rodowisko, cz�owieka i gospodark� w d�ugim procesie rozwoju [Zegar 2007]. Chocia� koncepcja ta brzmi przekonuj�co, trudno�ci pojawiaj� si� na etapie jej upowszechniania i wdra�ania [Kronenberg (ed.) i Bergier (ed.) 2010]. A. Wo� oraz J.S. Zegar podkre�laj�, �e urzeczywistnienie idei rolnictwa spo-�ecznie zrównowa�onego wymaga silnego pastwa [Wo� i Zegar 2002]. Ze wzgl�du na niedostatki zwi�zane z funkcjonowaniem rynku [Kroeger i Casey 2007] w gestii pastwa pozostaje znacz�ca rola w propagowaniu zasad zrówno-wa�onego rozwoju, obejmuj�ca tak�e wynagradzanie producentów rolnych za wytwarzanie dóbr i us�ug o charakterze publicznym, istotnych dla �rodowiska przyrodniczego, a tak�e spo�eczestwa10. Ta kwestia jest wa�nym i aktualnym sk�adnikiem filozofii i legitymizacji wspierania rolnictwa [Wilkin 2010].
Istot� rolnictwa zrównowa�onego jest takie dzia�anie jednostek, które nie zagra�a d�ugookresowym interesom spo�eczno�ci [Wo� 2003]. Gospodarstwo rolne funkcjonuj�ce zgodnie z zasadami zrównowa�onego rozwoju wymaga holistycz-nego podej�cia do organizacji produkcji rolnej11, gdy� poza realizacj� celów eko-nomicznych, dzia�alno�ci rolnej przy�wiecaj� cele spo�eczne i �rodowiskowe. Po-godzenie tych celów nie jest jednak zadaniem �atwym, nie tylko ze wzgl�du na ko-nieczno�� poprawnej organizacji gospodarstwa rolnego w kontek�cie poszczegól-nych celów, ale przede wszystkim ze wzgl�du na coraz silniejsze uwarunkowania zewn�trzne (post�puj�cy proces globalizacji i zwi�zane z nim procesy rynkowe). Przy obecnych, zmiennych i trudnych warunkach – tak�e globalnych – raz osi�-gni�ta równowaga nie jest constans, st�d konieczne staje si� sta�e d��enie do rów- 10 Tak�e w odniesieniu do aktywno�ci instytucji pastwa wskazywane s� ich niedoskona�o�ci, zob. np. [Kronenberg (ed.) i Bergier (ed.) 2010]. 11 Holistyczne podej�cie do organizacji gospodarstwa nie jest wytworem bada ostatnich lat, lecz gruntowne jego podstawy znajdujemy m.in. w szkole organicznej [Zi�tara 2000 za Aereboe 1923; Brinkmann 1922; Manteuffel 1984; Steffen i Born 1994; Baum 2007]. Znaczenie podej�cia sys-temowego w zrównowa�onym rozwoju podkre�laj� Kronenberg i Bergier [2010].

63
nowagi – wewn�trz gospodarstwa i w relacji z otoczeniem. W tym kontek�cie szczególnego znaczenia nabiera identyfikacja tych czynników, na które rolnik ma wp�yw – czyli konkretnych metod, sposobów, technik i systemów produkcji rolnej u�atwiaj�cych komplementarn� realizacj� ró�nych celów gospodarstwa rolnego. Z�o�ono�� praktyk rolniczych wpisuj�cych si� w model gospodarstwa zrównowa-�onego stanowi tak�e istotn� przyczyn� cz�stego niezrozumienia samej idei tego kierunku rozwoju, a dalej trudno�ci z jego implementacj�.
Relacje mi�dzy celami gospodarstwa rolnego 5.4
Jednym z zada zarz�dzaj�cego gospodarstwem jest wypracowanie me-chanizmów koordynacji w zakresie wype�niania ró�nych celów gospodarstwa rolnego [Kulawik 1995; Zi�tara 1987]. Zadanie to jest jednak skomplikowane, gdy� mi�dzy poszczególnymi celami jednostki gospodarczej mog� wyst�powa� ró�nego rodzaju relacje o charakterze bardziej b�d@ mniej z�o�onym. W. Kern wyró�ni� pi�� rodzajów tych zwi�zków mi�dzy celami jednostki gospodarczej [Zi�tara 1987 za Kern 1972]12, a mianowicie: � zgodno�ci – gdy realizacja jednego celu powoduje identyczn� zmian� w tym
samym kierunku w przypadku innego celu; � komplementarno�ci – gdy realizacja jednego celu powoduje wi�ksz� lub
mniejsz� zmian� w tym samym kierunku w przypadku innego celu; � neutralno�ci – gdy zmiany w zakresie realizacji jednego celu nie powoduj�
zmian innych celów; � konkurencyjno�ci – gdy realizacja jednego celu powoduje zmian� o odmien-
nym kierunku w przypadku drugiego celu; � wykluczenia wzajemnego – gdy realizacja jednego celu powoduje automa-
tyczne wykluczenie realizacji innego celu. W gospodarstwie rolnym relacje mi�dzy celami �rodowiskowymi i eko-
nomicznymi najcz��ciej maj� charakter konkurencyjny b�d@ komplementarny13. Zwi�zek o charakterze zgodno�ci oraz neutralno�ci raczej nale�y do rzadko�ci. Natomiast relacje okre�lane jako „wykluczenie wzajemne” wskazuj� na mo�li-wo�� realizacji wy��cznie jednego celu.
Rolnicy od wieków wykorzystuj� dobra i procesy zachodz�ce w przyrodzie, by osi�gn�� wyznaczone cele produkcyjno-ekonomiczne. W zale�no�ci od szeregu czynników wewn�trznych i zewn�trznych cele jednostki gospodarczej mog� mie� charakter konkurencyjny lub te� komplementarny. Przy okre�leniu relacji mi�dzy celami gospodarstwa rolnego szczególnego znaczenia nabiera precyzyjne okre�lenie, kiedy ma miejsce konkurencyjny zwi�zek mi�dzy celami �rodowiskowymi i ekono- 12 Por. [Sauer i Wossink 2013]. 13 Zob. [Bekle et al. 2013; Wossink 2007].

64
micznymi gospodarstwa rolnego. Przede wszystkim o sprzeczno�ci celów gospodar-stwa mówimy wtedy, gdy produkcja rolna i zwi�zane z ni� korzy�ci ekonomiczne s� osi�gane kosztem uszczuplenia zasobów �rodowiska i naruszenia naturalnych proce-sów ekosystemowych [Zegar 2013; Zegar 2014], co w d�u�szej perspektywie powo-duje tak�e wymierne skutki dla producenta rolnego.
Nawi�zuj�c do powy�szego, istotn� kwesti� staje si� wybór odpowiedniej metody badawczej pozwalaj�cej na okre�lenie kierunku wp�ywu produkcji rol-nej na �rodowisko przyrodnicze. By okre�li� relacje mi�dzy celami gospodar-stwa rolnego, konieczne jest wieloetapowe rozwa�enie kilku istotnych kwestii, które b�d� mia�y decyduj�cy wp�yw na uzyskane wyniki, a dalej na ich interpre-tacj�. Do tych zagadnie kwalifikuj� si� nast�puj�ce dylematy: � Uwzgl�dnienie czynnika czasu, czyli rachunek statyczny a dynamiczny.
W tym pierwszym przypadku ma miejsce analiza stanu w konkretnym mo-mencie, w drugim za� jest to analiza zmian w czasie. W zwi�zku z wieloma trudno�ciami dotycz�cymi odpowiedniej jako�ci i ilo�ci danych, cz��ciej wy-bierany jest ten pierwszy rodzaj rachunku. W przypadku bada dotycz�cych wp�ywu dzia�alno�ci gospodarczej na stan �rodowiska przyrodniczego szer-sze uzasadnienie merytoryczne znajduje rachunek dynamiczny, ze wzgl�du na przesuni�cie w czasie skutków �rodowiskowych bie��cej produkcji rolnej.
� Z�o�ono�� prowadzonych bada, czyli rachunek uproszczony a z�o�ony. Ze wzgl�du na z�o�ono�� zagadnie zwi�zanych z poszczególnymi komponen-tami �rodowiska przyrodniczego, a tak�e ró�nym zakresem i kierunkiem od-dzia�ywania produkcji rolnej na nie, wielow�tkowe podej�cie umo�liwia kompleksow� analiz�.
� Podej�cie do zdefiniowania relacji: Nak�ad/Efekt. Zarówno po stronie nak�a-dów, jak i efektów powinny znale@� si� nie tylko elementy powszechnie uwzgl�dniane w rachunkach ekonomicznych, lecz tak�e te dotycz�ce warto-�ci ró�nych elementów �rodowiska przyrodniczego.
� Zakres wyceny efektów zewn�trznych. Wycena efektów zewn�trznych, za-równo kosztów, jak korzy�ci stanowi nie lada wyzwanie. Mimo szeregu w�t-pliwo�ci, jakie nasuwaj� si� w tym temacie, narasta potrzeba podejmowania takich prac. Istotn� spraw� jest uwzgl�dnienie w rachunku zarówno kosztów, jak i korzy�ci, a tak�e wyeksponowanie metodologii bada.
� Eksternalizacja a internalizacja efektów zewn�trznych. Dotychczas warto�� efektów zewn�trznych nie by�a uwzgl�dniana w rachunku ekonomicznym producenta rolnego – innymi s�owy – warto�� generowanych kosztów i ko-rzy�ci ekonomicznych by�a pomijana. Coraz trudniej b�dzie znale@� uzasad-nienie dla takiego podej�cia. Mimo wielu trudno�ci metodologicznych zwi�-zanych z internalizacj� efektów zewn�trznych potrzeba zmierzenia si� z nimi

65
b�dzie narasta�. W��czenie warto�ci efektów zewn�trznych w rachunek pro-ducenta rolnego staje si� konieczno�ci�.
Zarysowane problemy metodologiczne zwi�zane z prawid�owym okre�le-niem relacji mi�dzy celami �rodowiskowymi i ekonomicznymi wymagaj� roz-wi�zania dwóch zasadniczych kwestii, a mianowicie: � Opracowania w�a�ciwego aparatu metodologicznego, który obejmowa�by
klasyfikacj� efektów zewn�trznych zwi�zanych z prowadzon� produkcj� rol-n�, ich wycen�, a tym samym stwarza� mo�liwo�� ich internalizacji.
� Okre�lenia skali zaanga�owania pastwa, czego uzasadnieniem jest rozmijanie si� w czasie bie��cych praktyk rolniczych oraz ich efektów zewn�trznych, a tak�e niedoskona�o�� rynku w tym zakresie. Odpowiednia polityka pastwa, okre�laj�ca warunki brzegowe produkcji rolnej, u�atwia godzenie celów gospo-darstwa, chocia�by poprzez system norm, dop�at, czy te� op�at i podatków.
Charakter relacji mi�dzy celami �rodowiskowymi a ekonomicznymi gospo-darstwa rolnego – ich konkurencyjno�� czy te� komplementarno�� – zale�y od wielu ró�nych czynników14. W celu okre�lenia zwi�zków mi�dzy nimi konieczne jest uwzgl�dnienie zarówno indywidualnych umiej�tno�ci rolnika, jak i organizacji go-spodarstwa rolnego, warunków lokalnych prowadzonej dzia�alno�ci rolnej oraz uwa-runkowa zewn�trznych. Wymienione kwestie wskazuj� na z�o�ono�� podj�tego problemu badawczego. W zale�no�ci od podej�cia do bada (metody badawczej), relacje mi�dzy rozwa�anymi celami gospodarstwa rolnego mog� mie� odmienny charakter. Istota rzeczy sprowadza si� tak�e do okre�lenia determinant komplemen-tarnej i konkurencyjnej realizacji celów gospodarstwa rolnego.
Prowadzone badania, m.in. w ramach Programu Wieloletniego, wskaza�y, �e szereg czynników zwi�zanych bezpo�rednio z gospodarstwem rolnym, jego zarz�dc�, a tak�e otoczeniem mo�e u�atwi� jednoczesn� realizacj� ró�nych ce-lów gospodarstwa rolnego (tab. 1). Pozytywne przyk�ady przeobra�e w pol-skim rolnictwie, które sprzyjaj� komplementarnej realizacji celów gospodar-stwa, to: poprawa wykszta�cenia, poziomu wiedzy i �wiadomo�ci ekologicznej rolników, podejmowanie przez nich praktyk zwi�zanych z popraw� stanu gleby, a tak�e ch�� wspó�pracy z doradcami oraz udzia� w programach rz�dowych (przy jednoczesnym podj�ciu zobowi�za agro�rodowiskowych).
Znacz�cy wp�yw na zakres wiedzy i �wiadomo�ci producentów maj� or-gany doradztwa rolniczego, których wykwalifikowana kadra z jednej strony pe�-ni us�ugi informacyjne zwi�zane z bie��cym funkcjonowaniem oraz mo�liwo-�ci� wsparcia finansowego gospodarstwa, z drugiej za� poszerza wiedz� zarz�-dzaj�cych z zakresu praktyk rolno�rodowiskowych. 14 Zestawienie czynników kszta�tuj�cych ró�nego rodzaje relacji mi�dzy celami gospodarstwa rolnego oraz stosowne ich uzasadnienie przedstawia Wrzaszcz [2015].

66
Tabela 1. Czynniki kszta�tuj�ce relacje mi�dzy celami gospodarstwa rolnego*
* W celu uproszenia analizy przyj�to, �e wi�kszo�� wskazanych czynników z za�o�enia powin-na sprzyja� realizacji celów ekonomicznych. W praktyce, zale�no�ci te nie maj" charakteru bezwzgl�dnego.
!ród�o: opracowano na podstawie przegl"du literatury.
Wyszczególnienie Cele gospodarstwa �rodowiskowe Ekonomiczne
I Czynniki sprzyjaj�ce komplementarno�ci celów gospodarstwa
ROLNIK � Wiedza i wykszta�cenie rolnika � ^wiadomo�� ekologiczna rolnika
(�wiadomo�� ograniczono�ci zasobów)
GOSPO- DARSTWO
� Rodzinny charakter gospodarstwa � Praktyki zwi�zane z popraw� stanu gleby,
np. wapnowanie gleby, bilans nawozowy
OTOCZENIE
� Us�ugi doradztwa � Polityka rolna, programy rz�dowe � Zasoby si�y roboczej � Popyt na �ywno�� o wysokich walorach
od�ywczych � Popyt na produkty z rynku lokalnego
II Czynniki wp�ywaj�ce wielokierunkowo na realizacj� celów gospodarstwa
GOSPO- DARSTWO
� Powierzchnia u�ytków rolnych
� Poziom specjalizacji produkcji � Poziom intensywno�ci produkcji � Poziom intensywno�ci gospodarowania � Poziom koncentracji produkcji rolnej
OTOCZENIE � Post�p techniczny, technologiczny, biologiczny
III Czynniki sprzyjaj�ce konkurencyjno�ci celów gospodarstwa
GOSPO-DARSTWO
� Wielokierunkowo�� produkcji rolnej � System produkcji ekologicznej
OTOCZENIE
� Uwarunkowania rynkowe
� Niedostatek kapita�u materialnego � Stan infrastruktury technicznej
na obszarach wiejskich � Warunki przyrodniczo-glebowe � Zmiany klimatyczne
Legenda: wp�yw dodatni: ; ujemny: ; zmienny (oboj�tny, dodatni, ujemny):

67
W ostatnim dziesi�cioleciu dostrzegamy tak�e znacz�c� rol� ró�nego rodzaju programów rz�dowych15, które obejmuj� ochron� �rodowiska przy-rodniczego w rolnictwie, pomoc w kszta�towaniu lokalnej przedsi�biorczo-�ci, zachowanie �ywotno�ci obszarów wiejskich, czy te� wsparcie procesów inwestycyjnych w gospodarstwach rolnych. Implementacja ró�nego rodzaju programów przek�ada si� na liczb� ich beneficjentów oraz jako�� �wiadczo-nych praktyk rolniczych.
Inne czynniki sprzyjaj�ce godzeniu celów �rodowiskowych i ekonomicz-nych to rodzinny charakter gospodarstw rolnych, znacz�ce zasoby pracy w jego otoczeniu, a tak�e rosn�ce oczekiwania spo�eczestwa w zakresie naturalnej i lokalnej produkcji rolnej. Jak wskazuj� do�wiadczenia krajów rozwini�tych, gospodarstwa rodzinne ze wzgl�dów �rodowiskowych, ekonomicznych i spo-�ecznych wpisuj� si� znakomicie w koncepcj� rolnictwa zrównowa�onego [Wo� 2004]. Gospodarstwa te z regu�y prowadz� produkcj� metodami tradycyjnymi, przy wzgl�dnie ni�szym zu�yciu przemys�owych �rodków produkcji, co zazwy-czaj skutkuje wi�kszym zaanga�owaniem czynnika ludzkiego (g�ównie przy pracach zwi�zanych z produkcj� ro�linn�). Cz��ciowa substytucja jednego zaso-bu kolejnym sprzyja zrównowa�onemu rozwojowi gospodarstw rolnych.
Na przestrzeni ostatniego dziesi�ciolecia zwi�ksza si� segment rynku produk-tów ekologicznych (organicznych), który cechuje si� wysokimi walorami od�yw-czymi i zdrowotnymi, a cz�sto tak�e wy�szymi cenami [Rembia�kowska 2006]. To skutek wzrostu popytu na produkty o wy�szej jako�ci, o odpowiednich walorach smakowych i zdrowotnych, pochodz�cych z rynków regionalnych oraz lokalnych. Poprawa sytuacji ekonomicznej gospodarstw domowych oraz wzrost �wiadomo�ci spo�eczestwa z zakresu wp�ywu �ywno�ci na zdrowie to bodziec dla producentów rolnych do wytwarzania �ywno�ci przy poszanowaniu praw przyrody.
W wielu przypadkach trudno wskaza� jednoznacznie zale�no�ci mi�dzy danym czynnikiem a poszczególnymi celami gospodarstwa rolnego. Mo�na wy-szczególni� procesy, które z za�o�enia, powinny dostarczy� korzy�ci ekonomicz-nych producentowi rolnemu, za� w zakresie �rodowiskowym, mog� wywiera� zarówno dodatni, jak i ujemny wp�yw. Za przyk�ad mo�e pos�u�y� powierzchnia gospodarstwa rolnego, której wzrost w kontek�cie zrównowa�enia �rodowisko-wego jest po��dany, aczkolwiek ma on tak�e swoje ograniczenia. Zale�no�� ta przyjmuje kszta�t paraboli, której punkt przegi�cia zmienia si� w zale�no�ci od innych cech organizacyjnych konkretnego gospodarstwa rolnego. Dotyczy to tak-�e specjalizacji produkcji rolniczej, procesu intensyfikacji16 czy te� koncentracji, 15 www.minrol.gov.pl/Wsparcie-rolnictwa-i-rybolowstwa 16 Zob. np. [Ripoll-Bosch et al. 2012; Bj�rklund 1999]. Nowym poj�ciem jest „zrównowa�o-na intensyfikacja”, zob. [Tittonell 2014; Firbank et al. 2013].

68
a tak�e ró�nie rozumianego post�pu17 (technicznego, technologicznego18 czy bio-logicznego, który tak�e obejmuje kwesti� GMO). W pewnym zakresie procesy te nie zagra�aj� otoczeniu przyrodniczemu czy te� spo�ecznemu, jednak nadmiernie post�puj�ce zmiany oddzia�uj� negatywnie. St�d wskazana jest ostro�no�� przy ich ocenie w kontek�cie zrównowa�onego rozwoju, przy jednocze�niym uwzgl�dnieniu ich stanu pocz�tkowego, tempa zachodz�cych zmian oraz warun-ków lokalnych konkretnego gospodarstwa rolnego.
Poza wieloma korzystnymi okoliczno�ciami sprzyjaj�cymi zrównowa�o-nemu rozwojowi gospodarstw rolnych wyst�puj� tak�e czynniki utrudniaj�ce koherentn� realizacj� celów �rodowiskowych i ekonomicznych. Jednym z takich czynników jest wielokierunkowo�� produkcji rolnej. Mimo korzystnego wp�ywu gospodarstw dwukierunkowych na �rodowisko przyrodnicze, czynniki organiza-cyjno-ekonomiczne nie zach�caj� producentów do ��czenia tych dzia�ów pro-dukcji. Gospodarstwa dwukierunkowe maj� wi�ksze mo�liwo�ci w zakresie utrzymania zamkni�tego obiegu materii organicznej oraz sk�adników od�yw-czych, tym samym w mniejszym stopniu s� uzale�nione od procesów rynko-wych w porównaniu do podmiotów jednokierunkowych. Powodem zaniechania wielokierunkowo�ci produkcji rolnej s� g�ównie przes�anki ekonomiczne, m.in. malej�ca op�acalno�� produkcji zwierz�cej, b�d�ca pochodn� sytuacji rynkowej, a tak�e regulacje z zakresu dobrostanu zwierz�t i norm �rodowiskowych.
Kolejnym czynnikiem jest system produkcji rolnej. W przypadku produk-cji ekologicznej, która z definicji powinna dostarcza� korzy�ci dla �rodowiska przyrodniczego, cz�sto nie zapewnia ona dostatecznego wyniku ekonomicznego dla producenta rolnego. Restrykcyjne za�o�enia produkcji ekologicznej determi-nuj� wymagan� postaw� rolnika wobec prowadzonej dzia�alno�ci (wykonywa-nych praktyk rolniczych), obliguj�c go do wytwarzania �ywno�ci o wysokich walorach od�ywczych w zgodzie z otaczaj�cym ekosystemem. Dop�aty skiero-wane do tych producentów s� istotnym dla nich zastrzykiem finansowym, jed-nak nie rekompensuj� one w pe�ni ró�nic kosztowych wzgl�dem systemu kon-wencjonalnego, wynikaj�cych chocia�by z wy�szych kosztów pracy, logistyki, a tak�e sprzeda�y.
Kolejne problemy stwarza szereg czynników o charakterze zewn�trznym. Obecne uwarunkowania rynkowe, post�puj�cy proces globalizacji, niedostatek kapita�u w rolnictwie, zachodz�ce zmiany klimatyczne, niekorzystne warunki glebowo-przyrodnicze, czy te� stan infrastruktury na obszarach wiejskich staj� si� wielkim wyzwaniem dla producentów rolnych. To czynniki o charakterze 17 Pozytywne przyk�ady to rozwój rolnictwa integrowanego oraz precyzyjnego [Sosnowska 2015; Rozbicki 2015]. 18 Znacznie technologii naturalnych podkre�la Kud [2015] oraz Herbinger [2015].

69
egzogenicznym, na które rolnik praktycznie nie ma wp�ywu, w których musi si� odnale@�, funkcjonowa� i pracowa�. To one narzucaj� gospodarstwom regu�y egzystencji i przetrwania, a te mog� by� i cz�sto s� sprzeczne z zasadami zrów-nowa�onego rozwoju.
Wnioski 5.5
� W zale�no�ci od uwarunkowa realizacja celów �rodowiskowych i ekono-micznych w gospodarstwie rolnym mo�e mie� charakter konkurencyjny b�d@ komplementarny.
� To, jakie cele gospodarstwa rolnego s� realizowane, jest wypadkow� wielu si�, o ró�nym kierunku oddzia�ywania na jednostk� gospodarcz�.
� Relacje mi�dzy celami ekonomicznymi i �rodowiskowymi gospodarstw rol-nych s� kszta�towane przez szereg ró�norodnych czynników, zarówno tych bezpo�rednio dotycz�cych rolnika (takich jak jego wiedza i kompetencje) oraz zwi�zanych z gospodarstwem rolnym (jego bie��c� organizacj� i mo�-liwo�ciami jej zmiany), jak i tych o charakterze zewn�trznym, które tworz� otoczenie gospodarstwa (lokalne warunki gospodarowania, rodzaje progra-mów rz�dowych, uwarunkowania rynkowe).
� Rynkowy przymus d��enia jednostek gospodarczych do zwi�kszania wyni-ków ekonomicznych, a tak�e przesuni�cie w czasie efektów zewn�trznych wywo�uj� potrzeb� zaanga�owania czynnika politycznego, aby decyzje rol-ników prowadzi�y do zbie�no�ci celów mikro- i makroekonomicznych.
� Komplementarna realizacja ró�nych celów stanowi podstawowy atrybut zrównowa�ania gospodarstwa rolnego.
� Rozpatruj�c zagadnienie zrównowa�onego rozwoju, istotne jest holistyczne spojrzenie na gospodarstwo rolne oraz jego otoczenie, wskazanie nie tylko szans, ale i zagro�e dla jego rozwoju, tych o charakterze wewn�trznym – na które rolnik ma wp�yw, oraz tych zewn�trznych – niezale�nych od niego.
� By zrealizowa� zasady rolnictwa zrównowa�onego niezb�dna jest akceptacja spo�eczna, co wymaga zmiany sposobu my�lenia – szerszego i perspekty-wicznego spojrzenia na dzia�alno�� rolnicz�.
Bibliografia
1. Baum R., Ocena zrównowa�onego rozwoju w rolnictwie (studium meto-dyczne), Rozprawy naukowe nr 434, Uniwersytet Przyrodniczy w Poznaniu, 2011.
2. Baum R., Podej�cie systemowe w zarz"dzaniu jako instrument zrównowa�o-nego rozwoju gospodarstw rolnych, Problemy In�ynierii Rolniczej, nr 2, 2007, s. 43-44.

70
3. Bekle E.G., Lant Ch.L., Soman S., Misgna G., The evolution and empirical estimation of ecological-economic production possibilities frontiers, Ecolog-ical Economics, no. 90, 2013, s. 1-9.
4. Björklund J., Limburg K.E., Rydberg T., Impact of production intensity on the ability of the agricultural landscape to generate ecosystem services: an example from Sweden, Ecological Economics, no. 29, 1999, s. 269-291.
5. B��d M., Kulturowe funkcje wsi i rolnictwa, [w:] Wielofunkcyjno�� rolnic-twa. Kierunki bada�, podstawy metodologiczne i implikacje praktyczne, J. Wilkin (red.), IRWiR PAN, Warszawa 2010, s. 165-170.
6. Czudec A., Ekonomiczne uwarunkowania rozwoju wielofunkcyjnego rolnic-twa, Uniwersytet Rzeszowski, 2009.
7. Czy�ewski, A., Henisz, A., Ekonomia czynnika ziemi i jej wspó�czesne zna-czenie, [w:] Wspó�czesne problemy agrobiznesu w Polsce, A. Czy�ewski (red.), Akademia Ekonomiczna w Poznaniu, 2001, s. 33-36.
8. Firbank L.G., Elliott J., Drake B., Cao Y., Gooday R., Evidence of sustaina-ble intensification among British farms, Agriculture, Ecosystems and Envi-ronment, no. 173, 2013, s. 58- 65.
9. Herbinger G., Technologie naturalne – szansa dla polskiego rolnictwa, [w:] III Kongres Nauk Rolniczych. Badania naukowe w procesie kszta�towania polskiej wizji Wspólnej Polityki Rolnej i Wspólnej Polityki Rybackiej, Nau-ka-Praktyce, MRiRW, Warszawa 2015, s. 186-187.
10. Holcombe R.G., A theory of the Theory of public goods, Review of Austrian Economics 10, no. 1, 1997, s. 1-22.
11. Huylenbroeck G., Vandermeulen V., Mettepenningen E., Verspecht A., Mul-tifunctionaliity of Agriculture: A review of definitions, evidence and institu-tions, Living Reviews in Landscape Research, nr 3, 2007.
12. Jakubowski M., Dobra publiczne i dobra wspólne, [w:] Teoria wyboru pu-blicznego. G�ówne nurty i zastosowania, J. Wilkin (red.), Warszawa 2012, s. 42-60.
13. Kern W., Ziele und Zielsysteme in Betriebswirtschaften I Be-triebswirtschaftslehre, Hauptstudium, WISU 7, 1972.
14. Kern W., Ziele und Zielsysteme in Betriebswirtschaften I Betriebswirt- schaftslehre, Hauptstudium, WISU 8, 1972.
15. Kroeger T., Casey F., An assessment of market-based approaches to provid-ing ecosystem services on agricultural lands, Ecological Economics, no. 64, 2007, s. 321-332.
16. Kud K., Technologie naturalne – innowacje, tradycja, przysz�o�� i bezpie-cze�stwo, [w:] III Kongres Nauk Rolniczych. Badania naukowe w procesie
71
kszta�towania polskiej wizji Wspólnej Polityki Rolnej i Wspólnej Polityki Ry-backiej, Nauka-Praktyce, MRiRW, Warszawa 2015, s. 82-89.
17. Kulawik J., Cele gospodarstw rodzinnych, Zagadnienia Doradztwa Rolni-czego, nr 2/95(5), s. 84-91.
18. Maciejczak M., Rolnictwo i obszary wiejskie #ród�em dóbr publicznych – przegl"d literatury, Zeszyty Naukowe SGGW Ekonomika i organizacja go-spodarki �ywno�ciowej, nr 75 (2009), s. 121-134.
19. Majchrzak A., Ewolucja wspólnej polityki rolnej a zmiany zasobów i struk-tury ziemi rolniczej w pa�stwach unii europejskiej, Uniwersytet Ekonomicz-ny w Poznaniu, 2014.
20. Ma�a�ewska S., �rodowiskowe dobra publiczne w rolnictwie i na obszarach wiejskich, Ekonomia i ^rodowisko, nr 1(52), 2015, s. 132-147.
21. Manteuffel R., Ekonomika i organizacja gospodarstwa rolniczego, PWRiL, Warszawa 1984.
22. Manteuffel R., Filozofia rolnictwa, PWN, Warszawa 1987. 23. Prandecki K., Gajos E., Buks J., Z bada� nad rolnictwem zrównowa�onym
[32]. Efekty zewn�trzne i dobra wspólne w rolnictwie – identyfikacja pro-blemu, Program Wieloletni 2005-2009, nr 7, IERiGQ-PIB, Warszawa 2015.
24. Rembia�kowska E., 2006, Analiza cech jako�ciowych �ywno�ci wytwarzanej przez rolnictwo ekologiczne, [w:] Z bada� nad rolnictwem spo�ecznie zrów-nowa�onym [3], nr 52, IERiGQ-PIB, Warszawa, s. 56-76.
25. Ripoll-Bosch R., Díez-Unquera B., Ruiz R., Villalba D., Molina E., Joy M., Olaizola A., Bernués A., An integrated sustainability assessment of mediter-ranean sheep farms with different degrees of intensification, Agricultural Systems, No. 105, 2012, s. 46-56.
26. Rozbicki J., Rolnictwo precyzyjne szans" zachowania bioró�norodno�ci i ochrony �rodowiska, a tak�e gwarantem produkcji bezpiecznej �ywno�ci, [w:] III Kongres Nauk Rolniczych. Badania naukowe w procesie kszta�towa-nia polskiej wizji Wspólnej Polityki Rolnej i Wspólnej Polityki Rybackiej, Nauka-Praktyce, MRiRW, Warszawa 2015, s. 136-137.
27. Runowski H., Poszukiwanie równowagi ekonomiczno-ekologicznej i etycznej w produkcji mleka, Roczniki Nauk Rolniczych SGGW, Seria G, t. 93, z. 2, 2007, s. 14.
28. Samuelson P.A., The pure theory of public expenditure, The Review of Eco-nomics and Statistics, vol. 36, no. 4., 1954, s 387-389.
29. Sauer J., Wossink A., Marketed outputs and non-marketed ecosystem ser-vices: the evolution of marginal costs, European Review of Agricultural Economics, vol. 40(4), 2013, s. 573-603.

72
30. Sielska A., Decyzje producentów rolnych w uj�ciu wielokryterialnym – zarys problemu, IERiGQ-PIB, Warszawa 2012.
31. Singh J.S., Pandey V.C., Singh D.P., Efficient soil microorganisms: A new dimension for sustainable agriculture and environmental development, Ag-riculture, Ecosystems and Environment, no. 140, 2011, s. 339-353.
32. Sobiecki R., Globalizacja a funkcje polskiego rolnictwa, SGH, Warszawa 2007.
33. Sosnowska D., Integrowana produkcja ro�lin – korzy�ci i perspektywy, [w:] III Kongres Nauk Rolniczych. Badania naukowe w procesie kszta�towania polskiej wizji Wspólnej Polityki Rolnej i Wspólnej Polityki Rybackiej, Nau-ka-Praktyce, MRiRW, Warszawa 2015, s. 108-109.
34. Steffen G., Born D., 1994, Prowadzenie gospodarstw i przedsi�biorstw w rolnictwie, Ksi��ka i Wiedza, Warszawa.
35. Tittonell P., Ecological intensification of agriculture – Sustainable by na-ture, Environmental Sustainability, no. 8, 2014, s. 53-61.
36. Tomczak F., Gospodarka rodzinna w rolnictwie. Uwarunkowania i mecha-nizmy rozwoju, IRWiR PAN, Warszawa 2006.
37. Wilkin J., Wielofunkcyjno�� rolnictwa. Kierunki bada�, podstawy metodolo-giczne i implikacje praktyczne, IRWiR PAN, Warszawa 2010.
38. Wilkin J., Wielofunkcyjno�� rolnictwa – konceptualizacja i operacjonaliza-cja zjawiska, Wie� i Rolnictwo, nr 145, 2009, s. 9-28.
39. Wilkin J., Wielofunkcyjno�� wsi i rolnictwa a rozwój zrównowa�ony, Wie� i Rolnictwo, nr 4 (153), 2011, s. 27-39.
40. Wossink A., Jointness in production and farmers’ willingness to supply non-marketed ecosystem services, Ecological Economics, no. 64, 2007, s. 297-304.
41. Wo� A., Konkurencyjno�� polskiego sektora �ywno�ciowego. IERiGQ, War-szawa 2003.
42. Wo� A., W poszukiwaniu modelu polskiego rolnictwa, IERiGQ, Warszawa 2004.
43. Wo� A., Zegar J.St., Rolnictwo spo�ecznie zrównowa�one, IERiGQ, 2002. 44. Wo� A., Zegar J.St., Rolnictwo spo�ecznie zrównowa�one – w poszukiwaniu
nowego modelu dla Polski, Wie� i Rolnictwo, nr 3 (124), IRWiR PAN, War-szawa 2004, s. 11.
45. Wrzaszcz W., Szanse i zagro�enia zrównowa�onego rozwoju gospodarstw rolnych, [w:] Z bada nad rolnictwem spo�ecznie zrównowa�onym [31], J.St. Zegar (red.), Program Wieloletni 2015-2019, nr 6, IERiGQ-PIB War-szawa 2015, s. 52-88.
46. Wyzwania zrównowa�onego rozwoju w Polsce, J. Kronenberg (red.), T. Ber-gier (red.), Fundacja Sendzimira, Kraków 2010.

73
47. Zegar J.St., Konkurencyjno�� celów ekologicznych i ekonomicznych w rol-nictwie, [w:] Z bada� nad rolnictwem spo�ecznie zrównowa�onym [20]. Wy-brane zagadnienia zrównowa�onego rozwoju rolnictwa, IERiGQ-PIB, nr 93, Warszawa 2013, s. 28-46.
48. Zegar J.St., Konkurencyjno�� rolnictwa zrównowa�onego, [w:] Konkuren-cyjno�� polskiej gospodarki �ywno�ciowej w warunkach globalizacji i inte-gracji europejskiej, IERiGQ-PIB, nr 147, Warszawa 2014, s. 57-80.
49. Zegar J.St., Podstawowe zagadnienia rozwoju zrównowa�onego, Wy�sza Szko�a Bankowo�ci i Finansów w Bielsku-Bia�ej, 2007.
50. Zegar J.St., Wspó�czesne wyzwania rolnictwa, PWN, 2012. 51. Zegar J.St., Zrównowa�ony rozwój rolnictwa w �wietle paradygmatu konku-
rencyjno�ci, [w:] WPR a konkurencyjno�� polskiego i europejskiego sektora �ywno�ciowego, IERiGQ-PIB, nr 146, Warszawa 2014, s. 197-223.
52. Zhang W., Ricketts T. H., Kremen C., Carney K., Swintona S.M., Ecosystem services and dis-services to agriculture, Ecological Economics, no. 64, 2007, s. 253-260.
53. Zi�tara W., System celów w pa�stwowych przedsi�biorstwach rolniczych, Zagadnienia Ekonomiki Rolnej, nr 2, 1987, s. 50-72.
54. Zi�tara W., 2000, Tradycyjne i wspó�czesne podej�cie do równowagi w go-spodarstwach i przedsi�biorstwach rolniczych, [w:] Gospodarowanie w rol-nictwie zrównowa�onym u progu XXI wieku, Pami�tnik Pu�awski, IUNG, Pu�awy, s. 553-563.
55. www.minrol.gov.pl/Wsparcie-rolnictwa-i-rybolowstwa

74
Dr Artiom Volkov, dr Jolanta Droždz Lithuanian Institute of Agrarian Economics
6 The CAP 2004-2013 direct payment scheme’s impact on sustainability of agriculture in Lithuania
CAP direct payment scheme: 2003 reform towards sustainability 6.1
The mid-term review of the Common Agricultural Policy in 2003/2004 has strengthened the multifunctional role of agriculture by implementing “de-coupling”, “modulation” and “cross-compliance” and created a number of sig-nificant changes in agricultural production in all EU member states [Giannakis and Efstratoglou 2011]. Specifically, the reform shifted emphasis away from commodity support towards sustainable agriculture, environmental contracts, diversified production practices and rural development [Lindberg 2011]. Right in time with this reform towards sustainability, new member states started im-plementation CAP [Gay et al. 2005]. The decoupling was applied to the subsi-dies and integration through rights in the Single Payment Scheme (SPS) as well as in the Single Area Payment Scheme (SAPS). The latter was a transitional, simplified income support scheme offered to the member states who joined the EU in 2004 and 2007 (EU-12) as an option in order to facilitate the implementa-tion of direct payments [Markopoulos et al. 2015].
The whole CAP and especially its one of the best-funded measures – di-rect payment scheme – should have contributed to the objectives of sustainable agriculture [Meléndez–Ortiz et al. 2009]. However, ensuring sustainability (uni-versally accepted as three-dimensional – economic, social and environmental – subject) via direct payments is a rather complicated and challenging goal. First of all, direct payments were conceived to perform economic function without deepening social conflict and segregation between different farm groups or farming types, while contributing to securing environmentally sustainable farm-ing practice [Ferrer and Kaditi 2007]. The CAP has presupposed that direct payment scheme should have contributed to the maintenance of environmental standards, food safety, animal welfare, competitiveness, market orientation, in-come stability for farmers [Erjavec K. and Erjavec E. 2009] (Figure 1).

75
Environment
Community
Economy
Figure 1. The direct payment scheme’s contribution to the agricultural sustainability
Source: own elaboration according to Erjavec, K., Erjavec, E. 2009, 2015.
However, the impact of the direct payment scheme on sustainability even-tually had stronger socio-economical dimensions, such as reduction of income inequality among farmers, reduction of unemployment rate in rural areas, etc. [Schmid et al. 2006]. Therefore, while analysing impact of the direct payment scheme on the agricultural sustainability, this paper places a special attention to direct payment scheme’s economic sustainability, i.e. the most elusive compo-nent of the triple bottom line approach. Economic sustainability is integrally linked to the environmental and social outcomes a farm achieves. Although good financial and (in a broader sense) economic performance might mean that farm survives in the short run, it neither secures a long-term economic future, nor does it guarantee positive environmental or social outcomes. Moreover, this paper looks at the economic sustainability of agriculture in the context of direct payment impact on choice of specialization through economic attractiveness.
Methodology 6.2
In this paper economic sustainability in agriculture is linked with the maintaining of current farming type by farmer while securing sufficient level of income in the long run. Farmers’ choice on specialization depends on many in-dicators; however, it is complicated to specify which of those indicators outline the “economic attractiveness” best. According to Knoke et al. [2001] and Geor-gopoulou et al. [2008] the economic attractiveness of farming activities is close-ly linked to economic performance: if it is cost-effective, then it is economically attractive, too. Thus, economic attractiveness and efficiency are closely linked. In the Lithuanian literature, there are a number of “economic efficiency” inter-pretations that are applicable for the economic activities assessment (Table 1).
� maintenance of environmental standards � food safety � animal welfare � income stability for farmers � competitiveness � market orientation

76
The analysis of various definitions of “efficiency” led to general concept that efficiency is seen as a ratio between company’s performance and the re-sources consumed to achieve those performance results.
Economic efficiency – i.e. better performance (higher profits) at lower costs – was primarily analysed in order to establish a model for assessing eco-nomic attractiveness of farmers’ choice in specialisation. Andrijauskien� [2004] argues that term “economic efficiency” means effectiveness of production activ-ities, i.e. shows the relationship between economic activities (process) and the objectified performance (results).
Table 1. Definitions of the economic efficiency
Authors Definition of term Mackevi[ius and Daujotait� 2011
Ratio of created products and used resources.
Buklyt� and Ruževi[ius 2010
Comprehensive tool for assessing the company's operational excellence and its inner potential (...) with regard to performance of the activities, customers, people and society.
Štaras and Šiop� 2010 Ratio of costs, resources and qualitative output. Daft 2009 Amount of resources used to achieve organizational goals. Deksnien� et al. 2007 Level of utilization of productive resources, guaranteeing
maximum effect. Šimaityt� et al. 2006 Company’s operating efficiency, effectiveness, expressed
in the ratio of the achieved results and the costs used. Puškorius 2002 Ratio of operating results to complex resources, deposits,
costs and other.
Source: own elaboration.
One of the main financial indicators that characterise economic efficiency is profitability. Berry ratio is a commonly applied indicator [Przysuski and Lala-pet 2005]; it shows the company/farm profitability resulting from their typical value-building functions, assuming that the costs incurred in the execution of these functions are included in the operating costs [Berry 1999]. Berry ratio may be applied only in existence of a strong correlation between company/farm op-erating costs and sales revenue.
Another widely applied economic efficiency indicator is gross profit per employee (or one annual work unit, AWU) [Berger et al. 1993; Chavas et al. 1993]. This ratio shows how efficiently a company or a farm uses human re-sources. Dividends are also in some cases taken into consideration in line with this indicator in order to assess cash balance at the end of fiscal year [Porter and Scully 1987].
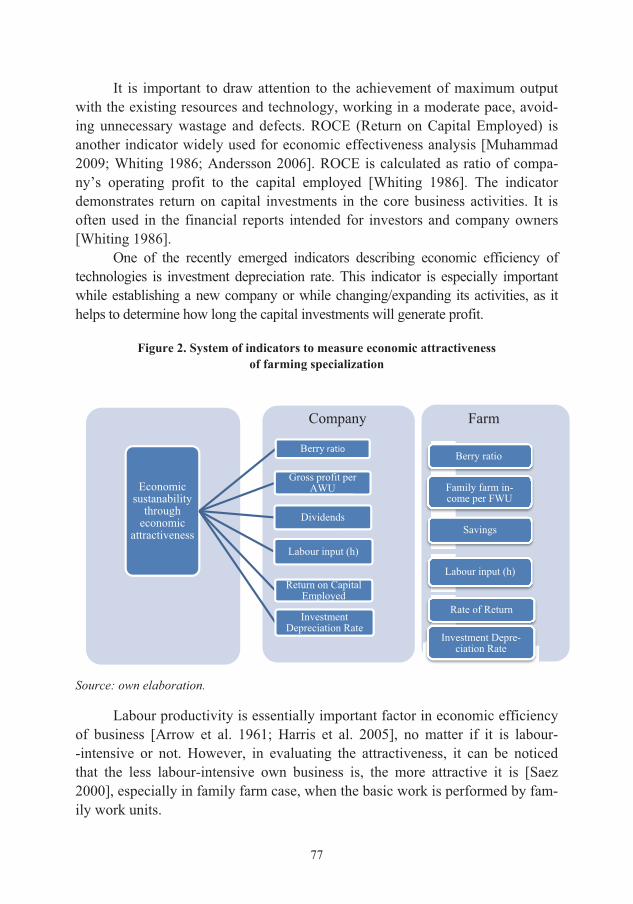
77
It is important to draw attention to the achievement of maximum output with the existing resources and technology, working in a moderate pace, avoid-ing unnecessary wastage and defects. ROCE (Return on Capital Employed) is another indicator widely used for economic effectiveness analysis [Muhammad 2009; Whiting 1986; Andersson 2006]. ROCE is calculated as ratio of compa-ny’s operating profit to the capital employed [Whiting 1986]. The indicator demonstrates return on capital investments in the core business activities. It is often used in the financial reports intended for investors and company owners [Whiting 1986].
One of the recently emerged indicators describing economic efficiency of technologies is investment depreciation rate. This indicator is especially important while establishing a new company or while changing/expanding its activities, as it helps to determine how long the capital investments will generate profit.
Figure 2. System of indicators to measure economic attractiveness
of farming specialization
Source: $wn elaboration.
Labour productivity is essentially important factor in economic efficiency of business [Arrow et al. 1961; Harris et al. 2005], no matter if it is labour- -intensive or not. However, in evaluating the attractiveness, it can be noticed that the less labour-intensive own business is, the more attractive it is [Saez 2000], especially in family farm case, when the basic work is performed by fam-ily work units.
FarmCompany
Economic sustanability
through economic
attractiveness
Berry ratio
Gross profit per AWU
Dividends
Labour input (h)
Return on Capital Employed
Investment Depreciation Rate
Berry ratio
Family farm in-come per FWU
Savings
Labour input (h)
Rate of Return
Investment Depre-ciation Rate

78
Initial overview of available economic efficiency measurement tools led to development of a system of indicators (Figure 2) for assessment of company’s economic attractiveness or, in case of farm, choice to specialize in a certain farming type.
The economic efficiency indicators mainly used for companies, were adapted to be applicable for farms. Basing on 2004-2013 data of respondent farms belonging to Farm Accountancy Data Network (hereinafter FADN), two indicator systems – alfa and status quo – were formed with six indicators (Berry ratio, family farm income per 1 FWU, savings at the end of the year, labour in-put (hours), rate of return and Investment depreciation rate). In alfa indicator system, all the above listed indicators are calculated eliminating of all direct fi-nancial support available to farmers (i.e. direct payments, organic farming (OF) payments, and less favoured areas (LFA) payments). Meanwhile, in status quo indicator system, values of the same indicators were calculated based on results of factual implementation of 2004-2013 CAP direct payment scheme in Lithua-nia. Indicator values for a ten year period (from 2004 to 2013) are estimated separately for each of the selected farming type. In this model, a shortened set of FADN farming types (eliminating mixed types) is applied, containing the fol-lowing – specialist cereal/rapes19, general field crops20, horticulture21, specialist dairy22 and grazing livestock23 (Figure 3).
19 Specialist cereal/rapes farm type according to FADN – farm in which cereals, oilseeds and protein crops make up more than 2/3 of total farm production. 20 General field crops farm type according to FADN – when production of any type of crop accountes for more than 2/3 of total farm production, but cereals, oilseeds and protein crops make not more than 2/3 in the total production. 21 Horticulture farm type according to FADN – farm in which horticulture makes out more than 2/3 of total farm production. 22 Specialist dairy farm type according to FADN, when production from dairy cows amounts to more than 3/4 of the farm’s total grazing livestock production, and production from the grazing livestock makes up more than 1/10 of farm’s total grazing livestock and fodder crop production. 23 Grazing livestock farm type according to FADN, when total livestock production consists of grazing livestock production in more than 2/3.

79
Figure 3. Model of economic attractiveness of farmers’ choice in specialization
Source: own elaboration.
In the alfa system, Berry ratio was calculated by dividing farm’s gross profit
(without subsidies24 and depreciation) by total production costs (variable and fixed). In the Status Quo system, the same formula was applied for calculating Berry ratio except that production subsidies were added to farm’s gross profit.
Gross profit was calculated by deducting total production costs, variable and fixed (including VAT payable), from total farm output. In the Status Quo system subsidies for production were added to gross profit. Gross profit per 1 annual farm working unit (EUR/AWU) was calculated by dividing gross prof-it by the number of AWU.
In the Alfa system, savings at the end of the year (EUR) were estimated in the following way: cash flow without subsidies plus asset sales-purchase balance plus quota sales-purchase balance minus returned debts minus private expendi-
24 Subsidies = production subsidies + investment support; where production subsidies contain direct payments, less favoured areas (LFA) payments, organic farming (OF) payments, sup-port in case of disaster, ant other production-related subsidies.
� Berry ratio � Family farm
income per 1 FWU
� Savings � Labour input � Rate of return � Investment de-
preciation rate
Specialist Cereals/Rape General Field Crops Horticulture Specialist Dairy Grazing Livestock
–
+
Alfa indicators system
Status Quo
indicators system
Type of farming by FADN
DIRECT SUPPORT
TOPSIS method criteria system
TOPSIS comparison of values
FADN subsidies on pro-duction (direct payments,
LFA, organic farming)
Expert evaluation weights values of indicators
2013 2004

80
tures. In the status quo system, savings at the end of the year include production subsidies received.
Farm labour input includes working time (hours) of farmers, their spouses and other farm members as well as hired employees. The value of this indicator is identical in both: alfa and status quo systems. In the alfa system, rate of return (%) was estimated by dividing net profit25 (without subsidies and depreciation) by total value of agricultural assets, including rented land, at the beginning of year. In the status quo system, net profit adds production subsidies. In both: alfa and status quo systems, Investment depreciation had the same value (%), which has been estimated by dividing net investments by gross investments26. Ten alfa indicator systems were composed basing on the estimated indicator values from year 2004 to 2013. Equally, ten status quo indicator systems were drawn.
According to Podvezko [2010] the TOPSIS method is the most suitable in evaluation of described model. Thus, each of the system had TOPSIS method applied to them. The calculated TOPSIS values demonstrate dynamics of eco-nomic attractiveness of each farming specialisation over the selected years. Striving to identify the most economically attractive farming specialisation over the whole year range, a mathematical average of values of normalized TOPSIS criteria was drawn: ���� : �������� � �� ������ (k = 1, ..., 10, where k = 1 correspond to year 2004, k = 2 respectively corresponds to year 2005, ..., k = 10 corresponds to year 2013).
Outcomes 6.3
According to the results, retrieved from the alfa indicator system analysis, while direct aid to farms is eliminated, sole cultivation of specialist cereals/rapes in 2012 would have been the most attractive farming specialisation in Lithuania, in comparison to other farm types. In any other year, the most economically at-tractive farming activity would have been horticulture (Table 2).
Economic attractiveness of dairy farming may be observed in year 2005 and 2006, while during year 2008 to 2010 general field cropping might have been considered an attractive option, too. Table 3 demonstrates the major out-come of assessing economic attractiveness of different farming specialisation according to the developed indicator systems, i.e. 2004–2013 alfa and status quo systems’ average ���� TOPSIS values.
25 Net profit = Gross profit minus family remuneration. 26 Gross investments equal difference between purchase and sales price of land, forest, per-manent crops, farm buildings, machinery and quotas. Gross investments – depreciation = net investments.
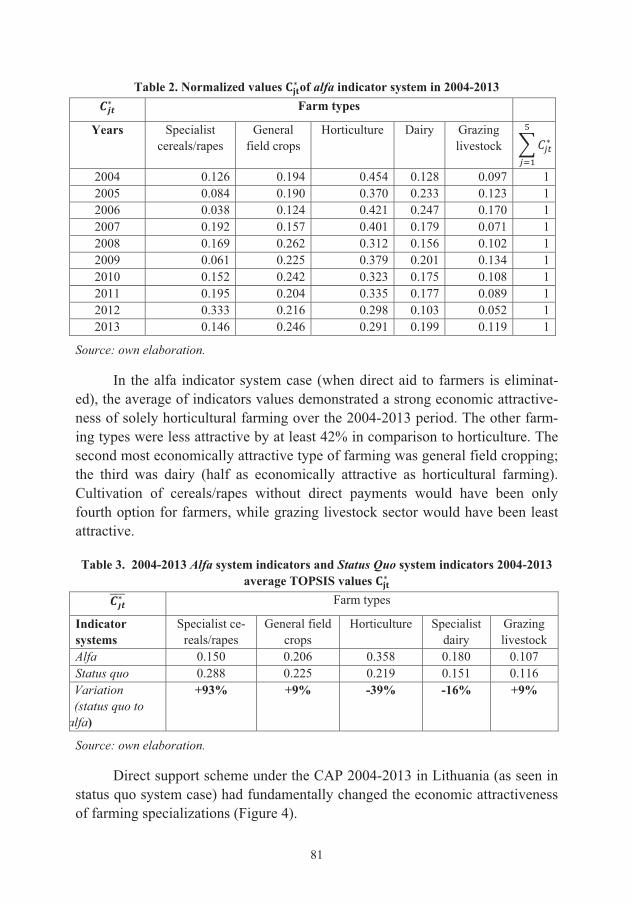
81
Table 2. Normalized values ���� of alfa indicator system in 2004-2013 ���� Farm types
Years Specialist cereals/rapes
General field crops
Horticulture Dairy Grazing livestock �����
�
� 2004 0.126 0.194 0.454 0.128 0.097 12005 0.084 0.190 0.370 0.233 0.123 12006 0.038 0.124 0.421 0.247 0.170 12007 0.192 0.157 0.401 0.179 0.071 12008 0.169 0.262 0.312 0.156 0.102 12009 0.061 0.225 0.379 0.201 0.134 12010 0.152 0.242 0.323 0.175 0.108 12011 0.195 0.204 0.335 0.177 0.089 12012 0.333 0.216 0.298 0.103 0.052 12013 0.146 0.246 0.291 0.199 0.119 1
Source: own elaboration.
In the alfa indicator system case (when direct aid to farmers is eliminat-ed), the average of indicators values demonstrated a strong economic attractive-ness of solely horticultural farming over the 2004-2013 period. The other farm-ing types were less attractive by at least 42% in comparison to horticulture. The second most economically attractive type of farming was general field cropping; the third was dairy (half as economically attractive as horticultural farming). Cultivation of cereals/rapes without direct payments would have been only fourth option for farmers, while grazing livestock sector would have been least attractive.
Table 3. 2004-2013 Alfa system indicators and Status Quo system indicators 2004-2013
average TOPSIS values ���� �������� Farm types
Indicator systems
Specialist ce-reals/rapes
General field crops
Horticulture Specialist dairy
Grazing livestock
Alfa 0.150 0.206 0.358 0.180 0.107 Status quo 0.288 0.225 0.219 0.151 0.116
Variation (status quo to alfa)
+93% +9% -39% -16% +9%
Source: own elaboration.
Direct support scheme under the CAP 2004-2013 in Lithuania (as seen in status quo system case) had fundamentally changed the economic attractiveness of farming specializations (Figure 4).

82
Figure 4. Comparison of 2004-2013 average TOPSIS values in alfa and status quo indicator systems
Source: own elaboration.
The obtained TOPSIS method values clearly demonstrates that the direct support scheme has made cultivation of specialist cereals and rapes the most economically attractive agricultural specialization for Lithuania farmers in 2004-2013 period. Compared to alfa scenario, which eliminates effects of the direct support, the economic attractiveness of specialist cereals/rapes cultivation has increased by 93%. According to Statistics Lithuania [Statistics 2014], cereal crop area has increased by more than 27% from year 2005 to 2013; and in 2013 it already accounted for about 45% of all utilized agricultural area (UAA) in Lithuania.
According to TOPSIS results, in status quo system case, the second most pop-ular farming activity, general field crops remained at similar level as in the alfa sys-tem. The economic attractiveness of this farming type has increased by 9% as com-pared to year 2004. Meanwhile, attractiveness of horticulture was significantly (-39%) reduced by direct support scheme applied in Lithuania during 2004-2013: according to Statistics Lithuania [2015], fruit and vegetable production area de-creased by 36.3% and 23.4% respectively during the same period.
Impact of direct payment scheme on specialist dairying sector was nega-tive as well: its economic attractiveness decreased by 16%. In status quo system specialist dairy farming type has 48% lower economic attractiveness than spe-
0.0000.0500.1000.1500.2000.2500.3000.3500.400
specialistcereals/rapes
general fieldcropping
horticulturespecialistdairying
grazing livestock
Alfa
StatusQuo

83
cialist cereals/rapes. Grazing livestock has become slightly more attractive (+9%) to farmers due to the subsidies from direct payment scheme. Neverthe-less, this farming type is yet 60% less economically attractive than specialist ce-reals / rapes.
Conclusions 6.4
Since 2003, direct payment scheme, as one of the most intensely financed CAP measures, together with the whole CAP in general, was expected to con-tribute to the objectives of sustainable agriculture. However, the role of the di-rect payment scheme focused on stronger socio-economical dimensions of agri-cultural sustainability, such as reduction of income inequality among farmers, reduction of unemployment rate in rural areas, etc.
Identification of the link among economical sustainability, economical at-tractiveness and economic efficiency allowed development of model for as-sessing impact of direct payment scheme on economic sustainability. The values obtained within application of TOPSIS method, showed that direct support scheme made cultivation of specialist cereals and rapes the most economically attractive agricultural specialization for Lithuanian farmers in 2004-2013. The economic attractiveness of this particular farming type increased by 93% as compared to alfa system scenario, with the effects of production subsidies being eliminated. Model of economic attractiveness to different farming types results essentially replicate structural changes in Lithuanian agriculture in 2004-2013.
According to the outcomes brought by applying this pilot economic at-tractiveness evaluation model, the 2004-2013 CAP direct support in Lithuania basically prompted economic attractiveness of such farming type as specialist cereal / rape that in turn stimulated farmers’ reorientation towards this most eco-nomically attractive type of farming.
In case of Lithuania, SAPS became economically attractive niche for farmers’ strong orientation towards financial support and basically repositioning the major part of economic risks on direct payments. As proved by Alpha sys-tem case results, without the production support, cereals/rape sector would have been way less economically attractive and in terms of agricultural sustainability would have been able to more sustainable.
References
1. Andersson, T., Haslam, C., Lee, E. (2006), Financialized accounts: Restruc-turing and return on capital employed in the S&P 500, [in:] Accounting Fo-rum, vol. 30, no. 1, p. 21-41. Elsevier.
2. Andrijauskien�, A. (2004), %moni' ekonomika, Vilnius: Presvika, 2004.

84
3. Arrow, K.J., Chenery, H.B., Minhas, B.S., Solow, R.M. (1961). Capital-labor substitution and economic efficiency. The Review of Economics and Statistics, p. 225-250.
4. Berger, A.N., Hancock, D., Humphrey, D.B. (1993), Bank efficiency derived from the profit function, “Journal of Banking & Finance”, 17(2), p. 317-347.
5. Berry, C. (1999), Berry Ratios: Their Use and Misuse, Global transfer pricing. 6. Buklyt�, S., Ruzevi[ius, J. (2010), Total quality management impact on
Lithuanian companies’ performance efficiency, “Organizacij� vadyba: sis-teminiai tyrimai”, Vilnius: Vilniaus universitetas, 2010, p. 55-70.
7. Chavas, J.P., Aliber, M. (1993). An analysis of economic efficiency in agri-culture: a nonparametric approach. Journal of Agricultural and Resource Economics, p. 1-16.
8. Daft, R.L. (2009), Organization theory and design, 10th ed. – Mason: South – Western Cengage Learning, 2009.
9. Deksnien�, J. et al. (2007), Lietuvos tekstil+s 8moni' <kin+s veiklos efek-tyvumo 8vertinimas ir tendencijos, “Ekonomika ir vadyba: aktualijos ir per-spektyvos”, Šiauliai: VŠ� Šiauli� universiteto leidykla, 2007, no. 2(9).
10. Erjavec, K., Erjavec, E. (2009), Changing EU agricultural policy discours-es? The discourse analysis of Commissioner’s speeches 2000-2007, „Food Policy”, 34(2), p. 218-226.
11. Ferrer, J.N., Kaditi, E.A. (2007), The EU added value of agricultural ex-penditure – from market to multifunctionality – gathering criticism and suc-cess stories of the CAP, European Parliament, Policy Department on Budg-etary Affairs, Brussels, Belgium.
12. Gay, S.H., Osterburg, B., Baldock, D., Zdanowicz, A. (2005), Recent evolu-tion of the EU Common Agricultural Policy (CAP): state of play and envi-ronmental potential, MEACAP WP6, D4b, Federal Agricultural Research Centre, Braunschweig and Institute for European Environmental Policy, London.
13. Georgopoulou, E., Hontou, V., Gakis, N., Sarafidis, Y., Mirasgedis, S., La-las, D.P., Triantafilopoulos, T. (2008), BEAsT: A decision-support tool for assessing the environmental benefits and the economic attractiveness of best available techniques in industry, “Journal of Cleaner Production”, 16(3), p. 359-373.
14. Giannakis, E., Efstratoglou, S. (2011), An input-output approach in as-sessing the CAP reform impact of extensive versus intensive farming systems on rural development: The case of Greece, “Agricultural Economics Re-view”, 12(1), p. 81-90.

85
15. Harris, R., Siegel, D.S., Wright, M. (2005), Assessing the impact of man-agement buyouts on economic efficiency: Plant-level evidence from the United Kingdom, “Review of Economics and Statistics”, 87(1), p. 148-153.
16. Knoke, T., Moog, M., Plusczyk, N. (2001). On the effect of volatile stump-age prices on the economic attractiveness of a silvicultural transformation strategy. “Forest policy and economics”, 2(3), p. 229-240.
17. Lindberg, G. (2011), Linkages: economic analysis of agriculture in the wid-er economy”, vol. 2011, no. 6.
18. Mackevi[ius, J., Daujotait�, D. (2011). Veiklos audito elementai: analiz+ ir auditas, “Socialini� moksl� studijos”, Vilnius: Mykolo Romerio universiteto Leidybos centras, 2011, no. 3(2), p. 459-472.
19. Markopoulos, T., Karelakis, C., Galanopoulos, K., Mattas, K. (2015), Did The 2004 Cap Reform Affect Production Practices Of Cereals? Insights From The Agricultural Input Suppliers, “Scientific Bulletin-Economic Sci-ences”, 14(2), p. 71-83.
20. Meléndez-Ortiz, R., Bellmann, C., Hepburn, J. (Eds.) (2009), Agricultural subsidies in the WTO green box: ensuring coherence with sustainable devel-opment goals, Cambridge University Press.
21. Muhammad, N.M., Ismail, M.K. (2009), Intellectual capital efficiency and firm’s performance: Study on Malaysian financial sectors, “International Journal of Economics and Finance”, 1(2), p. 206.
22. Podvezko, V., Podviezko, A. (2010), Dependence of multi-criteria evalua-tion result on choice of preference functions and their parameters, “Techno-logical and Economic Development of Economy” 16(1): 143-158.
23. Porter, P.K., Scully, G.W. (1987), Economic efficiency in cooperatives, “Journal of law and economics”, p. 489-512.
24. Przysuski, M., Lalapet, S. (2005), A Comprehensive Look at the Berry Ratio In Transfer Pricing, Tax Notes Int’l, November 21, 2005, p. 759.
25. Puškorius, S. (2002), 3E koncepcijos pl+tra, Viešoji politika ir administra-vimas. Vilnius: Mykolo Romerio universiteto Leidybos centras, 2002, no. 3, p. 31-38.
26. Saez, E. (2000), Optimal income transfer programs: intensive versus exten-sive labor supply responses (No. w7708). National Bureau of Economic Re-search.
27. Schmid, E., Sinabell, F., Hofreither, M.F. (2006), Direct payments of the CAP-distribution across farm holdings in the EU and effects on farm house-hold incomes in Austria. Univ. für Bodenkultur Wien, Department für Wirtschafts-und Sozialwiss., Inst. für Nachhaltige Wirtschaftsentwicklung.

86
28. Šimaityt�, D. et al. (2006), AB „Linas- veiklos ekonominio efektyvumo 8ver-tinimas, „Jaun�j� mokslinink� darbai. Šiauliai: VŠ� Šiauli� universiteto leidykla”, 2006, Nr. 2 (9), p. 13-17.
29. Štaras, K., Šiop�, A. (2010), VŠ% Centro poliklinikos veiklos efektyvumo ver-tinimas, Socialini� moksl� studijos. Vilnius: Mykolo Romerio universiteto Leidybos centras, 2010, no. 3 (7), p. 163-176.
30. Whiting, E. (1986), Return on capital employed, [in:] A Guide to Business Performance Measurements (p. 214-231). Palgrave Macmillan UK.

87
Prof. PhDr. ing. Vra Majerová, CSc., ing. Jií Sálus Czech University of Life Sciences
7 Economic and social preconditions of development in the Czech rural areas: acceleration of global influence
and local changes
Introduction 7.1
We can understand the concept of environment in the more simple mean-ing as the natural space around us. In broader sense of this concept, it can in-volve all natural surroudings (material as well as immaterial), where we live. Particular elements of environment work in various expected as well as unex-pected connections. Finally, specific environment of each village is always rep-resented by the complex of economic and social preconditions depending on landscape. We can unambiguously claim, that only balanced complementarity can be efficient in the long term. The structural stability and development of vil-lages depend on such balance. The purpose of this paper is not an evaluation of economic and social changes, but the view is narrowed to methods of land man-agement and the relationship with the environment in rural areas. The paper pre-sets the challenges for contemporary development in rural areas and of the ways enabling catching permanent changes with the use of current methodological tools as well as factual interpretation.
Shaping relation to the environment in historical context 7.2
As it is the case of all other phenomena and processes in human life, rela-tionship to the environment has changed in historic perspective. The traditional concept of farming and rural life in the late 19th century and during World War II was formed by a vital necessity rather than ecological principles and environ-mental thinking. Peasants adapted their relationship to the farmland, nature and the natural environment according to their experience and the experience of an-cestors. Proved farming methods were imitated the next generation. Traditional-ism also meant a conservative approach to novelties, numerous of them encoun-tered scepticism because of irradicating current habits – whether it was new crops, afforestation, breeding new breeds of livestock and the introduction of mineral fertilizers. However, there are also good examples of innovative think-ing and peasants varied approaches to management in others. An important ra-tionale was an economic one as family life depended on the functioning of its economy.

88
Collectivization of agriculture was a particular watershed, which meant intervention in the lives of the rural population into farming. Collectivization was an essential prerequisite for consolidating farmland concentration and spe-cialization of agricultural production. For this reason, steps to the expropriation of farmland and other property are considered as very aggressive. Consistent centralized management allowed the industrialization of agriculture, its modern-ization and specialization, without possibilities and interest in analysing the im-plications of this approach. Ideologically grounded transition to a socialist huge farms and cooperatives did not take into account any negative consequences.
Collectivization therefore meant the violent mergers of small plots of farmland into larger units, to which it would be possible to use heavy machin-ery, facilitating manual labour in crop production. The whole agricultural pro-duction was concentrated mainly in the cooperative and public sector, i.e. agri-cultural cooperatives and state farms. Private management in agriculture virtual-ly ceased to exist, after completing collectivization it comprised 0.49% of hold-ings. However, the progress that concentrated and modernized agricultural pro-duction brought about in the economic sphereas well as a gradual improvement of working conditions for agricultural workers cannot be ignored.
Large-scale socialist agriculture and its environmental consequences 7.3
Large-scale socialist agriculture did not take into consideration the long- -term environmental sustainability of agriculture. Important criteria were reve-nue growth and raising living standards. The ideological interpretation of such results did not bring any doubts about the direction of agricultural and rural de-velopment. Awareness of the potential risks of such development was perceived as an attack on socialism in general. When some of the harmful consequences of mass use of fertilizers or pesticides had already been discussed in the world [Carson 1962], they were seen as a failure rather on the side of predatory capi-talist economy than on the side of centrally planned economies.
Intensive agriculture is characterized by assembling the farmland, the re-moval of hedges and hedgerows, regulation of water flows, irrespective of their natural course and topography, demands on external inputs (especially energy), low diversity of plant species with a predominance of cereal, considerable use of mineral fertilizers, herbicides and pesticides, soil depletion, the use of heavy machinery, which damaged the structure of the soil, groundwater pollution and other offenses against the environment. For the environment, this method of farming meant a heavy burden. Elimination of such negative consequences is costly, long-term and it often brings little success.

89
Environment as a prerequisite for rural development 7.4
In a broader sense, it includes the concept of environmentalism, all natural space that surrounds us. In a narrower sense, it is an environment where we live our daily lives [Kment 2012]. In both cases, the space is formed of a plurality of elements which form expected and unexpected context. Living space and envi-ronment of each village represents a complex of unique economic, social and natural elements. Stable settlement and long-term development of the village depends on the balance of all the elements (more or less). In practice, every in-habitant of the village needs to have a secured livelihood (e.g. in the form of available jobs, in the form of a business in place, own personal economy and gardens, retirement plans, annuities, etc. or in combination with more re-sources). Every ihabitant needs social milleau where they feel safe (family, friends, neighbours, community institutions) and the natural environment sup-porting the long-term development of the community (e.g. clean air, access to drinking water, solved waste management, limited pollutants, such as landfills reasonable distance from roads etc.).
Post-socialist countries after 1989 started to gradually introduce consistent and systematic environmental protection and the application of the principles of organic agriculture. It played a big role in the implementation of the legislative requirements according to the common agricultural policy (CAP) of the Europe-an Union (EU). For sustainable development, there were important EU structural funds and in particular the implementation of policies focused on environmental protection.
The EU currently has the strictest regulations in the world in the field of environmental protection. This situation contributed to activities associated with the legislative, political and economic processes. Compared to 70 and 80 years ago, when environmental policy focused mainly on remediation, today’s policy seeks to prevent and avoid environmental damage. These efforts are clearly de-fined in the current 7th action program for the environment in 2020. Ecological problems are not geopolitically bounded. In creating this policy it is always taken into account the dual responsibility – the responsibility of the EU institutions and member states. Likewise it comes to environmental protection, which has been implemented in other EU policies (economic, agricultural, social, etc.). At pre-sent, probably the biggest challenge is represented by practical application.
The fact that such application is paying off, is evidenced by e.g. program NATURA 2000. Within this programme a network of 26,000 areas were creat-ed. The extent of these areas amounts to 20% of the EU territory. These efforts are aimed at co-existence of human activity in the context of rare natural wealth. It is estimated that the site brings value amounting to EUR 200-300 billion,

90
in terms of biodiversity, the creation of a carbon sink, flood protection and pre-venting coastal erosion. While costs associated with the operation of these areas are of around EUR 6 billion [EC Policy 2015].
These programs also affect agricultural activities and rural development. These activities are also addressed in the CAP and structural policies. Environ-mental monitoring data collected are used by the EEA (European Environmental Agency), through which there are sought plausible explanations of cause and effect in the development environment [eea.europa.eu 2015].
An important aspect of the entire environmental policy is that the econom-ic and social development of the EU and its competitiveness are always associ-ated with environmental protection. There is an effort to use fewer resources with greater efficiency – it is called green growth. It serves to ensure a sustaina-ble environmental framework for the development of the EU.
The Czech Republic had to incorporate a large portion of these policies into its national legislation in order to join the EU. But because it did not com-pletely eliminate systematic errors in the field of ecology, it is clear that there are problems with the implementation and subsequent application of this policy (as well as in other EU countries). An example might be the air quality across the EU (including the Czech Republic), which has so far failed to meet the ob-jectives outlined for reducing pollutants in the air or farmland in the Czech Re-public, whose quantity and quality goes down [CSO 2015].
For a more accurate evaluation of results of environmental policy in the EU and in the Czech Republic we can use an indicator of ecological footprint. This concept involves the measurement of natural capital necessary for human life and is expressed in global hectares (gha) per capita – the area of ecologically productive land and water areas used for the production of resources and assimi-lation of the generated waste [Rees 1992]. The Czech Republic has the biologi-cal capacity of 2.67 gha/capita, but as shown in Figure 1, the Czech Republic exceeds this capacity almost 2 gha/capita. Thus, it creates ecological deficit. If we take into account the value of 1.76 gha/capita as the average biological ca-pacity of all mankind on the planet in 2005 [WWF 2005], it would be even greater deficit of the Czech Republic. But even other EU countries are not better [Schaefer et. al. 2005].

91
Figure 1. The ecological footprint of the population of the EU 27 in 2011 (gha / capita)
Source: http://www.vitajnenaziemi.cz/cenia/index.php?p=ekologika_stopa&site=spotreba
Among the key factors that influence the amount of the deficit is the method of cultivation of the farmland. Environmental protection brings positive effects especially in the long period. However, in the short term it is counterbal-anced by the need to achieve high efficiency in agriculture and the high cost of eliminating the negative impacts of such activity.
Compared with conventional and organic farming 7.5from an economic and environmental point of view
One of the many ways of saving the environment is to promote and sup-port organic agriculture. Conventional agriculture increases the environmental burden of the country. However, organic farming on the farmland has not a long tradition in the Czech Republic and reasons are caused by legislative and social state before 1989. Although outwardly pioneered the idea of environmental pro-tection, but in agriculture we find almost no tangible evidence of such practice. In 1990, there were only two ecologically oriented farming cooperatives in the Czech Republic. However, the economic boom and competition also bring thoughts of an alternative method of management of farmland, which is also re-flected in the increasing number of organic farms. In 2013 already 11.68% of farmland was used for organic farming [Ministry of Agriculture of the Czech Republic 2013]. If we execute a comparison with the EU countries, we find that this percentage is among the highest in the EU [Eurostat 2014].
When organic farming is compared with conventional farming in terms of economic indicators e.g. the profitability or efficiency of such farms, we re-ceive the clear results and ambiguous implications. The profitability of organic

92
farms achieves higher rates in comparison with conventional farms in the Czech Republic and the EU as well [Nemes 2009; Brožová 2011; Vlašicová and Náglová 2015]. This conclusion, however, is true (and will be valid) until the share of subsidies for organic farming is higher than in the conventional farms [Gay, Offermann 2006]. When subsidy conditions are the same for both types of farming, organic farming remains economically unsustainable. Differ-ent setting of subsidy policy based on a different method of farmland manage-ment, both within the EU and also in the Czech Republic, has negative effects on the agricultural market. Subsidies have always, in addition to a supportive effect for certain industries, also the negative impact on the functioning of free market competition [Kroupová and Malý 2010]. It is also true that volumes of inputs and outputs in the case of organic farming cannot meet the demand of the population from a technical and technological point of view. This is due to lower activity influence or restriction on the use of chemical fertilizers to in-crease production, to protect against pests or to increased resistance to bacteria and diseases. In order to make evaluation more counterbalance, it is needed to refer in positive externalities of organic farming. They are generated by this method of farming and include i.e. better water retention in the landscape and maintain higher quality, restoration and improvement of farmland, alleviate or directly stop soil erosion, and generally have friendlier impact on the environ-ment of the surrounding landscape.
For the above reasons, it is clear that organic farming will never complete-ly replace conventional agriculture because the Czech society does not have enough resources. However, the current form of conventional farming, as shown in the following chapter, cannot remain unchanged, if we want to keep the farm-land for future generations in a sustainable condition.
The influence of social factors on soil quality in the Czech Republic 7.6
Recently researchers have begun to view the erosion in a different way compared to the one seen in natural and technical scientific disciplines. Stocking and Murnaghan warn that soil erosion is mainly related to the characteristics of socio-economic, political, cultural and rural environment in which the owners conduct farming [Stocking and Murnaghan 2001]. Although this view is still not stressed in research studies [Boardman 2006], it does not mean a lack of the re-lation. Only it is difficult to prove this relation using empirical data.
Development of quality farmland in the Czech Republic may serve as a good example of the impact of social processes on its state. Because before 1989, the en-tire national economy (including agriculture branch) was subordinate to central plan-ning, which in their plans was systematically assigned to environmental considera-

93
tions only sporadically. It is therefore not surprising that the quality of the farmland and state of landscape worsened near the farm activities. The process of reducing the quality of the soil has not stopped even in the nineties, at a time of deregulation of farming and settlement of property injustices through restitution [Janecek et. al. 2002]. The situation started to improve in the context of the forthcoming and subse-quent accession to the EU. The Czech implemented legislation based on the CAP. The subsidy system takes into account the preservation of the quality of land re-sources and environmental protection.
The development of land resources is also influenced by international and na-tional corporations seeking to remove farmland from the land pool. Because it allows them to develop economic activities – housing, construction of shopping centers, construction of factory buildings etc. Changes in quantity of the farmland include the transformation to forests, building road infrastructure or conversion to urban green-ery. Since 2000 more than 113,000 hectares of farmland have been withdrawn [CSO 2014]. However, it is clear that Czech society (rural and urban) yet does not enforce the creation of tools in order to stop or reverse this trend. In terms of total share of farm land over the last 25 years, it decreased by 0.9%. At first glance it seems like a minor change – not to be threatening society. Alarming in this case could be an in-creasing rate of soil loss. Until 2013 loss of farmland on average amounted to 12.8 ha per day, but in 2015 to 14 ha per day [CSO 2015].
Legislative processes affect the afforementioned quality and quantity of the soil. It is also about value systems and attitudes of individual farmers and other individuals living in the countryside. One of the factors we can consider is the bond of owners to the farmland [e.g. Low and Míchal, 2003]. A study con-ducted by Skleni[ka and his team has set a goal to verify two questions: 1. Do we observe in the Czech Republic a difference in the management of farmland between owners and tenants?; 2. Do agri-environmental instruments give differ-ent motivations to tenants and landowners in the protection of the farmland? It turned out that greater responsibility for the quality of the farmland have the owners. The owners farm on smaller stretches than tenants. It means that the owners could conduct it much easier in practice [Skleni[ka et. al. 2015]. It is a very important finding, because in the last 15 years the tenants managed on average 79% of the total farmland. It also results in an expansion of the size of cultivated areas per agricultural holding. The average size of an agricultural holding in the Czech Republic is 152 ha, while in the EU only 14 hectares. There is a large gap betweem the Czech Republic and the next country in this ranking – the United Kingdom – 90 ha and Slovakia 77 ha. On the contrary, small agricultural enterprises do farming on the farmland up to five hectares – in the Czech Republic has 15.4% compared to the EU average 60.2% [CSO 2014].

94
The influence of social factors on the business of farming 7.7in the Czech Republic
The process of change in the strategies of individual entrepreneurs in the country, as well as its own intergenerational exchange are based on changing cultural, social and business environment in the Czech countryside [Zídková et. al. 2011].
According to European Commission’s study, aging of rural population takes place across the EU leading to a decrease in the number of young farmers as well as inadequate replacement of the older generation [DGIP 2012]. Sustain-ability of the agricultural sector may be simply indicated by the age structure of entrepreneurs [Vanslembrouck et. al. 2002]. Burton directly stated that the age structure of members of farming families (who are working) may be one of the key indicators for assessing the future of agricultural sector [Burton 2006].
The problem also lies in the changing strategies of young farmers. Today’s young farmers (successors to the older generation) feel more as entrepreneurs and are focused primarily on the diversity of their business and on profitability [Grubbstrom et al. 2014]. This approach leads to the fact that the succession pro-cess is successful mostly in cases of farms with higher profits and economic bene-fits than other values [van Passel et al. 2007]. Thus the strategy chosen by young farmers is derived from the selection of business model [Zott and Amit 2008] and this selection is related to the size of the farm. Small farms with a single owner-ship structure, take not only in their busineses into account their own meet de-mand, but they involve especially the relationship between the owner of the farm itself and the actual environment in which the farm is located. On the contrary, large farms must prefer more strictly economic indicators in their commercial election priorities (e.g. the size of demand, market share, knowledge competition etc.) [Poláková et. al. 2015]. Unfortunately mentioned phenomena together with other create a tendency toward diminishing number of farmers, enlarging the ex-isting farms and the abandonment of outlying regions [Raggi et. al. 2013].
Opinions and attitudes of the population concerning the environment 7.8
The attitudes of the population towards environmental protection are not entirely clear and shape gradually. Although nobody refuses the principles of a healthy and varied diet, spatial and price affordability of high-quality agricul-tural products still plays a significant role as well as advertising, fashion trends, nutrition etc. Sorting of waste is perceived as a positive trend and more and more households and institutions support this activity. Regulations and standards relate to the discharge of pollutants into the air when the heater is tightened for households and manufacturing businesses.

95
All these things are perceived by the public. In its opinion, in the last 10 years appears a distinct shift. Positive assessment of the environment in the Czech Republic is growing in comparison with other European countries.
Table 1. Evaluation of the environment in the Czech Republic in comparison
with other EU countries, 2006 -201327 Environment Much
better Rather better
Rather worse
Much worse
Same Don’t know
% CR 2006 1 32 43 8 13 2
2007 2 34 41 10 12 1 2008 3 40 47 5 - 5 2009 3 40 48 6 - 3 2010 3 40 44 9 - 4 2011 3 42 42 8 - 5 2012 3 42 42 8 - 5 2013 3 37 44 12 - 4
Average EU25/27/28*
2006 8 40 25 8 11 9 2007 7 36 26 13 10 8 2008 6 42 32 9 - 11 2009 6 42 32 10 - 10 2010 6 44 30 10 - 10 2011 9 44 28 10 - 9 2012 9 44 28 10 - 9 2013 9 43 29 10 - 9
* The figures in the table are presented in the EU25, 2005-2006, for the EU27 for 2007- -2012 and for the EU28.
Source: http://www.vitajnenaziemi.cz/cenia/index.php?p=ekologika_stopa&site=spotreba
Household behaviour is somewhat different, reflecting in particular their economic thinking. While the handling of hazardous waste and sorting of all waste receive support by growing share of the population, buying organic foods is decreasing. Because the price of organic foods is significantly higher, there-fore majority of households avoid buying them. Overall, somewhat increases the proportion of people buying and thinking of environmental regards, there are always numerous households ignoring them. Saving energy and water are slow-ly increasing, but the decisive factor is again the economic point of view, rather than environmental. Thus, we can assumed that in the future that education will play a big role. But human behaviour will be determined by the economic bene- 27 Respondents answered question: “For each of the following field , please tell me whether you think the situation in the Czech Republic is better or worse in comparison with the situa-tion in other EU countries”.

96
fits. Environmental improvements must be promoted with a certain degree of economic stimulus.
Table 2. Relationship of Czech households environmentally 2006-201328
Environment 2006 +/-
2007 +/-
2008 +/-
2009 +/-
2011 +/-
2012 +/-
2013 +/-
% Give, assort dangerous
waste
71/18 72/20 71/21 75/19 74/22 76/18 80/16
Assort com-mon waste
76/23 78/21 81/18 80/18 82/18 82/17 83/16
Buy bio-food – – 12/82 11/85 12/85 10/83 13/84
Environmental decision to buy
the products
32/54 34/55 29/59 29/61 27/64 26/62 28/64
Reduction in motoring to protect en-
vironment
17/57 15/57 12/61 13/64 17/65 19/59 20/62
Save energies and water to protect
environment
48/46 53/44 48/48 47/50 40/48 57/43 53/44
Source:http://cvvm.soc.cas.cz/media/com_form2content/documents/c1/a7252/f3/oe140617.pdf
Conclusion 7.9
Czech society (including rural population) has never been homogeneous. We can connect development of rural society at every stage to a certain general-ization. This relationship was dominantly determined by: before 1948 – not in-dustrious technology and apparent uselessness of taking care for environmental protection; after 1948 – the loss of property rights to the farmland and ignoring the ecological treatment of landscape; after 1989 – liberalization without much more pressure on a responsible attitude towards the surrounding countryside; or
28 Respondents answered a question: “Regarding your household a) check in, sort hazardous waste; b) sort ordinary waste; c) buy organic food; d) checking when buying products (e.g. washing powder) whether they are environmentally friendly, e) limit drive in order to protect the environment; f ) saving energy and water in order to protect the environment?” Plus refers to the sum of answers “always” or “often” , minus the sum of responses “rarely” or “never”. Recalculation to 100% is the answer “do not know” and “not applicable”.

97
at the time of entry into the EU – adopting the EU rules, which have ecological behaviour of society as a fundamental pillar of the EU.
Social changes and changes in social and economic environment led to changes in handling the soil and greater diversification in the change of life val-ues for individuals. On one hand, it reflects the increasing share of organic farmers, which is already comparable to the EU. On the other hand, the percep-tion of the farmland as a mere tool for economic profit. The entrepreneurial mindset leads to the fact that the positive externalities associated with organic farmers are of interest only until the subsidies ensure different level of profit compared to conventional agriculture. In conventional farming business ap-proach is reflected in an increase in the size of the cultivated land without prop-erty rights. It makes farmers less responsible for the quality of such farmland. Furthermore, the fact that landowners are not interested in farming on this land, they can easily succumb to pressure of international and national companies to exclude this land from the agricultural land fund. Prioritizing economic interests then reduces the scope for environmental protection, although, as shown by the Natura 2000 program, also organic can become economic.
Czech society has slowly appreciated the need to protect the environment, e.g. in the field of waste sorting and reducing the energy consumption of their households, reported positive results. However, there is a difference between declaration and action of the Czech population. On one hand, ecological ap-proach is declared in other areas, including support for regional brands, organic food, reduction of carbon emissions etc. and on the other hand in case of deci-sions about the consumption of services and products, preffered is the choice based on price and not on the basis of the burden on the environment.
It is therefore questionable whether further social change will have to happen to make farmers understand the management of farmland, beyond mere economic activity. There is also the question of individual consumers and their willingness to recognize the broader consequences of their behaviour that cre-ates an ecological deficit. The actual implementation of the EU legislation into national law is only a helper but not an instrument for such change. Only the consistent application of those rules combined with the constant support for bot-tom-up approach, involving the relationship of the individual and the communi-ty to the place of residence, can bring better results, both in environmental pro-tection and in mitigating the negative impacts of agricultural activities.

98
References
Boardman J., 2006. Soil erosion science: reflections on the limitations of current approaches. Catena, 68 (2), p. 73-86.
Brožová I., 2011. The economic performance analysis of organic farms in the Czech Republic. Agricultural Economics, 57, 5, p. 240-246.
Burton R.J., 2006. An alternative to farmer age as an indicator of life-cycle stage: the case for a farm family age index. J. Rural Stud. 22, p. 485-492.
Carson R., 1962. Silent Spring, Houghton Mifflin, USA. DGIP (Directorate-General for Internal Policies), 2012. EU Measures to
Encourage and Support New Entrants. In: Policy Department B Structural and Cohesion Policies. Agriculture and Rural Development. Available at: http://www.europarl.europa.eu/RegData/etudes/note/join/2012/495830/IPDL-AGRI_NT(2012).
Gay S.H., Offermann F., 2006. Comparing support for organic and con-ventional farming in the European Union using an adjusted producer support estimate. European Review of Agricultural Economics, 33, p. 31-48.
Grubbstrom A., Stenbacka S., Joosse S., 2014. Balancing family traditions and business: gendered strategies for achieving future resilience among agricul-tural students. J. Rural Stud. 35, p. 152-161.
Jane[ek M., Bohuslávek J., Dumbrovsky M., Gergel J., Hrádek F., Ková� P., Kubátová E., Pasák V., Pivcová J., Tippl M., Toman F., Tomanová O., Váška J., 2002. Ochrana zem\d\lské pudy p�ed erozí. ISV, Praha.
Kment P., 2012. Environmentální rozm\r rozvoje venkova a region�, p. 48- -53, Melandrium, Praha, stran 104.
Kroupová Z., Malý M., 2010. Analysis of agriculture subsidy policy tools – application of production function. Politická ekonomie, 6, p. 774-794.
Low J., Míchal I., 2003. Krajinný ráz. Lesnická práce, Kostelec nad �ernými lesy.
Nemes N., 2009. Comparative analysis of organic and non-organic farm-ing systems: a critical assessment of farm profit ability. Food and Agriculture Organization of the United Nations, Rome.
Passel S. van, Nevens F., Mathijs E., Van Huylenbroeck G., 2007. Meas-uring farm sustainability and explaining differences in sustainable efficiency. Ecol. Econ. 62, p. 149-161.
Poláková J., Kolá[ková G., Tichá I., 2015. Business Model for Czech Ag-ribusiness, Scientia Agriculturae Bohemica; CULS; 46/03; p. 128-138.
99
Raggi M., Sardonini L., Viaggi D., 2013. The effects of the Common Ag-ricultural Policy on exit strategies and land re-allocation. Land Use Policy 31, p. 114-125.
Rees W.E., 1992. Ecological footprints and appropriated carrying capaci-ty: what urban economics leaves out, Environment and Urbanisation 4 (2): p. 121-130; DOI: 10.1177/095624789200400212.
Skleni[ka P., Jane[ková-Molnarová J., Salek M., Simova P., Vlasak J., Sekac P., Janovska V., 2015. Owner or tenant: Who adopts better soil conserva-tion practices?, Crossmark; Journal Land Use Policy, p. 257-269.
Stocking M., Murnaghan N., 2001. Handbook for the Field Assessment of Land Degradation. Earthscan, London.
Vanslembrouck I., Van Huylenbroeck G., Verbeke W., 2002. Determi-nants of the willingness of Belgian farmers to participate in agri-environmental measures RID F-8373-2010. J. Agric. Econ. 53, p. 489-511.
Vlašicová E., Náglová Z., 2015. Differences In The Financial Manage-ment of Conventional, Organic, And Biodynamic Farms, Culs; Scientia Agricul-turae Bohemca, 46/03, p. 106-111.
WWF, 2005. Europe 2005 The Ecological Footprint. World Wide Fund for Nature (WWF) European Policy Office, Brussels, Belgium.
Zídková D., �ezbová H., Rosochatecká E., 2011. Analysis of develop-ment of investments in the agricultural sector of the Czech Republic. AGRIS on-line Papers in Economics and Informatics, 3, p. 33-43.
Zott C., Amit R., 2008. The fit between product market strategy and busi-ness model: implications for firm performance. Strategic Management Journal, 29, 26. DOI:10.1002/smj.642.
Centrum pro výzkum ve�ejného mín\ní, Sociologický ústav AV �R, v.v.i., 2014. Chování domácností a hodnocení stavu životního prost�edí. Access: http:// cvvm.soc.cas.cz/media/com_form2content/documents/c1/a7252/f3/oe140617.pdf
Czech Statistical Office (CZO), 2014. V �em je [eské zem\d\lství jiné? Access: http://www.statistikaamy.cz/2014/07/v-cem-je-ceske-zemedelstvi-jine/
European Committee, 2015. Politiky EU – Ochrana životního prost�edí Access: http://europa.eu/pol/env/index_cs.htm
European Environmental Agency, 2015. Access: eea.europa.eu Eurostat, 2014. Organic farming statistics. Access: http://ec.europa.eu
/eurostat/statistics-explained/ index.php/Organic_farming_statistics Ministry of Agriculture of the Czech Republic, 2013. Zelená zpráva –
Green report. Access: http://eagri.cz/public/web/mze/ministerstvo-zemedelstvi/ vyrocni-a-hodnotici-zpravy/zpravy-o-stavu-zemedelstvi/

100
Schaefer F., Luksch U., Steinbach N., Cabeça J., Hanz J., 2005. Ecologi-cal footprint adn biocapacity. Access: http://ec.europa.eu/eurostat/documents/ 3888793/5835641/KS-AU-06-001-EN.PDF
Vítejte na zem, 2015. Ekologická stopa Access http://www.vitejtenazemi. cz/cenia/index.php?p=ekologicka_stopa&site=spotreba
Vítejte na zem, 2015. Kvalita života Access: http://www.vitejtenazemi.cz/ cenia/index.php?p=kvalita_zivota&site=spotreba

101
Dr Teodora Stoeva, dr Ekaterina Valcheva Agricultural University – Plovdiv, Bulgaria
8 Impact of economics and agriculture over the environmental protection in Bulgaria
Introduction 8.1
The efficient use of land resources is of crucial importance for the sus-tainable development of Bulgaria. Agriculture is and should remain the main link between people and environment. Like any human or economic activity, agriculture has an impact on the environment and its individual elements.
The negative effects on the environment associated with the excessive use of fertilizers in agriculture, more particularly the use of nitrogen fertilizers in an unbalanced way, are expressed in acidification of buffer soils, contamination of surface water and groundwater by nitrates, nitrites, etc. The most significant sources of adverse impact on environment are the consumption of energy and natural resources by economic sectors and the emissions of harmful substances into the air, water and soil as well as landfill of waste.
Despite the reduction of energy intensity achieved by 2012 in comparison with 2005, with 22.4%, the end energy intensity of Bulgaria remains one of the highest among the EU Member States which means that considerable efforts will be needed to achieve the objective by 2020 for reducing the country’s ener-gy intensity by 50% compared to the value in 2005.
Material and methods 8.2
A positive trend is the significant increase in 2012-2013 of the production and consumption of energy from renewable sources in Bulgaria and we have exceeded the mandatory national target (for 2020) of 16% share of energy from renewable sources in gross end consumption of energy in the country according to the requirements of Directive 2009/28/EC.
Results and discussions 8.3
In 2013, there was again a decrease in the end energy consumption which reached 5% in comparison with the previous year, 2012. Nevertheless, power engineering remains the largest source of emissions of sulfur dioxide and nitro-gen oxides and plays a key role in the formation of greenhouse gases (GHG) in the country. Thermal power plants have emitted 72% of the total amount of sul-fur dioxide emitted in the country.

102
The energy sector (burning of fuels mainly from power engineering and in transport) emitted 74.0% of the aggregated GHG emissions for the last year of inventory – 2013. The largest share of aggregated GHG emissions in the sector belongs to CO2 emissions – 96.8% of the emissions of the sector. In 2000-2013, the share of transport in the end consumption of fuels and energy increased from 21.5% to 30.3%. Road transport is the main consumer – in 2013 it consumed 92.2% of the total amount of energy used in the sector.
In 2013, for the first time an increase was registered in the consumption of biofuels in the transport sector, unlike during the previous 5 years. The share of biodiesel in the total consumption of diesel fuel in road transport in 2013 was 7.17%, while in 2011 it was only 1.13%. Domestic heating is a major source of total dust and fine particulate matter (FPM10) emitting 59% of the total quantity emitted into the atmosphere.
The main atmospheric pollutants emitted by agriculture are ammonia (90%) and non-methane volatile organic compounds – 8% of national emissions. Agricul-ture is also a source of greenhouse gases. The processes and activities in this sector are sources mainly of CH4 and N2O. In 2012-2013, the emissions from the agricul-tural sector represented 10.4% of Bulgaria’s total emissions of greenhouse gases. The emissions of methane (CH4) were 26.4% of the total emissions of CH4, and of nitrous oxide (N2O) – 88.1% of the total N2O emissions in 2012.
FPM10 pollution is a major problem for the quality of air in all areas of assessment and management of ambient air quality. This tendency has prevailed in recent years. The percentage of population living in levels of FPM10 pollu-tion above the permissible concentrations – 89.55%, still remains high. The largest number of exceedances of Daily Average Values (DAV) for the country was again measured in Pernik, Vidin, Dimitrovgrad, Plovdiv – the situation was exactly the same as in 2011.
Compared to other European countries, Bulgaria has relatively significant fresh water resources, both in absolute volume and per capita. The fresh water re-sources of Bulgaria are estimated at 105.45 billion m3 per year, including the re-source of the Danube River (long-term average 1961-2011). They are distributed unevenly throughout the country. The fresh water resources of Bulgaria are about 14 thousand m3/year average per capita (including the resource of the Danube River), which puts the country among the top 10 European countries. At the same time, Bul-garia takes one of the leading positions in water abstraction average per capita and it is among the European countries which rely primarily on surface water sources – due to significant water volumes used for cooling in power engineering. Annually about 60%, on average, of the water abstraction in the country are used for cooling pro-cesses in energy generation, which are returned after use to the water sources.

103
The pressure on water resources measured by using the exploitation index at national level is below 10%, i.e. water abstraction in Bulgaria does not cause stress to aquatic ecosystem. In 2000-2011, exploitation index was between 5.5% and 6.6% and in 2012 it was valued at 5.4%.
On average about 79% of the total water used in economy (2000-2013) were discharged to the water bodies or public sewage system. About 51% of the wastewater produced by households was discharged to the public sewage system connected to urban wastewater treatment plants. About 57% of the generated industrial wastewater was treated on the spot or in urban wastewater treatment plants (UWWTP).
Agricultural activity is considered to be a “diffuse source pollution” of waters and it includes breeding of domestic animals, pastures, plowing, use of pesticides, irrigation, fertilization, sowing and harvesting. Agricultural activity also has an adverse effect on aquatic ecosystems and river basins. The impact of agriculture on surface water and groundwater may be reduced by taking the ap-propriate measures to reduce diffuse pollution.
During the period of 1996-2013 the tendency for improvement of the quality of surface water, observed in recent years, continued. Despite this tendency there are still certain water bodies at risk, so in order to improve their condition pro-grammes have been drawn up so as to achieve a better environmental status.
Medium-term tendencies in 2006-2013, showed relative improvement of the situation in the northern coastal waters from Krapets to Galata and relative decrease in the status along the central and southern coast, from the Kamchia River to the Rezovo River. Despite the positive short-term tendencies the major-ity of water bodies have not yet achieved the objectives for good environmental status. The ecological status of the Kamchia River remains critical as well as some areas in Varna and Burgas Bays.
In 2008-2013, there was a lasting tendency for an increase in the area oc-cupied by arable land and decrease in uncultivated land. For 2007-2013, the structure of usable land in Bulgaria was varied. In 2013, the utilized agricultural area was 45.0% of the territory of the country and 95% of the areas with perma-nent agricultural use, and in comparison with 2012 it decreased by 1.2%. Uncul-tivated land occupied 2.4% of the territory of the country and decreased by 94,541 ha (26.4%) in comparison with the previous year.
In 2005-2013, soils in the country were in good environmental state in terms of reserve of nutrient elements/ organic matter as well as in terms of con-tamination with heavy metals, metalloids and persistent organic pollutants: pol-yaromatic hydrocarbons (PAH), polychloride biphenyls (PCB) and chloro-organic pesticides.

104
Soil acidification is due to emissions from industrial processes and natural biochemical cycles, and with regard to arable soils we can also add to these two the one-sided fertilization (without phosphorus and potassium) with nitrogen fertilizers. A major factor for soil acidification in Bulgaria is the one-sided ferti-lization with nitrogen fertilizers. The share of soils with acid reaction is about 1,500,000 ha of the arable land, or approximately 11% of the arable area.
In 2010-2013, the annual soil loss by water erosion remained unchanged. In comparison with the previous year, the areas at erosion risk and soil losses were slightly reduced. In 2007-2013, the soil losses from wind erosion remained relatively constant. In comparison with the previous year, there was a slight in-crease both in areas under risk of wind erosion and areas under risk of soil loss.
Agriculture affects the quality of soil primarily by improperly conducted agricultural activities or by absence of such. In recent years, the quantities of mineral fertilizers and plant protection products have been greatly reduced com-pared to the years before 1990, therefore the possibilities for acidification and pollution are greatly reduced.
Figure 1. Susceptibility of Bulgarian soils to erosion by classes
Source: National Report on the state of environment and water, Ministry of Environment and Water, 2013.
In 2013, there was a slight increase in fertilized areas in comparison with 2012. The areas fertilized with nitrogen in 2013 were by 7% larger in compari-son with 2012. In 2013 the areas fertilized with phosphatic fertilizers were by
Class 0 Class 1 Class 2 Class 3 Class 4 Class 5 Class 6

105
11% larger compared to 2012. In 2013, there was an increase in the amount of manure used in the production of fruit and vegetables – 30% more compared to 2012 and the areas fertilized with manure were by 23% larger.
By 31 December 2013, on the territory of the country there were 285 warehouses registered for storage of banned or unfit for use pesticides, 1960 BB cubes and 72 centralized warehouses located in 304 towns and cities. In 2000-2013, some positive tendencies were identified in terms of the whole pro-cess of management of warehouses for banned or unfit for use plant protection products and the areas around them.
Conclusion 8.4
In the very first years after its accession to the EU, Bulgaria has began to apply the single farm payment in the form of a single payment per area (per ha), which is bound by the requirements to maintain the land in good agricultural and environmental status. In this regard, Bulgaria has prepared its minimum re-quirements, taking into account the specific characteristics of the region (soil and climatic conditions, structure of farms, existing practices, etc.).
In accordance with the European plan for development of organic produc-tion Bulgaria has initiated the development of a strategy and national action plan for development of organic farming. The following strategic objectives have be-en defined: � Development of the internal market of organic products; � 8% of the utilized agricultural land to be managed using the methods of or-
ganic production for 2013; � Scientific research in the field of organic farming to be oriented towards
practice, to build a system of education, training and consulting services in the field of organic farming.
� To establish an effective system of control and certification of organic products.
References
1. National Report on the state of environment and water, Ministry of Environ-ment and Water, 2013.
2. National Report on the state of environment and water, Ministry of Environ-ment and Water, 2012.
3. National Environmental Strategy, 2010. 4. Project BG2004/016-715.02.01-07 “Cross-Border Agribusiness – The New
Chance for Economic Development of the Region of Yambol – Edirne – Kirklareli”, Ecology in agriculture and protection of water and soil, 2007.

106
Dr Agata Sielska, mgr Aleksandra Paw�owska Instytut Ekonomiki Rolnictwa i Gospodarki �ywno�ciowej – PIB, Warszawa
9 Wp�yw programów rolno�rodowiskowych jako instrumentów polityki na warto�� dodan� w polskich
gospodarstwach rolnych
Wst�p 9.1
Celem pracy jest zbadanie wp�ywu programów rolno�rodowiskowych na zró�nicowanie warto�ci dodanej w polskich gospodarstwach rolnych. Zale�no�� mi�dzy otrzymywaniem dop�at w ramach programów rolno�rodowiskowych a typem rolniczym i wielko�ci� ekonomiczn� gospodarstwa analizujemy w kontek�cie warto�ci dodanej w polskich gospodarstwach rolnych.
Cz�sto wskazuje si�, �e rozwój rolnictwa i obszarów wiejskich powinien by� oparty na zgodnym ��czeniu celów �rodowiskowych i ekonomicznych. Po-dej�cie to wi��e si� z potrzeb� „stymulowania wzrostu gospodarczego (konku-rencyjno�ci), jednak przy rozdzieleniu wzrostu i degradacji �rodowiska (decou-pling), integralnym (mi�dzysektorowym) podej�ciu do rozwi�zywania proble-mów zwi�zanych z takim rozwojem, akcentowaniu wymiaru spo�ecznego (zdrowia i bezpiecznej �ywno�ci), w��czaniu w urzeczywistnianie koncepcji zrównowa�onego rozwoju wszystkich poziomów zarz�dzania i szerokich kr�-gów spo�ecznych” [Zegar 2009, s. 13]. Nie oznacza ono negacji celów ekono-micznych indywidualnych producentów, a raczej ��czenie ich z d��eniami o odmiennym charakterze, m.in. spo�ecznym b�d@ ekologicznym [Krasowicz i Oleszek 2013, s. 13].
System zrównowa�onego gospodarowania i racjonalnego wykorzystywa-nia zasobów przyrody jest promowany przez instrumenty polityki rolnej. Ponie-wa� przek�adaj� si� one na sytuacj� finansow� producenta rolnego, mog� przy-czyni� si� do uwolnienia cz��ci oszcz�dno�ci i skierowania ich na dodatkowe dzia�ania inwestycyjne, modernizacyjne b�d@ szkoleniowe, podnosz�ce efek-tywno�� gospodarowania oraz przysz�y oczekiwany dochód, które mog�yby nie zosta� podj�te w sytuacji, gdyby gospodarstwo nie otrzyma�o wsparcia. Mo�na zatem oczekiwa�, �e ich efektem mo�e by� wzrost warto�ci dodanej wypraco-wanej przez danego producenta. Z drugiej strony, zale�no�� mi�dzy wsparciem a efektywno�ci� mo�e by� substytucyjna [por. Bezat-Jarz�bowska, Rembisz i Sielska 2013].

107
W pracy odniesiono si� do trzech rodzajów dop�at. Pierwszym by�o wsparcie udzielane producentom gospodaruj�cym w warunkach niekorzystnych. Idea takiego wsparcia ma d�ug� histori�, a wdra�ane p�atno�ci maj� na celu "re-kompensowa� dodatkowe koszty rolników oraz utracone dochody zwi�zane z trudnymi warunkami dla produkcji rolniczej" [Kutkowska i Berbeka 2014, s. 57] oraz przyczyni� si� „do utrzymania terenów wiejskich oraz utrzymania i wspierania zrównowa�onych systemów rolniczych” [Rozporz�dzenie Rady (WE) nr 1698/2005, par. 33]. Beneficjent podejmuje zobowi�zanie prowadzenia dzia�alno�ci rolniczej na gruntach rolnych, na które uzyska� pomoc przez okres co najmniej 5 lat. W kontek�cie zrównowa�onego rozwoju obszarów wiejskich istotn� rol� odgrywa� powinny równie� p�atno�ci rolno�rodowiskowe poprzez „wprowadzanie lub dalsze stosowanie metod produkcji rolnej zgodnych z ochron� i popraw� stanu �rodowiska naturalnego, krajobrazu i jego w�a�ciwo-�ci, zasobów naturalnych, gleby i ró�norodno�ci genetycznej” [Rozporz�dzenie Rady (WE) nr 1698/2005, par. 35]. Ostatnim z uwzgl�dnionych w pracy rodza-jów wsparcia s� dop�aty za dostosowanie gospodarstw rolnych do standardów UE, do us�ug doradztwa rolniczego, poprawy jako�ci produktów rolniczych, szkole, zalesiania i zachowania równowagi ekologicznej �rodowiska le�nego.
G�ównym celem pracy jest zbadanie, czy programy rolno�rodowiskowe istotnie wp�ywaj� na zró�nicowanie warto�ci dodanej w polskich gospodar-stwach rolnych. W przypadku twierdz�cej odpowiedzi, podj�ta zostanie próba okre�lenia, czy wp�yw ten ró�ni si� w zale�no�ci od typu rolniczego lub klasy wielko�ci ekonomicznej gospodarstwa oraz czy wy�sze dotacje w ramach pro-gramów rolno�rodowiskowych maj� odzwierciedlenie w �rednio wy�szym po-ziomie warto�ci dodanej.
Zbadane zostan� nast�puj�ce podstawowe hipotezy: � dop�aty rolno�rodowiskowe ró�nicuj� warto�� dodan� w polskich gospodar-
stwach rolnych; � dop�aty do obszarów o niekorzystnych warunkach gospodarowania ró�nicuj�
warto�� dodan� w polskich gospodarstwach rolnych; � dop�aty za dostosowanie gospodarstw rolnych do standardów UE ró�nicuj�
warto�� dodan� w polskich gospodarstwach rolnych.
�ród�a danych i metodologia 9.2
Do weryfikacji wp�ywu programów rolno�rodowiskowych na warto�� do-dan� w gospodarstwach rolnych pos�u�ono si� danymi dotycz�cymi 111,114 tys. polskich gospodarstw rolnych uczestnicz�cych w FADN, które w 2012 r. otrzy-ma�y dop�aty w ramach programów rolno�rodowiskowych. Tabela 1 zawiera zbiorcze zestawienie zmiennych wykorzystanych w przeprowadzonej analizie.

108
Tabela 1. Charakterystyka zmiennych wykorzystanych w modelu
Nazwa zmiennej Symbol
zmiennej wg FADN
Rodzaj zmiennej Charakterystyka
warto��_dodana SE410 Zmienna ci�g�a
Produkcja ogó�em pomniejszona o zu�ycie po�rednie oraz skorygowana o saldo dop�at i podatków dotycz�cych dzia�alno�ci opera-cyjnej.
dopl_srodowiskowe SE621 Zmienna binarna
Zmienna przyjmuj�ca warto�� 1, gdy go-spodarstwo rolne otrzyma�o dop�aty rolno-�rodowiskowe lub 0, gdy ich nie otrzyma�o.
dopl_onw SE622 Zmienna binarna
Zmienna przyjmuj�ca warto�� 1, gdy go-spodarstwo rolne otrzyma�o dop�aty do ob-szarów o niekorzystnych warunkach gospo-darowania lub 0, gdy ich nie otrzyma�o.
dopl_inne SE623 Zmienna binarna
Zmienna przyjmuj�ca warto�� 1, gdy go-spodarstwo rolne otrzyma�o inne dop�aty do rozwoju obszarów wiejskich (np. dop�aty za dostosowanie gospodarstw rolnych do stan-dardów UE) lub 0, gdy ich nie otrzyma�o.
typ_gospodarstwa TF8 Zmienna nominalna
Typ rolniczy gospodarstwa zgodnie z typo-logi� FADN
klasa_ekonomiczna ES6 Zmienna porz�dkowa
Klasa wielko�ci ekonomicznej gospodar-stwa rolnego zgodnie z typologi� FADN29
!ród�o: opracowanie w�asne na podstawie [Floria�czyk i in., 2013].
Do zbadania wp�ywu programów rolno�rodowiskowych na zró�nico-wanie warto�ci dodanej w polskich gospodarstwach rolnych zastosowano analiz� wariancji30. Analiza wariancji, opracowana przez Fishera [1925], po-zwala oceni� wp�yw czynnika klasyfikuj�cego �� o � poziomach na rozk�ad zmiennej � mierzonej na skali co najmniej przedzia�owej. Celem metody jest zbadanie istotno�ci ró�nic pomi�dzy �rednimi warto�ciami zmiennej zale�nej dla prób odpowiadaj�cych poziomom zmiennej klasyfikuj�cej. Pozwala to rozstrzygn��, czy zró�nicowanie obserwacji ze wzgl�du na zmienn� zale�n� wynika ze zró�nicowania grup czynnika klasyfikuj�cego, czy te� ze zró�ni-cowania wewn�trz tych grup.
29 W badaniu nie uwzgl�dniono gospodarstw o specjalizacji „winnice”. 30 Nale�y podkre�li�, i� zastosowanie narz�dzi analizy wariancji nie uprawnia do wnioskowa-nia o wp�ywie czynników klasyfikuj�cych na zmienn� zale�n� w sensie przyczynowo- -skutkowym, a jedynie pozwala na stwierdzenie ewentualnego wyst�powania statystycznie istotnych ró�nic w �redniej zmiennej zale�nej w podgrupach wyznaczonych przez kategorie czynników klasyfikuj�cych.

109
Podstawow� form� tej metody jest jednoczynnikowa analiza wariancji. Rozwa�a si� wówczas wyst�powanie tylko jednej zmiennej opisuj�cej kategorie czynnika kontrolowanego. Weryfikowana jest hipoteza zerowa:
��� � ! � " � #
gdzie: $% – �rednia zmiennej zale�nej w i-tej grupie wyznaczonej przez zmienn� klasyfi- kuj�c�, wobec hipotezy alternatywnej
�� ~��& w której przyjmuje si�, �e wyst�puj� statystycznie istotne ró�nice mi�dzy
�rednimi warto�ciami zmiennej zale�nej w grupach wyznaczonych przez zmien-n� klasyfikuj�c�. W celu weryfikacji hipotezy o braku istotnych ró�nic warto�ci zmiennej � mi�dzy poszczególnymi grupami rozbija si� ca�kowit� wariancj� na addytywne sk�adowe odnosz�ce si� do zmienno�ci mi�dzygrupowej i wewn�trz-grupowej, a nast�pnie oblicza si� statystyk� testuj�c� postaci:
' � ()(* � � +,-. / ,-0! � 1.#. � � +,.� /,-.0!23
� #.
� 1 / 44 / 5
gdzie: 67, 68 – odpowiednio: zmienno�� mi�dzygrupowa i wewn�trzgrupowa, 9% – liczba obserwacji w :-tej grupie, 9 – liczba obserwacji niezale�nie od ich przynale�no�ci do grup wyznaczonych kategoriami czynnika, � – liczba poziomów zmiennej klasyfikuj�cej.
Statystyka testuj�ca ma rozk�ad ; Snedecora z liczb� stopni swobody
� / 5 oraz 9 / �. Je�eli warto�� statystyki testuj�cej ; jest wi�ksza b�d@ równa warto�ci krytycznej ;< odczytanej z tablic rozk�adu ; Snedecora, to hipotez� zerow� nale�y odrzuci� na rzecz hipotezy alternatywnej, a zatem efekt danego czynnika jest istotny. W przeciwnym wypadku wszystkie grupy uznaje si� za równowa�ne z punktu widzenia otrzymanych warto�ci badanej cechy.
W zastosowaniach metody analizy wariancji zachodzi nieraz potrzeba klasyfikacji wyników obserwacji wed�ug kilku czynników jednocze�nie. Przyj-muje si� wtedy, �e na realizacj� badanej zmiennej mo�e wp�ywa� dwa lub wi�-cej niezale�nych czynników daj�cych sumuj�ce si� efekty. Liczba weryfikowa-nych hipotez zerowych odpowiada liczbie czynników oraz liczbie mo�liwych

110
interakcji mi�dzy nimi. W przypadku rozpatrywania wp�ywu = czynników na zmienn� zale�n�, wariancja ca�kowita dzielona jest na = > 5 sk�adników, gdzie = sk�adowych odpowiada wariancjom mi�dzygrupowym zwi�zanym z czynnika-mi, za� ostatnia sk�adowa odpowiada wariancji wewn�trzgrupowej. Dla ka�dego z czynników obliczana jest statystyka testuj�ca ;, która ma rozk�ad ; Snedecora o �% / 5 oraz ? +�% / 50@% stopniach swobody, gdzie �% oznacza liczb� pozio-mów :-tego czynnika. Otrzymane warto�ci statystyki ; przyrównuje si� do od-powiadaj�cych im warto�ci krytycznych ;<. Je�eli warto�� statystyki testuj�cej jest wi�ksza b�d@ równa warto�ci krytycznej wnioskuje si� o istotnym wp�ywie danego czynnika (lub interakcji czynników) na badane zjawisko.
Stosowanie analizy wariancji mo�liwe jest przy spe�nieniu okre�lonych za�o�e [Rozmus 2012, s. 104, 113], którymi s�: � pomiar zmiennej zale�nej na skali co najmniej przedzia�owej; � niezale�no�� zmiennych klasyfikuj�cych (w przypadku wieloczynnikowej
analizy wariancji); � normalno�� rozk�adu zmiennej zale�nej w grupach wyznaczanych przez po-
ziomy uwzgl�dnianych czynników; � jednorodno�� wariancji zmiennej zale�nej w grupach wyznaczanych przez
poziomy uwzgl�dnianych czynników. Za�o�enia te oraz zasadno�� stosowania w badaniu analizy wariancji zo-
stan� krótko przedyskutowane poni�ej. Ze wzgl�du na ograniczon� obj�to�� pracy nie przedstawiono szczegó�owych wyników przeprowadzonych testów.
Zmienna zale�na okre�laj�ca warto�� dodan� brutto wytworzon� w pol-skich gospodarstwach rolnych ma rozk�ad ci�g�y, dlatego pierwsze za�o�enie analizy wariancji uznano za spe�nione.
W kolejnym kroku, odnosz�c si� do za�o�enia drugiego, zbadano nieza-le�no�� rozpatrywanych czynników klasyfikuj�cych. Dla zmiennych odnosz�-cych si� do dop�at oraz klasy wielko�ci ekonomicznej sprawdzono warto�ci wspó�czynników korelacji odpowiednio tetrachorycznej i polichorycznej. Wów-czas zmienne binarne lub porz�dkowe traktowane s� jako ukryte zmienne ci�g�e o rozk�adzie normalnym [Divgi 1979; Ple�niak 2009]. Warto�ci poszczególnych wska@ników korelacji (najwy�sza warto�� bezwzgl�dna wspó�czynnika równa 0,318) wskazuj� na s�ab� korelacj� mi�dzy wybranymi rodzajami dop�at, jak i mi�dzy poszczególnymi dop�atami a klas� wielko�ci ekonomicznej gospodar-stwa rolnego. Ze wzgl�du na nominalny charakter zmiennej odnosz�cej si� do typu rolniczego gospodarstwa, stopie zale�no�ci typu rolniczego gospodarstwa od pozosta�ych zmiennych klasyfikuj�cych okre�lono na podstawie warto�ci wspó�czynnika V Cramera [Jó@wiak i Podgórski 2006, s. 340]. W przypadku zwi�zków typu rolniczego a kolejnych dop�at i klasy wielko�ci ekonomicznej

111
warto�� wspó�czynnika V Cramera nieprzekraczaj�ca 0,338 �wiadczy o s�abym zwi�zku zmiennych. Pozytywna weryfikacja drugiego z przedstawionych za�o-�e pozwala przyj��, �e efekty wp�ywów wybranych czynników na realizacj� badanej zmiennej sumuj� si�.
Normalno�� rozk�adu zmiennej obja�niaj�cej w ka�dej z grup wyznacza-nych przez kategorie zmiennych klasyfikuj�cych sprawdzono za pomoc� testu Ko�mogorowa-Smirnowa, weryfikuj�cego hipotez� zerow� o normalnym roz-k�adzie zmiennej zale�nej w podgrupach wobec hipotezy alternatywnej przyj-muj�cej, �e rozk�ad zmiennej zale�nej w podgrupach jest ró�ny od rozk�adu normalnego. Dla zlogarytmowanej warto�ci dodanej brutto w gospodarstwach rolnych przyj�to hipotez� zerow� o normalno�ci rozk�adu zmiennej zale�nej w podgrupach na poziomie istotno�ci � = 0,00016231. Zmienna wartosc_dodana ma zatem rozk�ad log-normalny, co implikuje spe�nienie trzeciego za�o�enia analizy wariancji.
O ile testy analizy wariancji wykazuj� odporno�� na wymóg normalno�ci rozk�adu zmiennej obja�nianej w wyszczególnionych podgrupach, koniecznym dla mo�liwo�ci przeprowadzenia analizy wariancji jest spe�nienie za�o�enia o jej jednorodno�ci [Rószkiewicz 2011]. W tym wypadku weryfikacji podlega�a hi-poteza zerowa o równo�ci wariancji w podgrupach wyznaczonych przez zmien-n� klasyfikuj�c�. Testem rekomendowanym do sprawdzenia homogeniczno�ci wariancji w grupach jest test Levene’a [Lim i Loh 1996]. Na podstawie jego wyników (najni�sza warto�� granicznego poziomu istotno�ci równa 0,00019) pozytywnie zweryfikowano hipotez� zerow� o homogeniczno�ci wariancji w grupach zmiennych klasyfikuj�cych, co pozwoli�o uzna� za�o�enie analizy wariancji o jej jednorodno�ci w podgrupach za spe�nione.
Spe�nienie wszystkich wymaganych za�o�e umo�liwia zatem przepro-wadzenie wieloczynnikowej analizy wariancji.
Wyniki bada 9.3
Za pomoc� wieloczynnikowej analizy wariancji zbadano wp�yw progra-mów �rodowiskowych, typu (specjalizacji) oraz klasy wielko�ci ekonomicznej gospodarstwa rolnego na warto�� dodan� brutto w polskich gospodarstwach rol-nych uczestnicz�cych w FADN w 2012 r. W pracy zweryfikowano dziewi�� hi-potez postaci:
��� � ! � " � #
31 Ze wzgl�du na przyj�cie hipotezy zerowej o normalno�ci rozk�adu zmiennej zale�nej w podgrupach na poziom istotno�ci � = 0,000162, poziom ten stanowi� b�dzie referencyjny poziom istotno�ci dla przeprowadzanych na potrzeby analizy testów.

112
�� A . B �.&�
Testowaniu podlega hipoteza zerowa, w której przyjmuje si� równo�� �rednich warto�ci dodanej brutto w podgrupach wyznaczonych przez czynniki klasyfikuj�ce. W hipotezie alternatywnej zak�ada si� natomiast, �e istnieje taka para podgrup :& C, dla których wyst�puje statystycznie istotna ró�nica mi�dzy �rednimi warto�ci dodanej brutto. Przyj�cie hipotezy alternatywnej b�dzie wów-czas oznacza�, �e wybrane do modelu analizy wariancji czynniki klasyfikuj�ce istotnie ró�nicuj� warto�� dodan� brutto w polskich gospodarstwach rolnych.
W przeprowadzonej analizie oprócz efektów g�ównych zwi�zanych z wp�ywem czynników na zmienn� zale�n� rozwa�ono równie� wp�yw ich inte-rakcji. Ze wzgl�du na trudno�� interpretacyjn� interakcji wy�szych rz�dów, ob-ok efektów g�ównych w��czono do modelu jedynie interakcje drugiego stopnia.
Tabela 2: Charakterystyka zmiennych wykorzystanych w modelu
Zmienna klasyfikuj�ca Liczba stopni swobody
Warto�� staty-styki F Snede-
cora p-value
dopl_srodowiskowe 1 336,428 < 2,2e-16
dopl_onw 1 224,775 < 2,2e-16
dopl_inne 1 1,649 0,1991412
dopl_srodowiskowe:typ_gospodarstwa 12 276,608 < 2,2e-16
dopl_onw:typ_gospodarstwa 6 17,329 < 2,2e-16
dopl_inne:typ_gospodarstwa 6 3,931 0,0006276
dopl_srodowiskowe:klasa_ekonomiczna 10 2280,903 < 2,2e-16
dopl_onw:klasa_ekonomiczna 5 2,204 0,0510989
dopl_inne:klasa_ekonomiczna 5 1,580 0,1618887
Residuals 10 040
!ród�o: opracowanie w�asne na podstawie danych FADN.
Wyniki przeprowadzonej wieloczynnikowej analizy wariancji, przedsta-wione w tabeli 2, wskazuj�, �e na zró�nicowanie warto�ci dodanej brutto w pol-skich gospodarstwach rolnych wp�ywaj� samodzielnie dwa efekty g�ówne, tj. dop�aty rolno�rodowiskowe oraz dop�aty do obszarów o niekorzystnych warun-kach gospodarowania. Oznacza to istnienie statystycznie istotnej ró�nicy w przeci�tnej warto�ci dodanej brutto mi�dzy gospodarstwami, które otrzyma�y

113
b�d@ nie otrzyma�y wspomniane dop�aty w 2012 r. ^rednia warto�� dodana brut-to w gospodarstwach, które otrzyma�y wsparcie w ramach dop�at rolno�rodowi-skowych, wynios�a 242,688 tys. z� wobec 174,441 tys. z� w gospodarstwach, które nie otrzyma�y takiego wsparcia. Analogiczne wnioski nie dotycz� jednak dop�at do obszarów o niekorzystnych warunkach gospodarowania, bowiem ��gospodarstwach rolnych, które otrzyma�y wspomniane dop�aty �rednia warto�� dodana brutto wynios�a 178,522 tys. z� wobec 201,335 tys. z� dla gospodarstw, które takiej pomocy nie otrzyma�y.
Dodatkowo, czynnikami ró�nicuj�cymi warto�� dodan� brutto w polskich gospodarstwach rolnych w 2012 r. okaza�y si� interakcje czynników odnosz�-cych si� do dop�at rolno�rodowiskowych i typu gospodarstwa rolnego, dop�at rolno�rodowiskowych i klasy wielko�ci ekonomicznej oraz dop�at do ONW ��typu gospodarstwa rolnego. Oznacza to, �e dzia�anie jednego czynnika zale�y od poziomu drugiego czynnika.
Rysunek 1. Wykres interakcji dla dop�at rolno�rodowiskowych i typu rolniczego
gospodarstwa
!ród�o: opracowanie w�asne na podstawie danych FADN.
10.8
11
11.2
11.4
11.6
11.8
12
12.2
Uprawypolowe
Uprawyogrodnicze
Uprawytrwa�e
Krowymleczne
Zwierz�tatrawo�erne
Zwierz�taziarno�erne
Mieszane
�red
nia
loga
rytm
u w
arto
�ci d
odan
ej
brut
to
Dop�aty rolno�rodowiskowe
0
1

114
Rysunek 2. Wykres interakcji dla dop�at do ONW i typu rolniczego gospodarstwa
!ród�o: opracowanie w�asne na podstawie danych FADN.
Rysunek 3. Wykres interakcji dla dop�at rolno�rodowiskowych i klasy wielko�ci
ekonomicznej gospodarstwa.
!ród�o: opracowanie w�asne na podstawie danych FADN.
10.8
11
11.2
11.4
11.6
11.8
12
12.2
Uprawypolowe
Uprawyogrodnicze
Uprawytrwa�e
Krowymleczne
Zwierz�tatrawo�erne
Zwierz�taziarno�erne
Mieszane
�red
nia
loga
rytm
u w
arto
�ci d
odan
ej b
rutt
oDop�aty do obszarów o niekorzystnych warunkach gospodarowania
0
1
1010.5
1111.5
1212.5
1313.5
1414.5
15
Bardzo ma�e(pow. 2 tys.
euro)
Ma�e (pow. 8tys. euro)
^rednio-ma�e(pow. 25 tys.
euro)
^rednio-du�e(pow. 50 tys.
euro)
Du�e (pow.100 tys. euro)
Bardzo du�e(pow. 500 tys.
euro)
�red
nia
loga
rytm
u w
arto
�ci d
odan
ej
brut
to
Dop�aty rolno�rodowiskowe
0
1

115
Jak wskazuje rysunek 1, najwy�sz� �redni� warto�� dodan� brutto zano-towano w gospodarstwach specjalizuj�cych si� w uprawach polowych, które w 2012 r. otrzyma�y dop�aty rolno�rodowiskowe, natomiast najni�sz� w gospo-darstwach specjalizuj�cych si� w hodowli zwierz�t trawo�ernych, które w tym samym roku nie otrzyma�y dop�at rolno�rodowiskowych. Oprócz gospodarstw specjalizuj�cych si� w uprawach trwa�ych, w grupach pozosta�ych typów go-spodarstw zaobserwowano �rednio wy�sz� warto�� dodan� brutto, je�eli gospo-darstwo otrzyma�o wsparcie w ramach dop�at rolno�rodowiskowych. W przy-padku gospodarstw rolnych specjalizuj�cych si� w uprawach ogrodniczych, uprawach trwa�ych, hodowli krów mlecznych oraz mieszanych �rednio wy�sz� warto�ci� dodan� brutto charakteryzowa�y si� gospodarstwa, które w 2012 r. nie otrzyma�y dop�at do obszarów o niekorzystnych warunkach gospodarowania (patrz rysunek 2). Interakcja zmiennych odnosz�cych si� do dop�at rolno�rodo-wiskowych oraz klasy wielko�ci ekonomicznej gospodarstwa, przedstawiona na rysunku 3, wskazuje na dodatni� zale�no�� mi�dzy wielko�ci� ekonomiczn� go-spodarstwa i otrzymaniem dop�aty a warto�ci� dodan� brutto. Wi�kszym gospo-darstwom rolnym (pod wzgl�dem wielko�ci ekonomicznej) towarzyszy �rednio wy�sza warto�� dodana brutto. Ponadto dla ka�dej klasy wielko�ci ekonomicz-nej gospodarstwa charakteryzowa�y si� przeci�tnie wy�sz� warto�ci� dodan� brutto, je�eli w 2012 r. otrzyma�y dop�aty rolno�rodowiskowe. Ró�nica w �red-niej warto�ci dodanej brutto mi�dzy gospodarstwami, które otrzyma�y b�d@ nie otrzyma�y wspomnianych dop�at, jest najbardziej zauwa�alna dla gospodarstw o wielko�ci ekonomicznej powy�ej 100 tys. euro.
Podsumowanie i wnioski 9.4
W pracy podj�to temat zró�nicowania warto�ci dodanej w polskich go-spodarstwach rolnych w zale�no�ci od uzyskiwania przez nie dop�at z tytu�u programów rolno�rodowiskowych. Analiza empiryczna przeprowadzona na podstawie danych FADN wykaza�a statystycznie istotny wp�yw programów rol-no�rodowiskowych na zró�nicowanie warto�ci dodanej w polskich gospodar-stwach rolnych w 2012 r. Mo�na uzna�, �e obok tzw. „efektów g�ównych”, wp�yw programów zale�y po�rednio równie� od typu rolniczego lub klasy wiel-ko�ci ekonomicznej danego gospodarstwa.
Wy�sza �rednia warto�� dodana zosta�a przy tym odnotowana w gospo-darstwach, które specjalizuj� si� w uprawach trwa�ych i w 2012 r. nie otrzyma�y dop�at rolno�rodowiskowych. Równie� gospodarstwa, które otrzyma�y dop�aty rolno�rodowiskowe, ale nie otrzyma�y dop�at do obszarów o niekorzystnych wa-runkach gospodarowania, cechowa�y si� przeci�tnie wy�sz� warto�ci� dodan�. Wy�sza �rednia warto�� dodana odnotowana zosta�a w gospodarstwach, które

116
w 2012 r. otrzyma�y dop�aty za dostosowanie gospodarstw rolnych do standar-dów UE, ale nie otrzyma�y dop�at rolno�rodowiskowych lub nie otrzyma�y do-p�at do obszarów o niekorzystnych warunkach gospodarowania. W�ród gospo-darstw, które specjalizuj� si� w uprawach ogrodniczych, uprawach trwa�ych, hodowli krów mlecznych lub mieszanych i w 2012 r. nie otrzyma�y dop�at do obszarów o niekorzystnych warunkach gospodarowania, �rednia warto�� dodana równie� by�a wy�sza.
Uzyskane wyniki wskazuj�, �e kierunek wp�ywu wsparcia na efektywno�� gospodarowania jest niejednoznaczny.
Bibiografia
1. Bezat-Jarz�bowska A., Rembisz W., Sielska A., Wp�yw polityki rolnej na decyzje producentów rolnych odno�nie dochodów i inwestycji, Program Wie-loletni 2011-2014, nr 97, IERIGQ-PIB, Warszawa 2013.
2. Divgi D.R., Calculation of the tetrachoric correlation coefficient, Psy-chometrika, vol. 44, no. 2, 1979, s. 169-172.
3. Fisher R.A., Statistical Methods for Research Workers, Oliver and Boyd, Ed-inburgh 1925.
4. Floriaczyk Z., Mako S., Osuch D., P�onka R., Wyniki Standardowe 2012 uzyskane przez gospodarstwa rolne uczestnicz"ce w Polskim FADN. Cz��� I. Wyniki Standardowe, IERiGQ-PIB, Warszawa 2013.
5. Jó@wiak J., Podgórski J., Statystyka od podstaw, Polskie Wydawnictwo Eko-nomiczne, Warszawa 2006.
6. Krasowicz S., Oleszek W., Idea zrównowa�onego rozwoju jako p�aszczyzna wspó�pracy �rodowisk naukowych [w:] Z bada� nad rolnictwem spo�ecznie zrównowa�onym (20). Wybrane zagadnienia zrównowa�onego rozwoju rol-nictwa, pr. zbior. pod red. J.St. Zegara, Program Wieloletni 2011-2014, nr 93, IERiGQ-PIB, Warszawa 2013.
7. Kutkowska B., Berbeka T., Wspieranie rolnictwa na obszarach o niekorzyst-nych warunkach gospodarowania (ONW) na przyk�adzie rolnictwa Sudetów, Roczniki Naukowe Ekonomii Rolnictwa i Rozwoju Obszarów Wiejskich, t. 101, z. 2, 2014, s. 55-69.
8. Lim T.S., Loh W.Y., A comparison of tests of equality of variances, Compu-tational Statistics & Data Analysis, Vol. 22, Issue 3, 1996, s. 287-301.
9. Ple�niak A., Wybór metody estymacji w budowie skali czynnikowej, Wia-domo�ci Statystyczne, Nr 11 (582), 2009, s. 1-17.
10. Rozmus D., Analiza wariancji [w:] Statystyczna analiza danych z wykorzy-staniem programu R, pr. zbior. pod red. M. Walesiaka i E. Gatnara, Wydaw-nictwo Naukowe PWN, Warszawa 2015.

117
11. Rozporz�dzenie Rady (WE) nr 1698/2005 z dnia 20 wrze�nia 2005 r. w sprawie wsparcia rozwoju obszarów wiejskich przez Europejski Fundusz Rolny na rzecz Rozwoju Obszarów Wiejskich (EFRROW), http://eur-lex.europa.eu/legal-con-tent/PL/TXT/PDF/?uri=CELEX:32005R1698&from=PL
12. Rószkiewicz M., Analiza klienta, Predictive Solutions, Kraków 2011. 13. Zegar J.St. (red.), Z bada� nad rolnictwem spo�ecznie zrównowa�onym (8).
Zrównowa�enie polskiego rolnictwa w �wietle danych statystyki publicznej, Program Wieloletni 2005-2009, nr 161, IERiGQ-PIB, Warszawa 2009.

118
Dr Norbert Potori, dr Róbert Garay, dr János Sávoly, dr József Fogarasi Research Institute of Agricultural Economics, Budapest, Hungary
10 An assessment of the impacts of reducing ammonia emissions from livestock farming by covering existing manure storage
facilities in Hungary
Introduction 10.1
The main policy instruments on air pollution within the European Union (EU) include the 2001/81/EC Directive on National Emission Ceilings (NEC). As part of its Clean Air Policy Package, the European Commission (EC) pre-sented a proposal in 2013 to revise the NEC Directive with new national emis-sions reduction commitments for each of the EU Member States for 2020 and 2030. For agriculture, the proposal presents a considerable challenge to maintain the profitability and competitiveness of high quality food production while en-hancing the protection of the environment. Compliance would require investing at the farm level in new technologies which may influence structural develop-ments. This paper assesses the possible impacts of the reduction of ammonia emissions up to 2030 by covering the existing manure storage facilities of farms producing milk, pigs and broiler chickens in Hungary by applying Farm Ac-countancy Data Network (FADN) agent-based simulation.
Legislative background and literature review 10.2
The proposed new NEC Directive (COM, 2013a) would impose limits ex-tended to 2030 at the EU Member State level on six particular matters: sulphur dioxide (SO2), nitrogen oxides (NOx), ammonia (NH3) and volatile organic compounds (NMVOC), and also includes ceilings on fine dust PM2.5 and me-thane (CH4). The requirements in the revised legislation would help to fulfil commitments made by the EU and accepted by all of its Member States in the last amended protocol (revised Gothenburg Protocol) of the United Nations Economic Commission for Europe (UNECE) Convention on Long-range Trans-boundary Air Pollution in 2012. Later it would set a long-term target to get clos-er to the level of air quality recommended by the World Health Organization (WHO). According to the proposal, the long-term strategic objective is to attain air quality levels that do not give rise to significant negative impacts on, or risks for, human health and the environment.
According to the EC, more than 400 thousand people are estimated to have died prematurely from air pollution in the EU in 2010, and almost two-

119
thirds of the EU land area was exposed to nutrients above safe levels. The eco-nomic cost of the health impacts alone is estimated at EUR 330-940 billion, or 3-9 per cent of the EU GDP. To comply with the revised Gothenburg Protocol would cost the EU EUR 87 billion; however, of this amount only EUR 1.8 bil-lion would burden agriculture. The costs of additional efforts required under the proposed new legislation would total EUR 4.6 billion a year concerning all sec-tors of the economy, of which agriculture is supposed to take on EUR 1.3 bil-lion. Notwithstanding the financial benefits estimated to range from EUR 45 to 151 billion a year, the measures would help to avoid 58 thousand premature deaths annually.
Background calculations for the EC’s proposal were supplied by the In-ternational Institute for Applied Systems Analysis (IIASA). Emissions and miti-gation potential were assessed for each EU member state, using emissions data from each specific activity multiplied by specific emission factors for every sec-tor of the economy [Amman et al. 2014]. For agriculture, livestock and fertiliser demand as activity levels were taken from 2010 CAPRI projections for the years 2015, 2020, 2025 and 2030. EUROSTAT data were applied to set up livestock structure and manure management systems, and data from the International Fer-tilizer Industry Association (IFA) were obtained for fertiliser use. IIASA used emission factors from UNECE and Economic Accounts for Agriculture (EEA) inventories and from then available publications. The mitigation potential emerged as the difference between the 2005 emissions level and the future activ-ity level multiplied by emission factors corresponding to the 75 per cent Maxi-mum Technically Feasible Reduction (MTFR). The 75 per cent gap closure was chosen by the EC taking cost effectiveness into account [COM 2013c]. Also, specific national investment costs were applied to each technology. Based on livestock and farm structures, percentage limits were calculated for the applica-tion of the technologies in each EU member state. The emissions ceilings were finally expressed in percentage terms using 2005 emissions levels as a basis.
The modelled national emissions ceilings for 2020 and beyond strongly depend on changes in activity levels. In the case of agriculture, if certain activi-ties (e.g. number of livestock etc.) in an EU member state remain below the CAPRI projection level, it would ease complying with the legislative require-ments; however, if activity levels exceed the projections, it would lead to extra costs or even threaten non-compliance. Since flexibility measures in the pro-posal excluded agriculture, the emissions ceilings may act as an artificial barrier against production development.
Agricultural activities can lead to emissions of methane and fine dust, but the contribution of agriculture to ammonia emissions is exceptionally high: over

120
95 per cent of the polluting ammonia is from agricultural origin. The major source is livestock manure but around 20 per cent comes from fertiliser applica-tion. Emissions depend on a number of factors such as feed intake, protein con-tent of feed, production efficiency, animal housing, manure management and techniques of manure application. One of the most cost effective measures in reducing emissions is the covering of stored manure. Savings in protein intake can also mitigate pollution to a large extent; however, special feeding technolo-gies are needed to maintain productivity [Amann et al. 2012]. Owing to the complexity of product chains, an integrated approach is needed, since savings at one stage may increase emissions in others.
At the time of completing this paper, the new NEC Directive still has not been finalised, but it is clear that it will be thoroughly revised during the legisla-tive procedure. At the end of October 2015, it was recommended that methane emissions from agriculture should be excluded from the legislation, then in De-cember the EU Environment Ministers suggested reducing the overall ammonia emissions goals, as well as lowering the limits for several EU Member States, with high targets set in the original proposal [COM 2016].
Three times more greenhouse gas (GHG) would be emitted globally by 2050 if the current trends of slow intensification in developing countries were to continue without agricultural technology improvements [Tilman et al., 2011]. Even the actual situation is changing and agricultural technology is improving in developing regions. The Total Factor Productivity (TFP) growth has two coun-tervailing components on emissions: a dampening effect through reducing the emissions intensity of output and a boosting effect through reducing output costs and consequently increasing output scale [Jones and Sands 2013].
Ammonia emissions from EU agriculture can be reduced by up to 30 per cent if available technical mitigation measures were fully applied. In addition, emissions could be reduced through policies that affect the number of livestock or the concentration process in land use, because more efficient mitigation measures are applicable on larger farms [Amann et al. 2012]. The mitigation po-tential for individual EU member states depends strongly on local conditions (farm structures, agricultural technologies, policy efforts). Therefore, the reduc-tion targets set in Annex II of the new NEC Directive proposal differ widely by EU member states. For instance, in the case of ammonia these are 7 and 35 per cent for the Czech Republic, 15 and 37 per cent for Slovakia, 10 and 34 per cent for Hungary, and 1 and 26 per cent for Poland for 2020 and 2030 respectively.
Mitigation of methane emissions can be achieved effectively by strategies that improve the efficiency of animal production, reduce the amount of feed fermented per unit of product, or change the fermentation pattern in the rumen.

121
Boadi et al. (2004) evaluated many applied and potential mitigation strategies, and found that cost effective strategies which improve productivity and have no potential negative impact on livestock production have a greater chance of being adopted by producers.
Compliance with the emissions reduction commitments is possible by modernising and introducing new technologies. The rising costs of emissions reduction is likely to be offset by cost benefits deriving from economies of scale as average herd sizes continue to increase, a prerequisite of better exploitation of modernisation and introducing new technologies [McDonald et al. 2007]. In-creases in efficiency or the reduction in inefficiencies could contribute signifi-cantly to a decline in GHG emissions [Hampf and Krüger 2014]. Nuki and Bra-vo-Ureta (2015) estimated an increase of 5 percentage points in technical effi-ciency as a consequence of regulating GHG emissions in US dairy farming. The adoption of new abatement technologies implies that structural change will con-tinue to be a driving force in livestock farming.
Abatement strategies for greenhouse gas emissions reduction in livestock farming described in the literature range from variable feed adjustments to in-vestment decisions for manure coverage [Bates 2001; Flachowsky and Brade 2007; Guan et al. 2006; Jentsch et al. 2007; Johnson et al. 2007; Kamra et al. 2006; McGinn et al. 2004; Osterburg et al. 2009; UNFCCC 2008]. The costs of abatement strategies are heavily influenced by the choice and methods of esti-mation of emissions indicators by environmental policy makers [Lengers and Britz 2012].
Methodology and Data 10.3
To project the development of livestock numbers in Hungary and to assess the impacts of the reduction of ammonia emissions by covering existing manure storage facilities of farms producing milk, pigs and broiler chickens, an agent- -based simulation model developed at the Research Institute of Agricultural Economics (AKI) for Common Agricultural Policy (CAP) and national agricul-tural policy impact analysis was used.
A baseline scenario for the period 2015-2030 was defined as a current leg-islation scenario (CLE) and an “action” scenario was simulated for the same time period with the assumption that, as of 2015, there would be no covered ma-nure storage in Hungary except for livestock farms with biogas production facil-ities32. The costs of covering were calculated according to official construction
32 According to EUROSTAT data published in September 2013 (Statistics Explained: Agri-culture – manure storage statistics), fewer than 5 per cent of the manure stores were covered in Hungary in 2010.

122
standards and the regulation (59/2008/FVM) on the size requirement of manure stores. The action, i.e. the covering of manure storage facilities, and relevant ad-ditional costs were taken into account from 2015 on. CAP direct payments and national direct payments were considered to continue as currently designed until 2020 after which the 2020 status quo was assumed to prevail.
AKI’s model used for the projections belongs, in the broad sense, to the family of general equilibrium models [see e.g. Arrow and Debreu 1954] since prices, and supply and demand are determined endogenously. It cannot be clas-sified into the family of applied or computed general equilibrium (AGE/CGE) models [Mitra-Kahn 2008] because AKI’s modelling approach was substantially different: agents were allowed to be heterogeneous, their objective functions, initial states and even their choice paradigms could vary. Decisions were mod-elled at the micro-level and macro-outcomes were derived as the consequences of these micro-level decisions.
For the modelling process, data were retrieved from the 2014 Hungarian FADN database [Keszthelyi 2015]. Each FADN data provider was regarded as an individual decision maker aiming at maximising incomes, and representing a group of similar decision makers in the real economy. The properties of these agents were derived directly from the FADN data. Exogenous variables were imported from Prospects for Agricultural Markets and Income in the EU 2014- -2024 published by the European Commission (EC, 2015) and from the OECD-FAO Agricultural Outlook 2015-2024 (OECD-FAO, 2015). The base year for the modelling process was 2015 which was equated to 2014 FADN data.
Programming was done in Python 3.5.0. For the period 2015-2024, a dy-namic modelling cycle was applied with outputs for each year, while for the pe-riod 2025-2030, linear regressions were used.
The schematic operation of the model can be described briefly in the fol-lowing steps: � loading and constructing of data, defining the time period and the scenario; � solving the profit maximising problems for the agents by using the COBYLA
algorithm [Powell 1998] with the help of which a solution can be found even if an objective function does not satisfy certain smoothness conditions; moreover, with this method there is no need to calculate gradient vectors [Powell 2007];
� scaling and aggregating the solutions for the optimum problems to assess the changes at the macro (national) level;
� calculating the factors which affect supply and demand in the next time peri-od, equilibrium search;

123
� repeating steps 2 to 4 (dynamic cycle) until reaching the end of the projection period.
Results 10.4
Firstly, the results of the AKI baseline projection are presented and com-pared to the results of the 2010 CAPRI projection used by IIASA in Figures 1-3. In contrast to CAPRI, the numbers of dairy cows, pigs and broiler chickens are expected to increase in Hungary during the projection period, reaching the levels that existed at the time of Hungary’s accession to the EU in 2004 in the cases of dairy cows and pigs, and around political and economic transition at the begin-ning of the 1990’s in the case of broiler chiecken.
Figure 1. Projected development of the number of dairy cows* in Hungary
by AKI until 2030 versus CAPRI
* Including dual purpose breeds
Source: IIASA, Hungarian Central Statistical Office (2015 = 1 December, 2014) and own calculations.
239226
214195
183
255270
286302
0
100
200
300
400
2010 2015 2020 2025 2030
000
head
s
CAPRI projection HCSO/AKI baseline

124
Figure 2. Projected development of the number of pigs in Hungary by AKI until 2030 versus CAPRI
Source: IIASA, Hungarian Central Statistical Office (2015 = 1 December, 2014) and own calculations
Figure 3. Projected development of the number of broiler chickens in Hungary
by AKI until 2030 versus CAPRI
Source: IIASA, Hungarian Central Statistical Office (2015 = 1 December, 2014) and own calculations.
3169
27262475
2735 2789
3136
3503
3918
4310
0
1000
2000
3000
4000
2010 2015 2020 2025 2030
000
head
s
CAPRI projection HCSO/AKI baseline
29642 30627 30199 29129 29346
30521 34141
3820842049
0
12000
24000
36000
48000
2010 2015 2020 2025 2030
000
head
s
CAPRI projection HCSO/AKI baseline

125
The assessed impacts of the reduction of ammonia emissions by covering existing manure storage facilities on the development of livestock numbers in Hungary are presented in Figure 4. Owing to the relatively high level of sector specific and coupled EU and national direct support, the projected development in the number of dairy cows would not be diverted in the “action” scenario, while the increase in the number of pigs is expected to slow down, although it would still remain on a growth trajectory. It is the poultry sector which may be impacted most severely: the growth in the number of broiler chickens would re-verse and fall below its 2015 level.
Figure 4. Assessed impacts of the reduction of ammonia emissions by covering existing
manure storage facilities on the development of livestock numbers in Hungary, expressed in percentage terms versus 2015
Source: own results.
Conclusions 10.5
In view of the conflicting results of CAPRI and AKI projections presented above, the proposed emissions reduction ceilings should be reassessed. Especial-ly since future development of livestock numbers may indirectly be “locked in”, the legislation may have a distorting effect on the EU market. Flexibility measures should also be considered in order to help producers adjust to internal and international market developments.
Two important limitations of both the CAPRI and AKI projections need to be highlighted, namely that neither of them considered the additional adminis-
11.911.7
6.0
-4.0
8.16.0
37.8
31.4
18.522.0
18.4
-17.4-20
-10
0
10
20
30
40
50
Dairy cows Slaughter pigs Broiler chicken
perc
enta
ge c
hang
e
2020 Baseline 2020 'Action' 2030 Baseline 2030 'Action'

126
trative burden put on farmers by the monitoring of the compliance with increas-ingly strict EU environmental standards that will render production even more difficult, and that the expected decline in CAP direct support after 2020, which may trigger further decreases in livestock numbers, was not taken into account.
References
1. Amann M. (ed.), Borken-Kleefeld J., Cofala J., Höglund-Isaksson L., Kie-sewetter G., Klimont Z., Rafaj P., Schöpp W., Winiwarter, W. (2014): Up-dates to the GAINS Model Databases after the Bilateral Consultations with National Experts in 2014. TSAP Report 14, version 1.0, Laxenburg: IIASA. http://ec.europa.eu/environment/air/pdf/TSAP-14.pdf
2. Amann M. (ed.), Oenema O., Velthof G., Klimont Z. and Winiwarter W. (2012): Emissions from agriculture and their control potentials. TSAP Re-port 3, Laxenburg: IIASA. http://www.iiasa.ac.at/web/home/research/ research Programs/MitigationofAirPollutionandGreenhousegases/TSAP-AGRI -20121129_v21.pdf
3. Bates J. (2001): Economic Evaluation of Emission Reductions of Nitrous Ox-ides and Methane in Agriculture in the EU – Bottom-up Analysis, AEA Technology Environment and National Technical University of Athens, Cul-ham, Abingdon.
4. Boadi D., Benchaar C., Chiquette J. and Masse D. (2004): Mitigation strate-gies to reduce enteric methane emissions from dairy cows: Update review. Canadian Journal of Animal Science 84(3), 319-335.
5. COM (2013a): COM(2013) 920 final. Proposal for a Directive of the Euro-pean Parliament and of the Council on the reduction of national emissions of certain atmospheric pollutants and amending Directive 2003/35/EC, Brus-sels, 18 December 2013. http://eur-lex.europa.eu/legal-content/EN/TXT/ ?uri=CELEX:52013PC0920
6. COM (2013b): European Commission Press release: Environment: New pol-icy package to clean up Europe's air. Brussels, 18 December 2013. http://europa.eu/rapid/press-release_IP-13-1274_en.htm
7. COM (2013c): Commission Staff Working Document Impact Assessment Accompanying the documents (…) Proposal for a Directive of the European Parliament and of the Council on the reduction of national emissions of cer-tain atmospheric pollutants and amending Directive 2003/35/EC SWD(2013) 531 final PART 1-4. http://ec.europa.eu/environment /archives/air/pdf/ Impact_assessment_en.pdf
8. COM (2016): Procedure 2013/0443/COD. COM (2013) 920: Proposal for a Directive of the European Parliament and of the Council on the reduction

127
of national emissions of certain atmospheric pollutants and amending Di-rective 2003/35/. http://eur-lex.europa.eu/legal-content/EN/HIS/?uri=CELEX :52013 PC0920
9. EC (2015): Prospects for Agricultural Markets and Income in the EU 2014- -2024, European Commission, Brussels.
10. Flachowsky G., Brade W. (2007): Potenziale zur Reduzierung der Methan-Emissionen bei Wiederkäuern, Züchtungskunde 79 (6), p. 417-465.
11. Hampf B., Krüger J.J. (2014): Optimal directions for directional distance functions: an exploitation of potential reductions of greenhouse gasses. American Journal of Agricultural Economics 97 (3), p. 920-938.
12. Guan H., Wittenberg K.M., Ominski K.H., Krause D.O. (2006): Efficacy of ionophores in cattle diets for mitigation of enteric methane. Journal of Ani-mal Sciences 84, p. 1886-1906.
13. Jones C.A., Sands R.D. (2013): Impact of agricultural productivity gains on greenhouse gas emissions: a global analysis. American Journal of Agricul-tural Economics 95(5), p. 1309-1316.
14. Jentsch W., Schweigel M., Weissbach F., Scholze H., Pitraft W. and Der-no M. (2007): Methane production in cattle calculated by the nutrient com-position in the diet. Archives of Animal Nutrition 61, p. 10-19.
15. Johnson J.M.F., Franzluebbers A.J., Lachnit Weyers S., Reicosky D.C. (2007): Agricultural opportunities to mitigate greenhouse gas emissions. En-vironmental Pollution 150, p. 107-124.
16. Kamra D.N., Agrawal N. and Chandhary L.C. (2006): Inhibition of ruminal methanogenesis by tropical plants containing secondary compounds. Interna-tional Congress Series 1293, p. 156-163.
17. Keszthelyi Sz. (2015): Results of FADN farms 2014. Agrárgazdasági Kutató Intézet, Budapest.
18. Lengers, B. and Britz, W. (2012): The choice of emission indicators in envi-ronmental policy design: an analysis of GHG abatement in different dairy farms based on ab bio-economic model approach. Review of Agricultural and Environmental Studies 93(2), p. 117-144.
19. McDonald J.M., McBride W.D., O’Donoghue E.J. (2007): Low Costs Drive Production to Large Dairy Farms. Amber Waves 5(4), p. 30-35.
20. McGinn S.M., Beauchemin K.A., Coates T. and Colombatto D. (2004): Me-thane emissions from beef cattle: Effects of monesin, sunflower oil, enzymes, yeast, and fumaric acid. Journal of Animal Sciences 82, p. 3346-3356.
21. Nuki E. and Bravo-Ureta B.E. (2015): The economic costs of environmental regulation in U.S. dairy farming: a directional distance function approach. American Journal of Agricultural Economics 97(4), p. 1087-1106.

128
22. OECD-FAO (2015): Agricultural Outlook 2015-2024, OECD Publishing, Paris.
23. Osterburg B. (2004): The problem of incomplete information and impacts on strategies for the abatement of greenhouse gas emissions from agriculture, [In:] Greenhouse Gas Emissions from Agriculture, Mitigation Options and Strategies, Weiske A. (ed.), International conference organised by the Insti-tute for Energy and Environment, Leipzig, Germany, p. 209-215.
24. Powell M.J.D. (2007): A view of algorithms for optimization without deriva-tives. Cambridge University Technical Report DAMTP 2007.
25. Powell M.J.D. (1998): Direct search algorithms for optimization calcula-tions. Acta Numerica 7, p. 287-336.
26. Tilman D., Balzer C., Hill J. and Befort B.L. (2011): Global Food Demand and the Sustainable Intensification of Agriculture. Proceedings of the Na-tional Academy of Sciences of U.S.A. 108(50), p. 20260-20264.
27. UNFCCC (2008): Challenges and opportunities for mitigation in the agricul-tural sector. Technical paper FCCC/TP/2008/8. http://unfccc.int/resource/ docs/2008/tp/08.pdf

129
Dr in�. Ivan Masár National Agricultural and Food Centre, Research Institute of Agricultural and Food Economic – Slovakia
11 Animal and vegetable waste development in agriculture, food processing and households of the European Union
Introduction 11.1
World population and demand for food is growing, consumers’ behaviour and changing tastes pose new challenges for food production. There are basical-ly two ways to cover rising food consumption worldwide, either by production growth or through food waste reduction. Preparatory study on food waste com-pleted for European Commission [Monier et al. 2010] estimated annual food waste generation in the EU-27 at approximately 89 million tons or 179 kilo-grams per capita. Based on Eurostat data for the year 2012 the volume of animal and vegetal waste from all economic activities plus households of the EU-28 represented 110 million tons that means 218 kilograms per capita. During previ-ous five decades agricultural production in the European countries rose substan-tially and concurrently the household expenditures spend on food declined. Food appears cheap without calculating hidden costs, i.e. financial support to the farmers, clean-up of environmental impacts and remedy for health effects.
Food waste reduction is important due to three reasons: to cover growing food consumption, to save natural and labour resources invested in food produc-tion and to reduce impact on environment. It is essential to distinguish two kinds of food waste: a) possibly avoidable, for instance some people do not consume bread crusts,
baked potato skins or fruit peelings; b) unavoidable, derived from food preparation and not edible, for instance meat
bones, egg shells, nut shells, apple seeds, vegetable peels, plant roots. Significant amount of food is wasted in restaurants operated in developed
countries. According to survey conducted by British charity organization Waste & Resources Action Programme (WRAP), 50% of respondents were bothered for waste of food in restaurants. Among type of food left on plates at first ranks are chips, salads and bread and bakery products. To change this fact the con-sumers proposed flexible portion sizes of meals and detailed description includ-ing calorie information of chosen meals. From total food and drink purchases brought into United Kingdom households 19% were discarded [Quested and

130
Parry 2011]. WRAP researched that British households discard 7.2 million tons of food waste annually thereof approximately 60% was avoidable. That is equivalent to 20 million tons of carbon dioxide per year and 6,200 billion litres of water used for food production per year or around 97,600 litres per person. In presentation [O’Connor 2013] stated that an average of at least 1.9 tonne CO2 equivalent to 1 tonne of food wasted is emitted in Europe during the whole life cycle of food waste. At the European level, the overall environmental impact is at least 170 Mt of CO2 eq. emitted per year.
By survey implemented in 380 households, the Finnish researchers [Sil-vennoinen et al. 2012] found that main discarded foodstuffs were vegetables (19% of total food waste), home-cooked meals (18%), milk products (17%), bakery products (13%) and fruits (13%). Research of [Koivupuro et al. 2011] stated the area of residence, type of residence, educational level, frequency of food shopping and home cooking, distance between home and grocery store are not directly connected with food waste amount.
German households discard around 6.7 million tons of food waste per year. University of Stuttgart [Barabosz et al. 2012] discovered that significant share pertained to vegetables (26%), fruits (18%), bakery products (15%), food leftovers (12%) and dairy products (8%).
Technological drivers of food waste in food processing related to the type and age of equipment along with the maintenance regime, rate of equipment us-ing and training of employees described [Canali et al. 2014]. Unsound packag-ing made food vulnerable to microbes and lead to food deterioration, food prod-ucts spoilage or leakage during handling and storage in wholesale, transport, re-tail and food services sectors. There are institutional drivers of food waste, for instance legislative associated with safety and health standards. The causes of food waste in medium and high income countries mainly relate to consumer be-haviour and lack of coordination among different actors in the supply chain [Gustavsson et al. 2011].
Methodology 11.2
European Commission defines waste as any substance or object which the holder discards or intends to discard or is required to discard. Method was tar-geted at food waste amount that originates by performing of various works dur-ing farming, forestry, fishery, food processing, distribution, retailing, providing food services and consumption in hospitality sector and in households. Main statistical source were data from the Eurostat since the year 2004 up to 2012. Statistical data of animal and vegetal food waste for each particular EU member states including pre-accession Croatia are monitored in 2 years time interval. For
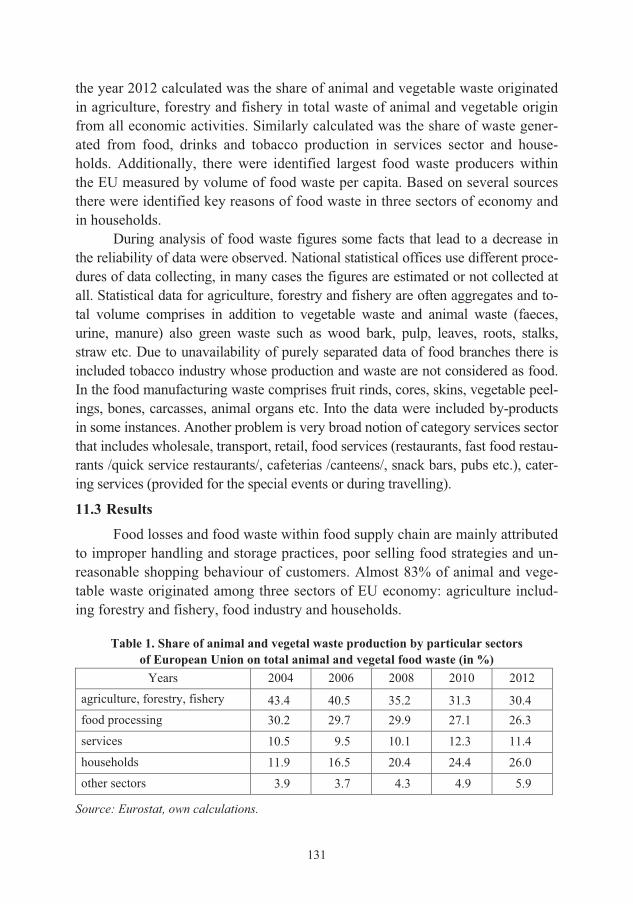
131
the year 2012 calculated was the share of animal and vegetable waste originated in agriculture, forestry and fishery in total waste of animal and vegetable origin from all economic activities. Similarly calculated was the share of waste gener-ated from food, drinks and tobacco production in services sector and house-holds. Additionally, there were identified largest food waste producers within the EU measured by volume of food waste per capita. Based on several sources there were identified key reasons of food waste in three sectors of economy and in households.
During analysis of food waste figures some facts that lead to a decrease in the reliability of data were observed. National statistical offices use different proce-dures of data collecting, in many cases the figures are estimated or not collected at all. Statistical data for agriculture, forestry and fishery are often aggregates and to-tal volume comprises in addition to vegetable waste and animal waste (faeces, urine, manure) also green waste such as wood bark, pulp, leaves, roots, stalks, straw etc. Due to unavailability of purely separated data of food branches there is included tobacco industry whose production and waste are not considered as food. In the food manufacturing waste comprises fruit rinds, cores, skins, vegetable peel-ings, bones, carcasses, animal organs etc. Into the data were included by-products in some instances. Another problem is very broad notion of category services sector that includes wholesale, transport, retail, food services (restaurants, fast food restau-rants /quick service restaurants/, cafeterias /canteens/, snack bars, pubs etc.), cater-ing services (provided for the special events or during travelling).
Results 11.3
Food losses and food waste within food supply chain are mainly attributed to improper handling and storage practices, poor selling food strategies and un-reasonable shopping behaviour of customers. Almost 83% of animal and vege-table waste originated among three sectors of EU economy: agriculture includ-ing forestry and fishery, food industry and households.
Table 1. Share of animal and vegetal waste production by particular sectors
of European Union on total animal and vegetal food waste (in %) Years 2004 2006 2008 2010 2012
agriculture, forestry, fishery 43.4 40.5 35.2 31.3 30.4 food processing 30.2 29.7 29.9 27.1 26.3 services 10.5 9.5 10.1 12.3 11.4 households 11.9 16.5 20.4 24.4 26.0 other sectors 3.9 3.7 4.3 4.9 5.9
Source: Eurostat, own calculations.

132
Calculations in the Table 2 showed that largest share of animal and vege-table waste in agriculture, forestry and fishery on total waste of animal and vegetable origin of all economic activities plus households in 2012 were ob-served in Romania (97.1%), followed by Bulgaria (78.6%) and Lithuania (69.5%). Explanation is that in these countries significant role is played by agri-culture, fishery, forestry sectors, logging and wood processing industry.
Five largest EU producers of animal and vegetable waste originated from agriculture/forestry and fishery sectors, food industry including tobacco manu-facturing, food services and households per capita in the year 2012 were: Roma-nia (905.9 kilograms), the Netherlands (829.0), Belgium (279.0), Ireland (270.0) and Cyprus (256.0). If we take volume of animal and vegetable waste per capita generated by all sectors of the economy based on statistical classification of economic activities plus households in the European Union (NACE) the figures will be following: Romania (906.2 kilograms), the Netherlands (869.4), Belgium (440.8), Ireland (271.3) and Cyprus (256.0).
Evident differences regarding food waste are in food industry of member states. For instance the volume of animal and food waste generated in the Dutch food industry achieved 377.7 kilogram per capita compared to 51.8 kilogram per capita in France where a very large food sector is located. Except the Nether-lands the largest food waste per capita produce food processors in Ireland, Bel-gium and Finland.
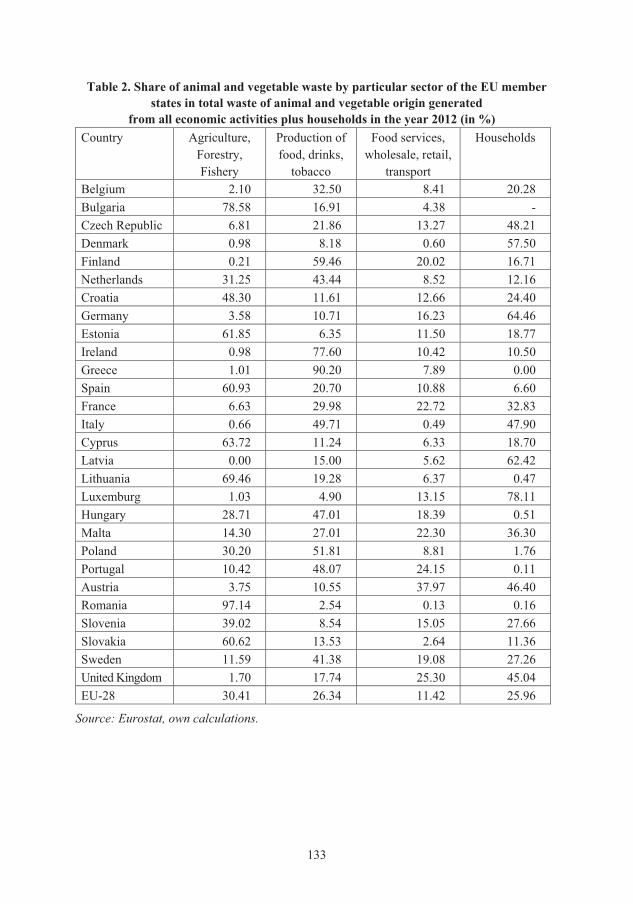
133
Table 2. Share of animal and vegetable waste by particular sector of the EU member states in total waste of animal and vegetable origin generated
from all economic activities plus households in the year 2012 (in %) Country Agriculture,
Forestry, Fishery
Production of food, drinks,
tobacco
Food services, wholesale, retail,
transport
Households
Belgium 2.10 32.50 8.41 20.28 Bulgaria 78.58 16.91 4.38 - Czech Republic 6.81 21.86 13.27 48.21 Denmark 0.98 8.18 0.60 57.50 Finland 0.21 59.46 20.02 16.71 Netherlands 31.25 43.44 8.52 12.16 Croatia 48.30 11.61 12.66 24.40 Germany 3.58 10.71 16.23 64.46 Estonia 61.85 6.35 11.50 18.77 Ireland 0.98 77.60 10.42 10.50 Greece 1.01 90.20 7.89 0.00 Spain 60.93 20.70 10.88 6.60 France 6.63 29.98 22.72 32.83 Italy 0.66 49.71 0.49 47.90 Cyprus 63.72 11.24 6.33 18.70 Latvia 0.00 15.00 5.62 62.42 Lithuania 69.46 19.28 6.37 0.47 Luxemburg 1.03 4.90 13.15 78.11 Hungary 28.71 47.01 18.39 0.51 Malta 14.30 27.01 22.30 36.30 Poland 30.20 51.81 8.81 1.76 Portugal 10.42 48.07 24.15 0.11 Austria 3.75 10.55 37.97 46.40 Romania 97.14 2.54 0.13 0.16 Slovenia 39.02 8.54 15.05 27.66 Slovakia 60.62 13.53 2.64 11.36 Sweden 11.59 41.38 19.08 27.26 United Kingdom 1.70 17.74 25.30 45.04 EU-28 30.41 26.34 11.42 25.96
Source: Eurostat, own calculations.

134
Table 3. Volume of animal and vegetable waste generated by food, drinks and tobacco production per capita in European Union countries (in kilograms)
State / Year 2004 2006 2008 2010 2012 Belgium 399.0 221.0 231.5 220.7 143.3 Bulgaria 46.3 47.1 14.9 13.1 26.1 Czech Republic 43.0 35.4 16.9 10.4 9.2 Denmark 15.2 18.7 16.8 10.7 13.0 Finland 85.4 118.4 87.4 100.5 108.8 Netherlands 394.8 394.4 386.2 379.1 377.7 Croatia 29.2 17.5 11.2 15.2 3.6 Germany 19.5 22.4 19.4 22.5 18.8 Estonia 313.7 176.4 97.5 97.7 4.0 Ireland 238.1 112.6 117.0 111.8 210.5 Greece 73.3 7.2 12.4 38.3 40.0 Spain 68.1 52.5 45.3 40.9 36.7 France 0.0 9.9 13.0 25.2 51.8 Italy 101.9 105.3 91.0 85.3 83.5 Cyprus 244.4 48.7 35.5 35.1 28.8 Latvia 35.0 64.9 24.9 20.6 10.1 Lithuania 86.9 89.9 120.0 40.3 37.1 Luxemburg 18.6 5.7 7.9 12.4 7.9 Hungary 79.4 116.3 70.2 37.2 37.5 Malta 14.4 19.1 22.0 15.3 10.6 Poland 182.9 172.7 145.5 114.7 80.7 Portugal 59.5 61.8 20.4 11.0 9.3 Austria 217.5 69.1 177.4 15.5 23.8 Romania 10.5 27.5 28.0 24.1 23.0 Slovenia 16.8 24.6 49.1 13.6 12.9 Slovakia 53.4 69.0 48.9 26.5 21.6 Sweden 51.9 67.9 66.9 61.0 80.4 United Kingdom 77.9 85.2 74.6 28.4 29.3 EU-28 83.2 77.0 69.7 58.1 57.5
Source: Eurostat, own calculations.

135
Table 4. Volume of animal and vegetable waste generated by services sector per capita in European Union countries (in kilograms)
State / Year 2004 2006 2008 2010 2012 Belgium 38.6 46.0 38.4 63.2 37.1 Bulgaria 4.6 3.4 15.6 4.4 6.8 Czech Republic 5.4 4.5 4.7 5.9 5.6 Denmark 3.3 3.3 3.9 1.7 0.9 Finland 11.1 20.9 11.3 29.7 36.6 Netherlands 44.8 70.4 80.7 76.7 74.1 Croatia 7.2 19.3 7.9 0.0 3.9 Germany 10.0 8.0 8.8 21.2 28.5 Estonia 18.6 19.0 49.2 34.6 7.3 Ireland 70.7 59.3 0.0 252.8 28.3 Greece 0.1 0.1 0.0 0.9 3.5 Spain 63.1 53.2 42.1 41.4 19.3 France 23.7 23.4 19.3 37.0 39.3 Italy 3.2 1.7 3.1 1.0 0.8 Cyprus 28.5 28.6 19.9 17.2 16.2 Latvia 0.5 3.2 1.9 1.6 3.8 Lithuania 0.9 2.3 4.9 0.0 12.3 Luxemburg 27.5 42.2 24.0 23.7 21.2 Hungary 21.5 30.3 19.9 7.0 14.7 Malta 4.5 5.8 4.4 5.9 8.7 Poland 2.6 6.0 4.0 7.0 13.7 Portugal 178.0 33.0 54.7 7.1 4.7 Austria 150.1 47.3 141.0 68.4 85.5 Romania 42.7 51.2 1.3 2.3 1.2 Slovenia 14.1 31.1 25.8 22.0 22.7 Slovakia 5.9 8.1 7.3 9.6 4.2 Sweden 48.1 47.7 41.8 48.4 37.1 United Kingdom 43.8 42.1 48.6 35.0 41.8 EU-28 29.0 24.7 23.6 26.5 24.9
Source: Eurostat, own calculations.
Greatest food waste per capita in services sector produce countries with well developed toursit industry providing services like boarding, lodging, camp-ing services, amusement, large scale events etc. namely Austria, the Nether-lands, United Kingdom, France and Belgium.

136
Table 5. Volume of animal and vegetable waste generated by households per capita in European Union countries (in kilograms)
State / Year 2004 2006 2008 2010 2012 Belgium 114.6 88.9 90.0 89.0 89.4 Bulgaria 0.0 0.0 0.0 0.0 0.0 Czech Republic 6.3 10.6 12.7 16.5 20.3 Denmark 9.7 7.2 6.7 89.9 91.7 Finland 12.4 18.1 33.7 31.5 30.6 Netherlands 110.9 104.3 104.7 103.0 105.7 Croatia 0.0 0.0 0.0 0.0 7.6 Germany 52.0 93.1 98.3 103.8 113.0 Estonia 0.6 1.0 8.2 6.1 11.9 Ireland 116.7 128.0 0.0 27.2 28.5 Greece 0.0 0.0 0.0 0.0 0.0 Spain 0.3 0.2 8.8 12.0 11.7 France 42.0 47.0 52.6 58.3 56.7 Italy 38.6 46.6 56.7 70.2 80.5 Cyprus 0.0 0.0 53.2 49.7 47.9 Latvia 0.0 4.7 0.0 2.7 41.9 Lithuania 4.5 0.2 6.9 1.4 0.9 Luxemburg 130.8 133.3 147.4 134.8 125.9 Hungary 10.1 4.5 5.5 10.3 0.4 Malta 4.7 5.6 4.2 10.7 14.2 Poland 0.0 0.0 0.0 2.2 2.7 Portugal 0.0 0.0 0.1 0.0 0.0 Austria 67.1 80.1 86.0 55.6 104.5 Romania 0.0 0.0 1.8 1.4 1.4 Slovenia 6.5 12.6 21.0 25.6 41.7 Slovakia 0.0 14.6 16.5 17.7 18.2 Sweden 39.4 42.7 53.4 47.8 52.9 United Kingdom 38.1 53.5 65.5 68.8 74.5 EU-28 32.8 42.9 47.6 52.3 56.7
Source: Eurostat, own calculations.
It is evident that largest volume of food is discarded by households in high-income countries, particularly Luxembourg, Germany, the Netherlands, Austria and Denmark. Mean net annual income per capita in these states was above 22 thousand EUR in the year 2012. Average net annual income in new member states was 4 400 EUR per capita in comparable year.

137
Reasons of food waste occurrence 11.4
Most of food waste originated in food manufacturing is unavoidable, for example: lemon, orange or bacon rind, potato or apple peelings, bones or animal organs. However, food waste can occur by particular technical malfunctions such as damaged food product or its packaging.
In wholesale and retail sector food waste can be a result of inefficient co-ordination among food producers and distributors or bad stock management, e.g. wrong anticipation of demand, inaccuracy of stocks. Potential food waste lies in marketing strategies that are encouraging consumers to purchase more food products than needed by providing discounts on excess stock or food products near expiry date. Wholesalers and retailers reject food products due to aesthetic issues or packaging defects although food quality or safety is not affected. Shelf life of many food products (especially meat/dairy products, eggs) can be quickly reduced by exposure to light or to temperature changes and therefore it is neces-sary to maintain adequate heat and storage conditions.
Food waste in households is caused by confusion about food date labelling (“use-by date” and “best before date”) and inadequate food storage practices. Plate waste and leftovers have often psychological base, such as bad taste, preference or aversion, beauty and health reasons. Younger people, females, single-person house-holds and higher income families tend to waste more food. A lot of uneaten food is discarded during summer seasons and holidays. It will be useful to give attention to shopping planning that purchased food will combine well to make a specific meal or to be wanted by other members of the household or could be eaten in time in case of highly perishable food products. Additionally, optimal storage conditions and pack-aging can extend ediblity life of food products.
Causes of food waste generated by tourist industry that include food and cater-ing services are rather similar to households. In cafeterias, canteens and self-service restaurants food waste can be markedly limited by allowing consumers to serve food by themselves on chosen size of dishes and made the payments according to weight of the food. In classic restaurants with waitresses/waiters the quantity of needed food is easier to anticipate through reservation systems. In hotels and other accommoda-tion facilities it could help to adapt cooking and serving amount of food via buffet to number of consumers regardless the expectations of guests that no meals will run out. Potential to reduce food waste in restaurants is by changing attitude of consum-ers about taking leftovers home. Schoolchildren will also perceive the value of food and on the other hand the quality of food in school cafeterias will meet taste de-mands. Portion size of meals will have to be variable to actual appetite of pupils and students. Frequently low food quality, fixed eating times, uniform portion sizes, im-possibility of meal choice, similarly create food waste problem in hospitals.

138
Possible solutions to food waste reduction 11.5
There are numerous possible solutions enabling food waste reduction, in-cluding: � provision of information to the public about ways of food wastage reduction
(prevention guidelines, awareness campaigns, handbooks); � introduction of dual-date labelling (sell-by date and use-by date); � enlightenment campaigns that will interpret the differences of food products
labelling (best before date and use by date); � use of packaging that extend life cycle of food products; � supply of a range of food product packaging in various portion sizes; � provision of discounts on food products close to their expiry date; � pursue training programmes and workshops for food service staff and con-
sumers; � logistic improvements (reservation system and variable portions in food ser-
vices, ordering flexibility in hospitals and schools); � redistribution of food products close to their expiry date to poorer people or
to food banks; � preference to local agricultural products (exclusion of strict quality standards
on weight, size and appearance of agricultural products); � use of food waste into by-products for other purposes; � apply safe food handling and adequate storage practices.
Conclusions 11.6
Food waste is causing economic, social (ethical) and environmental prob-lems. It is necessary to raise awareness of consumers about the fact that the true value of food is not always reflected in price and moreover find alternatives to use unavoidable waste for feed production or energy recovery. Solutions of food waste utilization have to be technologically feasible, economically efficient and desirable by consumers.
Largest share of food waste arose together in agriculture, forestry, fishery and food processing sectors but in assessment the various aspects must be taken into consideration. Most of food waste is unavoidable, non-edible and cannot be used for alternative food production, for instance roots, husks, stalks, bones, shells, manure, fish scales, barks etc. Secondly, it is not possible to use waste material from logging (e.g. barks, branches, leaves, wooden chips) as food origin. Third rank of animal and vegetable waste production belongs to house-holds that means almost 57 kilograms per capita compared to 57.5 kilograms per capita from food processing or 25 kilograms per capita from services activities.

139
Food waste in the EU-28 can be reduced by raising awareness among food processors, retailers, food services and consumers and through application of common legislative rules and comprehensive measures.
References
1. Silvennoinen K., Katajajuuri J.-M., Hartikainen H., Jalkanen L., Koivupuro H., Reinikainen A.: Food waste volume and composition in the Finnish sup-ply chain: Special focus on food service sector. Fourth International Sympo-sium on Energy from Biomass and Waste, Cini Foundation, Venice, Italy; November 12-15, 2012.
2. Koivupuro H., Hartikainen H., Katajajuuri J.-M., Silvennoinen K., Heikinta-lo N., Reinikainen A., Jalkanen L.: Influence of socio-demographical, behav-ioural and attitudinal factors on the amount of avoidable food waste gener-ated in Finnish households. International Consumer Studies, vol. 36, no. 2, p. 183-191, 2011.
3. Monier, V. et al.: Preparatory study on food waste across EU 27 – final re-port. Bio Intelligence Service in association with AEA Energy & Environ-ment, October 2010.
4. Quested T., Parry A.: New estimates for household food and drink waste in the UK. Waste & Resources Action Programme, 2011.
5. Barabosz J., Hafner G., Kranert M.: Consumer Behaviour and Development of Food Waste in Model Households. [In:] Proceedings of the 8th Internation-al Conference ORBIT 2012 „Global Assessment for Organic Resources and Waste Management“. 12.-14 Juni 2012, Rennes (France), p. 79-82 (2012).
6. O’Connor, C.: Quantification of Food Waste in the EU. 4th meeting of Food Chain Analysis Network: Food Waste along the Supply Chain. Paris 20-21 June 2013.
7. Canali, M. et al.: Drivers of current food waste generation, threats of future increase and opportunities for reduction. Fusions EU project, Bologna 2014.
8. Gustavsson, J., et al.: Global food losses and food waste. International con-gress “Save food!” at Interpack, Düsseldorf, 2011.

140
Prof. dr hab. Wojciech Józwiak, dr Marek Zieli�ski, prof. dr hab. Wojciech Zi�tara Instytut Ekonomiki Rolnictwa i Gospodarki �ywno�ciowej – PIB, Warszawa
12 Susze w Polsce a sytuacja gospodarstw rolnych na glebach o jako�ci poniej �redniej
Wst�p 12.1
W pierwszej dekadzie obecnego tysi�clecia odnotowano w Europie nasi-lenie wyst�powania zjawisk ekstremalnych, powodzi, huraganów i dokuczli-wych susz na du�ych obszarach [Kundzewicz i in. 2006]. W Polsce natomiast przyrodnicy ju� w dwudziestoleciu mi�dzywojennym XX wieku zwracali uwag� na „stepowienie” Wielkopolski. Wspó�cze�nie nie stwierdza si� co prawda wy-ra@nych wieloletnich tendencji w sumie opadów atmosferycznych, ale bilans wodny wykazuje tendencj� ujemn� z powodu wzrostu temperatur powietrza (w XX wieku nast�pi� w Polsce wzrost �redniej temperatury o oko�o 1ºC) i ro-sn�cej sumy us�onecznienia (��cznego czasu penetracji powierzchni ziemi przez promienie s�oneczne), stwierdzonej wyra@nie od lat sze��dziesi�tych XX wieku. Szczególnie daje si� to odczu� wiosn� i wczesnym latem, kiedy trwa wegetacja ro�lin. Ustalono, �e tendencje te wzmog�y si� na pocz�tku tego tysi�clecia [Kundzewicz i in. 2006; Górski 2006].
Zasygnalizowane zmiany powoduj�, �e najwa�niejszym dla Polski sk�ad-nikiem warunków klimatycznych sta� si� bilans wodny [K�dziora 2005, s. 77]. Ma to bardzo du�e znaczenie dla produkcji rolniczej.
^rednie wieloletnie opady krajowe wynosz� 656 mm (489-764 mm). Mniejsze od tych wielko�ci opady (450-700 mm) wyst�puj� na obszarze Ni�u Polskiego mi�dzy dwiema granicami: na pó�nocy wyznacza j� w przybli�eniu linia ��cz�ca Szczecin, Gdask, Lidzbark Warmiski, E�k i Sejny, oraz dalej na wschód do granicy pastwowej, na po�udniu natomiast � Zielona Góra, Opole, pó�nocne okolice Kielc, uj�cie rzeki Czarnej do Wis�y, uj�cie Sanu do Wis�y, po�udniowe okolice Lublina i dalej do granicy z Ukrain�. W ramach tego obsza-ru wyró�nia si� teren z jeszcze mniejszymi opadami, w ilo�ci od 400 do 650 mm. Obejmuje go granica, któr� wyznaczaj� miasta i miejscowo�ci: Szcze-cin, Brodnica, Sierpc, Modlin, Kutno, Konin, ^rem, Pozna i Szczecin [K�dzio-ra 2005].
Najwi�ksze parowanie ma natomiast miejsce tam, gdzie wyst�puj� sto-sunkowo wysokie temperatury oraz ma�a wilgotno�� wzgl�dna powietrza. Sytu-acja ta wyst�puje na wi�kszej cz��� Ni�u Polskiego, gdzie – jak si� szacuje �

141
wyparowuje w ci�gu roku ponad 80% wody pochodz�cej z opadów atmosfe-rycznych. W cz��ci �rodkowo-zachodniej tego obszaru i na niewielkiej enklawie przy granicy wschodniej wska@nik ten przekracza nawet 85% i jest to jedna z najwi�kszych wielko�ci tego rodzaju w Europie. Pozosta�a cz��� wody wsi�ka, jest zu�ywana na potrzeby bytowe ludno�ci oraz cele gospodarcze i sp�ywa do morza [K�dziora 2005].
Prezentowane opracowanie zawiera zatem prób� udzielenia odpowiedzi na pytanie o wyniki ekonomiczne i rodzaj reprodukcji maj�tku trwa�ego pol-skich gospodarstw rolnych funkcjonuj�cych na obszarach cz�sto nara�onych na susze, z podkre�leniem sytuacji gospodarstw z glebami jako�ci poni�ej �redniej. Wi�kszo�� takich gleb charakteryzuje bowiem ma�a pojemno�� wodna. Wysy-cone wilgoci� utrzymuj� one wod� dost�pn� w dostatecznej ilo�ci dla korzeni ro�lin uprawnych przez kilkana�cie dni, podczas gdy na glebach dobrej jako�ci woda jest dost�pna 3-3,5 raza d�u�ej. Du�a cz��� upraw na glebach tego drugie-go rodzaju mo�e wi�c przetrwa� susz� letni� bez wi�kszego spadku plonów, na-tomiast na glebach gorszej jako�ci spadek ten jest wi�kszy.
Gospodarstwa rolne realizuj� przedsi�wzi�cia przeciwdzia�aj�ce nega-tywnym skutkom susz, a niektóre s� nawet w stanie uniezale�ni� si� od nich. S� jednak przedsi�wzi�cia znane od dawna, z których gospodarstwa nie korzystaj�, inne s� stosowane rzadko, a jeszcze inne nie s� wykorzystywane w pe�ni. W ar-tykule problematyce tej po�wiecono równie� nieco uwagi.
Sytuacja gospodarstw rolnych osób fizycznych funkcjonuj�cych 12.2 w gminach szczególnie dotkni�tych suszami
Korzystaj�c z wyników Systemu Monitoringu Suszy Rolniczej (SMSR), prowadzonego przez Instytut Uprawy, Nawo�enia i Gleboznawstwa-Pastwowy Instytut Badawczy w Pu�awach i obejmuj�cego lata 2006-2013, wydzielono gminy, które w tym o�mioletnim okresie by�y przez co najmniej 7 lat dotkni�te suszami. Zjawisko to obj��o 96 gmin, z tego 30 w województwie wielkopol-skim, 23 w �ódzkim, 21 w kujawsko-pomorskim, 14 w lubuskim i 8 w dolno�l�-skim (mapa 1). W gminach tych 297 gospodarstw prowadzi�o nieprzerwanie ra-chunkowo�� w analizowanym okresie na potrzeby Polskiego FADN, w pozosta-�ych za� gminach kraju rachunkowo�ci� tak� obj�to 4294 gospodarstwa. Rezul-taty analizy sporz�dzonej na postawie wyników tej rachunkowo�ci przedstawio-no w tabelach 1-3.

142
Tabela 1. Potencja� produkcyjny gospodarstw analizowanych grup i korzystanie z obcych czynników produkcji (liczby �rednie roczne z lat 2006-2013)
Mierniki, wska@niki i miana
Gospodarstwa w gminach: Ró�nica w procentach [(2-3)/3*100]
szczególnie dotkni�tych
suszami pozosta�ych
1 2 3 4 Liczba gospodarstw w grupie 297 4294 x^rednia powierzchnia u�ytków rolnych (ha) 34,4 36,5 -5,8 w tym grunty dzier�awione (%) 20,6 22,1 -1,5a
Udzia� gospodarstw po�o�onych na ONWb (%) 65,5 56,3 9,2a
Nak�ady pracy ogó�em na 1 ha u�ytków rol-nych (godz.) 122 121 0,8
w tym praca najemna (%) 7,5 8,8 -1,3a
^rednia warto�� aktywów (tys. z� na 1 AWUc ) 313,1 317,0 -1,2Stopa zad�u�enia (%) 10,8 11,7 0,9a
a ró�nica w punktach procentowych (2-3); b obszary o niekorzystnych warunkach gospodaro-wania; c liczba osób pe�nozatrudnionych
!ród�o:obliczenia M. Zieli�skiego sporz"dzone na postawie wyników monitoringu Polskiego FADN.
Tabela 2. Struktura (%) typów produkcyjnych (TF8) gospodarstw analizowanych grup
(liczby �rednie z lat 2006-2013)
Typy produkcyjne
Gospodarstwa w gminach: Ró�nica w punktach
procentowych (2-3)
szczególnie dotkni�tych
suszami pozosta�ych
1 2 3 4 Ogó�em, z tego: 100,0 100,0 x specjalizacja w: - uprawach polowych - uprawach ogrodniczych - uprawach trwa�ych - chowie krów mlecznych - chowie innych zwierz�t �ywionych pa-szami obj�to�ciowymi - chowie zwierz�t �ywionych paszami tre�ciwymi
25,7 0,31,0
14,5
3,47,8
22,7 2,9 3,7
23,1
2,1 7,5
3,0-2,6
- 2,7-8,6
1,3
0,3
produkcja niewyspecjalizowana (wielo-stronna) 47,3 38,0 9,3
�ród�o: obliczenia M. Zieli�skiego sporz"dzone na postawie wyników monitoringu Polskiego FADN.

143
Tabela 3. Warto�� produkcji, dochody, wydajno�� pracy i stopa reprodukcji maj�tku trwa�ego w gospodarstwach analizowanych grup (liczby �rednie roczne z lat 2006-2013)
Wska@niki, mierniki i miana
Gospodarstwa w gminach: Ró�nica w procentach [(2-3)/3*100]
szczególnie dotkni�tych
suszami pozosta�ych
1 2 3 4 ^rednia warto�� produkcji z gospodarstwa (tys. z�) 333,9 448,9 -25,6
^redni dochód z gospodarstwa (tys. z�) 73,2 83,2 -12,0Dochód jw. przeliczony na jednostk� nak�a-dów pracy w�asnej (tys. z� na 1 FWUa 39,6 43,3 -8,5
Stopa reprodukcji maj�tku trwa�ego (%) 0,2 0,7 -0,5b
a nak�ady pracy w�asnej w gospodarstwie przeliczone na osob� pe�nozatrudnion"; b ró�nica w punktach procentowych (2-3)
!ród�o: obliczenia M. Zieli�skiego sporz"dzone na postawie wyników monitoringu Polskiego FADN.
Z powy�szych tabel wynika, �e gospodarstwa rolne w gminach szczegól-nie dotkni�tych suszami na tle tych z gmin pozosta�ych:
by�y nieco mniejsze obszarowo i mia�y nieco wi�kszy udzia� gospodarstw funkcjonuj�cych na obszarach o niekorzystnych warunkach gospodarowania (ONW). Ta ostatnia cecha przyczynia�a si� do pog��biania skutków susz; � nieco wi�kszy by� udzia� tych z niewyspecjalizowan� (wielostronn�) produkcj�
dóbr okre�lonego rodzaju, prawdopodobnie dlatego, �e produkcja wielostronna zmniejsza ryzyko gospodarowania. Susze wyst�puj�ce w ró�nych porach okresu wegetacyjnego wywieraj� bowiem zró�nicowany wp�yw na uprawiane ró�ne ga-tunki ro�lin w zale�no�ci od ich cech genetycznych i etapu rozwoju podczas we-getacji. Mniejszy by� poza tym udzia� gospodarstw, które wyspecjalizowa�y si� w uprawach intensywnych � ogrodniczych i sadowniczych, poniewa� ich potrzeby wodne s� w przeliczeniu na jednostk� powierzchni wi�ksze ni� wi�kszo�ci in-nych upraw;
� bardzo du�y, bo przekraczaj�cy 70%, by� udzia� gospodarstw z produkcj� zwie-rz�c� (wyspecjalizowan� oraz prowadzon� w ramach produkcji wielostronnej) w obu porównywanych grupach, cho� wska@nik ten by� nieco wi�kszy w go-spodarstwach zlokalizowanych w gminach szczególnie nara�onych na susze. Bez produkcji zwierz�cej trudno jest zbilansowa� potrzeby w zakresie nawo�e-nia organicznego z ich produkcj�33, a bez stosowania nawozów organicznych,
33 Potrzeby w zakresie nawo�enia organicznego mo�na zbilansowa� w gospodarstwach bez produkcji zwierz�cej lub z produkcj� tak� prowadzon� na ma�� skal�, pod warunkiem uprawy zbó�, niektórych ro�lin oleistych, ro�lin str�czkowych i poplonów, a nast�pnie dostarczenie

144
lub z ich stosowaniem w ilo�ciach niedostatecznych, efekty ekonomiczne go-spodarstw s� wyra@nie gorsze ni� w gospodarstwach stosuj�cych to nawo�enie zgodnie z wymaganiami poprawnej agrotechniki [Zieliski 2014]. Ma to zwi�-zek z popraw� retencyjno�ci gleby, poniewa� trwa�e zwi�kszenie w glebie za-warto�ci substancji organicznej o 1% powi�ksza magazynowanie wody o 100 ton na 1 ha [K�dziora 2005];
� charakteryzuje je du�o mniejsza skala produkcji, znacz�co mniejsze dochody i nieco mniejsza dochodowo�� pracy w�asnej (dochód z gospodarstwa przeli-czony na jednostk� nak�adów pracy w�asnej),
� mniejsze dochody gospodarstw i dochodowo�� pracy w�asnej by�y prawdo-podobnymi przyczynami mniejszej stopy reprodukcji rozszerzonej maj�tku trwa�ego, co ogranicza mo�liwo�ci adaptacyjne gospodarstw. Spostrze�enie to mo�e wyja�nia� przyczyn� mniejszej powierzchni u�ytków rolnych i mniejsz� warto�� aktywów przeliczonych na jednostk� ��cznych nak�adów pracy (techniczne wyposa�enie pracy).
W�ród analizowanych 297 gospodarstw funkcjonuj�cych w gminach szcze-gólnie dotkni�tych suszami znalaz�y si� trzy z warto�ci� produkcji wynosz�c� co najmniej 1 mln z� w przeliczeniu na 1 ha u�ytków rolnych. Jedno z nich, licz�ce 0,6 ha u�ytków rolnych, wyspecjalizowa�o si� w uprawach ogrodniczych, dwa pozo-sta�e natomiast wyspecjalizowa�y si� w produkcji drobiarskiej. Pierwsze z 2,2 ha u�ytków rolnych mia�o pog�owie zwierz�t w ilo�ci oko�o 156 LU (livestock unit – jednostka przeliczeniowa zwierz�t), drugie natomiast, dysponuj�ce powierzchni� mniejsz� ni� 0,1 ha, mia�o pog�owie licz�ce oko�o 55 LU. Odpowiada�o to odpo-wiednio pog�owiu oko�o 11 tys. i 4 tys. kur niosek lub 2 razy wi�cej broilerów ku-rzych. Taka organizacja produkcji ogranicza�a bardzo silnie wp�yw susz na uzyski-wane efekty. Produkcja ogrodnicza mia�a bowiem miejsce pod os�onami, drobiarska natomiast by�a prowadzona z u�yciem pasz kupowanych.
Powy�sze spostrze�enie wykorzystano, przyst�puj�c do rachunku skut-ków cz�sto wyst�puj�cych susz dla gospodarstw z glebami jako�ci poni�ej �red-niej. Z panelu 297 gospodarstw po�o�onych na terenie gmin szczególnie do-tkni�tych suszami wydzielono 3 gospodarstwa (oko�o 1% ogó�u), jedno z produkcj� ro�linn� pod os�onami i 2 z produkcj� drobiarsk� realizowan� g�ów-nie z wykorzystaniem pasz kupowanych. One bowiem uniezale�ni�y si� niemal ca�kowicie od negatywnych skutków susz. Z panelu 4294 gospodarstw z gmin pozosta�ych wydzielono natomiast 8 (0,2% ogó�u) takich gospodarstw. Z obu tych grup wydzielono nast�pnie gospodarstwa z glebami jako�ci poni�ej �red-niej, czyli ze wska@nikiem bonitacji gruntów WBG � 0,7. Krótk� liczbow� cha-rakterystyk� gospodarstw obu tych grup zawieraj� tabele 4-6.
do gleby odpowiednio spreparowanej s�omy i masy zielonej. Mo�liwy jest te� zakup substan-cji organicznej, ale jej poda� jest mocno ograniczona.

145
Tabela 4. Potencja� produkcyjny gospodarstw analizowanych grup z glebami jako�ci poniej �redniej (WBG � 0,7) i warto�ci� produkcji z 1 ha uytków rolnych poniej
1 mln z�; liczby �rednie roczne z lat 2006-2013
Mierniki, wska@niki i miana
Gospodarstwa w gminach: Ró�nica w procen-tach [(2-
3)/3�100]
szczególnie dotkni�tych
suszami pozosta�ych
1 2 3 4 Liczba gospodarstw w grupie 108 1608 x^rednia powierzchnia u�ytków rolnych (ha) 30,2 35,8 -15,9w tym grunty dzier�awione (%) 12,3 21,8 -9,5a
Udzia� gospodarstw po�o�onych na ONWb (%) 95,4 89,3 6,1a
Nak�ady pracy ogó�em na 1 ha u�ytków rolnych (godz.) 133 124 -7,2
w tym praca najemna (%) 4,2 6,0 -1,8a
^rednia warto�� aktywów (tys. z�. na 1 AWUc ) 256,9 280,4 -8,4Stopa zad�u�enia (%) 11,0 13,9 -2,9a
a ró�nica w punktach procentowych (2-3); b obszary o niekorzystnych warunkach gospodaro-wania; c liczba osób pe�nozatrudnionych
!ród�o: ustalenia poczynione na podstawie opracowania [Zieli�ski 2015].
Tabela 5. Struktura (%) typów rolniczych gospodarstw (TF8) analizowanych grup
z glebami jako�ci poniej �redniej i warto�ci� produkcji z 1 ha uytków rolnych poniej 1 mln z�; liczby �rednie roczne z lat 2006-2013
Typy produkcyjne
Gospodarstwa w gminach: Ró�nica w punktach
procentowych (2-3)
szczególnie dotkni�tych
suszami pozosta�ych
1 2 3 4 Ogó�em, z tego: 100,0 100,0 Xspecjalizacja w: - uprawach polowych - uprawach ogrodniczych - uprawach trwa�ych - chowie krów mlecznych - chowie innych zwierz�t �ywionych paszami obj�to�ciowymi - chowie zwierz�t �ywionych paszami tre�ciwymi
22,2 0,90,0
22,5
2,66,3
9,4
3,0 1,8
36,9
3,7 7,9
12,8-2,1
- 1,7-14,4
-1,1-1,6
produkcja niewyspecjalizowana (wielostronna) 45,5 37,3 8,2
!ród�o: [Zieli�ski 2015].

146
Tabela 6. Warto�� produkcji, dochody, wydajno�� pracy i stopa reprodukcji maj�tku trwa�ego w gospodarstwach analizowanych grup z glebami jako�ci poniej �redniej
(WBG � 0,7) i warto�ci� produkcji z 1 ha uytków rolnych poniej 1 mln z�; liczby �rednie roczne z lat 2006-2013
Wska@niki, mierniki i miana
Gospodarstwa w gminach: Ró�nica w procentach [(2-3)/3*100]
szczególnie dotkni�tych
suszami pozosta�ych
1 2 3 4 ^rednia warto�� produkcji z gospodarstwa (tys. z�) 169,1 218,4 -22,6
^redni dochód gospodarstwa (tys. z�) 54,6 73,1 -25,3Dochód jw. przeliczony na jednostk� pracy w�asnej (tys. z� na 1 FWUa) 29,7 38,1 -22,0
Stopa reprodukcji maj�tku trwa�ego (%) -0,7 1,0 - 1,7b
a nak�ady pracy w�asnej w gospodarstwie przeliczone na osob� pe�nozatrudnion"; b ró�nica w punktach procentowych (2-3)
!ród�o: ustalenia poczynione na podstawie opracowania [Zieli�ski 2015].
Z tabel 4-6 wynika, �e gospodarstwa rolne z glebami jako�ci poni�ej �redniej i z gmin szczególnie dotkni�tych suszami mia�y na tle analogicznie wy-odr�bnionych gospodarstw z gmin pozosta�ych: � du�o mniejsze dochody i du�o mniejsze dochody przeliczone na jednostk�
nak�adów pracy w�asnej (dochodowo�� nak�adów pracy w�asnej), a istotn� tego przyczyn� by�a du�o mniejsza warto�� pozyskiwanej produkcji;
� mniejszy udzia� upraw intensywnych – ogrodniczych i trwa�ych – zapewne ze wzgl�du na du�e zapotrzebowanie wody na jednostk� powierzchni;
� niewiele wi�kszy udzia� gospodarstw z produkcj� wielostronn�, która ograni-cza ryzyko ponoszone w produkcji ro�linnej i mniejszy udzia� gospodarstw z produkcj� zwierz�c�. To ostatnie zjawisko budzi obaw� o mo�liwo�ci zbi-lansowania nawozów organicznych. Sytuacja taka sk�ania do sformu�owania wniosku, �e organizacja produkcji w cz��ci gospodarstw z obszarów szcze-gólnie nara�onych na susze mo�e nie by� dopasowana do specyficznych wa-runków przyrodniczych, a to mo�e by� jedn� z przyczyn uzyskiwania gor-szych efektów ekonomicznych;
� wyra@nie mniejsz�: powierzchni� u�ytków rolnych, warto�� aktywów przeli-czonych na jednostk� ��cznych nak�adów pracy (techniczne wyposa�enie pracy) i stop� reprodukcji maj�tku trwa�ego. Ten ostatni wska@nik mia� wiel-ko�� mniejsz� od zera, co informowa�o o deprecjacji tego maj�tku. Najbar-dziej prawdopodobn� przyczyn� tej sytuacji by�y mniejsze dochody, które ogranicza�y mo�liwo�ci reprodukcji maj�tku trwa�ego gospodarstw.

147
Materia�y wykorzystane w przedstawionej wy�ej analizie nie pozwoli�y wskaza� pe�nego zestawu przedsi�wzi��, które s� wykorzystywane w gospodarstwach osób fizycznych do �agodzenia niekorzystnych skutków susz. S� jeszcze inne, których realizacja znajduje si� w zasi�gu mo�liwo�ci producen-tów rolnych. Wyniki d�ugoletnich bada prowadzonych w okolicy Turwi w Wielkopolsce wskazuj� na przyk�ad, �e zadrzewienia w krajobrazie rolniczym z dominuj�cym udzia�em zbó� zmniejszaj� parowanie w okresie wegetacyjnym �oko�o 40 mm rocznie, co odpowiada udost�pnieniu korzeniom ro�lin oko�o 400 ton wody na 1 ha upraw. Oczywi�cie celowo zak�adane zadrzewienia zmniejsz� nieco powierzchni� u�ytków rolnych [K�dziora 2005], co ogranicza zbiory pozy-skiwane z ro�lin uprawnych. Cytowany autor pisze ponadto, �e do poprawy bilan-su wodnego kraju przyczyni si� tak�e upowszechnienie stosowania zabiegów agromelioracyjnych na glebach �rednio zwi�z�ych i zwi�z�ych, zajmuj�cych oko-�o 26% krajowej powierzchni u�ytków rolnych. Post�puj�ca mechanizacja prac polowych i uprawa p�u�na powoduje bowiem ugniatanie gleby i powstawanie tak zwanej podeszwy p�u�nej, co utrudnia przesi�kanie wody z opadów atmosferycz-nych. Po wykonaniu zabiegu agromelioracyjnego zasoby wody g��binowej s� powi�kszane po ka�dym wi�kszym opadzie atmosferycznym i równie� mog� by� wykorzystywane do celów gospodarczych.
Podsumowanie i wnioski 12.3
Literatura tematu zawiera informacj� o zmianie klimatu w Europie od po-cz�tku ubieg�ego wieku i o symptomach wskazuj�cych, �e zjawisko to ulega na-sileniu. W Polsce w zwi�zku z tym ulega pogorszeniu bilans wodny. W rolnictwie znajduje to wyraz w coraz cz��ciej wyst�puj�cych suszach powo-dowanych rosn�c� temperatur� powietrza i rosn�cym czasem penetracji po-wierzchni ziemi przez promienie s�oneczne.
Susze wywieraj� obecnie wp�yw g�ównie na gospodarstwa rolne funkcjo-nuj�ce na wi�kszej cz��ci obszaru Ni�u Polskiego, obejmuj�cego oko�o 39% ca�kowitej powierzchni kraju. Szczególne nasilenie susz ma miejsce w �rodko-wo-zachodniej cz��ci Ni�u, w województwie wielkopolskim oraz w wojewódz-twach przyleg�ych.
Opracowanie zawiera dwojakiego rodzaju analiz� skutków susz. Jedna polega na porównaniu charakterystyk gospodarstw z obszarów o najwi�kszym nasileniu wyst�powania susz z charakterystyk� tych z innych obszarów kraju. W drugiej natomiast analizie porównano jedynie gospodarstwa z glebami jako-�ci poni�ej �redniej. W jednym i drugim przypadku @ród�em materia�ów empi-rycznych by�y gospodarstwa prowadz�ce nieprzerwanie rachunkowo�� w ramach Polskiego FADN w latach 2006-2013.

148
Ustalono, �e gospodarstwa z gmin nara�onych szczególnie na wyst�po-wanie susz mia�y mniejsze dochody, dochody te przeliczone na jednostk� nak�a-dów pracy w�asnej i ograniczone mo�liwo�ci adaptacyjne, o czym informowa�y mniejsze stopy reprodukcji maj�tku trwa�ego. Dzia�o si� tak, mimo �e gospodar-stwa mia�y ukierunkowan� produkcj� tak, aby ograniczy� skutki susz. Wi�kszy by� wi�c udzia� tych z produkcj� niewyspecjalizowan� (wielostronn�), zapewne dlatego, �e produkcja taka ogranicza ryzyko gospodarowania. Susze wyst�puj�-ce w ró�nych porach okresu wegetacyjnego wywieraj� bowiem zró�nicowany wp�yw na uprawiane ró�ne gatunki ro�lin w zale�no�ci od ich cech genetycz-nych i etapu rozwoju podczas wegetacji. Mniejszy by� poza tym udzia� gospo-darstw, które wyspecjalizowa�y si� w uprawach intensywnych � ogrodniczych i sadowniczych � poniewa� ich potrzeby wodne s� w przeliczeniu na jednostk� powierzchni wi�ksze ni� wi�kszo�ci upraw innych. Tylko znikoma cz��� gospo-darstw zdo�a�a uniezale�ni� si� w ca�o�ci lub w du�ym stopniu od niekorzyst-nych warunków przyrodniczych, rozwijaj�c produkcj� ro�linn� pod os�onami lub produkcj� zwierz�c�, wykorzystuj�c do tego celu pasze pochodz�ce z zakupu. Przyj�to, �e �wiadczy�a o tym warto�� produkcji liczona standardowo w kwocie 1 mln z� w przeliczeniu na 1 ha u�ytków rolnych.
Analizowane zjawisko wyst�pi�o szczególnie wyra@nie w gospodarstwach z u�ytkami rolnymi jako�ci poni�ej �redniej. Z grupy tej usuni�to gospodarstwa, które w cz��ci lub w pe�ni uniezale�ni�y si� od niekorzystnych warunków oto-czenia. Te z obszarów szczególnie dotkni�tych suszami mia�y na tle analogicz-nie wyodr�bnionych gospodarstw z obszarów pozosta�ych du�o mniejsze do-chody, du�o mniejsze dochody przeliczone na jednostk� nak�adów pracy w�a-snej i w przeciwiestwie do tamtych ujemn� reprodukcj� maj�tku trwa�ego. Najprawdopodobniej wa�n� tego przyczyn� by�a du�o mniejsza warto�� pozy-skiwanej produkcji. Wszystko to wskazuje na stopniowo post�puj�c� schy�ko-wo�� gospodarstw analizowanej grupy.
Charakteryzowane gospodarstwa adaptowa�y si� do szczególnie nieko-rzystnych warunków gospodarowania na podobne sposoby, jak ogó� analizowa-nych gospodarstw. Wi�kszy by� jednak udzia� gospodarstw wyspecjalizowanych w produkcji ró�nego rodzaju dóbr pochodzenia ro�linnego w funkcjonuj�cych gospodarstwach na obszarach szczególnie dotkni�tych suszami w porównaniu z tymi, które prowadzi�y produkcj� na obszarach pozosta�ych. Brak lub niewiel-ka produkcja zwierz�ca utrudnia zbilansowanie nawo�enia organicznego, które jest jednym z czynników poprawiaj�cych gospodark� wod�, tak wa�n� w sytua-cji cz�sto wyst�puj�cych susz. Spostrze�enie to sk�ania do sformu�owania hipo-tetycznego wniosku, �e organizacja produkcji w cz��ci analizowanych gospo-darstw z obszarów cz�sto nara�onych na wyst�powanie susz nie by�a dopasowa-

149
na do specyficznych warunków przyrodniczych, co prowadzi�o do gorszych efektów ekonomicznych ograniczaj�cych mi�dzy innymi mo�liwo�ci adaptacyj-ne gospodarstw.
Bibiografia
1. Górski T., Zmiany warunków agroklimatycznych i d�ugo�� okresu wegetacji ro�lin w ostatnim stuleciu, pr. zbior. pod red. M. Gutry-Koryckiej, A. K�dziory, L. Starkla i L. Ryszkowskiego D�ugookresowe przemiany krajobrazu Polski w wyniku zmian klimatu i u�ytkowania ziemi, Komitet Narodowy IGBP do spraw Mi�dzynarodowego Programu „Zmiany geosfery i biosfery” PAN i Zak�ad Bada ^rodowiska Rolniczego i Le�nego PAN, Pozna 2006, s. 74.
2. K�dziora A., Przyrodnicze podstawy gospodarowania woda w Polsce, pr. zbior. pod red. L. Ryszkowskiego i A. K�dziory Ochrona �rodowiska w gospodarce przestrzennej, Zak�ad Bada ^rodowiska Rolniczego i Le�nego PAN, Pozna 2005, s. 77-87 i 96-103.
3. Kundzewicz Z.W., Szwed M., Radziejewski M., Zmiany globalne i ekstremalne zjawiska hydrologiczne: powodzie i susze, pr. zbior. pod red. M. Gutry-Koryckiej, A. K�dziory, L. Starkla i L. Ryszkowskiego D�ugoo-kresowe przemiany krajobrazu Polski w wyniku zmian klimatu i u�ytkowania ziemi, Komitet Narodowy IGBP do spraw Mi�dzynarodowego Programu „Zmiany geosfery i biosfery” PAN i Zak�ad Bada ^rodowiska Rolniczego i Le�nego PAN, Pozna 2006, s. 169-170 i 178-179.
4. Zieliski M., Emisja gazów cieplarnianych a wyniki ekonomiczne gospo-darstw specjalizuj"cych si� w uprawach polowych, maszynopis rozprawy doktorskiej, IERiGQ-PIB, Warszawa 2014, s. 58-59 i 99-114.
5. Zieliski M., Sytuacja ekonomiczna gospodarstw rolnych szczególnie zagro-�onych wyst"pieniem suszy rolniczej i gospodarstw pozosta�ych w latach 2006-2013, pr. zbior. pod red. W. Józwiaka Przedsi�biorstwo i gospodarstwo rolne wobec zmian klimatu i polityki rolnej [1], Program Wieloletni 2015-2019, nr 16, IERiGQ-PIB, Warszawa 2015, s. 41-47.

150
Dr Monica Mihaela TUDOR Institute of Agricultural Economics – Romanian Academy, Bucharest, Romania
13 Resilience of Romanian agriculture – an overview
Introduction 13.1
The resilience concept has its origins in the Latin language, where “re-siliere” means bounce back or rebound. In this context, the economic resilience can be understood as the ability of an economic activity to fast recover from a shock, resistance to the shock effects, the capacity to avoid shocks in general (firewall or shock-absorption) [Zaman and Georgescu 2015, p. 270]. In the Briguglio vision, the economic resilience means identifying the ways and man-ners of solving the issues related to increasing the capacity of averting or recov-ering from the negative effects of external shocks [Briguglio et al. 2008].
Given the importance of the primary sector (agriculture) for the economy and for the rural life, the paper analyses of this branch of national economy is developed in this paper, from the perspective of its contribution to Romania’s economic resilience. The objective of this study has in view the analysis of agri-culture’s capacity to actively contribute to the diminution of vulnerabilities and of Romania’s economy exposure to the shocks induced by major economic cri-ses, such as the last global financial crisis (in 2008-2012) which also affected our country. Agriculture’s role of economic resilience factor is analysed from the perspective of primary sector contribution to shock attenuation and to the recovery from the last financial crisis that began in 2008.
Methodological approach 13.2
For a better interpretation of the place and role of the primary sector in Romania’s economy resistance in the face of major economic crises, the eco-nomic resilience is investigated in the territory, at NUTS 3 level – the 42 coun-ties of Romania. This approach has in view revealing the territorial disparities with regard to the amplitude of the economic crisis effects, persistence of these effects and the primary sector contribution to the general economic crisis attenu-ation and to a faster recovery from the crisis. The analysis across countries pro-vides a better orientation of the intervention needs through public economic re-structuring policies in these areas that feature a higher economic vulnerability to crises and a lower capacity to recover from shock [Augustine et al. 2013]. The analytical approach of an economic sector in the territory – agriculture – has in view identifying those areas in Romania in which the primary sector represented

151
a stability factor throughout the economic crisis, while supplying the resources for economic growth relaunching after the recession period. Thus, agriculture in these areas has proved its capacity to be a territorial economic resilience factor.
The present study was developed having in view the following parameters: � Recovery time of the gross domestic product (GDP) decline at county level,
which expresses the capacity to recover after the external shocks of the econ-omies of the Romanian counties, hence the economic resilience of the county economic systems (dependent variable);
� Turnover variation in the primary sector, on the one hand, and the secondary and tertiary sectors, on the other, so as to capture whether and to what extent agriculture has contributed to shock attenuation and recovery from the crisis, in the territory (independent variables). The turnover of active enterprises is an important predictor of the development level of a given economy, regard-less of the territorial aggregation level – national, regional or county level, etc. Turnover evolution in time decisively conditions the trajectory of the economy on the economic curb cycle.
In order to test the research hypothesis previously mentioned, we assume that the analysis of the turnover structure by activity sectors and mainly of its evolution in time allows us to test the primary sector contribution to Romania’s economic relaunching after the economic crisis. The disaggregation of these in-dicators at territorial level can provide significant information on the relation between the economic relaunching and agriculture.
The method used was the multiple linear regression. We shall next con-sider the counties as functionally integrated sub-systems from the economic and social point of view. The statistical data used in the analysis cover the period from the beginning of the crisis up to the recovery of economic performance gaps caused by the crisis and are collected at the level of administrative- -territorial units at county level.
Last financial crisis in Romania – an overview 13.3
The last financial crisis had its effects on the Romanian economy, mainly after 2008, its implications being revealed by the gross domestic product con-traction by 6.6% in 2009 compared to 2008. The economic decline continued throughout the next year, GDP value in 2010 reached 92.4% of its value in the year when the crisis began (Fig. 1).
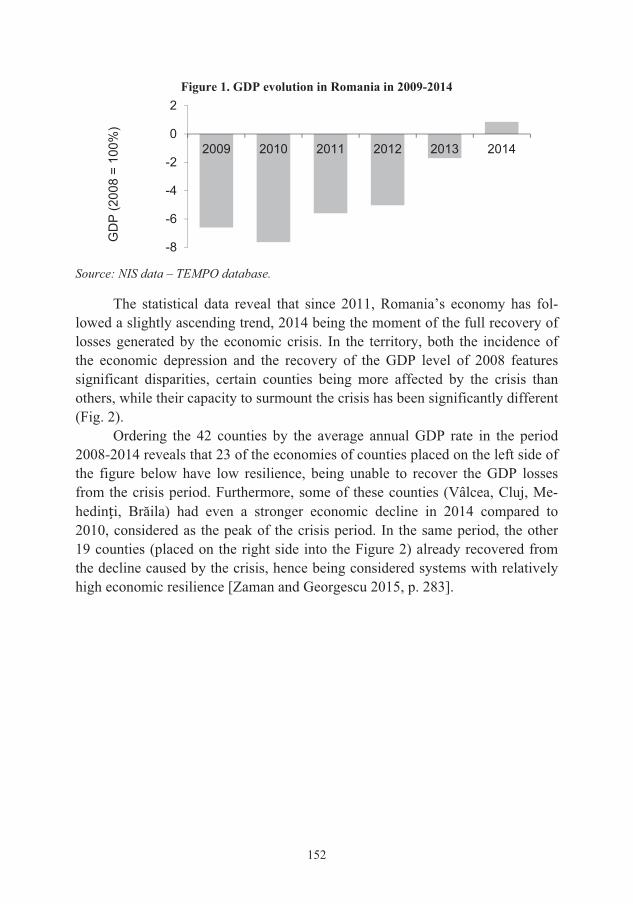
152
Figure 1. GDP evolution in Romania in 2009-2014
Source: NIS data – TEMPO database.
The statistical data reveal that since 2011, Romania’s economy has fol-lowed a slightly ascending trend, 2014 being the moment of the full recovery of losses generated by the economic crisis. In the territory, both the incidence of the economic depression and the recovery of the GDP level of 2008 features significant disparities, certain counties being more affected by the crisis than others, while their capacity to surmount the crisis has been significantly different (Fig. 2).
Ordering the 42 counties by the average annual GDP rate in the period 2008-2014 reveals that 23 of the economies of counties placed on the left side of the figure below have low resilience, being unable to recover the GDP losses from the crisis period. Furthermore, some of these counties (Vâlcea, Cluj, Me-hedinDi, Br¡ila) had even a stronger economic decline in 2014 compared to 2010, considered as the peak of the crisis period. In the same period, the other 19 counties (placed on the right side into the Figure 2) already recovered from the decline caused by the crisis, hence being considered systems with relatively high economic resilience [Zaman and Georgescu 2015, p. 283].
-8
-6
-4
-2
0
2
2009 2010 2011 2012 2013 2014
GD
P (2
008
= 10
0%)

153
Figure 2. GDP variation across counties during the financial crisis
Source: own calculations based on NIS and NCP data.
The analysis of statistical data by counties reveals the existence of a statis-tically significant correlation between the intensity of the economic decline in-duced by the financial crisis (county GDP variation in 2010 compared to 2008) and the capacity to return to the GDP level of 2008. Thus, at the level of coun-ties where the crisis had lower effects, and hence they proved to be more re-sistant to external shocks, GDP contraction recovered faster.
Both in newspapers and at academic level is has been acknowledged that agriculture represented a national economic branch with leverage effect, signifi-cantly contributing to counterbalancing the economic crisis effects upon the en-tire Romanian economy. We shall next try to test the correctness of these state-ments that we consider as hypotheses for this part of our study.
Romanian agriculture at a glance 13.4
Farm structure in Romania is dominated by small farms (Fig. 3). Accord-ing to the data from the last Agricultural census, in 2010, the Romanian holdings with a standard output under EUR 8,000 account for 97% of total number of holdings and operate on 42% of Romanian utilised agricultural area (UAA).

154
Figure 3. Farm structure in Romania according to the Standard Output (SO)
Source: based on EUROSTAT data.
Despite of this unbalanced structure of holdings, the economic perfor-mance seems to be higher for the subsistence and semi-subsistence Romanian farms than that obtained for the large-sized farms on the basis of their produc-tion diversification. The statistical data of the last agricultural census of 2010 and the structural survey from 2013 reveal that the small-sized farms in Roma-nia have the highest economic performance.
Thus, at the level of farms whose standard value of annual economic out-put is lower than EUR 2,000, the standard output per one-hectare utilised agri-cultural area (SO/1 ha UAA) value is getting closer to the national average. The Romanian farms whose value of annual standard output ranges from EUR 2,000 to EUR 8,000 (considered semi-subsistence farms) obtain the highest perfor-mance levels per unit of utilised area compared to the farms from the other size categories (Fig. 4).
2.6
15.6
8.1
2.0
0.6
0.3
0.2
0.1
0.04
0.032.
9
18.6
10.6
9.7
5.2
3.8 6.
4 8.3 13
.1
9.3 12
.1
70.4
0
10
20
30
40
50
60
70
Zeroeuros
< 2000 2000 -3999
4000 -7999
8000 -14999
15000 -24999
25000 -49999
50000 -99999
100000 -249999
250000 -499999
> 500000euros
%
% in total no. of farms % in total UAA

155
Figure 4. Disparities in farm performance in Romania according to their economic dimension
Source: own calculations based on EUROSTAT data.
For the large farms (with agricultural productions exceeding standard economic value of EUR 500,000 annually), the economic efficiency of land use decreased in 2013 compared to 2010; it is, in fact, the only category of farms that recorded such a trend between 2010 and 2013. Therefore, we believe that the large farms have achieved the maximum in the economy of scale paradigm and their economic performance is likely to decrease in the coming period.
Romanian agriculture as a resilience factor 13.5
The analysis of the statistical data on the turnover structure of local active units at national level reveals that throughout the last economic-financial crisis, the contribution of the primary sector of the Romanian economy to total reve-nues from sales of goods, execution of works and from services significantly increased. Thus, while in the first year of the economic crisis agriculture repre-sented only 1.22% of the total turnover of enterprises from Romania, by the year 2012 this share increased to 2.55% (Table 1). The contribution of the secondary and tertiary sectors to total turnover simultaneously decreased.
Table 1. Turnover structure on local units, by national economy branches,
2008-2012 (in %) National economy branches 2008 2009 2010 2011 2012 Agriculture, hunting and related services 1.22 1.60 1.74 2.33 2.55 Sylviculture and forest operation 0.28 0.33 0.36 0.37 0.38 Fisheries and aquaculture 0.02 0.04 0.02 0.02 0.02 Total industry, constructions, trade and other services 98.47 98.02 97.89 97.29 97.06
Source: NIS, TEMPO on-line database.
EU-27 average (2010)
0500
10001500
< 2
000
€
2000
-39
99
4000
-79
99
8000
-14
999
1500
0-24
999
2500
0-49
999
5000
0-99
999
1000
00-
2499
99
2500
00-
4999
99
�500
000
€
aver
age
stan
dard
ou
tput
/ ha
UA
A(e
uro
/ ha)
farm category according to SO / farm2010 2013

156
In real terms, these data reveal that throughout the economic crisis, Ro-mania’s economic decline was mainly determined by turnover contraction in the secondary and tertiary sectors, while agriculture seems to have had a counterbal-ancing effect to the economic decline produced by industry, constructions and services.
The analysis of available statistical data across counties, referring to turn-over variation as against the moment of economic crisis beginning, reveals how the main economic sectors impact GDP evolution. The multiple linear regres-sion model reveals that GDP variation across counties (as dependent variable), throughout the economic crisis period, is directly linked to turnover evolution (independent variable) from the secondary and tertiary sectors, with agriculture having a partial compensation effect on the economic system contraction at county level.
Thus, while in the peak year of economic crisis, i.e. 2010 and throughout the decline recovery period (the last year for which there are available statistical data at county level – 2012), the net turnover of active enterprises in agriculture, hunting and related services was superior to that in 2008, for all the counties of Romania, except for Gorj county. The average yearly turnover growth rate in the primary sec-tor reached 20.5% in 2008-2012; only one county had a negative growth rate (Gorj), while in only six counties the turnover in agriculture increased by less than 10%. For the remaining 35 counties, the average value of transactions with agricul-tural goods and services increased by 10% up to 50%. Hence, the analysis across counties reconfirms that agriculture had a positive contribution to national econo-my, counteracting the negative effects of economic crisis.
On the other hand, the secondary and tertiary sectors, which had the greatest contribution to the creation of turnover at national level, in the year 2013 (last year for which data are available) continued to have values of sales of goods and services lower than those in the year when the crisis began, for most counties. In 2008-2013, the average yearly turnover growth rate, cumulated for the secondary and tertiary sectors, was negative (-5%). Across counties, only one of the 42 counties of Romania had a positive average yearly turnover growth rate in industry, constructions and services (Arad); for half of the num-ber of counties, the yearly decrease rates of turnover in the secondary and ter-tiary sectors ranged from -15% to -5%.

157
Figure 5. Turnover variation of local active enterprises, by counties
(a) turnover variation in 2010 compared to 2008
(b) turnover variation in 2012 compared to 2008
Source: own calculations based on NIS data (TEMPO on-line and eDEMOS databases).
The statistical data by counties reveal that in the peak year of the econom-ic crisis (2010), while the active enterprises in the secondary and tertiary sectors restrained their activity in all counties, the turnover of active enterprises in the primary sector stagnated or slightly increased in all the administrative-territorial units of the country (Fig. 5a). Thus, the resilience to crisis of the active econom-ic operators in agriculture proved to be quite strong.
While the active enterprises in industry, constructions and services are still recovering from the efficiency losses from the period of 2009-2010, the primary sector continues to improve its capacity to produce economic value and its contribution to GDP recovery at county level. The graphic illustration of turnover variation on local active enterprises by economic sectors, for 2012, more clearly reveals the capacity of economic operators from the primary sector

158
to follow a growth trajectory that can also mobilize the other economic sectors to which they provide raw materials.
The primary sector followed a stronger ascending trend in the counties with greater economic resilience (the 19 counties that recovered the GDP losses before 2014, which resulted from the financial crisis, and are found on the right side of the graphic illustration from Fig. 5). It is worth mentioning that for the other counties, with lower economic resilience, agriculture is a sector where turnover increased, compared to the remaining business segments whose turno-ver contracted. This reveals agriculture’s contribution to the improvement of macro-economic parameters of the economic systems at county level.
Turnover increase in the primary sector of the Romanian economy is associat-ed with the increase of the agricultural production insertion on the market. Thus, the share of the value of marketed agricultural products and services in total production value of agriculture practically doubled in the economic crisis period, increasing from about 17% in 2008 to 38% in 2012 nationwide.
Final remarks 13.6
In Romania the primary sector contribution to counterbalancing the negative effects on GDP generated by the recent financial crisis, by increasing the turnover value in agriculture, represent a solid argument in favour of the statement that Ro-mania’s agriculture is a system with relatively high resilience to shocks and, at the same time, a supplier of economic resilience for the entire economy.
References
1. Augustine N., Wolman H., Wial H., McMillen M. (2013), Regional Econom-ic Capacity, Economic Shocks and Economic Resilience. Washington, DC: MacArthur Foundation Research Network, http://brr.berkeley. edu/wp-content/uploads/2013/05/Augustine-resilience-capacity2.pdf.
2. Briguglio L., Cordina, G., Tarrugia, N., Vella, S., (May, 2008), Economic Vulnerability and Resilience. Concepts and Measurements, UN University WIDER World Institute for Development Economics Research, Research paper no. 2008/55.
3. Zaman Gh., Georgescu G. (coord.) (2015), Dezvoltarea economica endogena la nivel regional: cazul Romaniei, ISBN: 978-973-618-408-6, Expert pub-lishing house, Bucharest.
4. National Institute for Statistics (NIS) – TEMPO on-line database and eDEMOS detabase, www.insse.ro.
5. National Commission for Prognoses (CNP), Prognoses, www.cnp.ro. 6. EUROSTAT database.

159
Annex
ANOVAb
Model Sum of Squares Df
Mean Square F Sig.
1 Regression 29.743 2 14.872 6.366 .004a
Residual 91.104 39 2.336 Total 120.847 41
Coefficientsa Model Unstandard-
ized Coefficients
Stand-ardized Coeffi-cients
t Sig. 95.0% Confidence Interval for B
B Std. Error
Beta Low-er
Bound
Upper Bound
1 Constant) 2.026 .598 3.389 .002
.817 3.236
average yearly growth rate of turnover for the active enterprises in secondary and tertiary sectors
.227 .072 .444 3.166 .003
.082 .372
average yearly growth rate of turnover for the active enterprises in primary sector
-.035 .017 -.290 -2.067 .045
-.070 -.001
a. Dependent Variable: GDP’s average yearly growth rate
Model Summaryb Model
R R Squa-
re
Adjusted R Square
Std. Er-ror of the Estimate
Change Statistics R Square Change
F Change
df1 df2 Sig. F Change
1 .496a .246 .207 1.52840 .246 6.366 2 39 .004a. Predictors: (Constant), average yearly growth rate of turnover for the active enterprises in primary sector (agriculture, hunting and related services); average yearly growth rate of turnover for the active enterprises in secondary and tertiary sectors (industry, constructions, trade and other services) b. Dependent Variable: GDP’s average yearly growth rate

160
Dr Piotr Szajner, mgr Wies�aw Dzwonkowski
Instytut Ekonomiki Rolnictwa i Gospodarki �ywno�ciowej – PIB, Warszawa
14 Ocena moliwo�ci substytucji �ruty sojowej GM krajowymi ro�linami bia�kowymi w aspekcie bilansu paszowego
Wst�p 14.1
Organizmami modyfikowanymi genetycznie (GMO – Genetically Modi-fied Organizm) nazywamy organizmy, w których materia� genetyczny zosta� zmieniony w sposób niezachodz�cy w warunkach naturalnych wskutek krzy�o-wania lub naturalnej rekombinacji poprzez wprowadzenie za pomoc� ró�nych metod dowolnego genu z innego organizmu do genomu modyfikowanego orga-nizmu. Zmiana genów ma na celu nadanie ro�linom po��danych przez cz�owie-ka cech, tj. zwi�kszonej tolerancji na herbicydy, owady i choroby, odporno�� na niekorzystne warunki �rodowiska czy popraw� cech jako�ciowych (smak, za-pach, kszta�t) [Encyklopedia PWN 2015].
In�ynieria genetyczna rozwija si� bardzo dynamicznie. Posiadamy coraz wi�ksz� wiedz� na temat roli genów i DNA w �ywych organizmach, przepro-wadzanie ich modyfikacji oraz wprowadzanie do innych organizmów. Uprawy ro�lin genetycznie modyfikowanych, obok niepodwa�alnych korzy�ci, do któ-rych zaliczy� mo�na wzrost wydajno�ci gospodarstw rolnych, spadek zu�ycia chemicznych �rodków ochrony ro�lin, popularyzacj� bezorkowego systemu oraz ograniczenie zu�ycia paliwa, niesie ze sob� obawy o nieznane d�ugofalowe skutki zmian genetycznych ro�lin. Wieloletnie badania wskazuj� na brak dowo-dów odno�nie negatywnego oddzia�ywania spo�ywanych produktów zawieraj�-cych w sk�adzie GMO, ale podstawowym problem pozostaje koegzystencja upraw konwencjonalnych i modyfikowanych. Nie wydaje si� bowiem mo�liwe zapewnienie pe�nej odr�bno�ci tych upraw i zagwarantowanie konsumentom dost�pu do produktów, w sk�adzie których nie b�dzie sk�adników GMO. Jako g�ówne dylematy i zagro�enia zwi�zane z u�ytkowaniem zdefiniowano m.in.: wysokie koszty u�ytkowania technologii, koszty koegzystencji, post�puj�c� koncentracj� i monopolizacj� sektora agrobiotechnologicznego, monokulturyza-cj� produkcji ro�linnej oraz mo�liwo�� wywo�ania nieodwracalnych zmian w ró�norodno�ci biologicznej [Szkar�at 2011].
Trudno jest obecnie produkowa�, zw�aszcza w Europie i innych krajach wysokorozwini�tych, mi�so drobiowe czy wieprzowe bez wykorzystania pasz zawieraj�cych soj� GM. Ro�liny modyfikowane genetycznie maj� bowiem bar-

161
dzo du�e znaczenie w produkcji pasz wysokobia�kowych. Uprawa soi GM w 2014 r. stanowi�a 82% upraw tej ro�liny na �wiecie i 50% powierzchni wszystkich upraw GM. Ponadto szacuje si�, �e 93-95% �ruty sojowej w handlu mi�dzynarodowym stanowi �ruta wytworzona z ro�lin GM.
Prawne aspekty GMO na �wiecie i w Polsce 14.2
Uj�cie zagadnienia GMO w ramy prawne, w poszczególnych krajach czy grupach krajów, jest niezwykle skomplikowane. Twórcy przepisów poza trud-no�ciami wynikaj�cymi z ró�norodno�ci rozwi�za biotechnologicznych, zmie-rzy� musz� si� z interesami ró�nych uczestników stosunków mi�dzynarodowych niejednokrotnie wzajemnie si� wykluczaj�cymi. W�ród pastw wymieni� nale�y takie, które popieraj� przyj�cie przepisów u�atwiaj�cych dalszy rozwój bada oraz upowszechnienie rozwi�za biotechnologicznych i pastwa d���ce do wy-kluczenia obecno�ci produktów genetycznie modyfikowanych na ich terenie. Odmienne interesy wyst�puj� w grupie pastw produkuj�cych �ywno�� GM i j� eksportuj�cych i pastw – importerów �ywno�ci, a tak�e w gronie pastw rozwi-jaj�cych si� i rozwini�tych [Szkar�at 2011]. Generalnie jednak mo�na wyró�ni� trzy zasadnicze rodzaje podej��: sektorowe (wertykalne), horyzontalne i mie-szane. Podej�cie sektorowe cechuje si� tym, i� GMO traktowane jest jak ka�dy inny sk�adnik danego produktu i poddawany jest regulacjom dotycz�cym ca�ego produktu w ramach istniej�cych systemów prawnych dotycz�cych �ywno�ci, ochrony ro�lin itp. W praktyce oznacza to, �e u�ycie tego samego zmodyfiko-wanego organizmu mo�e by� inaczej interpretowane, a przez to brak jest pewnej kompleksowo�ci kontroli. Takie podej�cie preferowane jest m.in. w Stanach Zjednoczonych. Z kolei podej�cie horyzontalne traktuje GMO jako jedn� ca�o�� niezale�nie od sposobu ich wykorzystania, a regulacje tego typu stosowane s� w prawodawstwie unijnym oraz poszczególnych krajów cz�onkowskich. Nie wykluczaj� one jednak istnienia regulacji sektorowych.
Do stanowisk poszczególnych pastw nale�y doda� tak�e postulaty zg�a-szane przez organizacje mi�dzynarodowe i pozarz�dowe, korporacje transnaro-dowe, stowarzyszenia i fundacje oraz przedstawicieli �wiata nauki. Isaac i Kerr [2007] uwa�aj�, �e obecnie w procesie negocjacji porozumie mi�dzynarodo-wych oprócz poszczególnych pastw czynny udzia� bior� uczestnicy niepa-stwowi, a ostateczne rozwi�zania musz� uwzgl�dnia� interesy zarówno podmio-tów publicznych, jak i prywatnych.
W ostatnich latach dyskusja w UE na temat przysz�o�ci GMO skoncen-trowana jest g�ównie na zapewnieniu pastwom cz�onkowskim odr�bno�ci prawnej przy decydowaniu o uprawie GMO na podstawach innych ni� te oparte na ocenie ryzyka dla zdrowia i ryzyka �rodowiskowego. W wyniku prac Parla-

162
ment Europejski i Rada (UE) 13 marca 2015 r. opublikowa�y dyrektyw� 2015/412 z dnia 11 marca 2015 r. w sprawie zmiany dyrektywy 2001/18/WE w zakresie umo�liwienia pastwom cz�onkowskim ograniczenia lub zakazu uprawy organizmów GM na swoim terytorium. Wcze�niej kraje cz�onkowskie UE mia�y wprawdzie mo�liwo�� wprowadzenia na swoim terytorium czasowych ogranicze lub zakazu autoryzowanych na szczeblu UE upraw GMO, ale musia-�y to uzasadni� wzgl�dami bezpieczestwa ludzi i �rodowiska. W praktyce by�o to do�� trudne.
Nowe przepisy przewiduj�, �e ka�dy organizm GM przeznaczony do uprawy na terenie UE b�dzie musia� przej�� dwuetapow� weryfikacj�. Etap pierwszy doty-czy� b�dzie zatwierdzenia GMO na szczeblu unijnym przez Europejski Urz�d ds. Bezpieczestwa Qywno�ci (EFSA). Dopuszczenie danej uprawy GMO przez EFSA nie zobowi�zuje poszczególnych krajów UE do jej uprawy na swoim terytorium. Pastwa mog� zakazywa� uprawy konkretnego organizmu, ich grup b�d@ ca�o�ci upraw GMO, a zakaz uzasadni� „celami polityki ochrony �rodowiska, zagospoda-rowaniem przestrzennym w miastach i na obszarach wiejskich, u�ytkowaniem grun-tów, skutkami spo�eczno-gospodarczymi, unikaniem obecno�ci GMO w innych pro-duktach, celami polityki rolnej, polityk� publiczn�”. Nowe przepisy chroni� tak�e kraje unijne przed przypadkowym zasiewem organizmów GM. Przepisy wprowa-dzone przez zmian� dyrektywy zobowi�zuj� pastwa cz�onkowskie, w których uprawia si� GMO, do podejmowania na obszarach przygranicznych �rodków zapo-biegaj�cych ska�eniom transgranicznym (stref buforowych), czyli uniemo�liwiaj�-cych przedostanie si� GMO za granic�, ale tylko do pastw cz�onkowskich, w któ-rych genetycznie zmodyfikowane uprawy s� zakazane. Przepis ten b�dzie obowi�-zywa� od 3 kwietnia 2017 r. Do 3 pa@dziernika 2015 r. pastwa unijne mog�y poin-formowa� Komisj� Europejsk� o zamiarze wprowadzenia zakazu upraw GMO na mocy tzw. klauzuli opt-out. Z tej mo�liwo�ci skorzysta�o 19 pastw unijnych. Dekla-racj� o skorzystaniu z klauzuli z�o�y�y: Austria, Belgia (tylko dla obszaru Walonii), Bu�garia, Chorwacja, Cypr, Dania, Francja, Grecja, Holandia, Litwa, Luksemburg, ¢otwa, Malta, Niemcy (z wyj�tkiem upraw dla celów naukowych), Polska, S�owe-nia, W�gry, Wielka Brytania (dla obszaru Szkocji, Walii i Pó�nocnej Irlandii) oraz W�ochy. Nowe podej�cie ma na celu osi�gni�cie odpowiedniej równowagi pomi�dzy utrzymaniem unijnego systemu zatwierdzania a swobod� pastw cz�onkowskich w zakresie decydowania o uprawie GMO na swoim terytorium.
Rada Ministrów w dn. 18 listopada 2008 r. przyj��a Ramowe Stanowisko RP dotycz�ce Organizmów Genetycznie Zmodyfikowanych. Ramowe Stanowi-sko Rz�du jest stanowiskiem negatywnym w stosunku do wprowadzania na ry-nek wspólnotowy organizmów GM jako �ywno�� i pasze. Dodatkowo sprzeci-wia si� równie� wprowadzaniu do obrotu produktów na podstawie dyrektywy

163
2001/18/WE, dopuszczaniu GMO z przeznaczeniem na uprawy, prowadzeniu na terytorium RP zamierzonego uwalniania GMO do �rodowiska w celach do-�wiadczalnych. Uznaje jednak za zasadne wykonywanie do�wiadcze maj�cych na celu uzyskanie wyników rolno-�rodowiskowych dotycz�cych wp�ywu orga-nizmów genetycznie zmodyfikowanych na �rodowisko w warunkach klimatycz-nych Polski, prowadzonych przez jednostki naukowe i szko�y wy�sze.
Ustawy sektorowe maj� zasadnicze znaczenie dla funkcjonowania GMO w Polsce. Od 2006 r. Polska jest jednym z wi�kszych przeciwników stosowania ro�lin zmodyfikowanych genetycznie i poprzez regulacje prawne d��y do zaka-zu obrotu i upraw tych ro�lin, czy produktów z nich wyprodukowanych. W 2006 r. znowelizowano ustaw� o paszach, wprowadzaj�c do niej zapisy umo�liwiaj�ce realizacj� tych celów. Wprowadzono zapis o zakazie wytwarza-nia, wprowadzania do obrotu i stosowania w �ywieniu zwierz�t pasz genetycz-nie zmodyfikowanych oraz organizmów genetycznie zmodyfikowanych prze-znaczonych do u�ytku paszowego. Wprawdzie wskutek d�ugoletnich stara i lobbingu organizacji bran�owych wprowadzono moratorium na zakaz stoso-wania pasz GMO do stycznia 2017 r.
Rozwój �wiatowej produkcji ro�lin GMO i ich znaczenie 14.3w bilansie bia�kowym
W 2014 r. powierzchnia upraw ro�lin genetycznie zmodyfikowanych wy-nios�a 181,5 mln ha, o 3,6% wi�cej ni� w roku poprzednim, tym samym utrzy-many zosta� nieprzerwany wzrost zasiewów od 1996 r. (rys. 1).
Rys. 1. �wiatowa powierzchnia upraw ro�lin GM (mln ha)
!ród�o: C. James, Global Status of Commercialized Biotech/GM Crops, nr 44, ISAAA 2014.
W ro�linach, które dopuszczono do uprawy na �wiecie w 2014 r., dominu-je transformacja uodparniaj�ca na dzia�anie herbicydów (57% upraw), nast�pnie
211
2840 44 53 59 68
81 90102
114125 134
148160170 175 182
y = 10.189x - 7.9456R² = 0.9959
0
40
80
120
160
200
'96 '98 '00 '02 '04 '06 '08 '10 '12 '14

164
odmiany odporne na owady (15%) oraz modyfikacje dwu- lub trzystopniowe (28%) [James 2014].
Dynamiczny rozwój upraw GMO w okresie kilkunastu lat spowodowa�, �e wiele ga��zi gospodarki rolno-�ywno�ciowej zosta�o w du�ej cz��ci uzale�-nione od korzystania z produktów GM (g�ównie przemys� paszowy oraz pro-dukcja drobiu i wieprzowiny). Jednocze�nie wraz z zakazem stosowania m�czek pochodzenia zwierz�cego w �ywieniu zwierz�t i w konsekwencji ograniczeniu dost�pu do tego rodzaju bia�ka zwi�kszy� si� �wiatowy popyt na pasze wysoko-bia�kowe pochodzenia ro�linnego, zw�aszcza na �rut� sojow� i rzepakow�.
Najwi�kszym producentem soi GM na �wiecie pozostaj� USA (32,3 mln ha), które wyprzedzaj� Brazyli� (29,1 mln ha) i Argentyn� (20,8 mln ha). ¢�cznie modyfikowan� soj� uprawiano w 2014 r. na obszarze 11 krajów, g�ównie w obu Amerykach. Dynamicznie zwi�kszaj�cy si� area� upraw spowo-dowa�, �e w przypadku soi 82% globalnych zasiewów tej ro�liny dokonywanych jest przy u�yciu nasion zmodyfikowanych. Udzia� upraw soi GM w uprawach soi ogó�em, w poszczególnych krajach jest zró�nicowany i wynosi od 93% w Brazylii, 94% w USA do 100% w Argentynie.
Rys. 2. �wiatowy handel �rutami oleistych i m�czk� rybn� (mln ton)
!ród�o: obliczenia w�asne na podstawie danych USDA-FAS.
W latach 2000-2015 �wiatowa produkcja i zu�ycie �rut oleistych zwi�k-szy�a si� o ok. 73,5%, w tym �ruty sojowej i rzepakowej o ok. 85%. Nast�pi� wzrost udzia�u �ruty sojowej w �wiatowej produkcji �rut oleistych do ponad 70%, a w �wiatowym handlu do 75%. G�ównymi producentami i eksporterami soi i �ruty sojowej s� kraje Ameryki Po�udniowej i USA, gdzie udzia� GMO
0
20
40
60
80
100
1996/97 2001/02 2003/04 2005/06 2007/08 2009/10 2011/12 2013/14 2015/16
Sojowa Rzepakowa S�onecznikowaM�czka rybna Pozosta�e

165
w uprawach tej ro�liny systematycznie ro�nie i obecnie wynosi od 93-94% (Bra-zylia, USA) do 100% (Argentyna). W konsekwencji w obrotach handlowych na rynku �wiatowym ju� ok. 95% �wiatowego handlu ziarnem i 93-95% (wed�ug szacunków IERiGQ-PIB) handlu �rut� sojow� stanowi� produkty GMO.
^wiatowe obroty surowcami wysokobia�kowymi s� zdominowane przez �rut� sojow�, której udzia� w strukturze �wiatowego handlu wszystkimi �rutami i m�czk� rybn� w ostatnich latach wynosi� ok. 75%. Udzia� �ruty rzepakowej i s�onecznikowej zwi�kszy� si� z ok. 4% w 2000 r. do ok. 7% �rednio w trzech ostatnich latach, kosztem spadku znaczenia m�czki rybnej, której udzia� w �wiatowym handlu zmniejszy� si� z 7% do zaledwie 2,4% w 2015 r.
Jest du�a liczba producentów �ruty sojowej na �wiecie, która w wielu kra-jach oparta jest na imporcie nasion (przede wszystkim Chiny i UE), ale tylko nieliczne kraje maj� nadwy�ki i s� eksporterami netto.
Tabela 1. G�ówni producenci, eksporterzy i importerzy �ruty sojowej (mln ton) Wyszczególnienie 2000 2005 2010 2013 2014 2015
Produkcja ogó�em 116,0 146,4 174,4 189,5 206,5 215,4 Chiny 15,1 27,3 43,6 54,5 59,2 63,6 USA 35,7 37,4 35,6 36,9 40,9 40,7 Argentyna 13,7 25,0 29,3 27,9 30,9 32,6 Brazylia 17,7 21,9 28,2 28,5 30,9 31,0 UE 13,3 10,9 9,6 10,6 11,1 11,7 Indie 3,6 5,4 7,4 6,6 5,7 5,8 Pozostali 16,9 18,5 20,7 24,4 27,8 30,0
Eksport ogó�em 36,3 52,2 58,5 60,0 63,6 66,2 Argentyna 13,7 24,2 27,6 25,0 28,5 30,6 Brazylia 10,7 12,9 14,0 13,9 14,4 15,6 USA 7,3 7,3 8,2 10,5 11,9 10,8 Paragwaj 0,6 0,8 1,0 2,5 2,6 3,0 Chiny 0,2 0,4 0,5 2,0 1,6 1,9 Boliwia 0,5 1,2 1,1 1,5 1,5 1,6 Indie 2,4 4,3 4,8 2,7 1,1 0,7 Pozostali 0,8 1,2 1,3 1,9 2,0 2,1 Import ogó�em 35,9 51,4 56,9 57,9 61,3 64,0
UE 17,8 22,9 21,9 18,1 19,3 20,3 Wietnam 0,4 1,7 2,7 3,3 4,2 4,6 Indonezja 1,6 2,1 3,1 4,0 3,9 4,5 Tajlandia 1,4 2,0 2,3 2,7 3,0 3,1 Filipiny 1,1 1,6 2,0 2,3 2,2 2,4 Iran 0,4 0,5 1,7 2,7 1,9 2,1 Meksyk 0,3 1,7 1,5 1,4 1,8 1,9 Pozostali 12,8 18,8 21,7 23,4 23,9 25,1
!ród�o: USDA-FAS.

166
Dotyczy to w zasadzie USA oraz krajów Ameryki Po�udniowej: Argenty-ny, Brazylii, a w ostatnich latach równie� Paragwaju i Boliwii. Eksport ww. krajów w ok. 96% decyduje o �wiatowych obrotach �rut� sojow�, przy czym niekwestionowanym liderem jest Argentyna, której sprzeda� �ruty sojowej na rynki zagraniczne zwi�kszy�a si� z 13,7 mln ton w 2000 r. do ponad 30 mln ton w 2015 r. W tym okresie Brazylia zwi�kszy�a swój eksport z 10,7 do 15,6 mln ton, a USA z 7,4 do 10,8 mln ton.
G�ównymi importerami surowców wysokobia�kowych jest UE oraz kraje azjatyckie: Indonezja, Wietnam, Tajlandia, Filipiny, Japonia oraz Iran i Meksyk, przy czym znacznie wi�ksz� dynamik� wzrostu zapotrzebowania importowego charakteryzuj� si� kraje azjatyckie. Chiny i Indie, gdzie popyt i zu�ycie �rut ole-istych wzrasta najszybciej, rozwijaj� w�asn� produkcj� i przetwórstwo nasion oleistych lub te�, zw�aszcza Chiny, dynamicznie zwi�kszaj� import samych na-sion, które nast�pnie przerabiaj� w olejarniach na olej i �rut�.
Krajowy rynek pasz wysokobia�kowych 14.4
W Polsce jest produkowany ograniczony asortyment pasz tre�ciwych mo-g�cych stanowi� warto�ciowe komponenty do produkcji pasz, w tym zw�aszcza pasz przemys�owych. Stosunkowo niskie s� zbiory kukurydzy, a ze wzgl�dów klimatycznych w ogóle nie produkuje si� soi czy innych nasion oleistych, z których uzyskuje si� bardziej warto�ciowe ni� �ruta rzepakowa wysokobia�-kowe surowce paszowe.
W produkcji surowców wysokobia�kowych g�ówne znaczenie maj�: �ruty oleiste (rzepakowe), nasiona str�czkowych pastewnych oraz m�czki pochodze-nia zwierz�cego, od 2003 r. wy��cznie m�czka rybna. W latach 2000-2003 po-ziom tej produkcji by� w miar� stabilny i w poszczególnych latach waha� si� w przedziale 650-800 tys. ton. W okresie 2004-2009 r. mia� miejsce dynamiczny jej wzrost, do poziomu 1,67 mln ton. W latach 2010-2015 produkcja tych pasz waha�a si� w przedziale 1,54-1,96 mln, przy czym najwy�szy jej poziom odno-towano w 2015 r., g�ównie dzi�ki rekordowej produkcji str�czkowych pastew-nych na ziarno.
Tabela 2. Produkcja krajowa wysokobia�kowych surowców paszowych (tys. ton)
Wyszczególnienie 2000 2005 2010 2013 2014 2015
^ruty rzepakowe* 492 810 1310 1244 1494 1390 M�czki zwierz�ce* 148 18 20 21 22 23 Nasiona str�czkowe 166 186 268 291 352 542 Ogó�em w tys. ton 806 1014 1598 1556 1868 1955
* szacunki w�asne !ród�o: obliczono na podstawie danych GUS i szacunków w�asnych.

167
W krajowym bilansie wysokobia�kowych pasz, w sytuacji du�ego deficy-tu bia�ka, szczególn� rol� powinny odgrywa� ro�liny str�czkowe. Równie� nie-doceniane pozostaj� walory str�czkowych jako znakomitego przedplonu, wzbo-gacaj�cego gleb� w azot (od 40 do 90 kg N/ha) oraz przyczyniaj�ce si� do po-prawy jej w�a�ciwo�ci fizycznych, chemicznych i biologicznych [Szuka�a 2012]. Zawieraj� przeci�tnie od 20% (groch) do nawet 40% (�ubin �ó�ty) bia�ka ogól-nego, charakteryzuj�cego si� niedoborem aminokwasów siarkowych. W przy-padku �ubinu zaznacza si� tak�e niezbilansowanie bia�ka w zakresie lizyny [Hanczakowska i Ksi��ak 2012]. Pasze te s�abo konkuruj� ze �rutami poekstrak-cyjnymi, a w szczególno�ci ze �rut� rzepakow�, w której znaczna cz��� nak�a-dów na upraw� i zbiór pokrywa sam olej.
W latach 2000-2014 zbiory str�czkowych pastewnych waha�y si� w prze-dziale 117-395 tys. ton. Ten poziom produkcji by� osi�gany na powierzchni 53-193 tys. ha i przy �rednich plonach 18-27 dt/ha. W 2015 r. ich produkcja wzros�a do ok. 542 tys. ton.
Rys. 3. Produkcja str�czkowych pastewnych na ziarno (tys. ton)
!ród�o: obliczenia w�asne na podstawie danych GUS.
Plony wysokobia�kowych w Polsce s� niskie. Najni�szym poziomem plonów charakteryzuje si� �ubin, którego wydajno�� z hektara w latach waha�a si� w przedziale 14,-17,5 dt/ha. Nieco lepiej plonuje groch, ale wysoko�� jego plonów rzadko przekracza 20 dt/ha. Jego wydajno�� z hektara w trzech ostatnich latach wa-ha�a si� w przedziale 15,5-19,2 dt/ha. Spo�ród ro�lin str�czkowych najlepiej plonuje bobik, którego przeci�tna wydajno�� z hektara w polskich warunkach waha si�
050
100150200250300350400450500550
Bobik ¢ubin Peluszka + wyka Mieszanki zbo�owo-str�czkowe

168
w przedziale 20-28 dt/ha. Natomiast poziom plonów mieszanek zbo�owo-str�czkowych jest tylko nieznacznie ni�szy od przeci�tnych plonów zbó�.
Od 2010 r. produkcja str�czkowych i motylkowych jest wspierana dodat-kowymi p�atno�ciami obszarowymi, które w tym�e roku wynios�y 207 z�/ha, w 2011 r. niespe�na 220 z�/ha, w 2012 r. 673 z�/ha, w 2013 r. wzros�y do 719 z�/ha, a w 2014 r. obni�y�y si� do 556 z�/ha. W 2015 r. wysoko�� wsparcia dla ro�lin wysokobia�kowych zmniejszy�a si� do 422 z�/ha. Wprowadzenie do-datkowego wsparcia finansowego do upraw str�czkowych pastewnych spowo-dowa�o wzrost zainteresowania ich upraw�, zw�aszcza w ostatnim roku analizo-wanego okresu, ale przemys� paszowy nie jest zainteresowany ich zakupem.
G�ówn� przyczyn� braku zainteresowania przemys�u paszowego nasio-nami str�czkowymi s� stosunkowo wysokie ceny przy relatywnie niskiej zawar-to�ci bia�ka i gorszej ni� w przypadku wielu innych surowców bia�kowych jego jako�ci. Istotnym ograniczeniem wykorzystania nasion str�czkowych w przemy-�le paszowym jest tak�e mo�liwo�� zapewnienia wi�kszych dostaw surowca o standardowych parametrach, gdy� ich produkcja jest rozdrobniona. Str�czko-we pastewne na ziarno s� uprawiane g�ównie na w�asne potrzeby, a towarowo�� ich produkcji wynosi zaledwie kilka procent (ich skup w 2012 i 2013 r. wynosi� nieca�e 6 tys. ton rocznie, a w 2014 r. wzrós� do 11,2 tys. ton). Przeci�tna po-wierzchnia uprawy ro�lin str�czkowych w 2015 r. wynios�a ok. 3,2 ha, a mie-szanek zbo�owo-str�czkowych 3,5 ha. Skup od licznych drobnych producentów jest kosztoch�onny i podwy�sza ceny surowca.
Produkcja surowców wysokobia�kowych w Polsce od lat nie pokrywa za-potrzebowania, a wyst�puj�ce niedobory pokrywane s� dostawami z importu. Przedmiotem importu s� przede wszystkim surowce wysokobia�kowe, ale rów-nie� zbo�a paszowe (g�ównie kukurydza i j�czmie paszowy).
Wraz z d��eniem do poprawy efektywno�ci chowu oraz wzrostem pro-dukcji drobiarskiej systematycznie ro�nie zapotrzebowanie na surowce wysoko-bia�kowe. Ich zu�ycie w latach 2000-2015 zwi�kszy�o si� 2-krotnie (z 1,96 do 3,90 mln ton). ^rednioroczne tempo tego wzrostu wynios�o 4,7%.
Post�p genetyczny, jaki dokona� si� w ostatnich latach w hodowli zwie-rz�t gospodarskich, spowodowa� znaczne zwi�kszenie ich potencja�u produkcyj-nego. Obecnie zwierz�ta zdolne do wysokiej produkcyjno�ci s� jednocze�nie bardzo wymagaj�ce pod wzgl�dem �ywienia i warunków utrzymania. Dotyczy to zarówno ras �wi o wysokim potencjale genetycznym, brojlerów kurzych i indyczych, kur niosek i krów o wysokiej wydajno�ci mlecznej. W celu mak-symalnego wykorzystania potencja�u genetycznego wymagaj� one szczególnego �ywienia, polegaj�cego na dok�adnym pokryciu wysokiego zapotrzebowania na sk�adniki pokarmowe. Powinno uwzgl�dnia� ich zawarto�� w poszczególnych

169
materia�ach paszowych oraz bra� pod uwag� ochron� �rodowiska. Wi��e si� to z ograniczeniem wydalania do �rodowiska nadmiaru sk�adników mineralnych oraz produktów przemiany azotowej. Racjonalne �ywienie wymaga dostarczenia im w paszy odpowiedniej ilo�ci wysokiej jako�ci bia�ka, energii, sk�adników mineralnych, witamin oraz dodatków paszowych. Jednocze�nie pasze wp�ywaj� na sk�ad i jako�� pozyskiwanych produktów pochodzenia zwierz�cego, co zw�aszcza z punktu widzenia konsumenta ma znaczenie priorytetowe.
Tabela 3. Zuycie surowców wysokobia�kowych (tys. ton)
Wyszczególnienie 2000/01
2005/06
2010/11
2013/14
2014/15
2015/16
^ruty nasion oleistych 1487 2447 3133 2766 3260 3382 sojowa 1084 1850 1888 1719 2019 2040 rzepakowa 304 429 764 596 854 907 s�onecznikowa 90 166 451 446 382 430 pozosta�e 9 3 29 6 5 5 M�czki poch. zwierz�cego* 296 26 24 29 31 33 Nasiona str�czkowe 174 207 284 278 333 485 Razem zu�ycie 1956 2680 3440 3073 3623 3900
Struktura zu�ycia (%) ^ruty nasion oleistych 76,0 91,3 91,1 90,0 90,0 86,6 sojowa 55,4 69,0 54,9 55,9 55,7 54,8 rzepakowa 15,5 16,0 22,2 19,4 23,6 23,3 s�onecznikowa 4,6 6,2 13,1 14,5 10,5 11,0 pozosta�e 0,5 0,1 0,8 0,2 0,1 0,1 M�czki poch. zwierz�cego* 15,1 1,0 0,7 0,9 0,9 0,8 Nasiona str�czkowe 8,9 7,7 8,3 9,0 9,2 12,4 Razem zu�ycie 100,0 100,0 100,0 100,0 100,0 100,0
* w 2000 r. �"cznie z m"czk" mi�sno-kostn". !ród�o: obliczenia w�asne na podstawie danych GUS, CIHZ, CAAA i MF.
W zu�yciu �rut g�ówne znaczenie ma �ruta sojowa, której ca�a dost�pna poda� pochodzi z importu. Jej wykorzystanie zwi�kszy�o si� z 1,08 mln ton w 2000 r. do ok. 2,04 mln ton w 2015 r. Skokowy wzrost zapotrzebowania na t� �rut� mia� miejsce po wprowadzeniu w kocu 2000 r. zakazu importu m�czek mi�sno-kostnych, które wówczas stanowi�y istotn� cz��� zasobów wysokobia�-kowych. Jednak, o ile zu�ycie �rut oleistych ogó�em w ostatnim dziesi�cioleciu wzros�o o ok. 42% ogó�em, to przypadku �ruty sojowej dynamika tego wzrostu wynios�a ok. 15%, przy jednoczesnym dosy� szybkim wzro�cie wykorzystania taszych �rut: rzepakowej i s�onecznikowej (ponad 2-krotnie).

170
Spo�ród dost�pnych na wi�ksz� skal� na rynku surowców wysokobia�kowych najbardziej warto�ciowa pod wzgl�dem �ywieniowym jest importowana �ruta sojo-wa. Nie ma mo�liwo�ci jednoznacznej weryfikacji udzia�u �ruty sojowej GM w tym bilansie, ale wed�ug ocen przedstawicieli przemys�u paszowego i ekspertów zajmu-j�cych si� kwestiami paszoznawstwa i �ywienia zwierz�t gospodarskich, udzia� ten mo�e si�ga� nawet 95-98%. Oznacza to, �e �rednioroczne zu�ycie �ruty sojowej GM w �ywieniu zwierz�t gospodarskich (g�ównie poprzez wykorzystanie w przemys�o-wych mieszankach pe�noporcjowych i uzupe�niaj�cych) przekracza 1,9 mln ton, co stanowi wi�cej ni� po�ow� wszystkich zasobów pasz wysokobia�kowych.
Tabela 4. Bilans surowców wysokobia�kowych w Polsce (w tys. ton)
Wyszczególnienie 2000/01 2005/06 2010/11 2013/14 2014/15 2015/16 Produkcja ogó�em 806 1014 1598 1556 1868 1956 Eksport 207 405 621 841 829 710 Import na cele paszowe 1357 2071 2463 2358 2584 2654 Zu�ycie na cele paszowe 1956 2680 3440 3073 3623 3900 Udzia� importu w zu�yciu % 69,4 77,3 71,6 76,7 71,3 68,1
Zu�ycie �ruty sojowej 1084 1850 1888 1719 2019 2040 Zu�ycie str�czkowych 174 207 284 278 333 485 Udzia� �r. sojowej w zu�y-ciu %
55,4 69,0 54,9 55,9 55,7 52,3
Udzia� str�czkowych w zu�yciu % 8,9 7,7 8,3 9,0 9,2 12,4
!ród�o: GUS i szacunki w�asne.
Mo�liwo�ci zast�pienia importowanej �ruty sojowej GM krajowymi pa-szami bia�kowymi (str�czkowymi) s� bardzo ograniczone przede wszystkim z powodu ich niskiej produkcji, ale równie� i ze wzgl�du na ograniczenia �y-wieniowe, szczególnie w mieszankach paszowych dla drobiu i m�odych �wi, a tak�e ze wzgl�du na nadmiern� zawarto�� w�glowodanów strukturalnych (w�ókna) oraz substancji antyod�ywczych (alkaloidy, taniny).
Wed�ug specjalistów od �ywienia [Brzóska 2009] udzia� nasion grochu w mieszankach paszowych dla drobiu rze@nego mo�e si�ga� 6-10%, dla kur nio-sek 15%. Dla trzody te udzia�y mog� by� nieco wy�sze: 15-20% dla tuczników i 10% dla loch i knurów. Nasiona bobiku w mieszankach paszowych dla brojle-rów mog� stanowi� 5-8%, a dla tuczników ok. 15%. W przypadku �ubinów ograniczeniem w ich stosowaniu dla zwierz�t monogastrycznych jest wysoka zawarto�� w�ókna. W mieszankach dla prze�uwaczy nasiona str�czkowe mog� stanowi� nawet 35%.

171
Przekroczenie dopuszczalnych udzia�ów ro�lin str�czkowych w dietach dla zwierz�t obni�a efektywno�� produkcji i jej ekonomiczne skutki. W stosun-ku do obecnego poziomu ich zu�ycia s� mo�liwo�ci zwi�kszenia wykorzystania krajowych ro�lin str�czkowych w �ywieniu zwierz�t na wi�ksz� skal� ni� do-tychczas, ale pod warunkiem, �e b�d� one dost�pne na rynku w wystarczaj�cej ilo�ci. Wykluczaj� jednak�e ca�kowite zast�pienie �ruty sojowej, a co najwy�ej mog� ograniczy� dynamik� wzrostu jej importu. Równie� wyniki bada nauko-wych prowadzonych w instytutach podleg�ych Ministerstwu Rolnictwa i Roz-woju Wsi (Instytut Zootechniki - PIB, IERiGQ - PIB), a tak�e analiza bilansu paszowego w Polsce wskazuje, �e w naszej strefie klimatycznej nie ma alterna-tywnych pasz wysokobia�kowych mog�cych ca�kowicie zast�pi� importowan� �rut� sojow�.
Jak wynika z kalkulacji kosztów bia�ka paszowego w surowcach bia�ko-wych nasiona str�czkowe, z wyj�tkiem �ubinu, nie nale�� do najtaszych. Cena bia�ka zawartego w �rucie sojowej jest nieco wy�sza od ceny tego bia�ka bobiku, ale znacznie ni�sza ni� grochu.
Tabela 5. Kalkulacja kosztów bia�ka paszowego w poszczególnych surowcach
wysokobia�kowych
Wyszczególnienie
Aminokwasy (%) Zawarto�� bia�ka (%)
Cena surowca
(z�/t)
Cena w
ekwiwalencie bia�ka (z�/t)
Lizyna Metionina + cystyna
m�czka rybna 4,16 2,08 65,0 5500 8462 �ruta sojowa* 2,60 1,30 43,6 1466 3362 �ruta rzepakowa* 2,06 1,71 35,6 865 2430 groch pastewny** 1,50 0,52 20,9 921 4407 bobik** 1,77 0,53 26,8 823 3071 �ubin bia�y*** 1,75 0,84 33,6 932 2774 * �rednia cena gie�dowa �rut z IV kwarta�u 2015 r.; ** �rednia cen skupu str"czkowych w 2014 r. (wg GUS.)
!ród�o: dane GUS, notowania gie�dowe, szacunki w�asne.
Jedynie konkurencyjny pod tym wzgl�dem jest �ubin. W tej kalkulacji pasze str�czkowe s� te� znacznie dro�sze ni� �ruta rzepakowa. Nasiona str�czkowych pa-stewnych charakteryzuj� si� nie tylko znacznie ni�sz� zawarto�ci� bia�ka ni� �ruty oleistych, ale równie� cechuje je niski poziom najwa�niejszych aminokwasów (lizy-na, metionina, cystyna). W sytuacji gdy chcemy zast�pi� �ruty oleiste nasionami str�czkowych, wówczas niedobory te nale�a�oby uzupe�ni� aminokwasami synte-tycznymi, których ceny s� relatywnie wysokie. Te czynniki wp�ywaj� na wzrost kosztów �ywienia, a w rezultacie pogarszaj� efektywno�� produkcji zwierz�cej.

172
Zarówno ograniczona dost�pno��, jak i brak konkurencyjno�ci cenowej str�czkowych sk�ania do konkluzji, �e nie mo�na zast�pi� nimi �rut oleistych, w tym �ruty sojowej GM, bez pogorszenia efektywno�ci produkcji zwierz�cej.
Bibliografia
1. Brzóska F., Czy istnieje mo�liwo�� substytucji bia�ka GMO innymi surowca-mi bia�kowymi (Cz��� II), Wiadomo�ci Zootechniczne, r. XLVII, 2, 2009, Kraków, s. 3-11.
2. Dyrektywa Parlamentu Europejskiego i Rady (UE) 2015/412 http://publications.europa.eu/resource/cellar/80d33e78-c94d-11e4-bbe1-01aa 75ed71a1.0017.03/DOC_1, (dost�p 15.11.2015 r.).
3. Encyklopedia PWN online: �ywno�� modyfikowana, �ywno�� transgeniczna, http://encyklopedia.pwn.pl/haslo/zywnosc-modyfikowana;3942613.html, (dost�p 15.11.2015 r.).
4. Hanczakowska J., Ksi��ak J., Krajowe #ród�a bia�kowych pasz ro�linnych jako zamienniki �ruty sojowej GMO w �ywieniu �wi�, Rocz. Nauk. Zoot., t. 39, z. 2, 2012, Kraków, s. 171-187.
5. https://www.premier.gov.pl/wydarzenia/decyzje-rzadu/ramowe-stanowisko-dotyczace-organizmow-genetycznie-zmodyfikowanych-gmo.html (dost�p 15.11.2015 r.).
6. Isaac G.E., Kerr W.A., The Biosafety Protocol and the WTO: Concert or Conflict?, [in:] The International Politics of Genetically Modified Food. Di-plomacy, Trade and Law, ed. By R. Falkner, Palgrave Macmillan, 2007.
7. James C., Global Status of Commercialized Biotech/GM Crops; nr 44, ISAAA, Nowy Jork, 2014.
8. Szkar�at M., �ywno�� genetycznie zmodyfikowana w stosunkach mi�dzynaro-dowych, Wyd. UMCS, Lublin 2011, s. 16, 317.
9. Szuka�a J., Nowe trendy w agrotechnice ro�lin str"czkowych i sposoby zwi�k-szania op�acalno�ci uprawy, Materia�y Komisji Rolnictwa i Rozwoju Wsi, Warszawa, 2012, 45, s. 8-10.

173
Prof. Jonel Subi�, dr Vesna Popovi�, mgr Marko Jelo�nik Institute of Agricultural Economics, Belgrad, Serbia
15 Priorities of sustainable development of agriculture and rural areas within the region of eastern Serbia34
Introduction 15.1
Region is always considered as the optimal framework for integrated and sus-tainable socio-economic, demographic, cultural and environmental development of a specific territory, and the “best compromise” between fragmented local initiatives and “distant” global national plans of development �Jankovi� 2012�.
There is a long-standing general debate in many OECD countries on the effectiveness of regional support systems, especially in rural areas. In the OECD the New Rural Paradigm, states that integrated rural development requires a new focus on places rather than sectors and an emphasis on investments rather than subsidies �OECD 2006�.
The EU rural area policies begin to adopt strategic concepts which is a significant shift towards an asset-based approach, necessary to respond to the spe-cific territorial challenges and useful to provide programmes that make use of place-based assets and achieve effective regional results �Dax and Kahila 2011�.
The main characteristics of the territorial approach can be summarized as follows: a) a focus on specific places and on their territorial scale; b) an endoge-nous development strategy based on the territory’s natural and socio-cultural assets and aimed at supporting the provision of public goods and services; c) a multilevel system of governance, aiming at co-ordination and networking both in the vertical sense (relations between different levels of government) and in the horizontal sense (relations between actors and stakeholders living and/or operating in the specific territory); and d) a focus on investment rather than sub-sidy �Mantino 2011�.
Sound land policy and planning make a significant contribution to sustain-able and balanced territorial development �Popovi�, Živanovi� and Miljkovi�
34 Paper is a part of research studies within the project: “Active Eastern Serbia in process of accession to EU” led by Regional development agency of Eastern Serbia (RARIS), supported by the Foundation for open society, Serbia, as well as project: III 46006 “Sustainable agricul-ture and rural development in the function of accomplishment of strategic goals of the Repub-lic of Serbia within the Danube region”, financed by the Ministry of Education, Science and Technological Development of the Republic of Serbia, 2011-2015.
174
2013�. Land-use planning means a systematic assessment of physical, social and economic factors in such a way as to encourage and assist land users in selecting options that increase their productivity, are sustainable and meet the needs of so-ciety �FAO 1993�. On the basis of an agronomic evaluation of land, based on cli-mate, soils, and landform, and using available socio-economic data to formulate constraints, targets, and production options, the spatial resource allocation can be optimized with regard to multiple objectives �Fischer et al. 1998�.
However, a decisive role in the growth of the economy and employment in rural regions belongs to local actors – policymakers, entrepreneurs and em-ployees (and their internal and external networks, including cooperation with upper administrative levels, developing agencies and universities), i.e. to their capabilities to formulate policies to attract public and private investments and to perceive changes and adjust to them �Terluin and Post 2001�.
The 2013 CAP reform improves the strategic approach of rural develop-ment policy to defining (national and / or regional) rural development pro-grammes (RDPs), strengthening the content of rural development measures and linking rural development policy more closely to the other EU structural funds. In line with the Europe 2020 strategy, and the overall CAP objectives, the fol-lowing long-term strategic objectives for the EU rural development policy 2014- -2020 were identified: 1) fostering the competitiveness of agriculture, 2) ensur-ing the sustainable management of natural resources, and climate action, and 3) achieving a balanced territorial development of rural economies and communi-ties including the creation and maintenance of employment.
On the basis of an analysis of the needs of the territory covered by the RDP, Member States/regions set quantified targets and measures to achieve these targets, upon following common EU priorities �Reg. (EU) No. 1305/2013�: � fostering knowledge transfer and innovation in agriculture, forestry and rural
areas; � enhancing the viability / competitiveness of all types of agriculture, and pro-
moting innovative farm technologies and sustainable forest management; � promoting food chain organization, animal welfare and risk management in
agriculture; � restoring, preserving and enhancing ecosystems related to agriculture and
forestry; � promoting resource efficiency and supporting the shift toward a low-carbon
and climate-resilient economy in the agriculture, food and forestry sectors; � promoting social inclusion, poverty reduction and economic development in
rural areas.

175
Based on strategic development priorities from the Regional Development Strategy of the Timo[ka Krajina Region �Regional Development Agency East-ern Serbia – RARIS, 2011�, three key thematic areas of development for Eastern Serbia were defined in the Regional EU platform: 1) agriculture and rural devel-opment, 2) tourism and 3) environmental protection �RARIS 2015�.
In the field of agriculture and rural development, measures of agricultural policy are grouped within the three strategic objectives: 1) strengthening the competitiveness of agricultural production and agro-industry, 2) sustainable management of natural resources and environmental protection, and 3) diversifi-cation and development of the rural economy, in line with the strategic objec-tives and priorities of the national strategy for agriculture and rural development 2014-2024 �Official Gazette of the Republic of Serbia – OG RS, no. 85/2014�, as well as to preference, expressed in the strategy for gradual harmonization of policy for management of the development of agriculture and rural areas with the principles of the EU CAP.
With the intention to establish a stimulating ambient for the realization of above mentioned strategic development aims and measures, certain number of priority activities as a part of agricultural policy that are of interest to the agri-cultural sector and rural areas of the Eastern Serbia region during the EU acces-sion process were singled out and recommended. These priorities are related to: zoning of agricultural production; development of a regional forecast-reporting service for plant protection; defining of the legal framework for the areas of in-tegrated production, irrigation and producer associations; protection of geo-graphical indication of agricultural products; establishment of farm management information system and formulation of local strategies for sustainable agricul-tural and rural development �RARIS 2015�.
Data sources and methodology 15.2
In our paper we discussed the potentials and limitations for the devel-opment of agriculture and related activities in the region, as well as all the needs for the state improvement by taking a set of recommended measures. The analytical-synthetic method is used for a discussion and concluding re-marks. Data are obtained from various relevant sources – official statistics, projects, reports, sectoral and development strategies and spatial planning documents. Several scientific papers and studies were analysed and quoted as well as official regulations.

176
Challenges and opportunities for regional agriculture 15.3and rural development
Geography and basic economic indicators The region of Eastern Serbia (also known as the Timo[ka Krajina) spreads
out between the Danube River in the north and the Stara Planina Mountain in the southeast, in the valley of the Timok River, along the border with Romania and Bulgaria. The region covers the administrative territory of the Bor District (mu-nicipalities of Bor, Negotin, Kladovo and Majdanpek) and Timok District (Zaje[ar city and municipalities of Knjaževac, Sokobanja and Boljevac), with the total area of 7,131 km2 and population of approximately 238.6 inhabitants �Statistical Office of the Republic of Serbia – SORS, 2014�, (Figure 1.).
Figure 1. Region of Eastern Serbia – geographical location and administrative coverage
Source: http://www.traveleastserbia.org/
Mountainous and hilly terrains dominate, framing the region from the east, west and south (high mountain massif of Stara Planina and medium height mountains – Ku[aj, Deli Jovan, Rtanj, Tupižnica, Ozren, etc.); river valleys of Danube, Beli, Crni and Veliki Timok, and Sokobanjas’ Moravica, in which are compositely changing gorges and basins; and the Danube River alluvial plain

177
and terraces at its entrance to Dakijas’ basin, between Kladovo municipality and the mouth of the Timok River. The territory outspreads in several altitude zones, from 28 m.a.s.l. (mouth of the Veliki Timok River into the Danube River, the lowest point in Serbia) to the 2,070 m.a.s.l. (part of the Stara Planina Mountain within the Knjaževac municipality). The climate is continental, with the ex-pressed temperature extremes, large variations in rainfall and unfavourable dis-tribution of rainfall during the year �Aleksi� et al. 2004�.
This is mostly agricultural area with an economy based on natural re-sources (energy and mining) and significant tourism potentials (Danube River and Stara Planina Mountain). The sector of agriculture, forestry, water manage-ment, hunting and fishery makes 43.7% of the region’s GDP, while the sector of mining, energy, processing industry and construction has a share of 26.3%, and the sector of services around 30% �OG RS, no. 51/2011�. Mining is developed in municipalities of Bor and Majdanpek, energy and chemical industry is charac-teristic of municipalities of Kladovo and Negotin, while food, textile, footwear and machine industry are the most common for Knjaževac municipality and city of Zaje[ar. Municiplaity of Sokobanja is mostly recognized by developed spa tourism. Generally, development of small and medium enterprises is too slow, with the predominant share of trade and restaurant business.
Regionally observed higher GDP per capita than the national average in 2014 was recorded in the municipality of Bor, in Zaje[ar city and in Majdanpek municipality this indicator exceeded 80% of the national average; in municipali-ties of Boljevac, Kladovo, Negotin and Sokobanja it ranged from 60 to 80% of the national average, while in least developed municipality Knjaževac, it did not exceed 60% of the national average �OG RS, no. 104/2014�.
Land use
Agricultural area covers 49.4% of the territory of Bor District (from 22.2% in municipality of Majdanpek to 68.0% in municipality of Negotin), while in District of Zaje[ar mentioned percentage is little higher, and amounts to 59.0% (from 46.3% in Boljevac municipality to 67.7% in the territory of Zaje[ar city) �SORS 2014�.
According to data from census of agriculture of 2012 �SORS 2013�, from 29,286 agricultural holdings within the Region of Eastern Serbia, there are 29,078 holdings that have at their disposal 157,676 ha of utilized agricultural area (UAA). Agricultural holdings are small and fragmented what hinders the use of modern technology and mechanization, and it makes agricultural produc-tion more expensive. Average size of UAA per holding, on the territory of the Bor District is 5.81 ha, divided on average in 6 separated parcels, while on the

178
territory of Zaje[ar District it is 5.07 ha (in 8 separated parcels). There prevail small family holdings, with size up to 5 ha of UAA (65.8%), prevail in the re-gion and where they have at their disposal only 26.6% of the total utilized agri-cultural area. The largest part of UAA (58.7%) is managed by 34% of holdings whose estate ranges from 5 to 50 ha, while the remaining 14.7% of UAA is on disposal of only 0.2% large holdings (larger than 50 ha).
Among the holdings of the last two mentioned groups, there is a signifi-cant number of market-oriented family holdings, whose incomes enable them to invest in intensification of agricultural production and purchase of modern equipment and mechanization. Currently to mentioned groups, after many years of stagnation caused by the transitional difficulties in process of restructuring and privatization, are turning back some of former large public agri-combines – agricultural development within the region, and now appear successful private companies, such is “Salaš” d.o.o. from Zaje[ar, in Italian ownership (http://ruskiposlovniklub.rs/en/ news.htm#newsPartners).
After the breakdown of several large public agri-combines in observed ar-ea, which had also possessed the storage facilities and processing capacities, and after the shutdown of agricultural cooperatives during the transition period, farmers were faced with difficulties in product sale and strong price and income fluctuations, which resulted from the broken market chains. Local associations of crops and fruits producers, wine growers, stockbreeders and beekeepers have been strengthened in recent years, but this is only a small indication of what they would eventually have to become – regional branches of strong and organized producers’ groups and organizations, which will represent the interests of all farmers of Timo[ka krajina region towards processors, large trade chains, ex-porters and state authorities.
Each seventh holding (4,184 holdings) has diversified activities and sources of income, primarily in the field of agricultural products processing (processing of milk, fruits, vegetables, meat and other agricultural products) and forestry, where some of them are engaged in tourism, handicraft, fishing and energy production from renewable sources �SORS, 2013�. According to availa-ble natural resources and rich cultural heritage, what soon can be expected is tourist valorisation of rural areas and within it, promotion and protection of the origin of traditional local products �Popovi� et al., 2010; Popovi� et al., 2012�.
The consequences of depopulation and migration processes include unfa-vourable age and qualification structure of the population linked to the holdings, which generally discourages market orientation and diversification of economic activities. Agricultural holdings provide a place for living and work for 70,244 inhabitants, out of which 69,835 live and work in family holdings, while 409

179
persons have a status of full-time employees at the holdings of legal entities and entrepreneurs. Households with 1-2 members have a share of 63.7% within the total number of households, while those with 3-4 members participate with 31.1%. Around 41.7% of household population acts as holdings of managers. Only 2.6% of managers have agricultural secondary or higher education, or graduated from agricultural faculty, courses from the field of agriculture were attended by around 0.6% of them, while 72.5% of managers run business ac-cording to their previous experience gained in agricultural practice.
Arable land, including kitchen gardens, occupy 57.2% of utilized agricul-tural area, orchards 3.3%, vineyards 1.4%, while meadows and pastures around 38.1% of UAA. Totally 89,112 hectares of arable land (without kitchen gardens) is occupied by grains (62.6%), followed by forage crops (26.2%) and industrial crops (6.8%). Vegetables (peppers, cabbage, onions and tomatoes), melons and strawberries, potatoes and pulses are grown on 2% of arable land. The largest area under grains is occupied by wheat and maize, and they are mostly located in the area of Negotin, Zaje[ar and Sokobanja; areas under forage crops, mostly covered by alfalfa and clover, are located at the territory of Zaje[ar, Boljevac and Bor; while within the group of industrial plants, sunflower dominates, above all in Negotin, Kladovo and Zaje[ar. Vegetables (peppers, cabbage, onions and tomatoes) and melons are usually grown in Negotin and Zaje[ar; while potatoes and beans are more common in Knjaževac and Sokobanja.
Under irrigation are 2,327 ha, or 1.5% of UAA (at national level it is 2.9%). Arable land in 90% consists of irrigated areas, while the rest of them are under orchards (148 ha), meadows and pastures (12 ha), vineyards (9 ha) and other permanent crops (11 ha). Most of irrigated arable land was sown with grains and maize for fodder (1,523 ha), but this is only 2.7% of the total area underthe mentioned crops. They are followed by areas under vegetables, melons and strawberries (302 ha) with much higher share in the total areas under the mentioned crops (40.1%), having in mind that presented share is below the na-tional level, 63.8%. The largest part of irrigated arable land and orchards is seen in the city of Zaje[ar, as well as in Negotin and Knjaževac municipality.
Besides the ongoing projects of revitalization and upgrading of large irri-gation systems in the Negotin plain and Zaje[ar (PIK Salaš), and evident need for the realization of the project of water accumulation construction in Knjaževac, it is necessary to build an accompanying energy infrastructure, whose lack greatly limits the use of water for irrigation in the villages within the valley of the Timok River.
Fruit plantations are spread over 5,133 ha, where 2,611 ha are under in-tensive and 2,522 ha under extensive plantations. Plums occupy the largest part
180
of the fruit areas. They are followed by sour cherries, apples, walnuts and pears. Plums are mainly grown in the municipalities of Knjaževac, Bor and Zaje[ar; sour cherries in Knjaževac and Zaje[ar; apples in Negotin, Zaje[ar and Bor; walnuts in Zaje[ar, Knjaževac and Bor; while pears dominate in Bor, Zaje[ar and Negotin.
Vineyards cover 2,169 ha of UAA, where only 3% of these areas are planted with wine varieties having geographical indications, 86.4% are occupied by other wine varieties, and the remaining 10.6% are table grape varieties. The largest areas under vineyards are located at the territory of Negotin, Zaje[ar and Knjaževac.
Zoning of fruit production and application of integrated and organic sys-tem of production, renovation and construction of irrigation infrastructure, per-manent education and establishment of producers’ associations, strengthening of the family wineries and development of wine tourism are the main tasks for the improvement of fruit and wine growing.
Meadows and pastures spread on 60,093 ha. The largest areas under per-manent grassland are located on the territory of Bor and Boljevac municipalities. Larger areas are also at disposal of the city of Zaje[ar, and municipalities of Knjaževac, Majdanpek and Negotin. The best quality meadows are in Sokoban-ja, and pastures in municipality of Majdanpek. To them can be added the row of pastures at Crni vrh (Stara Planina Mountain), which are good for grazing of sheep and dairy cows �RARIS 2010�.
Protection of biodiversity and advancement of the production potential of natural meadows and pastures, as a part of comprehensive programme for resto-ration and development of livestock production, especially livestock production based on grazing, as well as the diversification of the rural economy (production of traditional meat and dairy products, fruit, forest fruit and medicinal herbs, protection of products origin and development of rural tourism) are of great im-portance for the conservation of agro-ecological goods and services located at the vast mountainous landscapes of the Timo[ka krajina region.
Livestock production is insufficiently developed, especially on the territo-ry of Bor district (39 livestock units (LU) per 100 ha of UAA), while in Zaje[ar district situation is somewhat more favourable (52 LU per 100 ha of UAA) and it is closer and closer to the national average (59 LU per 100 ha of UAA). The most of livestock is grown at the territory of Zaje[ar city. The highest number of cattles is in Zaje[ar and Bor, pigs and poultry in Zaje[ar and Negotin, and sheep and goats in Zaje[ar and Knjaževac. Close to 40% of sheep and goats are raised on grazing (at national level around 25%) [SORS 2013]. There are considerable unused potentials for the development of organic livestock production in moun-

181
tainous areas [Kati� et al. 2010]. The region of Timo[ka krajina is known for the production of high quality honey. Most hives are located at the territory of the Zaje[ar and Knjaževac municipalities �SORS 2013�.
Having in mind available areas under meadows and pastures as well as potentials for growth in production of maize, forage crops and oilseeds under the irrigation, tradition and market opportunities, livestock production represents large but unexploited chance for agriculture in this territory.
Land-use planning
The purpose of zoning, as carried out for rural land-use planning, is to separate areas with similar sets of agro-ecological and socio-economic potentials and constraints for development. Specific programmes can then be formulated to provide the most effective support to each zone.
According to criteria of prevailing terrain altitude and slope at the level of cadastral municipalities (CM), on the territory of the Timo[ka krajina, the fol-lowing four agricultural areas can be singled out: � lowland, up to 200 m.a.s.l. – covers 8% of the total agricultural land in the
Bor District (territory of Klju[ and Negotin plain); fertile land suitable for intensive crop and vegetable production;
� knolly, from 200 to 350 m.a.s.l. – covers 33.7% of the total agricultural land (17.2% within the Bor District and 16.5% in Zaje[ar district); land on the lower terrains is particularly suitable for grapes growing, while at the higher terrains for fruit production;
� hilly, from 350 to 600 m.a.s.l. – covers 33.0% of the total agricultural land (12.1% in the Bor district and 20.9% in the Zaje[ar district); lands have het-erogeneous production potential, suitable for mixed livestock and integrated fruit production;
� mountainous, over 600 m.a.s.l. – includes 25.3% of the total agricultural land (6.1% in the Bor district and 19.2% in the Zaje[ar district); lands have seri-ous constraints to agricultural production, suitable for livestock grazing.
Starting from the agro-ecological conditions and specific structural, tech-nological and socio-economic limitations and potentials, and having in mind the priority directions of the spatial distribution of agricultural production within the territory of Bor and Zaje[ar districts which are defined in the Spatial Plan for the Republic of Serbia 2010-2020 �OG RS, no. 88/2010�, by the Regional Spa-tial Plan for the Timo[ka Krajina Region �OG RS, no. 51/2011� the following agricultural or rural zones are determined: � Zone of intensive agriculture – includes fertile land of Klju[ and Negotin
plain, as a part of the valley-knolly and basin areas, mostly up to 350 m.a.s.l.

182
With the application of anti-erosion measures, hydro meliorations and pre-vention of soil conversion to non-agricultural purposes, in the above – men-tioned zone it is possible to organize different types of intensive plant and livestock production, which should be supported by restoration and construc-tion of additional storage and processing facilities.
� Zone of wine-growing – 1) wine-growing region of Negotinska krajina, with the Klju[s, Brzapalankas, Mihajlovacs, Negotins and Rogljevac-Rajacs vine-yard areas and 2) wine-growing region of Knjaževac with Bors’, Boljevacs, Zaje[ars’ and Potrkanjes’ vineyard areas. The zone has a perfect microcli-mate and soil conditions, as well as multi-century tradition of grapes growing and wine production. There is a need for continuous support to improvement of technical and technological conditions for the grapes and wine production.
� Polymorphic zone – covers hilly areas, located mainly at the higher altitudes (350-600 m.a.s.l.). According to complex geophysical conditions, this zone is extremely heterogeneous in terms of benefits and constraints for agricultural production. It is suitable, primarily for the development of mixed livestock breeding (cattle-goat-sheep breeding), parallel with the improvement of for-age base, in order to produce quality meat and milk, as well as for the devel-opment of fruit growing in the system of integrated production.
� Zone of livestock grazing – cover areas, which are mostly located at the heights above 600 m.a.s.l. Spacious natural pastures predispose mentioned zone for the development of livestock grazing and organic production of au-tochthonous varieties of fruit, together with support for production improve-ment and protection of the origin of traditional local products, linked with the development of rural and ecotourism. Depopulation and poor accessibility to the remote mountain villages are basic limitations to sustainable use of agri-cultural resources in mountain areas.
Despite general zoning and definition of priority directions of the spatial distribution of agricultural production and accompanied activities at the territory of Timo[ka Krajina, in regional spatial plan it is noted that by multisectoral ap-proach the borders of the mentioned zones have to be specified, spatially differ-entiated support measures for improvement of agricultural production competi-tiveness, agri-environment protection and diversification of rural economy have to be determined, in order to eliminate resource, structural, technological and socio-economic limitations of agricultural and rural development.
The best way for achievement of the above-mentioned goals is to use the framework of local development strategies and programmes of integrated rural development, which respect the territorial heterogeneity and specific socio- -economic and environmental needs of local communities [Popovi� 2003].

183
In this context, it is particularly important to ensure adequate professional and advisory assistance to farmers, as well as certain support to capacity building of stakeholders for the establishment of local development strategies and pro-grammes [Popovi� et al. 2009; Popovi� et al. 2011].
Recommendations for priority measures to support agriculture 15.4and rural development
Starting from the previously considered potentials and limitations for the development of agriculture and rural development, within the Timo[ka krajina, some essential priority activities of agricultural policy in the above mentioned area will be presented35.
Zoning of agricultural production
Agro-ecological zoning (AEZ), as applied in the FAO studies, defines zones on the basis of combinations of soil, topography and climatic characteris-tics and the management systems under which the crops are grown. Each zone has a similar combination of constraints and potentials for land use, and serves as a focus for the targeting of recommendations designed to improve the existing land-use situation. Combined with an inventory of land use, expressed as land utilization types and their specific ecological requirements, zoning can be used as the basis for a methodology for land resource appraisal. Ecological-economic zoning (EEZ) approach complements elements of physical-biotic environment with socio-economic factors and a wider range of land uses in zone definition and matching both of them through multiple goal analysis, provides a tool for land users to reach a consensus on the optimal use of land [FAO 1996].
By macro and micro zoning of agricultural production is monitored and encourages specialization of agro-industrial production, linking based on inter-ests, inclusion of small producers in market trends, better evaluation of work in agriculture (through balanced employment of all members of agricultural hold-ing) and optimal use of natural resources. It is also a practice in the EU that zon-al politics influences farms enlargement.
For zonal deployment of agricultural production and additional activities, two methods with corrective factors may be used: territorial marking of zones (based on altitude, relief and climate), and zonal marking of certain lines of ag-
35 The aforementioned priority activities are among the recommendations defined for agricul-ture and rural development thematic area by the local stakeholders, members of the Regional EU platform, with the support of external consultant, the author of this chapter, within the RARIS project “Active Eastern Serbia in the accession process to EU” (2014-2015).

184
ricultural production according to their representation at particular territory (share in the total area) �RARIS 2015�.
Zoning has strategic importance for the successful use of comparative ad-vantages and sustainable development of multifunctional agriculture, including agro-ecotourism and other accompanying activities in the rural economy, which are, according to the rich natural resources and cultural heritage, of particular interest for the development of agriculture and villages in the region of Timo[ka Krajina.
Legal framework for integrated agricultural production
There is a wide variation of integrated farming approaches which cover production systems positioned between conventional and organic food produc-tion. Integrated farming encourages farmers to look at the whole farm and its relationships with the wider socio-economic and ecological environment, com-bining the best of traditional and modern production practices. No Community-wide regulation exists on integrated farming36. This has led to national and re-gional authorities developing their own production and marketing standards, which they enforce with the aid of duly accredited certifying bodies [EC 2011].
Countries within the region arranged area of integrated production apply-ing certain regulations, which define responsibilities of producers and prescribed technical and organizational production conditions, adequate organization of products, control, certification and labelling, etc. Integrated production is mostly present in fruit, vegetable and wine growing. Due to the excellent predisposi-tions of spacious hilly-mountainous area, within the Timo[ka Krajina, for inte-grated fruit production, and more and more presented market requirements for quality wines gained from integrated production, establishment of the above – mentioned legislation will have significant impact on the fruit and wine growers, as well as for other agricultural producers from this region.
Legal framework for establishment of producer groups and organizations
Producer organisations are legally-constituted groups of farmers and growers that assist in the distribution and marketing of products, promote a higher quality of products and encourage their members to adopt good envi-
36 The Framework Directive on the sustainable use of pesticides (Directive 2009/128/EC) only regulates the plant protection element of integrated farming, i.e. integrated pest management (IPM). The general principles of IPM are implemented by all professional users since 1st January 2014. Member States are required to encourage professional users to implement crop or sector specific guidelines for IPM on a voluntary basis. The harmonization of Serbian legislation with the EU Directive 2009/128/EC is in progress �EIO 2014�.

185
ronmental practices. Producer organisations can group themselves into associa-tions of producer organisations and into inter-branch organizations, which link their activities in the production of food to the processing and trading. It has es-pecially important role in organization and purchase of fruit and vegetable.
Since the 2013 reform of the Common Agricultural Policy (CAP), pro-ducer organisations are encouraged in all sectors. Reinforced legal framework for Producer Organisations within common organisation of the markets in agri-cultural products (such as temporary exemption from certain competition rules, the possibility for collective bargaining in some sectors and delivery contracts for all sectors) is backed by financial support for setting up producer groups un-der the second CAP pillar [EC 2013].
This is a missing segment within the entire region of Eastern Serbia, hav-ing in mind the large number of small size agricultural holdings, their disorgani-zation, and non-standardized and fragmented agricultural production. Producers’ organizations and clusters are the promoters of their own interests, but also the factors of agricultural policy creation and implementation that is adjusted to the customers and market needs.
Legal framework for establishment of energy infrastructure for hydro-amelioration
By organized construction of low-voltage network, in areas where the need for use of hydro-amelioration exists, it will come to costs reduction and improvement of irrigation efficiency. Adoption of rulebook that regulates the construction of low voltage network system in function of hydro-technical ame-lioration encourages the yields growth and sustainable land management in agri-culture. Regulations would define the activities related to establishment of plan-ning documentation, obtaining needed permits, coordination with relevant public companies, coordination and monitoring of activities implementation and moni-toring of systems’ work.
Adoption of the mentioned regulation is particularly important for the re-gion of Eastern Serbia, where a lack of electrical grid for power supply of irriga-tion pumps (just a few of agricultural producers use the evlectricity for the oper-ation of electric pumps for irrigation in the Timok River alley) is observed.
Establishment of regional forecasting and reporting service for plant protection
Basic tasks of regional forecasting and reporting service for plant protec-tion are prediction of appearance and determination of developmental phases of harmful organisms and plant diseases, evaluation of their impact on agricultural

186
production, establishment of a forecasting model, as well as undertaking of op-timal measures in crops protection against harmful organisms, according to con-stant monitoring of their number, spatial and temporal distribution and environ-mental conditions. Optimal plant protection measures guarantee food safety and lower crop care costs, and they protect the environment. They also have particu-larly important role in the system of integrated plant production.
Development of forecasting and reporting service for plant protection, within the region of Eastern Serbia, represents significant segment in strengthen-ing of the field crop, fruit and wine production competitiveness. The conse-quences of mentioned service non-functioning are reflected in the lack of knowledge related to pests’ appearance and movement, application of inappro-priate pesticides and use of pesticides outside the biological justification. In ac-cordance to that, most often an unhealthy and unsafe product is received, which contains pesticides in quantities above allowable levels, what leads to pests’ re-sistance and jeopardizes export.
Protection of geographical origin of regionally recognizable products
As protection of agricultural products leads to a certin level of added val-ue, they become more competitive in the market and achieve higher price cate-gories, what in the end leads to an increase in production and export volume, as well as to increase of producers’ income. According to data from April 2014, 336 spirits, 1,577 wines and 1,184 agricultural products were protected in the EU. It is estimated that during the 2010, the mentioned products were sold in total amount of EUR 54.3 billion, where 11.5 billion was realized through ex-port, what amounts to around 15% of export of the EU food and beverage indus-try [EurActiv 2014].
Indications of geographical origin of agricultural products in the EU37 – Protected Designation of Origin (PDO) and Protected Geographical Indication (PGI) are most common in the Mediterranean EU Member States (Italy, France, Spain, Portugal, Greece) in production/processing of fruit, vegetables and cere-als, cheese, fresh meat and meat products, oils and fats, as well as in production of bread, pastries and cakes, eggs, honey, spices, mineral water, beer, fish and seafood [Rastoin 2009].
Equivalent system of protection has been established in Serbia (appellation of origin and geographical indications), where 52 agricultural products with geo-graphical indications are registered at national level, with it that just four products come from the region of Eastern Serbia: cheese from Krivi Vir and Stara Planina, 37 Non-alcoholic beverages, aromatic wines and other grape products, except wine vinegar (Regu-lation [EU) 1151/2012].

187
Rtanjs’ tea and Kladovos’ caviar. International protection, according to ratified Lisbon Agreement for the Protection of Appellations of Origin and their Interna-tional Registration (OG FRY – International Treaties, no 6/1998), refers only to three Serbian products (honey from Homolje, wine Bermet and homemade chutney from Leskovac). Law on Indications of Geographical Origin (OG RS, no. 18/2010) regulates application procedures for international registration of indication of geo-graphical origin in accordance to international agreement that obliges Serbia and for the registration of indication of geographical origin on the level of the European Community, in accordance with the European Community regulation governing the protection of indications of geographical origin for agricultural products and food-stuffs38 [Regulation (EU) 1151/2012].
Producers need greater government and extension service support, both in process of protection and in process of products with protected geographical origin marketing valorisation. Holders of protection are usually associations of (small) producers, which have neither the financial possibilities, nor the knowledge to suc-cessfully sell the protected product, especially in foreign market.
Products with geographical indications contribute to the recognisability of the region where they are produced, laeding the way to the development of rural tourism. Therefore, it is important to achieve the synergy among the strategies of products with geographical indication value chain development with local de-velopmental strategies.
Establishment of local strategies of sustainable agricultural and rural development
In the region of Eastern Serbia one strategic document is in force which concerns agricultural development (Strategy of Agricultural Development of Boljevac municipality for period 2010-2015) and one focused on rural develop-ment (Strategy of Rural Development of Knjaževac municipality for the period 2010-2020). As each local government should determine the best modalities of sustainable agriculture and rural development, recommendation is that initiation of establishment of relevant developmental documents should be based on partic-ipatory approach, with joint action of agricultural producers, citizens and other stakeholders interested in the goals and directions of development, as for invest-ment in local community development.
38 Agreement between the Community and Serbia on the reciprocal recognition, protection and control of wine, spirit drinks and aromatised wine names have been included in the Stabili-zation and Association Agreement between the EU and Serbia (Annex II to Protocol 2) [OG RS – International Treaties, no. 83/2008].

188
Implementation of the EU LEADER approach, which is based on the es-tablishment of local action groups, composed of representatives of farmers, SMEs and entrepreneurs that are active in the area of agriculture, scientific-research institutions and other stakeholders, is imposed as the best solution in the process of developing of local strategy of sustainable agriculture and rural development. Only with close cooperation among stakeholders, it is possible to set a realistic SWOT matrix of internal resources and developmental constraints, in the context of opportunities and threats for the environment, and then to de-fine the goals of development and investment activities for their realization.
Conclusions 15.5
The region of Eastern Serbia spreads out between the Danube River in the north and Stara Planina Mountain on the south-east, within the Timok River Valley, along the border with Romania and Bulgaria, on the total area of 7,130 square kilo-metres, where around 238.6 thousand of inhabitants live. It is mostly agricultural ar-ea, where economy is based on natural resources (energetics and mining) and signifi-cant touristic potentials (Danube River, Stara Planina Mountain). The region is char-acterized by depopulation processes, unfavourable age and qualification structure of the population, especially population linked to the agricultural holdings, significant spatial imbalances in the level of development and allocation of industrial (economy) capacities, generally low level of economic activity and investment, high unem-ployment, small and fragmented agricultural holdings, degradation of environment by mining activities, underdeveloped market infrastructure and poor transport acces-sibility of remote hilly and mountainous areas.
In order to create a stimulating environment for the development of agri-culture and rural areas of Eastern Serbia Region during the accession process to the EU, the following activities should be undertaken: zoning of agricultural production; advancing the development of regional forecasting and reporting service for plant protection; defining the legal framework for the areas of inte-grated production, irrigation, as well as establishment and strengthening of pro-ducers’ associations; protecting the geographical origin of local agricultural products; and establishing and implementing local strategies of sustainable agri-cultural and rural development.
References
1. Aleksi� V., Milutinovi� S., Mari� M., ¥or¦evi� N., Draught in the Timok re-gion and its consequences on plant production. In: Proceedings of Scientific and Professional Conference “Ecological Truth – EkoIst ‘04”. Technical Facul-ty in Bor, Bor, Serbia, 2004.

189
2. Dax T., Kahila P., Policy Perspective – The evolution of EU Rural Policy. In: The New Rural Europe: Towards Rural Cohesion Policy, ed. by A. Copus, L. Hörnström, NORDREGIO Report 2011:1, Stockholm, Sweden, 2011.
3. DIRECTIVE 2009/128/EC of the European Parliament and of the Council of 21 October 2009 establishing a framework for Community action to achieve the sustainable use of pesticides, OJ L 309, 24.11.2009.
4. EurActiv. EU Possible extension of geographical indication protection. Re-trieved July 25, 2014 from: http://www.euractiv.rs/eu-prioriteti/7532-eu-moda-proiri-upotrebu-zatite-geografskog-porekla
5. European Integration Office � EIO. National Programme for the Adoption of the Acquis (2014-2018), Belgrade, 2014.
6. European Commission, Overview of CAP Reform 2014-2020. Agricultural Policy Perspectives Brief, N°5* / December 2013.
7. European Commission, Integrated Farming � Fact Sheet. In Commission Staff Working Paper. Common Agricultural Policy towards 2020. Impact Assess-ment. Annex 2A, Brussels, SEC(2011) 1153 final/2.
8. FAO, Guidelines for land-use planning. FAO Development Series No 1. Rome (Italy), 1993.
9. FAO, Agro-ecological zoning. Guidelines. FAO Soils Bulletin 73. Rome (Italy), 1996.
10. Fischer G., Granat G., Makowski M., AEZWIN. An Interactive Multiple-Criteria Analysis Tool for Land Resources Appraisal. Interim Report IR-98-051, Interna-tional Institute for Applied Systems Analysis, Laxenburg, Austria, 1998.
11. Jankovi� D., Territorial Approach to Regional Rural Development. Economics of Agriculture 2012 (59) 4 (675-686).
12. Kati� B., Savi� M., Popovi� V., Organic livestock production – Serbian unused chance. Economics of Agriculture 2010 (57) 2 (245-256).
13. Mantino F., Developing a Territorial Approach for the CAP. A Discussion Pa-per, IEEP, 2011.
14. OECD, The New Rural Paradigm, Policies and Governance, OECD Rural Pol-icy Reviews, Paris, 2006.
15. Official Gazette of the Republic of Serbia, no. 104/2014. Regulation on estab-lishing a unified list of development of regions and municipalities for 2014.
16. Official Gazette of the Republic of Serbia, no. 85/2014. Strategy of Agricultural and Rural Development of the Republic of Serbia 2014-2024.
17. Official Gazette of the Republic of Serbia, no. 51/2011. Regulation on adoption of Regional Spatial Plan for Timo�ka krajina.
18. Official Gazette of the Republic of Serbia, no. 88/2010. Law on Spatial Plan of the Republic of Serbia 2010-2020.

190
19. Official Gazette of the Republic of Serbia, no. 18/2010. The Law about Geo-graphical Indications.
20. Official Gazette of the Republic of Serbia – International Treaties no. 83/2008. The Law about ratification of Stabilisation and Association Agreement between the European Commuities and their Member States of the one part, and the Republic of Serbia, of the other part.
21. Official Gazette of the FRY - International Treaties no. 6/1998. The Law about Ratification of the Lisbon Agreement for the Protection of Appellations of Origin and their International Registration.
22. Popovi� V., European agricultural support and sustainable rural development. Institute of Agricultural Economics, Belgrade, 2003.
23. Popovi� V., Živanovi� Miljkovi� J., Key issues of land policy in Serbia in the context of spatial development � case study of Danube basin area. Proceedings of 2nd International Scientific Conference Regional development, spatial plan-ning and strategic governance � RESPAG 2013. Belgrade: Institute of Architec-ture and Urban & Spatial Planning of Serbia, 2013.
24. Popovi� V., Miliji� S., Vukovi� P., Sustainable tourism development in the Carpathian region in Serbia. SPATIUM International Review, 2012, (28), p. 45-52.
25. Popovi� V., Kati� B., Savi� M., Rural Development in Serbia and the local communities. Economics of Agriculture 2011 (58) 1 (33-44).
26. Popovi� V., Nikoli� M., Kati� B., The role of multifunctional agriculture in sustainable tourism development in the area of Stara Planina. Proceedings of International Scientific Meeting Multifunctional Agriculture and Rural De-velopment (V) – Regional Specificities, Institute of Agricultural Economics, Belgrade, Vrujci Spa, 2010.
27. Popovi� V., Kati� B., Živanovi� Miljkovi� J., Rural Development Network and Territorial Competitiveness. In Proceedings of 113th EEAE Seminar The role of knowledge, innovation and human capital in multifunctional agriculture and territorial rural development, European Association of Agricultural Econo-mists, Institute of Agricultural Economics, Belgrade, 2009.
28. Rastoin J-L., Vers une marque ombrelle des produits alimentaires Méditerra-néens. Le projet IPEMED. Premier Seminaire La Signalisation des terroirs – Pourquoi? Comment faire? Concepts, méthodes, pratiques et témoignages. CI-HEAM, Paris, 2009.
29. Regional Development Agency Eastern Serbia � RARIS, Recommendations of Eastern Serbia in the process of EU accession. Project “Active eastern Serbia in the EU accession process” supported by Open Society Foundation, Serbia, 2015.

191
30. Regional Development Agency Eastern Serbia � RARIS. Regional Develop-ment Strategy of the Timo�ka krajina 2011-2015, 2011.
31. Regional Development Agency Eastern Serbia � RARIS. Profile of the Timok region, 2010.
32. Regulation (EU) No 1305/2013 of the European Parliament and of the Council of 17 December 2013 on support for rural development by the European Agri-cultural Fund for Rural Development (EAFRD) and repealing Council Regula-tion (EC) No 1698/2005, OJ L 347, 20.12. 2013.
33. Regulation (EU) No 1151/2012 of the European Parliament and of the Council of 21 November 2012 on quality schemes for agricultural products and food-stuffs, OJ L 343, 14. 12. 2012.
34. Statistical Office of the Republic of Serbia � SORS. Municipalities and Regions of the Republic of Serbia 2014.
35. Statistical Office of the Republic of Serbia � SORS. Census of Agriculture 2012 � Agriculture in the Republic of Serbia. Book I, Book II.
36. Terluin I.J., Post J.H., Strategies towards territorial development in rural Eu-rope. In: European policy experiences with rural development, ed. by A. Arzeni, R. Esposti, F. Sotte, Selection of papers from the 73rd EAAE Seminar, Ancona, Italy, 2001.

192
Prof. dr Dimitre Nikolov, assoc. prof. dr M. Anastasova-Chopeva Institute of Agricultural Economics, Sofia, Bulgaria
16 Expected changes of farmers innovation activity in 2014-2020
Introduction 16.1
The sustainable and effective farms development was strongly determined by the realization of the policy for building agriculture based on the knowledge and innovation practices. In this regard the analysis of the future intentions of farmers regarding the innovations implementation is very important. Respond-ing to this necessity, in 2014 a team from IAE, headed by Prof. dr D. Nikolov, has elaborated a scientific project “Innovations Management in Agriculture”. The goal of the current paper is to present the results from the comparative anal-ysis between the levels of real and potential innovation activity of farmers and the main motivating factors for the formation of intentions for innovations in agricultural production.
Theoretical problems of the research 16.2
Relation between the concepts of real, potential and consumer’s innovativeness
The category “consumer’s innovativeness” could be examined in the fol-lowing two aspects: real and potential. As for the first aspect the purchase of new product or service is already a real fact, while for the potential aspect it is in process of formation as a respective intention of the person to possess the new product. In both cases, it is about general characteristics of the concept consumer’s innovativeness, the real and the potential activity for innovation are two sides of the same phenomenon. Before the realization of the act of the purchase of new product, it is preceded by the presence of established attitude for such action.
There are several definitions of “consumer’s innovativeness”, most of them are ambiguous. One of the famous formulations of this concept is of Rog-ers and Shoemaker [Rogers, Shoemaker 1971]. They define innovativeness of some individual’s consumption as “the degree to which an individual of a particular social group is willing to accept new ideas, compared to another rep-resentative of the same social system”. According to another researcher of con-sumer’s innovativeness [Schwartz 1992], it could be defined “as stimulation mainly based on consumer’s aims”. In his opinion the most important factor of

193
consumer’s innovativeness is the position and the appurtenance of the individual to a particular social group. More exactly, innovativeness is analysed as having origin from the willingness to stimulate the mind and the intellectual perfor-mances. For example, the innovative consumers are considered as more intelli-gent and capable part of society [Schwartz 1992].
Other authors place the highest importance on the physiological origin of consumer’s innovativeness, they accept it as innate and consider that it could be expressed through the tendency to buy new product from a definite category faster than other consumer [Folax et al. 1998].
Independently from the different understanding of researchers regarding the consumer’s innovativeness, the unifying element in their affirmations is the significance of different kinds of factors (motivations) for the formation of a definite innovative model of behaviour of consumers [Fishbein 1967].
The considered theoretical principles of consumer innovativeness are adapted to the study of farmer’s innovative behaviour. The motivating forces are the basis of the decision for implementation of innovations in agricultural pro-duction.
Main motivating factors of innovativeness
The motivation is the driving force, which stimulates the person to under-take actions for satisfying particular needs. It is the reason for orientation to im-plementation, through a purchase or other way, of both tested on the market products and new ones, non-existing until the moment or modifications ensuring better degree of satisfaction.
Authors, such as Chesson and Babin, group the factors impacting innova-tiveness of consumers in to functional and emotional-sensorial (hedonistic), i.e. the appearance of a necessity from the consumer’s side to buy some innovation is provoked by better and easier practical implementation of the new product or by the raised willingness to ensure oneself a filling of pleasure, or by both fac-tors simultaneously [Babin et al. 1994; Chesson 2002].
As the examined formulations show, the consumers’ innovativeness and its determining factors, they are oriented at analysing the innovativeness from the point of view of satisfaction of particular consumer’s needs. When it comes to satisfaction of the so-called production consumption, which is the case of imple-mentation of different innovations in the sphere of agricultural production, the aims of a particular innovation and its motivating factors will have different shape. The idea is to establish the arrangement of the main factors per degree of importance on the decision-making for a particular innovation in the following innovative directions of agricultural production: agricultural machinery, tech-

194
nique, equipment; production technologies; crops varieties; livestock breeds; bio-logical methods and instruments for fighting pests and plant diseases; methods and drugs for animals treatment; irrigation methods; information technologies.
The main factors motivating the implementation of innovations are divid-ed in to the following groups: � Productive:
- Higher yields obtainment; - Higher livestock productivity attainment;
� Economic (financial): - Bigger profit realization;
� Social: - Time saving;
� Ecological: - Less environment pollution and nature protection.
Data and methodology 16.3
The paper uses the results from a survey from 2013 carried out under the scientific project “Innovations Management in Agriculture” with the collabora-tion of NAAS. The survey involved 333 farms, distributed in the 28 country re-gions.
The sample is representative for the country with guaranteed probability of 95%. It includes holdings of individuals, agricultural cooperatives, joint-stock companies, commercial limited liability companies, and sole traders. Farmers are grouped not only according to their legal status, but also they are grouped according to the following indicators: age and farmer’s education level; sex; ag-ricultural system (conventional or organic); specialization in production (crop, livestock, mixed production) and type of the main revenue source. The last indi-cator includes three cases: first, when the main source of revenue is agriculture, second, it is generated from activities related to agriculture and third, the main source of revenue is connected with activities outside agriculture. The share of family farms is the highest (48%); it is followed by the commercial limited lia-bility companies and agricultural cooperatives, respectively with 19.2% and 11%. The farms whose managers are aged 40-65 predominate in the sample (62.5%). The distribution by the education level is in favour of farmers with secondary education (56.2%). A significant part of the farmers in the sample (85%) conduct traditional farming and their main source of revenue is agricul-tural activity (78%). More than 2/3 of all surveyed farms specialise in the crop production (74.2%); nearly 1/5 of them are mixed crop-livestock farms (18.6%) and the other farms raise only livestock.

195
The answers to the following two questions were used for the establishment of the relation between the real and potential innovation activity: “Which kinds of innovations have you implemented in your farm up to this moment?” and “Do you intend to implement different kinds of innovations in the new programming period (2014-2020)?”. From the analysis of received data a comparative analysis was made and on this base we predicted which areas of innovations will endure essential changes, from the aspect of the interest in their implementation.
The total level of potential innovation activity of farms is defined on the basis of the single innovation activity. This concept means the activity of the farmer regarding the different kinds of innovations listed above. The definition of the single innovation activity of each farm is given a weight from 0 to 4, ac-cording to the degree of readiness to implement the respective kind of innova-tion. Each category of innovation gives the farm a maximum value of 4, if it has the firm conviction to implement the particular innovation. On the other hand, producers which are categorically against the implementation of some kind of innovation, have the weight of 0. The intermediate values (1, 2 and 3) receive the farms hesitating about the decision about innovations implementation. The value 3 is received by farmers who tend to introduce innovation. The value 1 is given to farmers who have rather negative attitude to the decision to implement innovation. Value 2 is received by producers who do not yet have taken a deci-sion and cannot be allocated to any of the examined groups. For the assessment of the single potential innovation activity a formula of the average weighted val-ue was applied. After the obtainment of the single potential innovation activity for each kind of innovation, the size of the total potential activity is evaluated using the following formula:
IPA
k = (¨ ipajk)/n
j where: IPA
k – coefficient of total potential innovation activity of k-th farmer; ipa
jk – coefficient of single potential innovation activity of k-th farmer compared to the j-th innovative area of agricultural production; n – number of innovative areas; j, k – indicators of the consecutive number of innovation areas and farmers.
After the alignment with the classic single scale of measurement, the max-
imum admissible value of both coefficients of single potential innovation activi-ty and total potential innovation activity is 1, and the lowest value is 0.
Total potential innovation activity with the highest value means simulta-neous readiness for implementation of innovations in all of she above mentioned

196
above innovative directions of agricultural production and the opposite, for pro-ducers not having expressed intention for implementation of at least one innova-tion, the coefficient of total innovation activity is 0. As a result of obtained lev-els of total potential innovation activity, agricultural producers are divided in the following three groups: � The first group includes farms having coefficient of total potential activity within
0 and 0.33. This is the group of farms with low level of innovation activity. � The second group includes farms with values of the coefficient of total poten-
tial innovation activity within 0.34 and 0.66. This group is characterized by medium degree of innovation activity.
� The last, third group includes farms with coefficient of total potential innova-tion activity within 0.67 and 1. These are farms having high degree of in-novation activity.
Results 16.4
Relation between the real and the potential innovation activity Received results regarding the presence of a relation between the real and
the potential innovation activity could be seen on Fig. 1.
Figure 1. Proportion of people with real and potential innovative activity (%)
Source: own calculation.
0
10
20
30
40
50
60
farmers already implemented innovation
firmly decided to implement innovation
rather tend to introduce innovation than to refuse

197
The analysis of the figure above shows that for almost all innovations re-inforcement of the interest in their implementation is observed. This trend is stronger regarding the implementation of new machines, technique and equip-ment, where the share of persons applying innovations is expected to reach more than half (56.5%). It is based on the awareness of the importance of new agricul-tural machines and equipment for the labour productiveness and competitiveness increase. Similar tendency, although less expressed, exists regarding the imple-mentation of new production technologies, where the share of farmers willing or having a positive inclination to this innovation is almost 50% (47.8). Exception to this trend is observed for intentions to grow new crop varieties, where the share of potential innovators has decreased from 50% to 31.2%. The probable reason is related to the current use of highly productive crop varieties. There is a diminution of interest also in the sphere of new methods of treatment for the animals (from 9.6% to 5.7%). This fact corresponds to the decreasing interest to breeding new livestock kinds, where the potential activity has shown insignifi-cant diminution (at 0.5%).
Increase in innovation activity is expected regarding the innovations in the area of irrigation methods and equipment (of almost 8%). If we take account of the share of persons rather having intention to apply new irrigation methods than to refuse them, it could be expected that almost one third (31.0%) of farmers would be active in searching for new decisions in the fight with climatic changes and drought. The need to introduce new information technologies (computers and the Internet) is expected to be better and betterunderstood. With the actual information technologies, despite the expected increase in interest, the activity to their implementation in practice is still on unsatisfying level (15.6%). This is caused by the lack of built infrastructure for wide Internet access in a lot of rural areas and the objective impossibility to use the modern information instruments. It could be generalized that excluding innovations in the sphere of livestock breeding, for other kinds of innovations is expected to increase the activity of farmers in the new programing period.
Level of potential innovation activity
The level of potential innovative attitudes, defining the real activity in 2014-2020, varies for different groups of farmers, according to some socio- -demographic and economic indicators. The biggest variations were observed among persons having different education degree (correlation coefficient = 0.734). From all persons with agricultural education 13.3% are with high level of innovation activity at average for the sample activity 9.3%; the share of these having medium activity reaches 63.3% at 47% in the sample. Almost twice low-

198
er is the share of agricultural specialists with higher education which shows low level of innovation activity (23.3%) compared to the share of this group in all of the analysed entities (44.1%) (Fig. 2).
Figure 2. Farm distribution of innovation activity according
to their socio-demographic profile (%)
Source: own calculation.
As completely predictable, higher, over the average for the sample, activi-ty is observed among younger farmers from the age group under 40 years. In the other two age groups – 41-65 and over 65 years the rate of farms with high level of innovation is almost twice lower, compared to the average for the sample, which is logical. The noted differences between age groups correspond to the correlation coefficient (0.358) and prove the presence of a moderate dependency between the innovation activity level and the age. Almost the same impact pow-er has the gender, as the men manifest larger activity to the innovations’ imple-mentation.
The juridical state has definite impact on the formation of potential atti-tude to introduce innovative decisions in agricultural production (correlation co-efficient 0.65). This means that almost half of differences in innovation activity level could be explained with differences in juridical state of farms. From all kinds of farms, the trade associations have manifested the biggest interest in im-plementation of innovations’ in their activity. Less interested in innovations in agricultural practice are agricultural cooperatives, which could be explained by the way of organization of the production activity, allowing the use of external mechanized services. The mentioned differences could be seen in Fig. 3.
0102030405060708090
100
high
average
low
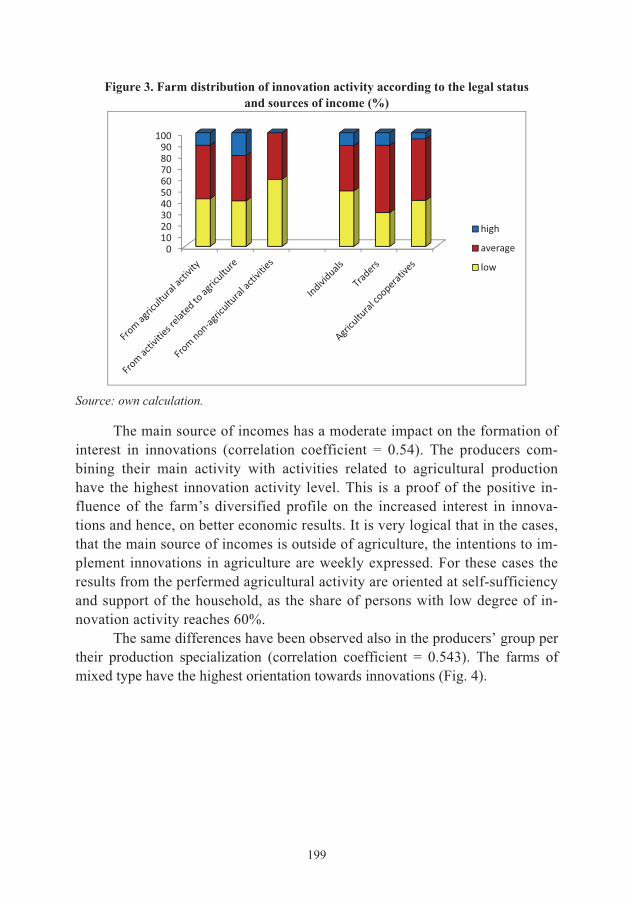
199
Figure 3. Farm distribution of innovation activity according to the legal status and sources of income (%)
Source: own calculation.
The main source of incomes has a moderate impact on the formation of interest in innovations (correlation coefficient = 0.54). The producers com-bining their main activity with activities related to agricultural production have the highest innovation activity level. This is a proof of the positive in-fluence of the farm’s diversified profile on the increased interest in innova-tions and hence, on better economic results. It is very logical that in the cases, that the main source of incomes is outside of agriculture, the intentions to im-plement innovations in agriculture are weekly expressed. For these cases the results from the perfermed agricultural activity are oriented at self-sufficiency and support of the household, as the share of persons with low degree of in-novation activity reaches 60%.
The same differences have been observed also in the producers’ group per their production specialization (correlation coefficient = 0.543). The farms of mixed type have the highest orientation towards innovations (Fig. 4).
0102030405060708090
100
high
average
low

200
Figure 4. Farm distribution of innovation activity according to production method and specialization (%)
Source: own calculation.
In this group the share of farms having high degree of innovation activity is 30.6%. Unfortunately, among the livestock farms there are no units with high innovation level. Farms specialized in livestock breeding function usually on the territory of mountain and semi-mountain regions, they are small-sized and their level of technical and technological equipment is extremely low. The lack of sufficient motivation for implementation of new, more effective production methods and tools dooms these farms to permanent instability of production and funds, which could lead to failure of their activity and bankruptcy.
The low activity to innovations of farms applying organic or predominant-ly organic production methods is surprising (Fig. 3). Barely 4.2% of them have high activity against 50% with low level of innovation activity. One of the rea-sons for the small rate is that they have met all requirements for organic farms, so they are developed regarding the innovations.
Moderate differences in innovations’ activity have been observed in the group of farmers, specified based on some economic characteristics of their farms (correlation coefficient R©0.50). The largest degree of awareness about innovations implementation in the production activity show farms with average production volume within the range of EUR 2,000-4,000, i.e. according to one of the assumed farms classifications these are the small farms (Fig. 5).
0 20 40 60 80 100
Traditionally and predominantlytraditional
Biological and predominantly organic
Crop production
Mixed
Livestock farmslow
average
high

201
Figure 5. Distribution of innovation activity of farms according to economic size (%)
Source: own calculation.
This fact is parthy explained by their insufficient level of technical and technological security at the moment of research and that they have good enough financial opportunity to realize their willingness for innovations. The conclusions made could be applied more strongly to farms with economic size of over EUR 8,000 of average production volume. For the smallest farms with production volume under EUR 2,000 there is extremely low interest in agricul-tural innovations (60% of this category manifest low innovation activity).
Factors of potential innovation activity
Among the most motivating factors for implementation of innovative de-cisions in the farmer’s practice are the following two interrelated production- -economic reasons, having almost equal relative share: higher yields obtainment and higher profit realization (Fig. 6).
They are followed by the stimulus for higher productivity achievement in the livestock breeding and the social factor, expressed through the expected economy of time from the implemented appropriate agricultural innovation. The priority given by the individuals to the production-financial factors corresponds with the strong interest in this type of innovation, which has direct impact on the final economic product obtainment. The results show that there is a recognized need for implementation of environment friendly production technologies and systems. The share of farmers recognizing the compliance with the environment protection as a motivation for production technology implementation amounts to 33.3%. Despite this, the ecological factor is on the last place compared to other motivating factors.
0% 20% 40% 60% 80% 100%
Up to € 1999
From 2000 to € 3999
From 4000 to € 7999
Over € 8000
low
average
high

202
Figure 6. Distribution of the motivating factors for innovation activities (%)
Source: own calculation.
They are followed by the stimulus for higher productivity achievement in the livestock breeding and the social factor, expressed through the expected economy of time from the implemented appropriate agricultural innovation. The priority given by the individuals to the production-financial factors corresponds to the strong interest in this type of innovation, which has direct impact on the final economic product obtainment. The results show that there is a recognized need for implementation of environment – friendly production technologies and systems. The share of farmers recognizing the compliance with the environment protection as a motivation for production technology implementation amounts to 33.3%. Despite this, the ecological factor is on the last place compared to other motivating factors.
Conclusions 16.5
From the analysis of real and potential innovative activity of farmers and its key factors the following conclusions could be made. In the new program-ming period it is expected that farmers become more active as regards the im-plementation of different kinds of innovations, in comparison to the past period. The above stated conlusion is valid particularly for the use of new machinery, equipment and the implementation of new technologies. Livestock farms are expected to keep their low innovative activity also in 2014-2020. The highest level of activity is expected from young farmers having agricultural education and whose farms have an economic size of EUR 2,000-4,000. The farms with diversified profile manifest stronger interest in innovations. The production and
74.5
48.0
70.6
46.8
33.3
0
10
20
30
40
50
60
70
80
Higher yields Higherproductivity
More profit saving time Less polluting

203
economic factors related to obtainming increasing yields and profits have the most stimulating impact on the decision making on implementation of innova-tions. The impact of the ecological factor is nearly symbolic.
The received results give reason to expect that farmers search opportuni-ties to increase their production effectiveness and have intentions for farms’ modernization through the implementation of particular innovations. In the new programming period, in order to realize their attitude to innovations, they will be able to rely on the special RDP (2014-2020) Measure 16, destined to achieve-ment of higher agricultural productivity and sustainability through the European Partnership for Innovation (EPI).
References
1. Babin B.J., Darden W.R., Grifªn M. (1994), Work and or fun: Measuring hedonic and utilitarian shopping value, Journal of Consumer Research, 20(4).
2. Bachtler J. (2007), Innovation und Europäische Regionalpolitik (Innovation and European Regional Policy), Technologiepolitisches Konzept II Steiermark Schriftenreihe des Institutes für Technologie- und Regionalpolitik der Joanneum Research, Band 7, Leykam, Austria.
3. Fishbein M. (1967), Readings in Attitudes Theory and Measurement, New York.
4. Foxall G.R., Goldsmith R.E., Brown S. (1998), Consumer psychology for marketing, London: International Thomson Business Press.
5. Kanter R.M. (1994), Foreword: Innovative Reward Systems for Changing Companies, edited by Thomas Wilson. New York: McGraw-Hill.
6. Leeuwis C. (with contributions by A. Van den Ban) (2004), Communication for rural innovation. Rethinking agricultural extension, Blackwell Science, Oxford.
7. Dargan L., Shucksmith M. (2008), European Society for Rural Sociology, Sociologia Ruralis, Special Issue: Special Issue on Rural Sustainable Devel-opment in the Era of Knowledge Society, vol. 48, issue 3, p. 274-291.
8. Nikolov D., et al. (2014). Innovations management in agriculture, Scientific project, IAE, Agricultural Academy.
9. Melikian O. (2011), Consumer behaviour, Moscow, Russia. 10. OECD (1997), Oslo Manual, Proposed Guidelines for Collecting and Inter-
preting Technological Innovation Data, The Measurement of Scientific and Technological Activities.
11. Rogers E.M., Shoemaker F.F. (1971), Communications of innovations, New York: The Free Press.
204
12. Schwartz S. (1992), Universals in the content and structure of values: Theo-retical advances and empirical tests in 20 countries, Advances in Experi-mental Social Psychology.
13. Vandecasteele B., Geuens M. (2010), Motivated Consumer Innovativeness: Concept, measurement, and validation, International Journal of Research in Marketing.

205
Prof. Mykola Talavyria, dr Viktoriia Baidala National University of Life and Environmental Sciences of Ukraine Dr Vira Butenko Kharkiv National University of Internal Affairs of Ukraine, Sumy branch
17 Investment attractiveness of bioeconomy: case of Ukraine
Introduction 17.1
Investment-active strategy of development of a country is the factor which ensures sustainable development, increase in economy competitiveness, finan-cial security of the country and raise in living standards.
At the current stage Ukraine faces serious economic and political chal-lenges which are often interconnected and interdependent. Today’s urgent is-sues are provision of energy independence, sustainable development as well as solving a number of ecological issues in the country. Focusing on modern tendencies of development of bioeconomy in a variety of the European Union countries we assume that development of bioeconomy in Ukraine has a great potential for solving the above-mentioned issues. Analysis of opportunities for forming the mechanisms of investing in various sectors of bioeconomy is the aim of this article.
In the EU, bioeconomy is viewed, first of all, as one of the constituens of economic development which takes into account latent positive influence of bio-logic processes and use of renewable resources in public health, as well as in the process of economic growth and development, and secondly, as economics which uses renewable bioresources, end products of bioprocesses and the poten-tial of ecoproductive clusters with the aim to produce new bioproducts and gain-ing revenue from their realization and creation of additional work places [OECD 2009]. Thus, in our opinion, investment in bioeconomy may become one of pri-ority directions of investment activities in Ukraine.
Overview of scientific works showed that scientists mainly focus on vari-ous aspects of alternative energy development. In particular, V. Bilodid [2006] shows opportunities of separate types of non-conventional sources of energy and perspective of their usage in energy sector in Ukraine. M. Zhurovskii [2008] considers existing methods of assessment of sustainable development at subna-tional level in Ukraine. N. Mkhitarian [2007] analyses directions of further de-velopment of alternative energy objects which use renewable sources of energy in their work. K. Shonvizner [2007] views the experience of advanced countries

206
in terms of renewable energy sources usage. V. Potapenko [2012] researches urgent problems of forming “green” economy in Ukraine in the context of eco-nomic security of the country.
Investing and innovating stimulation of sustainable regional development is presented in the works of Z. Herasymchuk and V. Polishchuk [2011]. Howev-er, it needs to be emphasized that research of investment attractiveness of bioe-conomy as a whole and its separate sectors are held rather rarely, and unified methodical principles of such assessment have not been developed, yet. That is why the aim of this article is to characterize strategically important directions for investment in bioeconomy in Ukraine, define optimal criteria for assessment of effectiveness of investments in bioeconomy and develop methodical instruments for their application.
Data and methodology 17.2
In order to determine optimal direction of investment in bioeconomy the analysis of its structure is needed. As a rule, within the structure of bioeconomy the following sectors are distinguished: “green” (agriculture and forestry), “white” (biotechnologies of food, chemical and petroleum refining production), “red” (biopharmaceutics), “grey” (environmental protection, bioremediation), “blue” (fishery and aquaculture). Also we would suggest to supplement this structure with the sectors of science and infrastructure of bioeconomy, and to define bioenergetics as a separate sector taking into consideration its strategic importance for the country. Consequently, there appears a question which of these sectors is the most attractive from the investors’ point of view.
For assessment of investment attractiveness of bioeconomy sectors we would suggest using integral index, which unites, subsequently, following indexes: � Level of profitability of sector activities («profit); � Level of potential for sector’s development («potent); � Level of investment risks typical for the sector («risk); � Level of governmental support for the sector («gov); � Level of ecological safety of production plants activities in the sector («eco); � Level of social usefulness/safety («soc).
These synthetic indexes, in their turn, are composed of the following indexes which in more detail, in our opinion, characterize investment attrac-tiveness.
The level of profitability of sector activities should be assessed against the following indexes: � Internal revenue rate (IRR); � Profitability index (PI);

207
� Income rate (IR); � Net present value (NPV).
Level of potential for sector development includes: � Capacity of the market of sector production; � Level of technology development in the sector; availability of scientific re-
searches; � Level of depreciation of main resources and expediency of their modernization; � Number of infrastructure objects; � Availability of personnel with required qualification; � Indexes of competitiveness rate in the sector; � Indexes of the sector companies’ competitiveness.
Level of investment risks in the sector is characterized by: � Political stability/instability; � Inflation level; � Risks connected with natural and climatic conditions; � Possibility of changes at the market conjuncture.
Level of state support is defined by the following indexes: � Level of state financing of the sector; � Availability of reduced tax; � Availability of loans with reduced interest.
Level of ecological security is assessed with the help of the following indexes: � Amount of emissions into atmosphere; � Level of contamination of water and soil; � Usage of renewable resources; � Level of influence of plant production activities on biodiversity.
Level of social usefulness/safety is suggested to be assessed by: � Increase/decrease in income of those working in the sector; � Amount of funds directed to social insurance; � Establishing of social infrastructure.
We have organized a survey among the experts in order to detect weighting coefficient of importance of each synthetic index for calculation of integral index of investment attractiveness for the sectors of bioeconomy (IIAb). As the result of the survey the formula for calculating integral index of invest-ment attractiveness for the sectors of bioeconomy appeared to be as follows:
IIAb = 0.55\profit + 0.08\potent + 0.16\risk + 0.10\gov + 0.07\eco + 0.04\soc. (1)

208
In accordance with the index IIAb we are measuring the investment at-tractiveness of each of bioeconomy sector (the bigger IIAb, the more attractive the sector from investor’s point of view). Using this method for assessment of investment attractiveness of branches (sectors) of bioeconomy helps not only to profitably invest funds in production enterprises of bioeconomy, but also to achieve social benefits. For example, the above-mentioned direction of invest-ments leads to improvement of a company’s social image, increase of product safety, saving scarce resources, improving (at least – not worsening) the quality of environment, and in the end – improving the quality and life expectancy.
Apart from that one should emphasize that the indicators of social useful-ness (security) in their core and contents are even more the basis for forming scenarios of socio-political and economic development of sociobioeconomy in postindustrial society.
Main results 17.3
At the current level of development of Ukrainian economy in general and bio-economy in particular, the most prospective sector for investment, in our opinion, is the “green” sector of bioeconomy as well as bioenergy. Agriculture is one of the most important branches of economics, and taking into consideration both the avail-able potential and results of the analysis performed according to the above-mentioned method, investment in the “green” sector of bioeconomy has a strategic importance for the country. Table 1 represents factual data on the amount of invest-ment in agriculture, forestry, fishery and hunting enterprises in 2007-2013.
Table 1. Dynamics of investment in the agricultural sector of Ukraine
Period Investment in the agricul-tural sector of Ukraine,
million UAH
The share of investment in agri-cultural sector in total invest-
ments, %
GDP of Ukraine, million UAH
2007 9,555 5.06 720,7312008 16,951 7.27 948,0562009 9,404 6.19 913,3452010 12,297 8.16 1,082,5692011 18,220 8.71 1,316,6002012 19,406 6.60 1,408,8892013 19,059 6.48 1,449,406
Source: the data of State Statistics Service of Ukraine (2013).
Based on factual data on dynamics of the GDP of Ukraine during 2007- -2013 and the amount of capital investment in the sectors of agriculture, forest-ry, fishery and hunting enterprises, we held correlation-regression analysis of relation of GDP to amount of investment (Fig. 1). The received equation of cor-relation and regression is:

209
� = 53.571� + 317,200 (2) where: y – the GDP of Ukraine, million UAH; � – amount of capital investment in “green” sector of bioeconomy, million UAH.
Figure 1. Model of relation of the GDP of Ukraine and amount of capital investment
in agriculture, forestry, fishery and hunting enterprises in 2007-2013.
Source: own elaboration based on the data of State Statistics Service of Ukraine (2013).
The determination coefficient R2=0.7323 received as the result of analysis and which shows the level of relation of the dependent variable to the independ-ent variable, proves the adequacy of the constructed model. Moreover, the coef-ficient of the pair correlation R = 0.8557 proves that there is quite a close inter-connection between the indexes under research.
On the basis of these calculations we can assert that investment in the “green” sector of bioeconomy will favour the growth of the GDP of the country as well as solve other socio-economic issues.
Currently in Ukraine the implementing national projects connected with bioeconomy are being implemented. National project “Nature’s Energy” envis-ages building a complex of wind power, sun power and small hydroelectric power stations, producing solid alternative fuel in such regions as Donetsk, Za-porizhia, Kherson, Crimea and Carpathian region. Bioenergy potential is availa-ble almost through out the whole territory of Ukraine. High nature-energy poten-tial that exists in Ukraine has not been developed yet, in comparison with Euro-pean countries, where the best land areas were occupied long time ago by re-

210
newable energy sources installation. Besides, in the country there is a well- -developed electric network, sufficient land areas which can be used for the needs of renewable energy production.
There is “green tariff” enacted for electricity from renewable sources of energy. As the aggregate, these factors make respective investment projects highly profitable. The aim of this project is to develop alternative sources of en-ergy in Ukraine, diversification of risks connected with usage of nuclear power, decrease in energy dependence on gas imports.
A constituent part of this project is the project “Construction of heat and power plant on biomass” which aims at decreasing the country’s dependence on fossil fuels and development of bioenergetic branch of Ukraine by introduc-ing bioenergetic equipment and advanced technologies for municipal and pro-duction objects of heat and energy generation, development of energy saving and solving urgent social, economic and ecological issues. Ukraine has yearly economically feasible potential of biomass which equals to about 53 million tonnes of reference fuel which today is not being used efficiently. Total capaci-ty of bioenergetics market in Ukraine is estimated by experts at of EUR 2 bil-lion. That is why usage of existing resources allows solving the issue of energy security of Ukraine and establishing a business network on production and sale of electric heat energy. The most beneficial approach appears to be establishing of project portfolio on modernization and construction of bioenergy objects with total capacity of 400 MWt of electroenergy and 9000 MWt of heat energy with the principle of vertically integrated heat and power complexes. Such pi-lot projects are being under development in Volyn, Rivne and Sumy regions. The payback term of these investment projects is 4 years, operating period – more than 25 years.
As for GDP energy output ratio, Ukraine exceeds developed European countries by several times. Within dependence of the country on gas and petro-leum import such high energy output ratio limits the competitiveness of national production. Partial substitution of natural gas as a source of energy production of heat energy from renewable sources is being considered. Inclusive – based on the technologies of direct burning of biomass (mainly of bioenergetic plants, wastes from agrarian sector and forestry). For this purpose there is a national project “Energy of Biomass” in Ukraine. Considerable potential of biomass en-ergy is predetermined by climate peculiarities, potential of agrarian sector and availability of work force as well as vast land areas not suitable for classic agri-culture. The biggest energy potential in Ukraine is available in such biomass types as energy plants, agriculture waste, wood waste, turf, liquid fuels from bi-omass. According to various estimates, the potential installed capacity in bioen-

211
ergetics could be 10-15 GWt of heat and 1-1.5 GWt of electroenergy. Realiza-tion of the available potential is complicated by the underdevelopment of the infrastructure and raw materials base which are needed for uninterrupted deliv-ery of materials; that is why the priority task is formed of the raw materials stocking zone, namely, establishing farms for growing energetic plants on the lands unsuitable for classic agriculture. This will allow sustainable development of production of energy from biomass and obtain the first role in the balance of heat energy production. The priority task in the sphere of heat generation devel-opment is modernization and reconstruction of available capacity of heat and power plants. In the framework of modernization the plan is to reequip heat and power plants with the systems of dust-and-gas cleaning to decrease emissions of dust, sulphur and nitrogen oxide down to the standards of the EU and to equip them with cogeneration machines and modern boilers which are designed for high efficiency and are ready for operation with low emissions. This will ensure investment payback even with using poor quality biomass containing up to 65% of moisture and without additional burning. On the principles of public-private partnership it is planned to attract approximately UAH 22 billion in construction and modernization of heat and power plants [State Agency for Investment and National Projects of Ukraine 2013].
As the experience of developed countries shows, financing and realization of national projects of bioeconomy development require taking into considera-tion the interests of different stakeholders – government, business and society, and consequently, lead to usage of the mechanism of social partnership which in this context is viewed broadly with the aim to determine potential attractiveness of the projects for all possible stakeholders, finding sources of financing, esti-mating all consequences from project realization, both economic and non-economic. It is very important at the current level for Ukraine to reach agree-ment between various empowered groups, social structures, political parties and non-profitable organizations regarding the priority of solving the national task of bioeconomy development.
Problematic issues of investment activities development in sectors of bio-economy can be solved on condition of introducing a set of measures by all the participants of investment process – by the government and, in particular, by business itself with involvement of society (e.g. through NGOs). Constituent parts of such a complex are: � At the governmental level:
- Establishing attractive investment climate for involving inner and out-er investors who are determined to develop priority sectors of bioe-conomy;

212
- Forming normative and legislative basis for bioeconomy development; - Participation in financing investment projects; - Providing reduced taxation and interest on loans for bioeconomy in-
vestors; - Development of social partnership mechanisms which foresee imple-
mentation of programmes of joint financing of the projects, which have the biggest social and economic impact;
� At the level of local government: - Development and support of regional innovative and organizational in-
frastructure; - Support for establishing of consulting centers, industrial parks, tech-
noparks, agrobiological clusters, technological platforms, programs of innovative start-ups support;
- Involvement of scientific and research establishments and regional businesses into development of investment projects;
- Assistance to cooperation between scientific and research establish-ments and regional bioeconomy businesses for galvanization of bio-technologies commercialization;
- Arranging competitions of youth investment projects in biotechnology; � At the level of businesses:
- Production ecologisation, use of new resource saving technologies, equipment modernization aiming at decrease in pollution emissions and power intensity;
- Determining direction for potential participation in cluster units; - Defining which scientific and applied developments are needed to in-
crease efficiency and ecologisation in production and taking measures to establish connections with potential designers of the above- -mentioned scientific researches;
� At the level of society: - Forming an attractive image of biotechnological production by prepa-
ration and dissemination of various information materials, arranging presentations for local and foreign investors;
- Organizing enlightening activities with vast groups of society aiming at forming “green” thinking and new standards of consuming and atti-tude toward resource saving.
Practical implementation of introduced measures allows decreasing in-vestment risks and increasing the level of investments into bioeconomy.
213
Conclusion 17.4
Suggested approaches allow us to compose a necessary pattern for defin-ing investment attractiveness for various sectors of bioeconomy which, applied to economic development analysis in Ukraine, enables not only better under-standing of these complex processes but also forecasting bioeconomy develop-ment in the country.
The correlation analysis of impact of agricultural sector investments in Ukraine’s GDP reveals the great role which investments into “green” sector of bio-economy play in the development of the whole country’s economy. The ob-tained results give a possibility to justify the necessity of deeper study of bioe-conomy’s development influence on country’s social indexes, as well as the va-lidity of social development programmes based on bioeconomy principles at re-gional and national levels.
Investment activity activation in all sectors of bioeconomy can be realized by a set of measures, which are carried out by all participants of investing pro-cess – local and state government, businesses and general public. Perspective of further researches in this direction represents the detection of statistic depend-ence between investments value, steady growth indexes, Gini coefficient, which gives an opportunity to more deeply explore social effect of bio-economy in-vestments.
References
Bilodid V., 2006, Vidnovluvani dzherela enerhii v energetytsi Ukrayiny, Nauka ta naukoznavstvo 3, 87-94.
Herasymchuk Z., Polishchuk V., 2011, Stymuliuvannia staloho rozvytku rehionu: teoriia, metodolohiia, praktyka: Monohrafiia. Lutsk: RVV LNTU.
Mkhitarian N., Kudria S., Shchokin A., 2007. Deiaki aspekty podalshoho rosvytku obiektiv alternatyvnoii enerhenyky. Vidnovliuvana enerhetyka 2, p. 6-13.
Organisation for Economic Co-operation and Development (OECD), 2009. The Bioeconomy to 2030: Designing a Policy Agenda, OECD Publishing. DOI: 10.1787/9789264056886-en P.19-30.
Potapenko V., 2012. “Green” economics in the strategic priorities of se-curity development of Ukraine. The Economic Annals-¬¬I Journal, 3-4. Avail-able at http://soskin.info/en/ea/2012/3-4/contents.html
Shonvizner K., 2007. Vidnovliuvani dzherela enerhii (Dosvid Nimechchyny). Pratsi Instytutu elektrodynamiky NAN Ukrainy: zbirnyk nau-kovykh prats, p. 7-9.

214
State Agency for Investment and National Projects of Ukraine, 2013. An-nual report. Available at http://www.ukrproject.gov.ua/en
State Statistic Service of Ukraine, 2013. Social economic development of regions. Available at http://ukrstat.gov.ua/.
Zhurovskii M., Statiukha H., Dzhyherei I., 2008. Otsenivanie ustoichivoho rasvitiia okruzhaiushcheiy sredy na subnatsionalnon urovne v Ukraine. Systemni doslidzhennia ta informatsiini tekhnolohii 4, p. 7-20.
215
Dr Yuriy Trokoz National University of Life and Environmental Sciences of Ukraine
18 Competitiveness and comparative advantages of Ukraine’s agriculture sector in trade with the European Union
Introduction 18.1
The independence of Ukraine declared in 1991 gives raise to development of the dynamic relationships between the European Union (EU) and Ukraine. Ukraine is a top-priority partner for the EU within the framework of the Europe-an Neighbourhood Policy (ENP) and the Eastern Partnership. In March 2007, the negotiations on the Association Agreement were held between Ukraine and the EU. It was expected that the Association Agreement will be signed in 2013 and that is will come into effect soon thereafter, but a final decision was taken only upon the socio-political processes dictated by present-day circumstances at the national level. The political provisions of the Association Agreement be-tween the EU and Ukraine were signed on March 21, 2014 by the Heads of State and Government of the European Union and the Prime Minister of Ukraine. The desire to sign the second part of the provisions of the Association Agreement (on the Deep and Comprehensive Free Trade Area) was reaffirmed on June 27, 2014 during the meeting of the EU Council, the President of Ukraine and the European Union leaders and heads of state or government of the 28 EU Member States when the economic part of the Association Agreement was signed.
In the meantime, the European Union has already established the autonomous trade preferences regime regarding Ukraine. The unilateral (on the part of EU) can-celation of import duties that applies to 94.7% of the total number of manufactured products and 83.4% of the total number of agricultural goods and food products im-ported by the EU from our country, which is effective as of January 1, 2016 [Crea-tion of Free Trade Area between Ukraine and the EU 2015].
Ukraine has great agricultural potential because of its rich natural re-sources, favourable climate conditions and key geographic position with access to the Black Sea. The role of agriculture in the economy of Ukraine is quite sig-nificant. Even though the agriculture’s share in the total GDP in Ukraine has de-creased materially since 1991, agriculture’s share in the GDP was around 10.25% in 2014. Moreover, the Ukraine’s agricultural sector makes a considera-ble contribution to the national employment rate with a share of approximately 17%. The agriculture also has a key role in the Ukrainian foreign trade and ex-

216
ports of agri-food products, which was equal to approximately 31% of the total Ukraine’s exports in 2014 [Gross Domestic Product 2015].
The scientists claim that the population increase provides indubitable growth in demand for food products. One of the main questions that researchers have to face is the distribution of the limited resources in such a way that social well-being and national economic growth are secured in the present-day economic conditions. In this regard, we fully share the judgements of the Professor S.M. Kvasha, who stated: “competitiveness of agricultural products to a considerable degree will determine competitiveness of Ukraine in the world market” [Kvasha 2006].
After Ukraine’s choice of the European vector of development, a number of observers expect that combination of the country’s current physical potential with up-to-date: European technologies, standards and transparent market rela-tions will certainly drive up the agri-food sector, which will lead to the creation of a new strong player in the European market.
Under the above-mentioned conditions the importance of making estima-tion of the competitiveness in the EU market of the national products in agri-food sector increases significantly and determines the significance both theoreti-cal and applied research in this direction.
Analysis of recent researches and methodology 18.2
The fundamental concept of the competitiveness is researched and devel-oped in the writings of the following economists: M. Porter, D. Ricardo, J. Rob-inson, A. Smith, R. Fathudinov, F. Hayek, P. Heine, G. Hicks, E. Chamberlin. Among Ukrainian’s researchers the issues of competition development and eco-nomic formations security of competitiveness are covered in writings of V. An-driychuk, J. Bazyliuk, L. Balabanova, O. Borodina, N. Vdovenko, A. Halchyn-skiy, T. Zinchuk, S. Kvasha, M. Malik, P. Sabluk, O. Shpychuk and other na-tional economic scientists.
The goal of the research is to highlight and summarize the results of elab-oration of the theoretical aspects of the concept of “competitiveness” in the con-text of development of European integration and studied existing comparative advantages of Ukrainian agricultural products at the European Union market.
One of the major driving forces of the development of socio-economic struc-tures as well as the basis of the market economy functioning is the competition. In majority of countries across the globe the competition as a source of the development is supported at the law-making level. In Article 42 of the Constitution of Ukraine it is stated that “the State ensures the protection of competition in entrepreneurial activi-ties. The abuse of a monopolistic position in the market, the unlawful restriction of competition, and unfair competition, shall not be permitted”.
217
The nature of competition as a determining factor of prices regulation and encouragement of innovation processes, isdifferenthy considered by various sci-entists, therefore it is appropriate to analyse its most widespread basic defini-tions formulated by renowned scientists. The word “competition” (from latin concurrentia) means “contest” or “collision”. The first theoretical understanding of the driving force of competition, can be found in the writings of the Scottish economist and philosopher Adam Smith. In his book “An Inquiry into the Na-ture and Causes of the Wealth of Nations” Adam Smith substantiated that com-petition by aligning the profit ratio leads to the optimal allocation of labour and capital. Competition means the invisible hand of the market that automatically countervails the market. Adam Smith linked competition to fair rivalry without any confederacy that exists between sellers (buyers) for the most favourable terms and conditions of sale of goods, without any conscious control over the market processes [Smith 1962].
According to the American economist P. Heyne the term “competition” is understood as “the desire to meet the criteria for access to rare goods in the best possible manner” [Brief Economic Dictionary 2002]. K. McConnell and S. Brue define competition as the presence of large number of independent sellers and buyers in the market who are free to enter the market and to leave it [Campbell 2003]. Austrian scientist Friedrich Hayek, the Nobel laureate in economics in 1974, mentioned that competition is the process by which people receive and transmit knowledge. He holds the opinion that, only thanks to the competition, hidden becomes clear on the market [Fatkhutdinov 2005].
The special model explaining industrial composition and earning power in the industry was suggested by M. Porter as far back as the early 1980s. Accord-ing to the industry analysis theory of M. Porter, in any kind of economic sector the essence of competition is expressed by five forces whether operating only in the domestic or foreign market (Fig. 1).
M. Porter believes that “competition is more than just a rivalry among ex-isting competitors and the intensity of the competition in the industry is neither accidental nor is it the result of bad luck. On the contrary, the competition in the industry stems from its fundamental economic structure and goes far beyond the frames of conduct of the existing competitors. The state of competition in the industry depends on five basic competitive forces: threat of appearance of new competitors, threat of appearance of substitute products, the ability of suppliers of components to bargain, the ability of buyers to bargain, rivalry between com-petitors that already exist on the market. The value of each of the five forces dif-fers from industry to industry and in the end determines the profitability of the industry” [Porter 1995].

218
Threat of entry of newcompetitors
The ability of buyers tobargain
The ability of suppliers tobargain
The threat of appearance of substitute goods and
services
BRANCH COMPETITORS The rivalry among existing
competitors
Figure 1. The model of five competitive forces according to M. Porter
Source: M. Porter 2005.
Carrying-out of an analysis of the most widespread definitions of compe-tition allows us to arrive at the conclusion that as a scientific concept of compe-tition is multidimensional. Therefore, it is necessary to determine its content in each specific case depending on the purposes owing to which it was formed.
While studying the issue of economic growth, researchers often refer to the concept of competitiveness – as the basis for the analysis. Unconditionally, competitiveness is an indispensable prerequisite for economic growth. In addi-tion, productivity growth is a key element in keeping up competitiveness and to a wide extent related to the introduction of new technologies and innovations. Furthermore, innovations are subject to research and development as well as an influence of public policy. The combination of these theoretical concepts is a key issue for applied researches in the agri-food sector.
Organisation for Economic Co-operation and Development (OECD) de-fines the competitiveness as “the ability of companies, industries, regions, coun-tries and supranational regions to generate higher factor of revenues and factor of employment on continuing basis, also remaining open for international com-petition”. The European Commission uses the following definition: “a persistent growth of the living standards of the nation or region affiliated with a lower lev-el of involuntary unemployment, as far as practicable” [Latruffe 2010].
M. Porter defines the concept of “competitiveness” in the broad sense as “an opportunity to win the race”, and concerning the economic understanding “possession of characteristics that create an advantage for the party of economic competition” [Porter 2005].
The concept of “competitiveness” as an economic category includes sev-eral levels, so that it seems appropriate to consider it in the light of the hierarchy of objects: the competitiveness of specific product companies fields and finally the whole countries. Herewith it should be mentioned that according

219
to scientists, in a greater degree, the competitiveness of the country depends on the ability of specific manufacturers to produce competitive products [Ensuring competitiveness… 2007].
Agricultural products and foodstuffs occupy a significant place in the ex-port potential of our country and their share is constantly growing (Fig. 2).
Figure 2. The share of the agricultural sector in Ukraine’s export potential
from January to July 2015
Source: developed by the author, data from the UKRSTAT.
This is precisely why the competitiveness of the agricultural products to a wide extent will determine the competitiveness of Ukraine in the world mar-ket. Therefore, the issue of competitiveness of domestic agricultural products is gaining greater importance.
By summarizing the work of top-level scientists in this sphere, there is still no finalized concept of accurate determination of competitiveness. Howev-er, among scientists there is a specific consensus concerning the criteria of eval-uation of competitiveness [Latruffe 2010]. Assessment can be made under two disciplines: i) neoclassical economic theory, which focuses on the trading suc-cess and that defines the competitiveness under the real exchange rate, index of comparative advantages, index of exports and imports; ii) strategic school of management which emphasizes a strong structure and management. According to the latter, the competitiveness is determined by advantages in expenses and non-monetary factors. In the process of scientific research the determinants and the overall effect of the competitiveness can be represented in the relevant logi-cal scheme (Fig. 3).
21 679 613
6%
51%
24%
19%35,1 %
Total Exports January - July2015, Thous. of USD
I. Live animals; animalproducts
II. Vegetable products
III. Fats and oils of animalor vegetable origin
IV. Finished foods

220
Figure 3. The indexes, the determinants and the overall effect of the competitiveness
Source: Vdovenko 2015.
Taking into consideration the relativism of the competitiveness as a category, the figures formed under the absolute values such as market volume, export turnover and others, can provide not enough information about the com-petitive position of the national economy sector. In our opinion, it makes sense to compare the figures of registered sectors of the national economies. Among the indicators that are most often used by scientists, it is worth to montion the index of relative comparative advantage RCA, index of relative export ad-vantage RXA, index of relative import penetration RMP, index of relative trade advantage RTA and relative symmetric comparative advantage index RSCA that is based on the classic Balassa’s index [Balass 1965; Hinloopen 2000].
It is commonly known that competitiveness is a relative ratio considering that it can be determined only by comparison. This is precisely why in estimat-ing the competitiveness of Ukrainian products in the agricultural European Un-ion market it is not enough to analyse only absolute measures. The relative ratios are more significant.
International trade theory states that country’s advantages from trade pro-vide specialization in the sector of comparative advantage. Revealed Compara-tive Advantage Index (RCA) shows in which commodities the country has com-parative advantage. The Balassa index was formulated as follows:
Domestic – social well-being
Competitiveness of enterprise Other factors
Trade indexes + expenditure level+ productivity + non-price components
Factors managed by enterprises Factors uncontrolled by enterprises
The structure, strategy, social capital Natural resources, climate, tastes, policy

221
)//()/( XwxXxRCA iwjijij � (1)
where: RCAij – revealed comparative advantage index for the ith goods of the j-th coun-try; xij – j-th country’s ith exported goods; Xj – j-th country's total exports; xiw – i-th goods of the global exports; Xw – total global exports.
The revealed comparative advantage (RCAij) index has a relatively sim-ple interpretation. If RCA>1, ith goods to the j-th country show that it has a comparative advantage. That is, the country’s total export share in these goods is greater than their share in global trade. On the other hand, if RCA<1 then that the given goods have a comparative disadvantage.
Distinguishing feature of RXA index comes down to the fact that it varies from original RCA by leaving out similar countries and commodities in the nu-merator and denominator. The Relative Export Advantage Index is calculated using the following formula:
��� ���� �
�jII
kIkkjII jkk
kjijijij XXXXRXA,1,, ,
)//()/( (2)
where: X – export; i and k – types of commodities; J and I – coutriers.
The RXA index is determined as a ratio of country’s share in the world export of the specific commodity to its share in the world export of all other commodities. In the case when it is bigger than 1, the country has comparative competitive advantages in relation to export of the commodity in question, and if it is less than 1, then it points to competitive disadvantages.
The Relative Dependence on Imports index RMP is very similar to the RXA index, with the only difference being that in this case, the import is taken into consideration:
������
�jII
kIikkjII
iIijij MMMRMP,,,
)/()/( (3)

222
where: ` – import; i and k – types of commodities; J and I – countries.
In the case when RMP index value is greater than 1, the import dependen-cy is high (i.e. there are competitive disadvantages), and if it is less than 1, then the import dependency is low (i.e. there are comparative competitive ad-vantages).
In calculating the Relative Trade Advantage Index the indicators of cer-tain commodities’ import and export are taken into account at the same time:
ijijij RMPRXARTA �� (4)
where: RTA – Relative Trade Advantage Index; i – type of commodity; j – country; RXA – Relative Export Advantage Index; RMP – Relative Import Penetration Index.
General overview of Ukraine’s trade with the EU-28 18.3
Exports of goods to the EU countries amounted to USD 17,004.7 million, or 31.5% of the total exports, and increased in comparison to 2013 by USD 431.2 mil-lion, or by 2.6% (in 2013 amounted to USD 16,573.5 million, or 26.6%). In partic-ular, the level of supply of animal-based or vegetable-based fats and oils increased by 58.4%, cereals – by 5%. Among the major partner-countries, the export of commodities increased to Italy by 5.7%, Poland – by 3.9% and Germany – by 2.5%. At the same time, the export to Russia, by 33.7%, Belarus – by 16.7%, India – by 7.1% and Turkey – by 5.1%. The agri-food structure of Ukrainian export is based on plant products, which amounted to 16.2% (1.3% less), including cereals – 12.1% (by 3% higher), animal or vegetable fats or oils – 7.1% (by 9.3% higher), finished food products (by less than 11.5%).
An important issue among many others in the course of making assess-ment of the efficacy of free trade area between the EU and Ukraine is the review of their bilateral trade commodity flows (Fig. 5) and determination of the nature of international trade specialization as well as calculation of indexes of Relative Comparative Advantage of agri-food products of Ukraine in the EU market within the model of modern economy.

223
0100000200000300000400000500000600000700000800000900000
1000000
ItalyPolandG
ermany
Netherlands
SpainH
ungaryC
zech Republic
Rom
aniaSlovakiaB
ulgariaU
nited Kingdom
Austria
FrancePortugalLithuaniaG
reeceB
elgiumLatviaD
enmark
Cyprus
Sweden
IrelandEstoniaFinlandC
roatiaM
altaSloveniaLuxem
bourg
USD '000
Figure 4. Commodity trade flow between Ukraine and the European Union
Source: developed by the author, data from the UKRSTAT.
Figure 5. The geographical structure of Ukraine’s foreign trade with EU countries,
the first half of 2015
Source: developed by the author, data from the UKRSTAT.
For the analysis, we use as a basis the statistics of the UN Committee of Trade [The Committee of the UN Trade] for 24 product groups under the export in the bilateral relations between Ukraine and the EU during 2014, in accord-ance with the Harmonized System Commodity Description and Coding of Goods under 2-digit code (HS 2-digit), and formula of revealed comparative ad-vantage, which was developed by B. Balassa.
0
5000000
10000000
15000000
20000000
25000000
30000000
2010 2011 2012 2013 2014
Export
Import
USD '000

224
Table 1. The main commodity groups of Ukraine revealed comparative advantages in trade with the EU in 2014
HS-2 digit Commodity
EU – 28 export to Ukraine, Trade Value (US$)
Ukraine’s export to EU – 28, Trade
Value (US$) RCA
The share of com-
modities in Ukraine’s agri-food export to EU-28, %
01 Live animals 79,916,510.00 310,121.00 0.01 0.01% 02 Meat and edible meat offal 146,203,073.00 51,973,685.00 0.47 1.09%
03 Fish and crustaceans, molluscs and other aquatic invertebrates 74,712,468.00 9,116,792.00 0.16 0.19%
04 Dairy produce; birds' eggs; natural honey; edible products of animal origin not elsewhere specified or included
95,792,547.00 69,424,291.00 0.95 1.46%
05 Products of animal origin not elsewhere specified or included 11,623,132.00 6,124,686.00 0.69 0.13%
06 Live trees and other plants; bulbs roots and the like, cut flowers and ornamental foliage 76,174,156.00 256,497.00 0.00 0.01%
07 Edible vegetables and certain roots and tubers 58,415,501.00 23,915,373.00 0.54 0.50%
08 Edible fruit and nuts; peel of citrus fruit or melons 146,944,284.00 88,905,046.00 0.79 1.86%
09 Coffee tea and spices 83,717,054.00 3,109,732.00 0.05 0.07% 10 Cereals 241,667,721.00 1,805,431,698.00 9.80 37.87%
11 Products of the milling industry; malt; starches; inc. wheat gluten 13,634,234.00 10,198,155.00 0.98 0.21%
12 Oil seeds and oleaginous fruits; miscellaneous grains seeds and fruit; industrial or medicinal plants; straw and fodder
168,160,001.00 919,012,708.00 7.17 19.28%
13 Lac gums resins and other vegetable saps and extracts 17,786,608.00 322,405.00 0.02 0.01%
14 Vegetable plaiting materials; vegetable prod-ucts not elsewhere specified or included 83,753.00 85,122,438.00 1333.
83 1.79%
15 Animal or vegetable fats and oils and their cleavage products, prepared edible fats, ani-mal or vegetable waxes
61,721,262.00 794,755,023.00 16.90 16.67%
16 Preparations of meat, fish, or crustaceans, molluscs or other aquatic invertebrates 31,280,188.00 3,019,295.00 0.13 0.06%
17 Sugars and sugar confectionery 21,343,458.00 20,862,399.00 1.28 0.44% 18 Cocoa and cocoa preparations 154,116,649.00 25,754,489.00 0.22 0.54%
19 Preparations of cereals, flour, starch or milk; pastrycooks' products 83,248,008.00 29,598,548.00 0.47 0.62%
20 Preparations of vegetables, fruit, nuts or other parts of plants 99,621,004.00 157,204,566.00 2.07 3.30%
21 Miscellaneous edible preparations 253,471,514.00 22,844,640.00 0.12 0.48% 22 Beverages spirits and vinegar 171,666,372.00 28,545,721.00 0.22 0.60%
23 Residues and waste from the food industries; prepared animal fodder 169,457,301.00 605,714,420.00 4.69 12.71%
24 Tobacco and manufactured tobacco substi-tutes 77,606,298.00 5,766,757.00 0.10 0.12%
Total Value 01-24 commodities (US$) 2,338,363,096.00 4,767,289,485.00 100.00%
Source: developed by the author, data from the UNCTAD.

225
The results (Table 1) give reason to come to conclusion that Ukraine at
the present stage of development of bilateral trade relations with the EU to a wide extent specializes in the manufacture and export of resource products of agri-food sector.
The analysis of the RCA index showed that Ukraine has a comparative competitive advantage in the export of cereals, oil seeds and oleaginous fruits, vegetable plaiting materials, animal or vegetable fats and oils, sugar and sugar confectionery, preparations of vegetables, fruit, residues and waste from the food industries. The results are shown in Figure 6.
Figure 6. The main commodity groups of the Ukrainian revealed comparative
advantages in trade with the EU in 2014
Source: developed by the author, data from the UNCTAD.
The particular goods in which Ukraine has the advantage are the basis of our agri-food export to the EU – cereals, sunflower seeds and sunflower oil. There is also comparative advantage in such groups of products as: sugar and sugar confectionery, preparations of vegetables, fruit, residues and waste from the food industries.
Figure 7 shows the share of commodities with revealed comparative ad-vantage RCA in the total Ukrainian export of agri-food products to the EU. Commodities such as cereals, sunflower seeds and sunflower oil have much higher index than 1, thus under free trade with the EU they shall further consoli-date Ukrainian position.
9.80
7.17
16.90
1.282.07
4.69
0.002.004.006.008.00
10.0012.0014.0016.0018.00
Cer
eals
Oil
seed
s and
olea
gino
us fr
uits
Ani
mal
or v
eget
able
fats
and
oils
Suga
rs a
nd su
gar
conf
ectio
nery
Prep
arat
ions
of
vege
tabl
es, f
ruit
Res
idue
s and
was
tefr
om th
e fo
odin
dust
ries
RCA

226
Figure 7. The main commodity groups of Ukraine revealed comparative advantages in trade with the EU in 2014
Source: developed by the author, data from the UNCTAD.
For the most part, the index is a sensor element to everything that dostorts the structure of trade, namely the trade barriers. Considering that the EU and Ukraine have different conditions of trade with other countries, as a rule it af-fects the index, but as for the commodity groups, where the index is much high-er than 1, the probability of losing the benefits for changes in conditions is very slight. Table 2 shows the distribution of export in absolute and percentage terms, the main competitive commodities among the EU Member States in 2014.
Theoretical summation of the provisions on competitive advantage re-search shows that all the definitions relate to certain subject, object or process. However, the main determinant is the status of business entity or position of products on the market, nevertheless, it also may be the industry and the coun-try, which provide the most advantageous market position under the condition of severe competition and ensure, to the full extent, the desires and expectations of consumers. Moreover, “sustainable competitive advantage” has strategic im-portance because they last for a long time. The globalization of all spheres of life encourages business entities to take into account national interests and inter-national trends and features of development of the economic system and its components, as well as complementarity of national economies. The institution-al environment under modern conditions makes the forms, methods and direc-tion of creating competitive advantages and implementation of competitive strategies. Competitive advantages shall be defined as the determinants of com-petitiveness of products, goods, company, industry and country.
37.87%
19.28%1.79%
16.67%0.44%3.30%12.71%
10 Cereals
12 Oil seeds and oleaginous fruits
14 Vegetable plaiting materials
15 Animal or vegetable fats and oils and their cleavageproducts
17 Sugars and sugar confectionery
20 Preparations of vegetables
23 Residues and waste from the food industries

227
Table 2. Geographic structure of export of some Ukraine’s competitive products to the EU in 2014
EU-28
10. Cereals
12. Oil seeds and oleagi-nous fruit; miscellaneous
grains,seeds and fruit; industrial or medicinal
plants; straw and fodder
15. Animal or vegetable fats and oils and their
cleavage products; pre-pared edible fats; animal
or vegetable waxes
23. Residues and waste from the food industries; prepared animal fodder
Trade Value (US$) % Trade Value
(US$) % Trade Value (US$) % Trade Value
(US$) %
Austria 1,399,591 0.08% 8,882,752 0.97% 4,231,685 0.53% 539,073 0.09% Belgium 98,759,395 5.47% 153,678,926 16.72% 17,257 0.00% 13,430,326 2.22% Bulgaria 169,569 0.01% 3,829,795 0.42% 59,846 0.01% 343,600 0.06% Croatia 5,059 0.00% 392,877 0.04% 2,402 0.00% 632,592 0.10% Cyprus 21,487,457 1.19% 2,040 0.00% 4,208,135 0.53% 3,567,248 0.59% Czech Republic 480,169 0.03% 1,783,100 0.19% 9,094,445 1.14% 1,601,685 0.26% Denmark 881,658 0.05% 1,731 0.00% 274 0.00% 7,239,154 1.20% Estonia 507,427 0.03% 596,225 0.06% 1,080,907 0.14% 988,202 0.16% Finland 10,038 0.00% 75,551 0.01% France 13,314,879 0.74% 127,515,327 13.88% 58,089,492 7.31% 152,737,834 25.22% Germany 86,396,673 4.79% 70,448,739 7.67% 2,771,803 0.35% 2,385,574 0.39% Greece 9,919,578 0.55% 61,987,555 6.75% 16,844,566 2.12% 23,954 0.00% Hungary 2,689,685 0.15% 29,995,939 3.26% 4,199,645 0.53% 195,328 0.03% Ireland 59,961,390 3.32% 8 0.00% Italy 292,023,578 16.17% 83,699,421 9.11% 166,259,549 20.92% 68,515,269 11.31% Latvia 3,705,832 0.21% 2,186,865 0.24% 3,335,135 0.42% 8,089,384 1.34% Lithuania 44,482,188 2.46% 16,100,828 1.75% 16,273,483 2.05% 31,312,474 5.17% Luxembourg 9,356,082 1.02% Malta 147 0.00% 242,855 0.03% Netherlands 315,456,808 17.47% 135,969,939 14.80% 166,847,822 20.99% 68,064,514 11.24% Poland 15,140,025 0.84% 74,067,697 8.06% 60,187,626 7.57% 127,796,690 21.10% Portugal 109,435,374 6.06% 83,031,311 9.03% 18,727,370 2.36% Romania 61,542 0.00% 16,406,434 1.79% 1,861,707 0.23% 1,405,258 0.23% Slovakia 208,151 0.01% 1,129,069 0.12% 2,819,481 0.35% 619,423 0.10% Slovenia 217,642 0.01% 20,504 0.00% Spain 620,685,074 34.38% 34,470,620 3.75% 187,531,777 23.60% 68,958,183 11.38% Sweden 94,832 0.01% 52,206 0.01% United Kingdom 108,032,769 5.98% 3,288,541 0.36% 70,015,555 8.81% 47,268,655 7.80% Total 1,805,431,698 100.00% 919,012,708 100.00% 794,755,023 100.00% 605,714,420 100.00%
Source: developed by the author, data from the UNCTAD.
Therefore, we see that the concept of competitive advantage and competi-tiveness are closely related, and the formation and presence of the first deter-mines the existence of the latter. Hence, competitiveness of the product is insep-arable from the competitiveness of enterprises, industries of the country.
According to the data from Table 2 and Figure 8, cereals’ export in 2014 was carried out to the EU in the following proportion – 68.2% of the total vol-ume was exported to Italy, Holland and Spain, and the rest with a share below ten percent was distributed between the other EU countries.

228
Figure 8. The geographical structure in trade of Ukraine’s RCA commodities with EU countries, 2014
Source: developed by the author, data from the UNCTAD.
As for the export from Ukraine to the EU of the product group (HS 12) oil seeds and oleaginous fruit, among the countries that had the largest share in 2014 were Belgium, France and Holland, but overall their total share did not ex-ceed 50%, that makes possible to consider a relatively even distribution among the EU Member States. Among the largest consumers of Ukrainian sunflower oil were: Italy, Holland, Spain, as their combined share was 65%. As for the distri-bution of Ukrainian export commodity group (HS 23) residues and wastes from the food industries, the highest shares were exported to France and Poland, and the rest was distributed among the other EU Member States with a share of less than 12%.
One of the main tasks of each state, which is concerned about economic growth and achievement of the desired level of the national security, is to ensure the competitiveness of the national economy. Jeffrey Sachs believes that com-petitiveness of the national economy is determined by the presence in the coun-try of a healthy market, factors of production and other characteristics that form the potential for the sake of achievement of the sustainable economic growth. The healthy economy must be underpinned by growth in business activity, gov-erned by law and stable prices [Sachs et al. 2003].
20.92% 20.99% 23.60%34.49%
0.00%10.00%20.00%30.00%40.00%
Animal or vegetable fats and oils
16.17%17.47%
34.38%31.97%
0.00%10.00%20.00%30.00%40.00%
Cereals
16.72% 13.88% 14.80%
54.61%
0.00%20.00%40.00%60.00%
Oil seeds and oleaginous fruits
25.22%
11.31%11.24%
21.10%
11.38%19.75%
0.00%10.00%20.00%30.00%
Residues and waste from the food industries

229
In addition to the above, it should be emphasized that in the modern con-ditions the development of the innovative processes appeared to be one of the determining factors in increasing the competitiveness in the countries. Accord-ing to the methods of the World Economic Forum, developed by Professor J. Sachs and J. MacArthur in “The Global Competitive Report”, based on the Global Competitiveness Index calculation a segregation of the countries was made according to the level of their competitiveness. Thus, the authors hold the opinion that the most important factors of economic growth in the country are the openness of the country to the international trade, the character of the na-tional policy, the efficiency of the system of finance, the mobility of labour markets, the level of sophistication of technologies, the educational level of la-bour force and the development of social institutions.
Conclusions and recommendations for further research 18.4
In today’s situation, it is an extremely important issue for the agrarian sec-tor of Ukraine to strengthen the position of the European agricultural market, expanding export orientation of agricultural production, which will be the main feature of economic growth in the country’s agricultural sector.
Intensification of economic integration between the EU and Ukraine is able to provide transfer impulses of technological knowledge and physical capi-tal in Ukraine and the establishment of manufacturing of products with high lev-el of value dded.
Generalization of the theoretical knowledge of the competitiveness has al-lowed us to form a further line in research based on usage of the empiric meth-ods of evaluation of the indexes of relative comparative advantage RCA, RTA, RXA, RMP and RSCA, based on the classic index B. Balassa, with regard to definition of the priority needs of the national food security and development of new approaches to the formation of agricultural policy of Ukraine in terms of FTA with the EU with due consideration of the current global transformation processes.
Reference
1. Balassa B., Trade liberalization and Reveal Comparative Advantage, Man-chester School of Economic and Social Studies vol. 33/1965, p. 99-123.
2. Azriliyan A.N. (ed.), Brief Economic Dictionary, Institute of New Economy, 2002.
3. McConnell C.R., Brue S.L., Principles, Problems, and Policies, INFRA – M, 2003.

230
4. Creation of Free Trade Area between Ukraine and the EU http://www.kmu.gov.ua/control/uk/publish/article?art_id=244830558 (07.04.2015).
5. Ensuring competitiveness of the agricultural sector of Ukraine economy in domestic and foreign markets: science. rep. / Ed. Acad. of UAAN Trehob-chuk V.M., member-corr. UAAN Pashaver J.B. – Kyiv: Institute of Econom-ics and Forecasting, 2007.
6. Fatkhutdinov R.A., Management of competitiveness of the organization, Eksmo Publishing House, 2005.
7. Gross Domestic Product access modehttp://www.ukrstat.gov.ua/operativ/ operativ2014/vvp/vvp_kv/vvp_kv_u/vvpf_kv2014_u_n.htm (15.04.2015).
8. Hinloopen J., van Marrewijk Ch., On the Empirical Distribution of the Balassa Index, Erasmus University, Rotterdam 2000.
9. Sachs J.D., Cornelia E., Economic Convergence and Economic Policy, Economy Questions no. 5, 1995.
10. Kvasha S.M., Competitiveness of domestic agricultural goods on the world agricultural market, Economy AIC. – 2006. – No. 5.
11. Latruffe L., Competitiveness, Productivity and Efficiency in the Agricultural and Agri-Food Sectors, OECD Food, Agriculture and Fisheries Papers, OECD Publishing, Paris 2010.
12. Porter M.E., Competitive Strategy: Techniques for Analyzing Industries and Competitors, Alpina Business Books, 2005.
13. Porter M., Competitive Advantage: Creating and Providing the Higher Level of Business Activity, Frn – Press, New York 1995.
14. Smith A., An Inquiry into the Nature and Causes of the Wealth of Nations, 1962.
15. The Committee of the UN Trade, http://comtrade.un.org/ 16. Vdovenko N.M., Modern paradigm of development regulation of the agricul-
tural sector branches under the conditions of worldwide deficiency of food products, ScienceRise no. 2/3 (7)/2015.

231
Sergey Grygorev
National University of Life and Environmental Science of Ukraine
19 Ukrainian agricultural products competitiveness on Europe-an market in time of financial challenges
Introduction 19.1
The commodity turnover between Ukraine and the EU has constantly been growing during the last decade. After the Free Trade Area Agreement came in force in 2016 further growth of trade volume is expected. Ukraine is a strong exporter of agricultural products and it is a noticeable player on the world market. Spain, Italy, the Netherlands and Poland are among the leaders of European countries, which import Ukrainian agricultural products. Ukraine’s export of animal products grew almost 20% in the first quarter of 2015, compar-ing with the previous year. For the first half of year 2015 Ukraine exported al-most 10% more poultry meat and byproducts, than during the same period of 2014 – 75.8 thousand tonnes, the biggest consumers are Iraq, Netherlands and Kazakhstan. Overall export amount comprises USD 106.4 million. Right now, Ukraine is experiencing a financial crisis which caused a drop in local curren-cy’s exchange rate.
In this paper we will analyse the current trade turnover between Ukraine and the European Union, examine overall import/export operations, and we will also focus on agricultural sector and poultry segment. Basing on the comparison of the production costs for poultry meat in different countries we will analyze the place of Ukrainian products in the European market in current times of financial challenges and perspectives of trade development with the European Union.
Trade development between Ukraine and the EU 19.2
Overall trade turnover Ukraine-EU The European Union became the major trade partner for Ukraine in 2014.
Trade amount comprised USD 37.9 billion, which is 35.6% of Ukraine’s overall international trade amount. This includes USD 17.1 billion of export and USD 20.8 billion of import from the EU countries. For the first half of 2015, overall export to the EU countries comprises USD 6.1 billion, and import from the EU was USD 7.5 billion.
Ukraine keeps negative balance of trade operations mainly because many of goods made in Ukraine do not respond to the EU quality standards and there

232
are limitations in access to particular markets. At the same time, negative bal-ance of USD 3.7 billion is the best result since 2006.
Among the biggest customers for Ukrainian goods are Poland, Italy, Ger-many, Hungary, Spain and the Netherlands. The major exporters from the EU to Ukraine are Germany, Poland, Italy, France and Lithuania. The main trade part-ners, keeping more than 1/3 of overall turnover were Germany and Poland.
Figure 1. Dynamics of overall Ukraine-EU trade, USD billion
Source: State Fiscal Service of Ukraine.
Agricultural products turnover Ukraine-EU Considering dynamics of the agricultural products’ trade between the EU
and Ukraine, we can see enhancement of economical connections and improving position of Ukrainian goods on the European markets. During the period of 2006-2014 the export of agricultural products from Ukraine to the EU grew 3 times, and import from Europe increased 2 times.
Implementation of the Free Trade Area Agreement creates a number of advantages for the Ukrainian agricultural sector. Among them is the simplifica-tion of food products’ trade, unification of sanitary procedures, strengthening cooperation in veterinary medicine. Perspectives of trade development with the EU increase Ukrainian potential in grain, oil, meat and milk products’ produc-tion. 2014 was the record year for Ukraine, when positive trade balance with the EU comprising USD 2.1 billion.
16
22
28.1
15.4
19
25.6
26
27.2
20.8
7.5
12.1 13
.9
18.1
9.5
13
17.9
17 16.9
17.1
6.1
0
5
10
15
20
25
30
2006 2007 2008 2009 2010 2011 2012 2013 2014 1 half2015
import
export

233
Top five trade partners in the first half of 2015 were: Spain, Italy, the Netherlands, Poland and Portugal – more than 71% of export; and Poland, Ger-many, France, Spain and Italy – 61% of import.
Figure 2. Dynamics of Ukraine-EU trade of agricultural goods, USD billion
Source: State Fiscal Service of Ukraine.
Trade development between Ukraine and the EU Members of the European Union are among the major economic partners
for Ukraine. During 2006-2012 the share of the EU countries in overall Ukraine’s import dropped from 37.1% to 31.3%, it began to grow significantly in 2013 and reached 42.7% in the first half of 2015. At the same time, the Euro-pean countries provide major part of agricultural and food products import of Ukraine, which also showed growth in the last two years. The EU share in Ukraine’s agricultural import was between 38-39% during 2006-2013 years, and grew to 46.3% in the middle of 2015.
After a drop in 2006-2009, Ukrainian export to the EU currently has a growing trend after signing the Association Agreement with the European Un-ion in 2014-2015. At the same time the share of agricultural products stayed at the level of 26-28% since 2012, after peak level of 30-31% in 2006-2008 and a huge drop to 21-23% in 2009-2010. In spite of the growth, overall share of Ukraine in the EU’s turnover remains very small and comprises about 0.5% of export and 1% of the EU’s import.
1290 15
71
2675
1985 23
09 2659 30
82 3321
2621
878
1553 20
76
3507
2250
2124
3402
4991
4756
4730
1679
0
1000
2000
3000
4000
5000
6000
2006 2007 2008 2009 2010 2011 2012 2013 2014 1 half2015
import
export

234
Figure 3. Dynamics of the EU share in Ukrainian import, %
Source: State Fiscal Service of Ukraine.
Figure 4. Dynamics of the EU share in Ukrainian export, %
Source: State Fiscal Service of Ukraine.
Structure of agricultural export from Ukraine to the EU Overall agricultural export to the EU from Ukraine for 6 months of
2015 comprised USD 1679 million. Almost 2/3 of income was made by three types of goods: maize – 37%, sunflower oil – 13%, sunflower oil sub-products (oilcake) – 14%.
38.336.2
39.6 38.4 38.2 39.8 39.1 38.740.8
46.3
37.1
36.2
34.3
31.5
32.8
31.6
31.3 35
.4 39.6 42
.7
0
5
10
15
20
25
30
35
40
45
50
2006 2007 2008 2009 2010 2011 2012 2013 2014 6m 2015
EU part in UA agricultural imports EU part in UA overall imports
30.2 30.5 31.1
2320.8
25.927.4 27.4 27.8
25.231.5
28.2 2724
25.4 26.324.8
26.7
31.6 32.7
0
5
10
15
20
25
30
35
2006 2007 2008 2009 2010 2011 2012 2013 2014 6m 2015EU part in UA agricultural exports EU part in UA overall exports
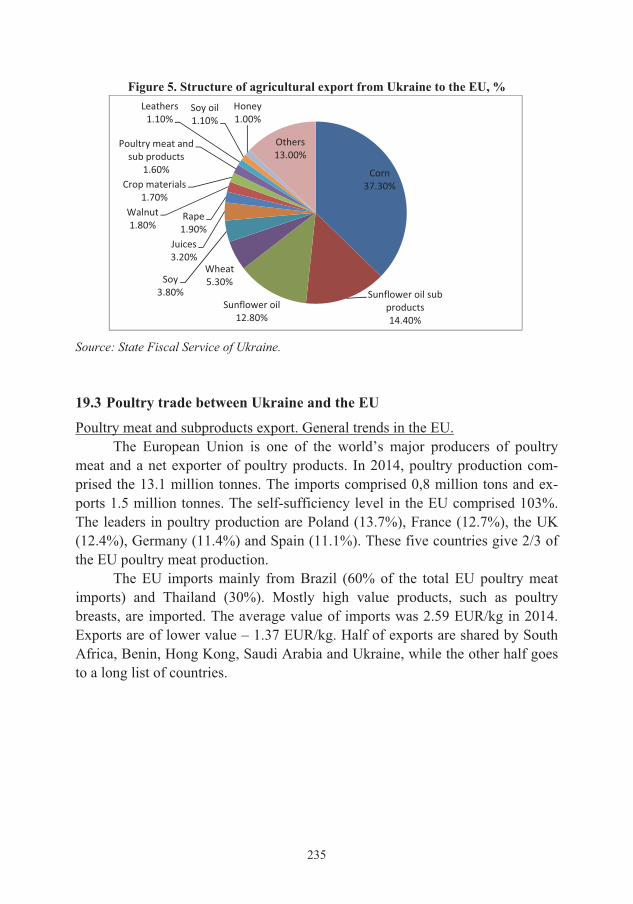
235
Figure 5. Structure of agricultural export from Ukraine to the EU, %
Source: State Fiscal Service of Ukraine.
Poultry trade between Ukraine and the EU 19.3
Poultry meat and subproducts export. General trends in the EU. The European Union is one of the world’s major producers of poultry
meat and a net exporter of poultry products. In 2014, poultry production com-prised the 13.1 million tonnes. The imports comprised 0,8 million tons and ex-ports 1.5 million tonnes. The self-sufficiency level in the EU comprised 103%. The leaders in poultry production are Poland (13.7%), France (12.7%), the UK (12.4%), Germany (11.4%) and Spain (11.1%). These five countries give 2/3 of the EU poultry meat production.
The EU imports mainly from Brazil (60% of the total EU poultry meat imports) and Thailand (30%). Mostly high value products, such as poultry breasts, are imported. The average value of imports was 2.59 EUR/kg in 2014. Exports are of lower value – 1.37 EUR/kg. Half of exports are shared by South Africa, Benin, Hong Kong, Saudi Arabia and Ukraine, while the other half goes to a long list of countries.
Corn37.30%
Sunflower oil sub products14.40%
Sunflower oil12.80%
Wheat5.30%Soy
3.80%
Juices3.20%
Rape1.90%
Walnut1.80%
Crop materials1.70%
Poultry meat and sub products
1.60%
Leathers1.10%
Soy oil1.10%
Honey1.00%
Others13.00%

236
Figure 6. Percentage of estimated poultry slaughter in the EU-28, 2014, million tonnes
Source: European Commission.
Ukraine poultry export structure and destinations There were changes in export geography in 2015, and a drop in turnover
with the Russian Federation. For the first half of 2015, Ukraine exported almost 10% more poultry meat and byproducts, than during the same period of 2014 – 75.8 thousand tonnes, the biggest consumers are Iraq, the Netherlands and Ka-zakhstan. Overall export amount comprises USD 106.4 million.
As USDA expects, despite the challenging economic environment in Ukraine, broiler meat production is expected to expand by 2 per cent to 995,000 tonnes in 2016. The continued expansion of production reflects, in part, the resilience of Ukraine’s large, vertically integrated producers and the support they have received from international financial institutions. Lower re-turns from domestic sales combined with increasing costs for inputs and debt servicing nominated in foreign currencies have a negative impact on industry’s profitability in 2015.
The boost of Ukraine’s broiler meat exports captured the attention of re-gional trading partners. Moldova and Kazakhstan implemented temporary trade restrictions on Ukrainian broiler meat in 2015. Exports to the EU continues within allocated quotas. The EU overtook Iraq as the largest export market by value during the first half of 2015. The EU market is very demanding, and only two Ukrainian poultry producers have been approved to export to EU markets. The Russian market is officially closed to Ukrainian poultry meat exports since the beginning of 2014.
UK 1,64312.00%
PL 1,78314.00%
DE 1,51211.00%
ES 1,46811.00%IT 1,226
9.00%NL 9497.00%
HU 4303.00%
Other 2,49220.00%
FR 1,67813.00%

237
Imports of broiler meat to Ukraine are projected to remain at 60,000 tonnes in 2016. Exports of broiler meat are projected to increase to 190,000 tonnes in 2016. In January 2016, DCFTA trade preferences for Ukrainian poul-try meat entering the EU replaced existing trade preferences the EU has extend-ed to Ukraine on unilateral basis.
Implementing the DCFTA preferences Ukrainian exporters will have ac-cess to a duty-free TRQ of 17,600 tonnes for poultry cuts and offal in 2016. The EU has also unilaterally made available duty free access for whole birds from Ukraine under a 20,000 tonnes TRQ. However, industry sources do not expect the whole bird TRQ to be fully utilized given higher costs associated with pro-cessing in the EU.
Trade between the EU and Ukraine. Export
In 2006-2013 Ukraine exported small amount of poultry and subproducts to the EU. Upon signing Association Agreement with the European Union, local producers received the quota of 16,000 tonnes on import of chilled poultry meat and subproducts and 20,000 tonnes of frozen ones. The import tax varies from 17.9 to 35.8 EUR/100 kg depending on a product type. The tax within the quota is zero. The import quota is to be raised to 20,000 tonnes within 5 years. As the result, in 2014 export increased to almost 17,000 tonnes, and export income comprised USD 52.8 million. Ukraine’s share in the European poultry import reached 9.3%. For the first 6 months of 2015 export grew 3.5 times comparing to the same period of 2014, reaching 11,600 tonnes. More than one third of ex-port is fresh or frozen whole chicken and its parts.
The Netherlands is the main importer of Ukrainian poultry with 71.3% of the Ukrainian export. Average price is 3.24 USD/kg. Also, in the first half of 2015 the Netherlands and Germany purchased about 6,200 and 3,000 tonnes of poultry sub-products, which comprises about 80% of overall Ukrainian export to the EU.
We must mention Mironivsky Hliboproduct (MHP) as the major Ukraine’s poultry producer and exporter. MHP Poultry production volume in 2014 comprised 546,500 tonnes. In 2014 chicken meat export reached 140,920 tonnes, with 15% growth in comparison to the previous year. Since the middle of 2014 until the year end, MHP exported poultry meat to the EU with zero im-port duty, which amounted to over 16,500 tonnes, 12% of total MHP poultry export in 2014. For the first half of 2015 MHP’s export to the EU comprised 11,690 tonnes, that is 230% more than for the same period of 2014. The EU market share is currently 18% in overall MHP export structure.

238
Figure 7. Dynamics of Ukraine’s poultry meat and subproducts trade with EU, tonnes
Source: State Fiscal Service of Ukraine.
Import Ukraine’s poultry import dropped by 30% in 2014 comparing to 2006,
remaining on the level of more than 51,000 tonnes. In the first half of 2015, im-port grew by 26.2% as to previous year and comprised 22.8 thousand tonnest, mostly including frozen chicken subproducts. Since the beginning of 2015, ma-jor s suppliers of chicken parts and subproducts were Poland and Germany (with share of 82.9%). Poland has doubled its share from 24% in 2014 to 58% this year. Ukraine ended 2014 with negative trade balance of USD 4.9 million for poultry category. For the first half of 2015, the balance was positive comprising USD 12 million.
Figure 8. Geographical structure of Ukraine’s poultry meat and subproducts import
from the EU, %
Source: State Fiscal Service of Ukraine.
7401
0
8983
8
6601
9
5541
6 7655
4
5554
6
5152
1
2285
3
3 3 3 5 450
1689
0
1163
1
0
20000
40000
60000
80000
100000
2006 2008 2010 2011 2012 2013 2014 6m2015
Import
Export
Poland 58%
Germany25%
Great Britain6%
Hungary3%
France2%
Others6%

239
Poultry production cost comparison in different countries 19.4
The EU production cost (live weight) An average poultry production cost in the EU varies in the range of 91 to
97 eurocents per kg of live weight. The production costs in Poland are the low-est at 90.2 eurocents per kg of live weight. Italy has the highest production costs with 106.5 eurocents per kg of live weight.
Table 1. Poultry primary production cost in the EU countries, eurocents/kg live weight,
2011 data Specification NL DE FR UK IT ES DK PL HU Total cost 91.2 92.9 94.9 96.9 106.5 95.2 91.4 90.2 91.8Day old chicks 14.4 14.7 16.9 16.6 15.1 12.2 15.7 14.1 13.9Feed 56.4 57.9 57.4 61.9 74.1 67.4 54.1 60.7 57.6Other variable costs
8.6 8.6 8.2 7.4 7.5 5.8 9.3 7.2 8.9
Labour 4.4 4.5 4.9 3.1 2.6 2.9 4.6 1.4 2.3Housing 5.4 5.8 6.5 7.0 6.2 5.9 6.5 5.9 8.0General 1.1 1.1 1.1 1.1 1.0 0.9 1.1 0.8 0.8Manure disposal 0.9 0.4 0.0 0.1 - - 0.0 0.1 0.3
Source: “Competitiveness of the EU poultry meat sector”, LEI Report.
The feed price mostly influences the total production costs. The difference in feed price between the EU countries is a result of differences in structure of the supply chain, farm size, feed mill policy, transport distance to farms and op-timal position with access to sea harbors and water ways for efficient supply of feed ingredient.
Production costs after slaughter
The costs of slaughter are based on the slaughter of broilers in a large commercial slaughter house. The final product is a broiler carcass. The weight of the carcass is 70% of the live weight of the broilers delivered from the farm. The key components in the slaughter costs are labour (30%), building and equipment (30%). The other costs (40%) are: transport of broilers, energy, wa-ter, quality control and offal disposal. These costs vary from country to country. However, because all slaughterhouses in the EU use advanced modern equip-ment, it is assumed that the differences in slaughter costs between the countries are mainly a result of differences in labour costs. The differences in interest rates between countries shall also be taken into account and have an impact on the annual costs of building and equipment.

240
Figure 9. Broiler production cost (farm and slaughter) in the EU, 2013 data, EUR/kg CW
Source: “Competitiveness of the EU egg and poultry meat sector” LEI Report
Production costs in the non-EU countries
The production costs of poultry outside Europe are compared in the fol-lowing countries: the United States of America, Thailand, Brazil, Argentina, Russia and Ukraine. Brazil and the United States are the main exporters to the world market. Brazil and Thailand are the main suppliers of frozen poultry meat to the EU. Argentina is also among the exporters of poultry meat to the EU. The feed price significantly determines the total production costs. The feed price is lower in Argentina, the USA and Brazil than in the EU. The lower feed price in these countries is explained by the domestic availability of sizeable quantities of feed ingredients such as maize and soya bean. European producers partly depend on imports from South America though. Transport and storage costs increase the price of feed ingredients in Europe. The price of day-old chicken is also con-nected to feed price. Also, the final weight of broilers it the USA, Brazil, Argen-tina and Ukraine is higher than it is in the EU. Higher final weight means higher feed conversion.
Comparing the production cost, we find that the cost in the EU is about 47% more than in Argentina and Brazil and 32% more than Ukraine.
140 143 146 150 155 148 143 135 139
33 28 32 28 27 27 3921 21
0
20
40
60
80
100
120
140
160
180
200
NL DE FR UK IT ES DK PL HU
Slaughter
Farm

241
Figure 10. Broiler production cost (farm and slaughter) in the non-EU, 2013 data, EUR/kg CW
Source: “Competitiveness of the EU egg and poultry meat sector” LEI Report.
Time of financial challenges in Ukraine and Ukrainian poultry 19.5competitiveness on the European market
Right now the financial crisis is observed in Ukraine, which caused a drop in local currency from 8.00 UAH/USD in January 2014 to 22.00 USD/EUR in July 2015, with short-time increases up to 27.00 UAH/USD within this period.
Figure 11. USD/UAH exchange rate dynamics since October 2013
Source: National Bank of Ukraine.
Devaluation creates problems for small and medium-sized producers, who only sell their products on domestic market, but have to outsource inputs, such as feed additives, veterinary medicine and equipment from aboard. The price growth of these imported components, together with foreign currency bank loans servicing
144110
129100 100
141114
29
2517
17 18
17
17
020406080
100120140160180200
EUaverage
USA THA BRA ARG RUS UKR
Slaughter
Farm
0
5
10
15
20
25
30
35

242
decreases producer’s profitability and brings losses. International Monetary Fund projects that inflation will slow to 20 percent in 2016 from 46 per cent in 2015 and GDP will grow 2 per cent in 2016 after a nine per cent decline in 2015 offer some cause for optimism that profitability of the poultry sector will improve. Broiler pro-duction is projected to increase to 995,000 tonnes in 2016.
Figure 12. Domestic and Export prices in Ukraine, USD/kg
Source: USDA GAIN Report (State Statists Service based on Ministry of Economic Develop-ment and Trade Surveys; Monthly Average Interbank exchange rates used for 2014 price cal-culations; WTA data is used for declared export price, FAS/Kiev calculations are used to de-fine wholesale margins (vary widely depending on sales channel).
On the other hand, significant devaluation stimulates export activities and gives advantage to local producers, making cheaper domestically produced in-puts, such as electricity, water, bulk feed, labour cost, that make up a large part of the poultry meat self cost. Since the beginning of 2014, the feed cost grew by 120%, hatching egg by 162%, energy cost by 131%, what brings the poultry meat production cost up 45%.
Consumer incomes in Ukraine continue to fall, but domestic poultry con-sumption remained relatively high and grew in 2014. Poultry substitutes more expensive animal protein, such as red meat. Comparing the domestic retail price for poultry, we can see that the average consumer price for chicken grew from 21 UAH/kg in January 2014 to 36 UAH/kg in July 2015. If we divide the price levels by matching exchange rate, we see that the price, nominated in USD dropped by 40% from 2.6 USD/kg at the beginning of 2014 to 1.6 USD/kg in mid-2015. The market is experiencing a real decline in prices. The average pro-ducer’s price for chicken in June 2015 amounted to UAH 27,300 per tonne that is around 1.24 USD/kg.
0
0.5
1
1.5
2
2.5
3
Jan Feb Mar Apr May Jun Jul Aug Sep Oct Nov Dec
Domestic Retail 2014
Domestic Retail 2015
Export price 2014
Export price 2015
Domestic Wholesale* 2015

243
Current dumping legislation There are claims made by the European farmers that low prices for several
agricultural products, including poultry meat offered by Ukrainian exporters, can be considering as dumping. In 1998, Ukrainian parliament approved several laws called Ukrainian Antidumping Law book, which were formed under the influence of international agreements, such as “The partnership and cooperation agreement between EU and Ukraine”, signed in 1994. Currently dumping is de-fined by the law no. 330-14 “Protection of local producer from dumping im-port”. Dumping is importing to the customs territory the goods whose price is lower than the comparable price of the equivalent goods in importing country, which in tun harms the local producer of such goods. Modern antidumping law of WTO members is based on Article 4 of the Agreement on implementation of Article 4 of General Agreement on Tariffs and Trade of 1994.
Ukrainian poultry pricing
Taking into consideration that the production costs in Ukraine are lower than in the EU countries, mainly because of cheaper feed inputs that comprise the majority of production costs and lower labour costs, there is economic justi-fication for the lower producer’s selling price.
Analysing the whole chicken wholesale prices in mid-2015, we compare with the EU average wholesale price of 2.02 USD/kg (4% decrease as to Q1 2015), Brazil wholesale of 1.12 USD/kg (4% decrease as to Q1 2015) and American broiler chicken is 1.82 USD/kg. Prices for chicken on international markets are falling, especially for whole chicken and legs. The market of breast and processed meat is less affected and the weak euro has an upward impact on prices. The weakness of Ukrainian hryvnya is positive for local producers, mak-ing their goods more attractive on foreign markets. The average price in export to the EU is 3.24 USD/kg (that is more than 70% of export of Ukrainian poultry to the Netherlands). We shall also note that Ukraine does not use its quota for frozen poultry. Export mainly consists of processed chilled poultry and offal.
Summary 19.6
The European Union is one of the Ukrainian major trade partners. In 2014 the EU-Ukraine amounted to USD 37.9 billion turnover, which is more than 1/3 of Ukraine’s overall international trade amount. That includes USD 17.1 billion of export and USD 20.8 billion of import from the EU countries.
Considering dynamics of the agricultural products’ trade between the EU and Ukraine we can see enhancement of economic connections and growing po-sitions of Ukrainian goods on European markets. Overall agricultural export to

244
the EU from Ukraine for 6 months of 2015 comprised USD 1,679 million. Al-most 2/3 of income was made by three types of goods: maize, sunflower oil and its subproducts.
Implementation of Deep and Comprehensive Free Trade Area (DCFTA) creates a number of advantages for Ukrainian agricultural sector. Among them is the simplification of food products’ trade, unification of sanitary procedures and strengthening of cooperation in veterinary medicine.
The European market is very important for the Ukrainian producers con-sidaring the perspectives of the implementation of Free Trade Area Agreement gives, and as regards adaptation of the quality standards to European require-ments. The European Union is one of the world’s major producers of poultry meat and a net exporter of poultry products. The EU imports poultry mainly from Brazil and Thailand. Half of the EU exports is shared between five destina-tions: South Africa, Benin, Hong Kong, Saudi Arabia and Ukraine.
Despite the challenging economic environment in Ukraine, broiler meat production is expected to grow to 995,000 tonnes in 2016. Exports of broiler meat are projected to increase to 190,000 tonnes in 2016. Iraq and the EU are expected to remain the major destinations for Ukrainian broiler meat absorbing up to half of all exports.
In 2006-2013, Ukraine exported small amount of poultry and subproducts to the EU. Upon signing Association Agreement with the European Union, local producers received the quota of 16,000 tonnes on import of chilled poultry meat and subproducts and 20,000 tonnes of frozen poultry.
In the first half of 2015, import grew 26.2% as to previous year and com-prised 22.8 thousand tonnes that mostly included frozen chicken subproducts. Since the beginning of 2015 major suppliers of chicken parts and subproducts were Poland and Germany. Comparing the poultry production cost, we find out that the cost in the EU is about 47% higher than in Argentina and Brazil and 32% higher than in Ukraine. The prices of feed and labour strongly influence the total production costs.
Right now the financial crisis is observed in Ukraine, which caused a drop in local currency from 8.00 UAH/USD in January 2014 to 22.00 USD/EUR in July 2015, with short-time increases up to 27.00 UAH/USD within this period. Significant devaluation stimulates export activities and gives advantage to local producers, making cheaper domestically produced inputs, such as electricity, wa-ter, bulk feed, labour cost, that make up a large part of the poultry meet self cost.
Taking into consideration that the production cost in Ukraine is lower than in the EU countries, mainly because of cheaper feed inputs that comprise the majority of self cost and lower labour cost, and the current influence of ex-

245
change rate on production cost of the produced goods, in time of deep devalua-tion of local currency, there are economic justifications for the lower producer’s selling price. In times of financial turbulence in Ukraine and devaluation of local currency there are no reasons to prove the export price of Ukrainian poultry as dumping.
References
1. Association of the poultryman of Ukraine, Ukraine poultry meat market analysis for JAN-AUG 2015.
2. Demchak I., Mitchenok O., Nigaeva O., Agricultural goods trade between Ukraine and EU JAN-JUNE 2015, Research Institute productivity of agro in-dustrial complex.
3. Demchak I., Mitchenok O., Nigaeva O., Ukraine’s agricultural goods for-eign trade JAN-JUL 2015, Research Institute productivity of agro industrial complex.
4. Horne P. van, Competitiveness of the EU egg and poultry meat sector, LEI Wageningen UR Poultry Day at Eurotier, November 2014.
5. Horne P. van Competitiveness of the EU poultry meat sector, LEI Wa-geningen UR, LEI Report 2013-068, December 2013.
6. Martin Upton University of Reading, United Kingdom, Scale and structures of the poultry sector and factors inducing change: intercountry differences and expected trends.
7. National Bank of Ukraine (http://www.bank.gov.ua/). 8. Rabobank “Poultry Quarterly Q2 2015”. 9. State Fiscal Service of Ukraine statistical data (http://sfs.gov.ua/). 10. Steinweg T., Chicken Run The business strategies and impacts of poultry
producer MHP in Ukraine, CEE Bankwatch and NECU, September 2015. 11. Ukraine Government Statistics Service Statistical bulletin Main indicators of
agricultural production in Ukraine in 2014. 12. USDA, Ukraine Poultry and Products Annual, GAIN Report No. UP1530,
31 July 2015. 13. USDA, EU28 poultry sector to grow again in 2013 and 2014, GAIN Report
No. FR9146, 9 September 2013. 14. Yanyshyn Y., Nagornyuk O., Impact Production Costs on Export Capacity
Poultry Industry in Ukraine, Lviv National Agrarian University, Scientific letters of National University “Ostrozka akademiya”, series “Economics”, is-sue 27, 2014.
246
Prof. ������� ��������, dr �������� ��������� {�����|� �����}�~� ������������ � �� � � �����|��
20 � ������� � � �� ���� � ���������� �� ����� ����������� � ��!����� ������ � " !�#����
&��������� '�������
<��=���� 20.1
$ ������±�� � ��� �������� ����!���� �������� �%��! �� �������� �� ����! ³�������� #��� ���. ´� � ��! ����� �'���%�� µ� �� ��� �� 8 %� 9% �������� ���� ������ � �%����.
¶���� �����������!��������� �����*���� ������<� ����%�� ����� 40% �� ��� �� �� ���, ��� ��*�� 9 ��� ��. $ �������! ��������� � �'����� ��*�� 24 % ���������, � � ³��� � �������� ����!���� ������� 8% �� ��±�! *���������� ������� � ³�������� ���������. ·%�����! ��� ³���� �� �����������!�������! � �%��;�� � � �%����� ������� � ��±�� ��¸��� ³���� �� ���������� 16%.
´����� ����������, *�� �� � �����%���� �������� ��%�� �������- ����!�������! � �%��;�� �� %�(� ���������, � ��� �� ��, ��������� �������� �� ��� ����� � �%� �� �� ¹». ¶� 2014 �. � �� ��� �� ��'%��� '����� � �����%��� �� �� 1009 ��, �� ��µ��� – 663, ���±�! – 183, ���� – 113 � ������ – 708 ��.
¼���� �����! ��%��� ������������ � �����%���� �������- ����!�������! � �%��;��, �� �� � � �%���������� ��*�� � 2 ��� � ���(��� ������%���! ��¸��. ½ � ³��� � ����� � �����%���� ������ � 2,1 ��� � ���(��� ���� ����� ��� ������� �� ���, ���� � ��; – � 1,3 ��� ��'%�!, �� ��µ��� – � 1,1 ���. $����� � ���, � ����� � � � �%- ��-�������*������ ��������� � ���� �µ�*����� ������'����� � ����� ����������*������� ���! ���������� �� ������ �� 2014 �. 12,1%, µ ����� � ���% – 63,5, ���±�! � ���*���� ������ – 97,8 %.
¾ ��� ����, (� ���! ���� ������ ����������! � �%��;��, � �������� ;��� %�� � ��� ��������� � ����*���� %���%���, ���- ����������� � �����%��� %���������� � ����*���� �%�����< ������� ���� ������ � �%�������������� ����, ����(���< ��*����� �;���� �������, ���� ��� ������� � �%����� ������! ��±���! ;�������.
$ ³��! ����� � ����*���� �� ���� �������� � �%����� ������� ��� ������� � ����'��� � ��%�;������ �� ���. ¶� 2014 �. ��� �������

247
�� %�(� ��������� ���� � ����� �%����� ��������� 88 ��, ������ � ������� �%����� – 253, ��� � ���� �%����� – 15,6, ���� � – 42,3, ������ �%����� – 85, �� ��µ��� � �� ��µ���� �%����� – 177, ���±�! � ���*���� – 145, µ ����� � ���% – 76 ��.
> ���?���� � ������ ���@��# � �� ��� 20.2
½� � ������< � 2004 �. ��¸�� � �����%���� � �%��;�� � �����������!�������� � ������;��� �����*���� � 1,8 ���. �������� ³���� �� �����������!��������� �� �� � � �%���������� �� �����%��� %����� ��� �����*����� � 4 ���. #���� ����, � �����%��� ��%� �� � ���� � �%������������� ���� �� � �� ��� ����%������� ����'�������� ����%� ���(���� ������ �������, ������ � 2014 �. ��� ��������� 775 ��� %��- �� �� ¿´.
¹������� � ������ ���� �� ��� �����������!�������! � �%��;�� � � �%����� ������� ����<��� "�����, ¾��������, =����, ½���(�, ´�� ��!%'��, »� �����, =�����, /� ���������.
"����!���� À�%� �;��, �� � �'����, �������� ������! �%�����! ��� � ��±�� ��¸��� ³���� �� �����������!�������! � �%��;�� � � �- %����� ������� (����� 90 %).
#��� ������ � �%���� �������� �� � �%����� �� ��� �� ������ �����%� � ����*��! �� ����, ���� �� ��������� ��� ����������� � �%- ��*����� �� �*�� ������� �������� ��*����. ¶� ����� ��������������� � �%��;�� ���� �� � ��� ³���� �� ����*��! � �%��;�� � ���� ������ �� �'����. /��, � ���� �-��� 2015 �. � ������;���� "��������� #��� ��� �� ³���� � ���������� 26,2 ���. ���� ����� '��������, ��� 128,8 % � ���- ����*���� �� ��%� 2014 �., �� �� – 46,7 ���. ����, ��� 116,6 %, ��� ��� – 16 ���. ����, ��� 105,6 %, ������ ����'� ������ ������ – 44,7 ���. ����, ��� 141,8 %.
¾�� ���%���������<� %����� À´), �� ���� ����� ��<*���� ³���� ���� ����;��� #��� ��� ���%�� � /)½-20 �� �� - ³���� �� �� � �%����������, � �� ���� �������� ����;��� � �� ��< %������. /��, �� ��¸���� ³���� �� ���±������ ������ ��(� �� ��� �������� 4 ����� � /)½-20, �� �� %��< � ���%���� 9 � �;����� �������� ³���� � �%����, ����������� �� ���' ��������� �� �����-³���� �� ���. ½� ��¸���� �������� ������ ����'� ������ ������ #��� ��� �������� 9 ����� � /)½-20 ��%�±�� ³���� �� �� �� �. ½ � ³��� ³���� � ³��! � �%��;�� ���������� 4 � �;���� �� ����� ��¸��� ³���� ���� � �%�' %��%;��� ��%�±�� �� ���� ³���� �� ��.

248
������� ��*���� Â� ���!���! ¾������� – � /)½-10 �� 2014 �. ��%�±�� �� ���� ³���� �� �� ������� �%����� � �������� ����� #��� ��� �������� 4-< ����;�<, �� ����� �� �� � ����� ����'� ����� ������� – 5 �����.
¹� �%� � ³��� #��� ��� ������ ������ 3-< ����;�< � �!����� ³���� �� �� ����! ���� ���� ����*��!. ½�%��� '%�<� ³�� %����� � Ã�'%��� �%��� ����*��� µ�%� �;�� (IDF).
Q�����X���� ��!����� 20.3
)%���� � ;���� ������ ³µµ���������� � �����%���� � ������;�� �� �� �%������������� ���� �� �� �%��� � �� � ��! ³�������� �% � �����, ��� �!(��� �� ���� �� ����<���: � ��� ����� �<±�!�� %�µ�;�� � �������� �����%�����! �����������
������;�����-�������;������ ��� ���, ������%���� %�� ���- �� �������� ���������� �� ��*�������� ����! ������ � � %��'��� ��¸��� �������� � ��� ����� µ��%��, ����%����� *��� ����<%����� �� �������-���������*����� ���������� �� �� ����� � ����;
� ���������� ��� ������� � �%��� ���! ��%��'������� � ��%��'������� �� � �%���� � ��!��� �����������!�������� � ������;�!, ������- �����<±�� ��±��������� �%� �'���� � �%��;�� ���������%���� � '��������%����, *�� ��� ����� �� �;������� ����������� �� ���- �� ��������������� ���*��������� ���� �� �����%�����! �� �� ���� �� �� �%������������� ����;
� �����! � ����� �� ������! ����� �����������!�������� ���������, �� �������<±�! ��%�!�������� � �� � ��! ³�������� ��%��'�±�! ������;�����! �������� � ������*��� ��� ������� �����������!- �������� ��% ��, �������� ����%�� ���;��������, � �������� ����!����;
� ��%������ ����� ��;�������� ������� �������� �� ��� �! � ����- ����������� ��� ��� �±���� �������! �������*����! ����, *�� � ���< �*� �%�, �������� ��� �� �±�<±�!�� ����� �� ���� � �%����������� ���������, *�� � ����*��� ����� � ���%�� �� ��� ����(��� ���%(���< � �������! ��������� ��;������-%���� �µ�*����! �����;��.
¼���'����� ��(� �������������� %���<� �������� ����!���� ���� � ������������� %�� ���(��� ������� ��, � ��� *���� ����� �����, *�� ��(� �±� ����� ����� ��� � ������ %�µ�;��� ������;�����-�������;������ ��� ���, ������%���� %�� ������� �� � ��! �� ����. Ä�� '� �������������� �� ����� �%� '���<� � ������� � �� � ��! ³�������� ������ � � �%���� �������, ���� �!, ��%� �� �� ���'����

249
�����, ��'�� � %��'�� ��� ��� ��������'��< ��� � ������*���� %�����!(��� � �� ���� ���*���������� ��������� ����!����.
��%��� ����� ��%*� �����, *�� ���(��³������*����� ������� ������� ��;���������� �� �� ���(������� ��������� � ���� ���! �� �������� ��%�� ����%������� ��% ���%�!������ � �%��'�<±����� ����������� � �%�������������� � �����, �� �'%������ ��� �'�<±�� ����� *���������� ��������� ������� (� � � � ������� � �����*����� ��¸���� �� ����� � �����%���� � �%����������, ���������� ���- �±����� ��¸���� � ���%(����� ��*����� � �����%�������� ��� ��� ������������� � �����'%����, ������������ � �� � ��� ����� � �� ����� ����!����. �*���� ³���� ���%��� �'�%��� � � ������ ����� �� ��%� %�����!(��� �����*���� %�µ�;��� � �%������������� ���� �� � ���- ������� ���(����, �, ���%���������, ����!*����� �����*���� �� ��� �� ��� �� �� ���� �� �� �%������������� ���� � ���� �� ���� ;�� �� �������� ��%� � �%����������. Ä�� ���%��� ������ �����< �� �������� %�� %�����!(��� �����%����������� �� �±������ ��¸���� � �����%���� � ³���� �� ���� ��'��!(�� �� �� �%������������� ���� �� ���*������- ���� �� � ���� ���¸������ ����!���������.
"������ ����� ���� ����� �����! �� ��� ���%��� �'�%��� � �� � �%�;������ %�� ���� ������ ���� �� �����%�����! ����!���� ����, �� ���� �! � ���%���� ����� 90 % ����� ³���� �� �����������!�������� � � �%������������� ���� �� "��������� #��� ���. )�� ��%�� ���������� ��� ������;��! "����!���! À�%� �;��! ����*����� ������ �� ���*��������� �����*���< ��¸���� ������������ � �����%���� � �%����� ���������%���� � '��������%����, �� ���� �� ���;������ �<��� ���� ������ ³���� ��� ����� ������� �����������!�������� � �����- �;�� � �� � �������<±�� � �%� �����, ��� � � �%����������� �� �- ��'��� �� �� �%������������� ��;��������� ��������� � � �����;��- ������� �� �� �;��� ��� ����� �����%���� %������ �� ���� ����! ����!���! ���� � ������������ � ��������������� � ����� �� �����- ������ "����!���! À�%� �;�� �� $���� ��< �� ����< � ������;�<.
�±��������! ����*���� �� �(���� ��� ����, ��������� � %���- ��!(�� �������� ��;���������� ´½¾, ��%�� �����%����� ���'� ������%������ ���������� ����*���� �%� ������������, � ������ �� ���� ���� ������ ½ ������������, � ����� �� ����������� "��������� #��� ��� � ��'����%� �������� ��<�� � ��¸�%������ (¹», ´Ä, ÂĽ, �<���� ����%� ����), � ���'� � ���������� ���� ����� � ���������� �� $���� ��< �� ����< � ������;�<. Ä��, � *��������, ��±�������� ��'��� ������� �����'����� ½ ����������� �� �������< ��%%� '�� �������-

250
����!�������� � ������;��� � % ���� �*�������� �� �� ���(������� ���������, � �*�� � *���� ��� �� � ����, ��� � ��� ������!, �� ���� �� ��� �� ��� ��������� ���< ��%%� '�� � ������;��� ´½¾.
$ ³��! ����� �������� ������ ��'��� � ���������� ��¸������� �� �%����� � �%����±�� � �;���� � ��� �������� � ´½¾, � ���'� �� �%��� ��±�����<±�� �� ���, ��������� � %�����!(�� �������� ��������� ����!���� � �������� �� ��� �!, *�� �������� �� ������� �%�������< ����%� �������< �������� ��%%� '�� �� � ���� ����� � ³��������.
Q�� ����� !�=�X��� ��� �� ��@���� � � ������� 20.4
½�³���� � ������±�� � ��� Ã������ ����� ��������� ����!���� � � �%���������� "��������� #��� ��� ��������� � ¹�;��������! ���- %����! ���� #��� ���, � � *��������, ¼��������� ��������� �����%�����! � ´½¾ ¹´¹ #��� ��� �� ������ � ���� ����! »���%� �������! � �� ���� «"������� �� � ���� ������� #��� ��� �� 2016 – 2020 ��%�» (%���� – »���%� �������� � �� ����), ������! �� �- ����*����! ;���< ���� �! �������� – ����(���� � �����%���������� � �%� � ����� ��������������� � �%��;�� �� �� ���� �� �� �%�����- �������� ����, ����±���� ���� ������ ���� ���*��������! �������- ����!�������! � �%��;��! � ��¸��� � ��*�����, ������%���� %�� ���- ��;������ ������� ���������.
&�� %����'���� �����������! ;��� � �%����� ������� �(���� ���%�<±�� �������� ��%�*: � %����'���� ��¸���� � �� ���� � � �����%����, �������<±��
�������� ����� �� �� � � �%��'���� �� ��'��!(�� ��%�� � �%��;�� � ������������ � �;���������� �� ���� ��� �������;
� ����(���� %��� �������� �%��;��, � �����%���! �� ������;������ �����������, � ������*���� �� ³��! ������ ��±���������� ���'���� �� ��� ��������� � ���� � �����%���������� � �%�;
� %�����!(�� ������� ����� �;�� � % ���� µ� � ����� �;�� ��� ��'���� µ���� � ���� %���%����� �����������!�������� ���� �� �- ����%�����! � ������*���� �� %������ �� �� �� �%������������! ����;
� ��� ������ � ���� �����%���� ������������ � �����������!�������� � �����%���� ��������� � % ���� � � �%��� ��� ���;
� � �����%���� � ��� ������� ³������*���� ���������� � ��*��������� ���� ������ ��±���� � �%�����;

251
� µ� �� ������ %�!��������� ������;������� ���������, ����'%�- <±��� �����������!�������� � �����%�����! � ³µµ�������! %������- �����.
��%��� ��%*� �����, *�� ���� �� ��������� »���%� �������� � �� ���� ���<*��� �±� � %������������ 12 ��������������� ����� ��%� �� ��� ���: � "������� ��%�� ���� ���������%����, �� � ������ � ������;�� � �-
%��;�� ���������%����; � "������� �����;�� � ��������%����; � "������� ��%�� ���� '��������%����, �� � ������ � ������;�� � �-
%��;�� '��������%����; � "������� ���������� %��� � '��������%���; � "������� �������!�������! %�����������; � /����*����� �� �����±���� � ��µ� ������;�� ´½¾; � �� ������ � ������������� ����� � ������� ������; � ¼�'��� ��� � ���������%����� �� �� �����; � "������� � ��%%� '�� ����� µ� � ����!���������; � � ���� ��� � ��� �������� � ´½¾; � "������� ���� ��! � ���(��������; � ��%���� � ������� � �����%��� �� �� � ������ ������� ��%�� �� ��
� ����%�� ��±���! � ���(��������. ¹�����%��� ��������, *�� � � ³��� ��'%�� �� ��%� �� ��� �����
���! ����� �, ���<*�<±�! ;��� � ��%�*�, ;������ ��%����� � � ������- ����, � ��� ������;��, ��¸��� �<%'����� �����������!, �'�%����� ��������� ������;�� ��! ��� ���! ��%� �� ����. ¾ ��� ����, � ��'%�� ����� �� ��<*���� ��%���� (�� �%� � % �����) �������� �� �*��� �������� �� �� ����!, �������<±�! ��'%�! ��%� �� ���� ��!�� �� �����������<±�� ������������� � �������� �� ���� � �������.
&�� �;���� ��±�� ���������� ������;�� »���%� �������! � �� ���� ����������� ���%�<±�� ;������ ��%����� �: � ��%���� � �����%���� � �%��;�� ��������� ����!���� � ;����, �����-
����%����, '��������%����, ��±���� � �%����� (� ������������ ;����);
� �� �*�� �� ������;�� � �%��;�� (���� ��, ����, �����) �� �%���� � �%�������*���� �������� � �������� ����!����;
� ������������� � �%�' � �������� ����!����; � � �%�������*��� *���������� ��������� � �������� ����!����;

252
� ��%��� � �����%���������� � �%� �� ������! %���������! ��������� � �������� ����!���� � � �%�%�±��� ��%�;
� ³���� � �����������!�������! � �%��;�� � � �%����� �������. $ �� '� � ��� %����'���� ������������ � »���%� �������! � ��-
���� ;���! ��'�� ���� ����'���� ����*���� �%� ������, *�� ������������� ������%������ �� � ������ ������ � ����� �������� � ������ �� , ��� �������� �� ��������;�< ��� � �%��� �±���� �����'��� ���������� �����%����! �� ������;�� ������� �����;�!.
¾ �������� �����, ���� �� ����� ���������� � � ������;�� »���%� �������! � �� ����, ���������:
� � �%��-�������*�����, ������������� �������*����! � � �%�! ������������ � �������� ����!���� ��� ��� � ������'����� "��- ������� #��� ��� � ���� ����������� �����%����, *�� �������� � ������ � ��� �±���< ��¸���� � �����%���� � �%��;��, ���'���< ³µµ��- �������� ����!���������, ���� ���� �� �����������!��������� �� �� � � �%����������;
�� ����-³������*�����, � ���� �� ��������� ;������ ��������� �� ���� ����� �� �� �%������������� ����, �� ���� ��� ��������� ��� ����������� � �%��*����!, �� ���*������� ������� ����� � �%��;��, *�� ��%�� � ���'���< µ��������! ����!*������ � �%� ����!;
��� �³������*�����, ��������� � ����� ;�� �� ³�� ���������� � % �-��� – ���� ������-�����*����� � �%����, ��� �������� � �� �� �- ��(������ ���������, ���������� � ���� ��µ��;�� ������������ �� �'�%����� ���*���!, ���<���� �� ���, ���� �� � �� ���� � ����%� �������! ��%%� '�� ����������� �� �����%�����!, *�� ��'�� ����� � �*���! ���'���� �����'�����! � �%� ����! � ������;�� ������;������ � ������, ��%� ����;�� � �����%���� �� ��*�������� ����! �������-���������*����! ������ �, ��� �����, ����%����� ������ ³������*������ ����;
���(���� �����, � �����<±���� � �������� ������ ��������� ��- �¸<���� � �� ����� �� �� �%�������������� ���� (����� ���� ����� ��;��, ;������ ���������) � ��������� ��� �%���� %����'���� ����*����� ����������! �� ³���� �� �����������!�������� � � �- %������������� ���� ��, � ���'� ��������� � �����'��� ���������� �� ����-������*������ �'��� � ����'����! �������� "��������� #��� ��� � ����� � *�������� � ´Ä, ����������� � $/);
��;������� ����, ������������� ���'����� � ���� %���%�� ���������, ��������� ��;������! ��� ��������������� �������! ���������, �����*����� �� ��� ��'%� � ������ '���� � �� �%� � �� ����.

253
·� ������� ���������� ������, ���<±�� ����! ;���< �� ����- ����;�<, � �%��� �±���� ���� ����������� �����'��� �����(���� �� ���������� �����%����!, � � ������;�� »���%� �������! � �� ���� ��%�� ���±���������� ��� �%�����: � �� �����*������ ����� ������ � ����� ��%������ �� ����!; � ������ ���� �� �� ������< �� �� ���(������� ��������� � ����-
��*���< � �%������������! ������������; � ���� (����������� ������� �����������!��������� �� ��������; � %��� ��µ���;�� ��%�� %�����������, ��� ����!���������, �������
�������� � �����, ��� ������! ������� ������; � �� ������ ���� ����� �(���! � ������%�;�! � �µ� � �� �������
�� �� ���(������ ����������. $ ³��! ����� ������ �������� %��'�� �%������� �� ������ ����-
���� � �� ������, ��� �������� �� ������*���� ����!*����� ������� �� � ��! �µ� �. �*���� ���������� � �������� � �� ������ »���%� �������! � �� ���� ���������: � ������*���� � �%������������! ������������ "��������� #��� ��� ��
2016–2020 ��.; � ��%� ����;�� �� �� ���(������� ��������� � ����� ��±�����-
%� �������! ��%� ����;�� ³��������; � ������� ���� ������±�<±�� ��%�� ����! ��������� ����!����,
���<*�� ���±���%���� � ���%���%����; � ³������*����� ������������ �����������!�������! � �%��;�� � � �%�-
���������; � �� �±������ ³���� �� �����������!�������! � �%��;�� � � �%�����
������� �� �� � ����±���� ��� ���� ������ ����; � ��������;�� �������*����� ��%� '�� � ��������;�� % ���� µ���� ��,
�� �%���<±�� ����� ��������������� � �%��;�� � �*���� �;- ���������� ����±���� � ���;������;�� �����������!��������� � �����%����.
� � �µ� � � �����%���� – �������%���� (� �����%���� ������ � ����) ��� ��������� ���<±�� ��%�� ����, ��������<±�� 4 ���� ���;������;��:
- ���� ����*��-������� �������%���� � �������%���� (����- (������ ����!��� Ã���������! �������, *����*�� Ã�����!, » �%������! � # ������! �������!);
- ����-����*��-��������*��� ���� (�� ����� ���� ���� ��� ����- %�� � � ������;��� � ���;��� �;��! ������� �� ����� 300-350 ��;
- ���� ���� – ����*���� �������%����;

254
- ����*��-���±�-�� ��µ������ ���� (���� ��� �� ��µ�����%���� ;������� ���� �������� ����� � ����� �� �%�� � � ���(������ ;��� ��, � � ������;��� � ���;��� �;��! ������� �� ����� 100-150 ��).
� � ³������*����! �µ� � – ����(���� %���%�� �����������!�������� ���� �� �����%�����!;
� � ��;������! �µ� � – ����!*���� ������� �������� �� ��� �! � ��- *����� ��� �������� ������� ��� ������ � �%���� ��� ���, ���%���� ������! %�� ������*���� ³������*����! � µ���*����! %���������� ������� �� ������ �;��������� �� � ��� ������� ��±���� � �- %����� %�� �������� ����� ���������;
� � �µ� � ������� � �����%��������� �����;���� – ����� �;�� ������ �����������!��������� �����*����, ���%���� � ��� �� �������������! ��(�� � % ���� ������ �! �����������!�������� ���%�!;
� � �������;��������! �µ� � – ������� ����� �;������ �����! � �� �- � ���(������ ���������;
� � ���*��! � ��% ���! �µ� �� – ������*���� µ� �� ������ ����- ��;������� �� �� ���(������� ���������.
Ç�� �������� µ������ ������ ����%�� �� ���������� �� �� ����! ��%� �� ��� »���%� �������! � �� ����, �� ��� %��'�� ���- ��� ������� �'���%�� ½ ������������ "��������� #��� ��� � �������� ������� %�������� � � µ� �� ������ ��������������� � ������� �<%'���� �� �*� �%��! µ��������! ��% � �*���� ��%����� ��������� ;�� � �� �µ��. )�¸��� µ������ ������ ����� �� ���� ������� � � ���*����� ����������! ��������������� � ������� �<%'���� � ����- ��������� ������%���������� �� �%��.
½ � ��%�*� �������� � �%���� �� ������;�< �� �� ����! ��%� �� ��� »���%� �������! � �� ���� ���±���������� ��������;�� ���� � ������ � ���� � 100 % ������ �µ������ ������ ¹�;���������� �����, %�!����<±�! (� �*���� �� ���������) � �����������<±�� �� ��%� ��*������� � �;�����, � ����� ����! ���<��, – � ���� � 100 % ������ �� � �%���.
[��=��\�� � ������ ��!��� ���, ��!]�� � ��� =� 20.5
¹�����%��� ��������, *�� %������� ������� �� �� ���(������� ��������� %� 2020 �. ��%�� µ� �� ������� ��% ���%�!������ ���%�<±�� �������� ���%��;�!:

255
� �����*���� �������;�! �� ����(���� � �%���������� �����- � ������� �����������!�������� ������, ������� ������ ���*(���� ������������� ������ �����������!��������� �����*����;
� ���%���� ������! %�� �� �±������ ��¸���� � �����%���� � �%��;�� '��������%����, ������*���<±�� �� � �������<±�< � ���(- �������� ��*��������� �� ��� %�� ������� ����� ������������! ����*��! � �����! � �%��;��;
� ����(���� ��*����� ������������ � �����'������ ���*��������! �����������!�������! �������, ���� (����������� ������� �������, ������� ��� �*���� ���� �����������!�������! ������� � ��� �- %������;
� ³��������;�� � ���������;�� �� �� ���(������� � �����%���� �� ������ ���%���� ������� �*��� %�� �%� ������� �����������!�������� ������ � �� ������ �� �� � �%��� �±���< %�� �%�;�� � ����- ���������< ������, µ� �� ������ ������! � � ������;�� ������� � ����*����! �����������!�������! � �%��;��.
½ ����� ������;�� »���%� �������! � �� ���� ������������ �� %����'���� ���*���! �� �������� ��%����� �� (����������!) � 2015 �.: � ��%��� � �����%���� � �%��;�� ��������� ����!���� � ����!����� ����
������ �! � 2020 �. - 112,3 %, � ��� *���� � �%��;�� ���������%���� – 104,3 %, � �%��;�� '��������%���� – 118,9 %;
� ��%��� � �����%���� ��±���� � �%�����, ���<*�� ������� � 2020 �. – 117,6 %;
� �� �*�� �� ������;�� � �%��;�� (���� ��, ����, �����) �� �%���� � �%�������*���� �������� � �������� ����!���� � 2020 �. – 189,6 %;
� ������������� � �%�' �����������!�������� � ������;�! (� �*���� �����%�!) � 2020 �. – 10 %;
� ��%��� � �����%���������� � �%� �� ������! %���������! ��������� � �������� ����!���� � 2020 �. – 118,1 %.
� Ä���� ���� �������� �����������!�������! � �%��;�� � � �%����� ������� � 2020 �. ��%�� %���%��� %� 7 �� %. %���� �� ¿´.
$ ���������%���� � �%����� �����*��� ��¸��� �������- ����!�������! � �%��;��, � �����%���! �� ������;������ ����������� � ������*��� �� ³��! ������ ��±��������� ���'���� �� ��� ���������, ���±������� ���� (����������� �� ���� � �������� ���±�%�! � ������� ���*�� ������������ ������� ���� � �����������!�������� � ��- ����;���.
$ '��������%���� �(���� ��%�*� �� �±������ ��¸���� � �- ����%���� � �%��;�� ��%�� ���� ������� �� �����*���� � ��� ������

256
������*������ �����;���� ���� ��%�� �����������!�������� '�������, ���� (����������� ���� ���������� '��������%����.
/���� �� ����, � ������ ����� ��¸��� � �����%���� � �%��;�� ��������� ����!���� �������� ������*��� ��;��������< � �%�����- �������< ������������ "��������� #��� ��� � �%��� ������� �� �- ±������� ³���� ����� �����;����.
^���������
1. »������, $.». ´½¾ #��� ���: ����!(�� ������ ����������! � ��'%��� �%��! ����� �;�� / ¹����� �� � ��;��������� ��� ��� ����±��� � %����� �*���� ������� ´½¾ (���� ���� X Ã�'- %��� �%��! ���*��-� ����*����! ���µ� ��;��, 4-5 ������ � 2014 �.) / ��% �%. $.». »�������. – Ã����: ¼������� ��������� �����%�����! � ´½¾ ¹´¹ #��� ���, 2015. – . 5-11.
2. »���%� �������� � �� ���� ����!*����� ������� ���� �� 2011-2015 ��%�, ���� '%����� ·����� ½ ���%���� "��������� #��� ��� È 342 �� 01.08.2011 �., ¹�;. ���� � ������ ����� "��������� #��� ��� �� 3 ������� 2011 �. È 1/12739.
257
Prof. dr hab Andrzej Kowalski, dr Marek Wigier, dr Barbara Wieliczko Instytut Ekonomiki Rolnictwa i Gospodarki �ywno�ciowej – PIB, Warszawa
21 Podsumowanie
„Ekonomia versus �rodowisko – konkurencyjno�� czy komplementar-no��?” to trudne pytanie wymagaj�ce uwzgl�dnienia wielu ró�nych aspektów, nawet wtedy, gdy ograniczymy poszukiwania odpowiedzi do problematyki rol-nictwa, wsi i gospodarki �ywno�ciowej. Rozwój gospodarczy staje si� coraz wi�kszym wyzwaniem w zwi�zku z wyczerpywaniem si� zasobów naturalnych. Jednocze�nie coraz cz��ciej pojawia si� pytanie, czy rozwój gospodarczy powi-nien by� kluczowym celem pastw i spo�eczestw.
Wa�n� cz��ci� wspó�czesnych prognoz jest ocena mo�liwo�ci produkcji �ywno�ci i jej wp�ywu na �rodowisko naturalne. Zmiany lokalnych ekosyste-mów poprzez wylesianie, nadmierne wykorzystywanie gruntów ornych, pa-stwisk, lasów i oceanów, prowadz� do utraty gleb, zmiany rozk�adów opadów atmosferycznych, emisji gazów. 80 proc. suchych �rodowisk na ziemi uleg�o degradacji. Wobec tych faktów trzeba zada� sobie pytanie: czy natura jest w stanie regenerowa� straty w ekosystemie?
W odpowiedzi mo�na przytoczy� dwie znacz�ce opinie. Jak napisa� James Lovelock („Gaja. Nowe spojrzenie na �ycie na ziemi”): „globalny ekosystem jest dla ca�ego �wiata �ywego dobr� matk�, Gaj�, samoreguluj�c� za pomoc� ujemnych sprz��e zwrotnych”. Natomiast patrz�c z innego punktu widzenia, trzeba zwróci� uwag�, �e „ewolucja spowodowa�a seri� tragicznych dla �ycia w skutkach katastrof i b�dzie to robi� w przysz�o�ci”. (Peter Ward, „Hipoteza Medei. Czy �ycie na ziemi zmierza do unicestwienia?”). Równie� raporty Klubu Rzymskiego z lat 60. i 70. ubieg�ego wieku, powsta�e w okresie spowolnienia gospodarczego, doprowadzi�y do przewarto�ciowania wielu ówczesnych poj�� i teorii na temat granic wzrostu. Chocia� fakty nie potwierdzi�y wielu pesymi-stycznych prognoz, to nie znaczy, �e mo�na je pomija� w debatach o przysz�o-�ci. Wspó�cze�nie aktualno�� tego problemu znalaz�a równie� odzwierciedlenie w konkluzjach �wiatowej konferencji ONZ w grudniu 2015 r. w Pary�u.
Dzi�, tj. w 2016 roku, mo�na z du�ym prawdopodobiestwem prognozo-wa�, �e w przysz�o�ci w skali �wiata nast�powa� b�dzie wzrost gospodarczy, a czynnikami decyduj�cymi o tym b�d�: wzrost liczby ludno�ci, zagospodaro-wanie nowych terenów i zasobów, wykorzystanie wi�kszych ilo�ci energii, spe-cjalizacja i wprowadzenie nowych technologii. Rolnictwo i produkcja �ywno�ci s� wspó�odpowiedzialne za cz��� strat w zasobach przyrody. Dlatego w progra-

258
mach wzrostu produkcji nale�y poszukiwa� i znale@� metody i technologie, któ-re nie b�d� przyczynia� si� do niszczenia �rodowiska, uwolni� producentów od „przymusu intensyfikacji” oznaczaj�cej dotychczas wzrost zu�ycia nawozów mineralnych i pestycydów oraz degradacj� gleb. Rolnictwo musi si� rozwija� i zwi�ksza� produkcj�, stosuj�c metody przyjazne naturze. Czy jest to mo�liwe? Odpowiedzi� na to jest zmiana orientacji Wspólnej Polityki Rolnej Unii Euro-pejskiej oraz realizowane ju� programy w niektórych krajach. Przypomnijmy, �e WPR k�adzie szczególny nacisk na ograniczanie ryzyka degradacji �rodowiska. Przyj�ta w niej strategia rolno�rodowiskowa jest ukierunkowana g�ównie na zwi�kszanie równowagi w agroekosystemach. W programie tym zawarte s� wymagania �rodowiskowe ustalone w zasadach wzajemnej zgodno�ci (cross- -compliance) w po��czeniu z p�atno�ci� powierzchniow� i wspieraniem docho-dów rolników w programach rozwoju obszarów wiejskich.
Jak wa�ne dla przysz�o�ci rolnictwa s� kwestie �rodowiskowe, pokazuj� badania dotycz�ce wyst�powania susz w Polsce. Okresy suszy wyst�puj� coraz cz��ciej, co wynika ze wzrostu temperatury i przed�u�ania si� okresu penetracji powierzchni ziemi przez promienie s�oneczne. Jak pokazuj� porównania gospo-darstw na terenach bardziej i mniej dotkni�tych suszami, wyst�powanie susz przek�ada si� na ni�szy poziom dochodów uzyskiwanych w dzia�alno�ci rolniczej. Warto przy tym zaznaczy�, i� gospodarstwa na obszarach o wi�kszej cz�stotliwo-�ci susz prowadzi�y dzia�alno�� rolnicz�, która nie powinna by� tak bardzo uza-le�niona od wyst�powania niedoborów wody. Jednak�e brak materii organicznej z produkcji zwierz�cej, która pozwala lepiej zarz�dza� zasobami wody.
Rozwój rolnictwa i gospodarki �ywno�ciowej podlega szczególnym i spe-cyficznym ograniczeniom, gdy� jest on szczególnie uzale�niony od kondycji przyrody i jej zdolno�ci produkcyjnych. W zwi�zku z tym nale�y okre�li� i sto-sowa� takie metody produkcji rolnej i technologii produkcji �ywno�ci, które po-zwol� na trwa�e zachowanie zdolno�ci produkcyjnych ekosystemów rolniczych. Jest to szczególne wyzwanie dla twórców polityki rolnej i �rodowiskowej, któ-rzy musz� wyznaczy� mechanizmy kszta�towania relacji mi�dzy dzia�alno�ci� gospodarcz� a �rodowiskiem naturalnym. Punktem wyj�cia do takich rozwa�a jest dobrobyt spo�eczny, który uzale�niony jest nie tylko od aspektów ekono-micznych. Jednocze�nie jednak konieczne jest równie� dostrze�enie problemu wolno�ci wyboru i zrównowa�onego rozwoju.
W przypadku rolnictwa pojawia si� problem wyboru mi�dzy indywidual-nym zyskiem ekonomicznym a spo�ecznymi potrzebami dotycz�cymi zapew-nienia ludziom takich dóbr publicznych, jak czysta woda i powietrze. Oznacza to konieczno�� wypracowania rozwi�za pozwalaj�cych zrównowa�y� interes

259
indywidualny ze spo�ecznym. Rozwi�zaniem jest zapewnienie wynagrodzenia tych us�ug ekosystemów rolniczych, które nie s� wyceniane przez rynek.
Jak pokazuj� przedstawione w monografii badania, cele �rodowiskowe i ekonomiczne w gospodarstwie rolnym mog� by� zarówno konkurencyjne, jak i komplementarne wzgl�dem siebie, a faktyczna realizacja poszczególnych ce-lów jest wypadkow� ró�nych si� oddzia�uj�cych na dane gospodarstwo. Chodzi zarówno o uwarunkowania wewn�trzne dotycz�ce samego gospodarstwa rolne-go, jego zasobów rzeczowych, lokalizacji i kapita�u ludzkiego, jak i czynników zewn�trznych, w tym oczekiwa rynku oraz polityki rolnej.
Polityka rolna ma szczególn� rol� do odegrania w godzeniu celów eko-nomicznych i �rodowiskowych. Jak pokazuj� badania dotycz�ce funkcjonowa-nia systemu p�atno�ci bezpo�rednich na Litwie, ten instrument Wspólnej Polity-ki Rolnej oddzia�uje na wiele celów �rodowiskowych, a w tym na utrzymanie standardów �rodowiskowych, dobrostan zwierz�t i bezpieczestwo �ywno�ci. Jednocze�nie ten instrument unijnej polityki rolnej wp�ywa na realizacj� celów ekonomicznych, a w tym na stabilizacj� dochodów rolników.
Jednak�e same instrumenty polityki rolnej czy �rodowiskowej nie s� w stanie zapewni� zrównowa�enia aspektów �rodowiskowych i ekonomicznych. Konieczna jest równie� przemiana �wiadomo�ci ca�ego spo�eczestwa, zarówno rolników, jak i reszty spo�eczestwa. Niezb�dne jest dostrze�enie potrzeby w��-czenia aspektów �rodowiskowych w codziennych decyzjach ekonomicznych. Jednym z tego typu przyk�adów jest poziom zu�ycia energii oraz rodzaj paliw wykorzystywanych do jej wygenerowania.
Istotnym aspektem w dzia�aniach podejmowanych w wielu pastwach jest wspieranie rozwoju rolnictwa ekologicznego. Jednak�e mimo wsparcia, cho-cia�by w ramach unijnej polityki rozwoju obszarów wiejskich, rozwój tego typu dzia�alno�ci rolniczej jest ograniczony przez brak rozwini�tego rynku dystrybu-cji ekologicznej �ywno�ci. Niezb�dne jest równie� przekonanie potencjalnych konsumentów, i� system kontroli produkcji �ywno�ci ekologicznej zapewnia wysok� jako�� tej �ywno�ci.
Wa�n� kwesti� dotycz�c� rozwoju rolnictwa jest problem emisji gazów cieplarnianych. Rolnictwo emituje przede wszystkim metan i dwutlenek azotu. Ten pierwszy gaz jest szczególnie zwi�zany z produkcj� niektórych zwierz�t, a zw�aszcza byd�a. Istnieje wiele metod ograniczania emisji gazów cieplarnia-nych przez rolnictwo. Jednocze�nie rolnictwo mo�e równie� dokonywa� sekwe-stracji najpowszechniej wyst�puj�cego gazu cieplarnianego, czyli dwutlenku w�gla. Staraj�c si� w��czy� europejskie rolnictwo w wysi�ek redukcji emisji ga-zów cieplarnianych, nale�y wzi�� pod uwag� ró�ny wk�ad poszczególnych ty-pów produkcyjnych w generowanie tych gazów. Jak pokazuj� badania Potoriego

260
i innych, projekcje dotycz�ce wp�ywu na�o�enia ogranicze emisji metanu na gospodarstwa specjalizuj�ce si� w produkcji zwierz�cej nie pokazuj� pe�nych skutków wdro�enia takich limitów. Nale�y jeszcze uwzgl�dni� koszty admini-stracyjne zarówno po stronie producentów rolnych, jak i administracji publicz-nej. Nale�y równie� wzi�� pod uwag� fakt, i� kolejne ograniczenia mog� nega-tywnie wp�yn�� na mo�liwo�� kontynuowania produkcji rolnej przez rolników obj�tych nowymi wymogami. W zwi�zku z tym konieczne jest wprowadzenie elastycznych rozwi�za.
Nie mniej wa�nym problemem jest marnotrawstwo �ywno�ci w ca�ym �acu-chu �ywno�ciowym. Ograniczenie skali tego zjawiska sta�o si� istotnym celem dzia-�a wielu organizacji, a samo badanie tego zjawiska i metod ograniczania strat �yw-no�ci na poszczególnych etapach jest wa�nym problemem badawczym. Pierwszym krokiem do ograniczenia marnotrawstwa �ywno�ci jest u�wiadomienie wszystkim interesariuszom skali strat ponoszonych przez nich i ca�e spo�eczestwo w zwi�zku z marnotrawstwem �ywno�ci. Jak wskazuje Masar, wi�kszo�ci strat �ywno�ci w wy-niku marnotrawstwa na etapie sprzeda�y i konsumpcji da�oby si� unikn��. Inaczej wygl�da sytuacja w przypadku rolnictwa i przetwórstwa, gdy� odpady na tych eta-pach �acucha �ywno�ciowego s� w wi�kszo�ci niejadalne i nie maj� zastosowania do produkcji innych rodzajów �ywno�ci.
Wci�� aktualnym problemem w kontek�cie równowagi mi�dzy celami �rodowiskowymi i ekonomicznymi (oraz spo�ecznymi) jest wykorzystywanie w rolnictwie organizmów genetycznie modyfikowanych. W UE dyskusja na te-mat GMO koncentruje si� obecnie g�ównie na zapewnieniu pastwom cz�on-kowskim odr�bno�ci prawnej przy decydowaniu o zakazie upraw GMO w opar-ciu o argumenty inne ni� te oparte na ocenie ryzyka dla zdrowia i ryzyka �rodo-wiskowego. Poza UE powierzchnia upraw GMO systematycznie ro�nie, co mo-�e wp�ywa� na ceny oraz konkurencyjno�� rolnictwa europejskiego na �wiato-wych rynkach rolnych.
Dzia�ania maj�ce na celu zrównowa�ony rozwój maj� charakter wielokie-runkowy. Przyk�adem mo�e by� region Wschodnia Serbia. W�ród dzia�a re-komendowanych do wdra�ania na tym obszarze w ramach wspierania zrówno-wa�onego rozwoju znajduj� si� m.in.: strefowanie produkcji rolnej poprzez wprowadzanie specjalnych stref rolno-ekologicznych; wspieranie tworzenia grup producentów; stworzenie ram prawnych umo�liwiaj�cych prowadzenie zintegrowanej produkcji rolnej; zapewnienie ochrony prawnej uznanym produk-tom regionalnym; wprowadzenie regulacji prawnych umo�liwiaj�cych tworze-nie infrastruktury do pozyskiwania energii wód; stworzenie monitoringu stanu ro�lin w ramach systemu ich ochrony oraz stworzenie lokalnych strategii rozwo-ju zrównowa�onego wsi i rolnictwa.

261
Zrównowa�ony rozwój rolnictwa oraz pogodzenie celów �rodowiskowych z ekonomicznymi nierozerwalnie zwi�zane s� z innowacjami. Wdra�anie inno-wacji w rolnictwie wci�� jest na niskim poziomie. Istnieje wiele barier ograni-czaj�cych i hamuj�cych wdra�anie przez rolników innowacyjnych rozwi�za. W�ród najwa�niejszych wymieni� mo�na: brak wiedzy na temat istnienia inno-wacyjnych metod prowadzenia produkcji rolnej; niech�� do wprowadzania zmian zwi�zana z awersj� do ryzyka; brak �rodków finansowych na inwestycje w gospodarstwie.
Innym cz�sto pojawiaj�cym si� poj�ciem w odniesieniu do równowa�enia celów �rodowiskowych i ekonomicznych jest „biogospodarka”. Jak pokazuj� badania dotycz�ce Ukrainy pokazuj�, i� „zielone” inwestycje mog� pozytywnie wp�yn�� na tempo rozwoju gospodarczego tego kraju.
Dobrostan wymaga dzia�a nie tylko w odniesieniu do rolnictwa, ale tak�e w przypadku przemys�u spo�ywczego. Wynika to przede wszystkim z faktu, i� niezb�dne jest nie tylko zapewnienie dost�pu do �ywno�ci, ale tak�e do �ywno-�ci o okre�lonych walorach zdrowotnych. Istnieje ju� wiele norm i standardów, które musz� spe�nia� producenci �ywno�ci w poszczególnych pastwach. Jak wskazuj� liczne przyk�ady, w tym omówione w niniejszej monografii przyk�ady Serbii i Ukrainy, spe�nienie wymogów funkcjonuj�cych na du�ych rynkach po-zwala na rozwini�cie eksportu artyku�ów rolno-spo�ywczych na te rynki.
Warto równie� pami�ta� o roli rolnictwa w ca�ej gospodarce. Cho� udzia� rolnictwa w gospodarce mierzony jego wk�adem w PKB systematycznie maleje, to sektor ten ma du�e znaczenie na poziomie lokalnym i regionalnym. Rolnic-two mo�e w zwi�zku z tym odgrywa� wa�n� rol� w okresie kryzysu gospodar-czego, stabilizuj�c sytuacj�, gdy� jest to sektor znacznie bardziej odporny na szoki, co pokazuj� badania dotycz�ce Rumunii, zaprezentowane w niniejszej monografii.
Konieczno�� pogodzenia celów ekonomicznych i �rodowiskowych w pro-dukcji rolnej i dzia�alno�ci innych sektorów jest coraz silniej dostrzegana. W�ród prób pogodzenia troski o �rodowisko z celami gospodarczymi znajduj� si� m.in. promowanie gospodarki o obiegu zamkni�tym oraz gospodarki nisko-emisyjnej. W odniesieniu do samego rolnictwa przyk�adem mo�e by� koncepcja smart agriculture. Wdra�aj�c wszelkiego rodzaju dzia�ania pro�rodowiskowe, nale�y mie� jednak na uwadze pozosta�e elementy koncepcji zrównowa�onego rozwoju, czyli kwestie ekonomiczne i spo�eczne.
Dzi� w�tpliwa jest celowo�� d��enia, aby wszystkiego by�o coraz wi�cej i wi�cej. Jest to prawdziwa pu�apka wspó�czesnej cywilizacji. D��enie do wzro-stu produkcji w naszej „rabunkowej” cywilizacji jest zatem drog� do samouni-cestwienia. Nie jest zatem uzasadnione zaspokajanie potrzeb �ywno�ciowych

tylko przez wzrost produkcji, bo lepiej jest pracowa� nad metodami znacznie ograniczaj�cymi marnotrawstwo. Rolnictwo czeka na kompleksowy, mi�dzy-sektorowy program wprowadzenia w �ycie metod produkcyjnych, które przy-czynia�yby si� do racjonalniejszej produkcji, nieszkodz�cej naturalnemu �rodo-wisku cz�owieka. Ma spe�nia� funkcje spo�eczne.


EGZEMPLARZ BEZP_ATNY
Nak�ad 500 egz.,�ark. wyd.����� Druk i oprawa: EXPOL W�oc�awek