Embed Size (px)
Citation preview

8/13/2019 23-1889-09_DNA_QC
http://slidepdf.com/reader/full/23-1889-09dnaqc 1/4
degree of staining of CTN provided will be less than would be obtained with fresh nuclei, sincformaldehyde fixation reducesCTN's ability to stain with PI.
The PI stain intercalates into the DNA of both the CEN and CTN. Blu e light (488 nm) excitethis fluorochrome which fluoresces red with a maximum emission at approximately 623 nm. Thintensity of the fluorescence is a function of the DNA content of the cell. (See Section 8Limitations).
The 2-µm fluorescent beads may be used as a check of cytometer alignment. They fluoresce inboth FL1 and FL2, thereby providing a means of verifying instrument performance independenof stain or sample preparation. If the CV of the CEN or the CTN is out of the specification statein this insert, BD recommends running the 2-µm beads.
4. REAGENTSReagents Provided, Sufficient for 25 Tests Vial A: 1-mL suspension of CEN in buffer and ethanolVial B: 1-mL suspension of CTN in buffer with formaldehyde and 0.01% thimerosalVial C: 1-mL suspension of 2-µm fluorescent beads in buffer with gelatin and 0.1% azide
Vial D: 50 mL of 50-µg/mL solution of PI in buffer (25 tests using CEN and CTN)
Precautions 1. When stored at 2° to 8°C, the reagent is stable until the expiration date shown on the label
Do not use after the expiration date. Keep the reagent vials dry.2. There is a tendency for the CEN (vial A) to settle during storage. This can be corrected
by gently vortexing before use. Vortexing too vigorously will separate desired aggregatesIt is critical that CEN be stored at 2° to 8°C, since these particles are sensitive to thermadegradation.
3. CTN (vial B) tend to aggregate during storage and should be vigorously vortexed tseparate these aggregates.
4. The 2-µm beads (vial C) must be protected from prolonged exposure to light.
5. Do not expose stained CEN or CTN to prolonged light during storage or incubation6. Incubation times or temperatures other than those specified may lead to erroneous
results.7. Propidium iodide solution (vial D) must be protected from prolonged exposure to ligh
Deterioration in stain performance has been observed with short periods of roomtemperature storage, therefore stained samples must be stored at 2° to 8°C in the dark untanalysis (maximum 12 hours).
8. WARNING: Propidium iodide is a su spected mutagen. Gloves and safety glasses shoulbe worn when handling. Avoid contact with eyes, skin, and clothing. Avoid breathinvapors and wash surfaces thoroughly after handling. If contact occurs, flush immediatel
with water. Consult a physician if contact with eyes occurs.9. WARNING: Formaldehyde is harmful by inhalation, in contact with skin, and i
swallowed. It is irritating to eyes and skin. Exposure can cause cancer. Possible risks oirreversible effect. May cause sensitization by skin contact. Keep locked up and out of threach of children. Keep away from food, drink, and animal feedingstuff. Wear suitablprotective clothing and gloves. Even small amounts of formaldehyde can be fatal. Iswallowed seek medical advice immediately and show this container or label. Dispose oaccording to federal, state, and local regulations.
10. WARNING: Sodium azide is harmful if swallowed. Keep out of reach of children. Keepaway from food, drink, and animal feedingstuff. Wear suitable protective clothing. Iswallowed, seek medical advice immediately and show this container or label. Contac
with acids liberates very toxic gas. Azide compounds should be flushed with large volumeof water during disposal to avoid deposits in lead or copper plumbing where explosivconditions may develop.
11. WARNING: Thimerosal is a mercury compound. Exposure can cause reproductivtoxicity. Harmful by inhalation, in contact with skin, and if swallowed. Danger ocumulative effects. Keep away from food, drink, and animal feedingstuff. After contac
with skin, wa sh immediately wi th plenty of water . Wear suitable p rotective clo thingIn case of accident or if you feel unwell, seek medical advice immediately. Dispose oaccording to federal, state, and local regulations.
5. INSTRUMENTThe above procedures using the DNA Quality Control Particles are designed for use onFACSCalibur, FACSort, and FACScan flow cytometers with appropriate computer hardwaresoftware, and gating electronics. The flow cytometer employed must be equipped with standardfluorescence and forward scatter detection. A DDM or other electronic pulse processo
capability is required for doublet discrimination.
All the performance characteristics of this product were obtained using a Becton DickinsonFACScan flow cytometer on the HP platform equipped for fluorescence detection, forward and90° angle light scatter, and doublet discrimination. The LO flow rate was selected. CEN, CTNand 2-µm bead data were collected and analyzed with CellFIT software on the HP platformCELLQuest software and the DNA Experiment Document on the Macintosh platform may alsbe used to acquire DNA samples for analysis using an appropriate DNA analysis softwarepackage.
6. REAGENT PREPARATIONCENPrior to staining, gently vortex the nuclei. Pipet 40 µL of CEN from vial A into a tube containin1 mL of PI stain solution from vial D, cap and gently vortex. Incubate the sample for 10 minuteat room temperature, protected from light. Keep the sample in the dark at 2° to 8°C or in covered ice bath until ready for analysis. PI-stained CEN are typically stable up to 4 hours whenstored in the dark at 2° to 8°C.
1. INTENDED USEFor use in the setup and verification of the doublet discrimination function of FACSCalibur™,FACSortTM, or FACScan™ flow cytometers equipped with a doublet discrimination module(DDM) for DNA analysis, and for monitoring daily instrument performance.
For use with FACS® brand, and other, flow cytometers; all performance specifications will needto be determined for each individual case although the particles will meet the stability criteria asstated.
2. SUMMARY AND EXPLANATIONFlow cytometric analysis of cellular DNA content has become an increasingly important researchtool for measuring and identifying abnormal cell populations. Examination of cellular DNA
content can provide information for use in cell-cycle analysis, as well as for establishing a DNA index 1 for diploid and aneuploid cells in cancer studies.2-6 As a result, uniform biologicalparticles have become a necessary component for setup, control, and troubleshooting of flow cytometers being used for DNA analysis.
Most normal resting cells are diploid, while normal proliferating cells exist at various levels of ploidy. During the various phases of the cell cycle (G0, G1, S, G2, and M), cell nuclei containdifferent amounts of DNA, characteristic of their stage of proliferation.
During the G1 phase, cells undergo RNA and protein synthesis, maintaining diploidy (DNA content characteristic of two complete sets of chromosomes, 2 N). Subsequently, during the Sphase, DNA synthesis occurs. Cells in this phase of the cell cycle contain amounts of DNA intermediate between G1 and G2. The S phase culminates in a doubling of DNA content, definedas G2 tetraploid (4 N DNA content). During the G2 phase, RNA and protein synthesis occurs,culminating in a mitosis phase (M). Based on DNA content alone, the M phase is indistinguishablefrom the G2 phase. Once mitosis has occured, the resulting 2 N daughter cells either continueon to another cycle or enter a resting stage defined as G0. This stage is indistinguishable from G1
on the basis of the DNA content alone. Collectively, the replication cycle is described by G0/G1, S, and G2+M phases.
The Becton Dickinson Immunocytometry Systems (BDIS) DNA Quality Control Particlesprovides a means for testing and documenting optimal performance on FACS brand or otherflow cytometers. The kit is composed of four reagents. Vial A contains chicken erythrocyte nuclei(CEN), used in setting instrument photomultiplier tube (PMT) voltages and amplifier gains,and providing information regarding instrument linearity and resolution. Vial B contains calf thymocyte nuclei (CTN), a cycling cell component that allows assessment of proper function of the doublet discrimination module (DDM) or pulse processing. Vial C contains 2-µm fluorescentbeads, which function as a stable particle to verify instrument alignment. Vial D containspropidium iodide (PI), a DNA stain.
3. PRINCIPLES OF THE PROCEDURECEN are prepared by a detergent treatment of chicken blood followed by fixation of the isolatednuclei in ethanol. These fixed nuclei may be used as instrument performance particles to set upflow cytometers such as the FACSCalibur, FACSort, FACSVantage™ SE, FACScan,FACStarPLUS™, or FACStar™ for DNA analysis.
CEN preparation is designed to contain single nuclei, doublets, triplets, and some largeraggregates. The CEN are intended for checking instrument linearity and resolution (Figure 2). When stained with propidium iodide, these aggregates result in four or more reference peaks inthe fluorescence 2-area (FL2-A, Figure 3) or fluorescence 2-height (FL2-H, Figure 4) histogramsas obtained using CellFIT™ software, on the Hewlett-Packard (HP) platform. The first fourFL2-A histogram peaks represent the singlets, doublets, triplets, and quadruplets. If theinstrument response is linear and the nuclei have been correctly stained, the channel values of themeans should be approximately 2, 3, and 4 times greater than the singlet peak (see Figure 3).Comparable results are expected using CELLQuest™ software and the DNA ExperimentDocument with the Macintosh® platform.
CTN are prepared by a detergent treatment followed by fixation of the isolated nuclei informaldehyde. CTN provide a stable source of nuclei with all phases of the cell cycle present.Most of the nuclei are in the G0/G1 stage, and a smaller portion exists in the S and G2+M stages.Doublets of the G0/G1 nuclei also exist and can be discriminated from true G2+M singlets withthe use of a DDM or pulse processing. The DDM enables doublets of cells in G0/G1 phase, andother aggregates, to be distinguished from single cells in G2+M phase, thus allowing improvedcell-cycle estimates of the percentage of cells in G2+M phase (4 N DNA content). NOTE: The
BECTON DICKINSON
DNA QC ParticlesCat. No. 349523
For Verification of InstrumentPerformance and Quality Control
For Research Use Only.
Not For Use in Diagnostic orTherapeutic Procedures.
23-1889-09

8/13/2019 23-1889-09_DNA_QC
http://slidepdf.com/reader/full/23-1889-09dnaqc 2/4
CTNVigorously vortex the bottle of nuclei. Pipet 40 µL of CTN from vial B into a tube containing 1 mL of PI stain solution from vial D, cap and gently vortex. Incubate the sample for 10 minutesat room temperature, protected from light. Keep the sample in the dark at 2° to 8°C or in a covered ice bath until ready for analysis. PI-stained CTN are typically stable up to 4 hours whenstored in the dark at 2° to 8°C.
2-µm BeadsVigorously vortex the bottle of beads. Dispense one drop of beads from vial C into a tubecontaining 1 mL of filtered PBS, cap and gently vortex to di sperse. Diluted beads are stable for12 hours when stored in the dark at 2° to 8°C or in a covered ice bath until ready for analysis.
7. PROCEDURE
Reagent Provided See Reagent Provided and Precautions in Section 4, Reagents.
Reagents and Materials Required but Not Provided 1. 12 x 75-mm disposable test tubes (Becton Dickinson Falcon® No. 2058, or equivalent)2. Precision micropipettor, 1-mL capacity 3. Precision micropipettor, 50-µL capacity 3. Vortex mixer4. Ice bath with cover5. Disposable gloves6. 1X phosphate-buffered saline (Dulbecco’s, pH 7.2±0.2, 0.01 M),7 calcium and magnesium
free. Filter through a 0.2-µm filter before use. Store at 2° to 8°C. 7. 6 mL 12x75-mm Falcon tube with 35-µm strainer cap (BD Labware No. 35-2235)
Procedure for Setup on the Macintosh Platform Before setting up your flow cytometer, turn on the flow cytometer, Macintosh computer system,and printer. For specific information, refer to the C ELL Quest DNA Experiment Document User’s Guide .
1. Insert the DNA Application disk into the floppy disk drive.2. Double-click the DNA Application disk icon to view the disk contents in a window.
Copy the disk contents onto the hard drive.3. Double-click the DNA QC folder.4. Double-click the DNA Experiment Document file.
Installing the Flow Cytometer Instrument Se ttingsNOTE: As you open the various windows you may want to reposition the windows on the desktop.NOTE: You can print the pages of your Experiment document by selecting Print from the File menu.
1. Choose Connect to Cytometer from the Acquire menu.2. Choose Instrument Settings from the Cytometer menu.3. Click Open .4. Select the appropriate Instrument Settings file and click Open.5. Click Set.6. Click Done.7. Choose Detectors/Amps from the Cytometer menu.
Acquisition SetupBefore beginning acquisition, set up your folder, folder location, and file name as follows.
1. Choose Parameter Description from the Acquire menu.2. Click Folder.3. Select folder and folder location or create a new folder.4. Click the Select “(folder name)” field at the bottom of the dialog box.5. Click File in the Parameter Description window.6. Type the Custom Prefix name (top line) that you wish to use for these files.7. Click OK.8. Type CEN in the Sample ID box in the Parameter Description window.9. Close the Parameter Description window.
Acquiring CEN1. Set the instrument flow rate to LO, turn the flow cytometer to RUN, mix the CEN sample
and install it on the cytometer’s Sample Injection Port.2. Make sure you are in Setup mode and click Acquire in the Acquisition Control window.3. Make the following two adjustments.
Click Pause and Restart in the Acquisition Control window as many times as needed. Alladjustments are made in the Detectors/Amps window.• Viewing the FL2-A histogram, adjust the FL2-H photomultiplier tube (PMT) Voltageso the CEN singlets are in channel 200 ±5.• Viewing the FL2-W histogram, adjust only the FL2-W Amp Gain so the CEN singletsare in channel 200 ±5.The channel number can be approximated by viewing the Mean column of the HistogramStatistics box.
4. Click Pause when done.5. Click Abort in the Acquisition Control window.6. Uncheck the Setup box in the Acquisition Control window.7. Click Acquire.8. After acquisition is complete, remove the CEN from the Sample Injection Port and place
the cytometer in STANDBY.9. Adjust markers (M) M1 and M2 on the first two peaks, singlets and doublets, of the
FL2-A histogram so the peak falls within the respective marker.10. Calculate the linearity using the mean channel number, located in the Histogram
Statistics box, for marker 1 (M1) and mean channel number for marker 2 (M2) using thfollowing formula: Mean M2
Mean M1
The linearity should be between 1.95 and 2.05. Locate the coefficient of variation (CVof M1 in the FL2-A Histogram Statistics box. Check to see that the CV is less than or equato 3.00%.
11. Choose Instrument Settings from the Cytometer menu.12. Click Save.13. Type a name for the file, and specify a storage location.14. Click Save in the directory dialog box.15. Click Done in the Instrument Settings dialog box.
Acquiring CTNTo acquire CTN, the plot on page 2 of the DNA Experiment Document will need to breformatted to an Acquisition -> Analysis plot.
1. Scroll to page 2 of the DNA Experiment Document.2. Choose Parameter Description from the Acquire menu.3. Type CTN in the Sample ID box.4. Close the Parameter Description window.5. Set the instrument flow rate to LO, turn the cytometer to RUN, and install the CTN
sample on the cytometer’s Sample Injection Port.6. Click Acquire .
A CTN sample (10,000 events) is collected. View the width versus area dot plot anddisplay all 10,000 events. Verify there is good separation between the G
2+M portion o
the singlet population and the doublets in FL2-W.7. After acquisition is complete, remove CTN from the Sample Injection Port and place th
cytometer in STANDBY.8. Save this new Experiment document by choosing Save from the File menu.9. Type a name for the document and specify a storage location.
10. Cli ck Save.
11. Close the newly saved DNA Experiment Document.
The daily quality control of the instrument has been completed.
Becton Dickinson recommends running a peripheral blood mononuclear cell (PBMC) samplor other diploid control to further adjust the instrument before acquiring samples. Prepare andstain the PBMCs the same way you would your specimens. For further information, refer to thC ELL Quest DNA Experiment Document User’s Guide .
CV Check of 2-µm Beads on FL2-Area 1. Open a new CELLQuest Experiment Document or add a page to the DNA Experimen
Document. For further information about Experiment documents refer to the C ELL QuesSoftware User’s Guide .
2. Choose Histogram Plot from the Plots menu.3. Change Plot Source to Acquisition->Analysis.4. Select FL2-A in the Parameter field and click OK.
NOTE: Enlarge the plot for easier viewing.5. Choose Histogram Stats from the Stats menu.
6. Choose Parameter Description from the Acquire menu.Select Folder, where you will save the data to, and name the file.
7. Close the Parameter Description window.8. Make sure you are connected to the cytometer and are in setup mode.9. Set the instrument flow rate to LO, turn the cytometer to RUN, and install the 2-µm bead
on the cytometer’s Sample Injection Port.10. Click Acquire.11. Adjust the FL2 Voltage to position the singlet peak at channel 200 ±5.
NOTE: The channel number can be estimated by viewing the Mean channel column inthe Histogram Statistics box.
12. Click Pause, Abort, and Setup to remove the check mark.13. Click Acquire to save the data file to disk.14. After acquisition is complete, remove the 2-µm beads from the Sample Injection Port and
place the cytometer in STANDBY.15. Place a marker (M1) on the singlet peak and verify that the CV of M1 is less than or equa
to 2.3%.16. This Experiment Document can be saved and printed.
Procedure for Setup on the HP Platform CEN Setup
1. Enter the CellFIT program, select CellFIT from the MasterPage screen or from the HPCommand Line, and execute:a) #11:/APP/DNA/CELLFIT, [Return], on a CONSORT 32 System,b) #ll:CELLFIT, [Return] or #12:CELLFIT, [Return], on a CONSORT 30 System.
2. At the CellFIT program main screen press [F1], SETUP.3. Verify that each field labeled Particle Used is labeled CEN.4. Verify the field labeled FL2-A Average is at the default value of 100. Make sure you se
the cytometer to RUN and the fluidics to LO. Put the PI-stained CEN tube on thecytometer Sample Injection Port, then press [F1], ADJUST.
5. During the automatic PMT adjustment, verify the FL2-W and FL2-A measurements arbeing displayed. Allow the automatic setup to continue until it is complete. The followinmessage will appear in the message box at the bottom of the screen: AUTODETECTORSHAVE BEEN SET.
6. Select [F3], CHECK CV. Verify that the CV of the singlet peak on FL2-A is less than oequal to 3.00% and that the ratio of doublets to singlets is between 1.95 and 2.05. Remov
= linearity
8/13/2019 23-1889-09_DNA_QC
http://slidepdf.com/reader/full/23-1889-09dnaqc 3/4
the PI-stained CEN tube from the FACScan Sample Injection Port.7. Print the Setup Report by pressing [F9]. Also obtain a histogram printout by pressing the
[SHIFT] and [PRINT] keys simultaneously.
CTN Confirmation for Proper Cytometer DDM Function1. Set up the cytometer with PI-stained CEN as in the Procedure for CEN Setup.2. After printing the CEN Setup Report, select [F5], ACQSETUP.3. Enter appropriate information into the various name fields. Enter appropriate file storage
and file name information into the FILE STORAGE fields. Enter 10000 into theEVENTS field and put the PI-stained CTN tube on the cytometer Sample Injection Port.
4. Select [F5], ACQUIRE. This will start acquisition of a 10,000 event list-mode data fileof ungated CTN.
5. After data acquistion is complete and the file is stored, remove the PI-stained CTN tubefrom the cytometer Sample Injection Port and select [F4], MODEL. Select SET GATESand set an FL2-W vs FL2-A singlet gate (Figure 5).
6. Mark the G0/G
1and G
2+M peaks on a singlet gated FL2-A histogram and analyze with
the RFIT model.7. Verify that the G
0/G
1 CV is less than or equal to 5.00%. Check the G
0/G
1, S, and G
2+M
cell cycle percentages. For more information, refer to the CTN Cell Cycle Statistics insertincluded with this kit.
HP Procedure to Check 2-µm Bead CV on FL2-Area 1. Enter the CellFIT program. Select CellFIT from the MasterPage™ screen or from the
HP Command line, and execute:a) #11:/APP/DNA/CELLFIT, [Return], on a CONSORT 32 System,b) #ll:CELLFIT, [Return] or #12:CELLFIT, [Return], on a CONSORT 30 System.
2. At the CellFIT program main screen, press [F1], SETUP.3. Move the cursor to each field labeled Particle Used and type 2 µm beads, [Return].4. Move the cursor to the field labeled FL2-A Average and type 200, [Return]. Put the
2-µm bead tube on the cytometer Sample Injection Port, then press [F1], ADJUST.5. Immediately after the Acquisition Screen is drawn on the screen, press [F1], STOP
ACQUISITION. Increase the FSC Gain on the cytometer to E01, then press [F3],
RESTART.6. During the PMT adjustment, verify FL2-W and FL2-A measurements are being
displayed. Allow the automatic setup to continue until it is complete. The following message will appear in the message box at the bottom of the screen: AUTODETECTORSHAVE BEEN SET.
7. Select [F3], CHECK CV. Verify that the CV of the singlet peak on FL2-A is less than orequal to 2.3%. Remove the 2-µm bead tube from the cytometer Sample Injection Port.
8. Print the Setup Report by pressing [F9]. Also obtain a histogram printout by pressing the[SHIFT] and [PRINT] keys simultaneously.
8. LIMITATIONS1. Flow cytometric analysis of the DNA content requires that a linear relationship exists
between PI fluorescence and the amount of DNA in the nucleus. This relationship isaffected by a number of biological and physical variables, which include chromatinstructure, the amount of double-stranded RNA in the nucleus, the fixation procedure, if any, and the pH and ionic strength of the staining solution. Therefore, the amount of fluorescence produced per milligram of DNA will be comparable only between the same
tissues prepared in the same way.2. Exposure of the stained nuclei to light will reduce the fluorescence from the nuclei.Photobleaching may be prevented by keeping the stained nuclei in the dark until analysis.
3. Large aggregates of nuclei can clog flow cytometers. Stream-in-air sorters can bevulnerable to clogging. To minimize this possibility, it is suggested that the nucleisuspension be filtered through a 30- to 50-µm nylon mesh prior to analysis.
4. Care must be taken when using a different PI concentration or formulation than thatincluded in this kit. If a different concentration or formulation of the dye solution mustbe used, stain the CEN and CTN with this solution and determine new PMT settings andtarget channels.
NOTE: The 2-µm bead CV check procedure is intended for use in checking cytometeralignment or when the CV of the CEN or CTN is out of the specifications as stated in this insert.It is not intended for use in setup of the cytometer for DNA acquisition of specimens.
5. The instrument must be thoroughly cleaned and regularly maintained as described in theinstrument user’s guide. This is especially true for sample preparations that contain freeDNA, which can aggregate and has a high affinity for plastic tubing. It is also critical thatno PI solution is left in the instrument when the next application or experiment is run.
6. The flow rate should remain low (LO on FACScan, FACSort, or FACSCalibur flow cytometers) for a more precise hydrodynamic focusing, yielding lower CVs.
7. For use with other flow cytometers, all performance specifications will need to bedetermined for each individual case.
9. PERFORMANCE CRITERIACEN
A typical CEN light-scatter dot plot is shown in Figure 1. Figure 2 illustrates a typical CEN dotplot of FL2-W versus FL2-A. Fluorescence 2-width (FL2-W) is a parameter that providesinformation about a particle’s passage through the path o f the laser. Figures 3 and 4 show typicalCEN FL2-A and FL2-H histograms, respectively. The coefficient of variation (CV) of the CENFL2-A singlet peak (Figure 3) should be less than or equal to 3.00% for propidium iodide–stained nuclei when analyzed on a properly aligned FACScan, FACSort, or FACSCalibur flow cytometer. The acceptable range of linearity for the doublet/singlet ratio is 1.95 through 2.05.
With the gains and detector voltages adjusted so the CEN FL2-A singlet peak is at channel 100
±9, with CellFIT version 2.0 or later (100 ±8 for CellFIT versions 1.0–1.2), the human diploidpeak should fall between channel 200 and 315, depending on the procedure used to obtain thdiploid cells. Using CELLQuest and the DNA Experiment Document on the Macintoshplatform, the gains and detector voltages will need to be adjusted so the CEN FL2-A singlet peakis at channel 200 ±5. In this case the human diploid control peak should fall between channe500 and 600 and will need to be adjusted to channel 200 ±5. NOTE: Fluorescence of nuclederived from paraffin-embedded tissues may fall outside this range.
F L
2 -
A
S S C
- H
FL2-WFSC-H
Figure 1. Representative of forwardvs 90° scatter of CEN acquired on a FACScan flow cytometer using CellFIT software.
Figure 2. Demonstration of CENaggregates on the basis of FL2-W vsFL2-A.
FL2-A
869
Counts
FullSca
le
FL2-H
941
Counts
FullScale
4002000 8008004002000
Figure 3. FL2-Area histogram of PI-stained CEN demonstrating resolution and linearity.
Figure 4. The same PI-stained CENpopulations shown as FL2-heightmeasurement.
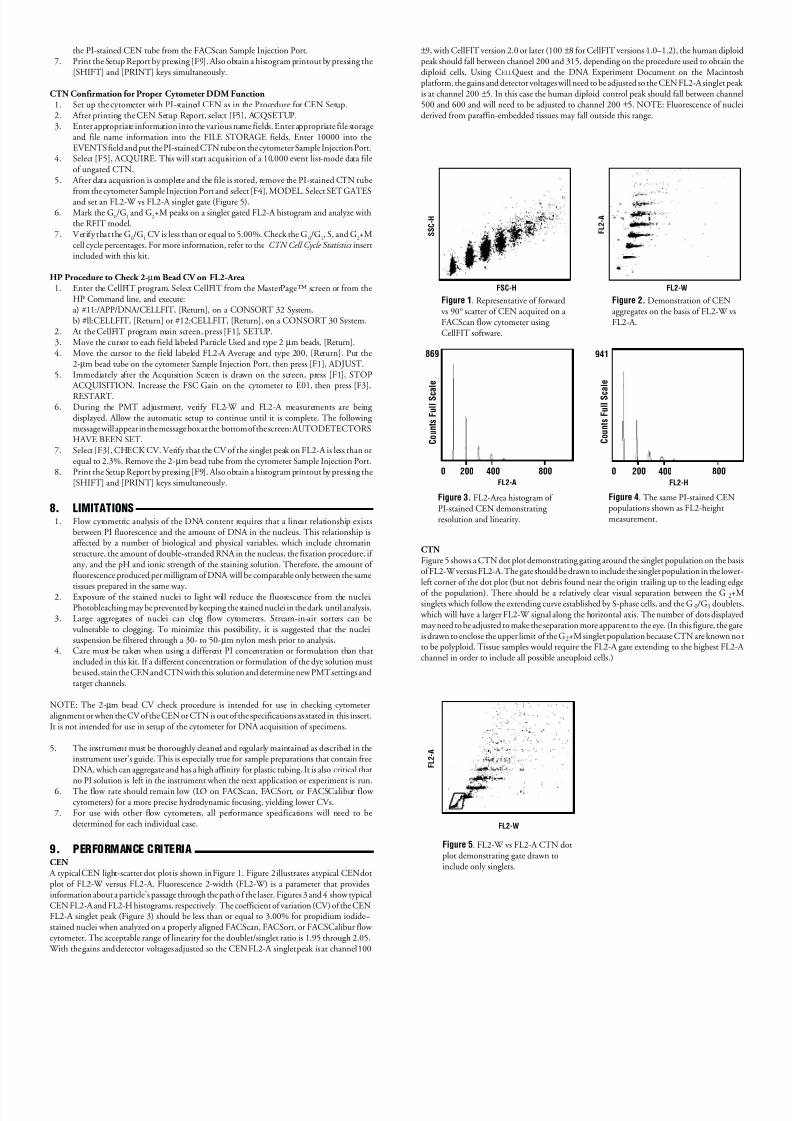
CTNFigure 5 shows a CTN dot plot demonstrating gating around the singlet population on the basiof FL2-W versus FL2-A. The gate should be drawn to include the singlet population in the lowerleft corner of the dot plot (but not debris found near the origin trailing up to the leading edgof the population). There should be a relatively clear visual separation between the G2+Msinglets which follow the extending curve established by S-phase cells, and the G0/G1 doublets
which will have a larger FL2-W signal along the horizontal axis. The number of dots displayemay need to be adjusted to make the separation more apparent to the eye. (In this figure, the gatis drawn to enclose the upper limit of the G2+M singlet population because CTN are known noto be polyploid. Tissue samples would require the FL2-A gate extending to the highest FL2-Achannel in order to include all possible aneuploid cells.)
FL2-W
F L
2 -
A
Figure 5. FL2-W vs FL2-A CTN dotplot demonstrating gate drawn toinclude only singlets.
8/13/2019 23-1889-09_DNA_QC
http://slidepdf.com/reader/full/23-1889-09dnaqc 4/4
REFERENCES1. Hiddemann W, et al. Convention on nomenclature for DNA cytometry. Cytometry
1984; 5:445-446.2. Ronot X, et al. G2 Arrest, binucleation, and single parameter DNA flow cytometric analysis
Cytometry . 1986;7:286-290.3. Larsen JK, et al. Flow cytometric discrimination of mitotic cells: resolution of M, as well a
G1, S, and G2 phase nuclei with mithramycin, propidium iod ide, and ethidium bromide aftefixation with formaldehyde. Cytometry . 1985;7:54-63.
4. Frankfurt OS, et al. Proliferative characteristics of primary and metastatic human solitumors by DNA flow cytometry. Cytometry . 1984;5:629-635.
5. Barlogie B, et al. Flow cytometry in clinical cancer research.Cancer Res . 1983;43:3982-39976. Kute TE, et al. Flow cytometry in solid-tumor prognosis. Lab Management
1987;July:21-32.
7. Rose NR, et al. Manual of Clinical Laboratory Immunology . 3rd ed. Washington, DC American Society for Microbiology; 1986:234.
WARRANTYThe product sold hereunder is warranted only to conform to the quantity and contents statedon the label at the time of delivery to the customer. There are no warranties, expressed or implied
which extend beyond the description on the label of the product. Becton Dickinson’s solliability is limited to either replacement of the product or refund of the purchase price. BectoDickinson is not liable for property damage, personal injury or economic loss caused by thproduct.
FACS and Falcon are registered trademarks of Becton Dickinson and Company.FACSCalibur, FACScan, FACSort, FACStar, FACStarPLUS, FACSVantage SE, CellFIT, andCELLQuest are trademarks of Becton Dickinson and Company.
Macintosh is a registered trademark of Apple Computer, Inc.
CUSTOMER SUPPORT INFORMATION
Becton Dickinson Immunocytometry Systems2350 Qume DriveSan Jose, California 95131-1807, USA Ordering Information Tel (800) 223-8226Customer Support Center Tel (800) 448-BDIS (2347)
www.bdfacs.com
Distributed by:Becton DickinsonEuropean HQ Denderstraat 24B-9320 Erembodegem-AalstBelgiumTel (32) 53-720211Fax (32) 53-720450
Becton Dickinson Canada, Inc.2464 South Sheridan Way
Mississauga, Ontario L5J 2M8Canada Tel (905) 822-4820Fax (905) 822-2644
Nippon Becton DickinsonCompany, Ltd.DS Bldg.5-26, Akasaka 8-chomeMinato-ku, Tokyo 107
JapanTel (81) 3-5413-8251Fax (81) 3-5413-8155
Becton Dickinson and Company Asia Pacific Division30 Tuas Avenue, #2Singapore 639461
Tel (65) 860-1478Fax (65) 860-1590
7/98 23-1889-09
10. TROUBLESHOOTING
Problem Possible Cause Solution
Count rate too low. 1. Instrument clogged. 1. Perform dai ly maintenance .2. Instrument out of 2. Refer to the instrument
calibration. user’s guide.3. Sample too dilute. 3. Prepare new sample.
Unable to set PMT 1. Too many or too 1. Make a new stainedvoltages or amplifier few CEN. CEN preparation.
gains. 2. PI degradation. 2. Make a new stainedCEN preparation orreplace PI stock solution.
3. CEN single t gate too 3. Repeat Adjust Screen to wide. obtain a new gate.
Increased CV. 1. PI or sample 1. Make a new staineddegradation. preparation.
2. Flow rate swi tched 2. Change Flow switch toon HI. LO.
3. Air in fluidics. 3. Drain and refill fluidics.
No doublet/singlet 1. FL2-W too low. 1. Check FL2-W gains.separation on 2. Sample or PI stain 2. Make a new stainedFL2-W. degradation. CEN and CTN preparation
or replace PI stock solution.
Counts
FullScale
FL2-A
1051
0 200 400 600 1000800
Figure 8. FL2-A histogram of 2-µmfluorescent beads, acquired andanalyzed using CellFIT software.
Counts
FullScale
400 8002000FL2-A
402
F L
2 -
A
FSC-H
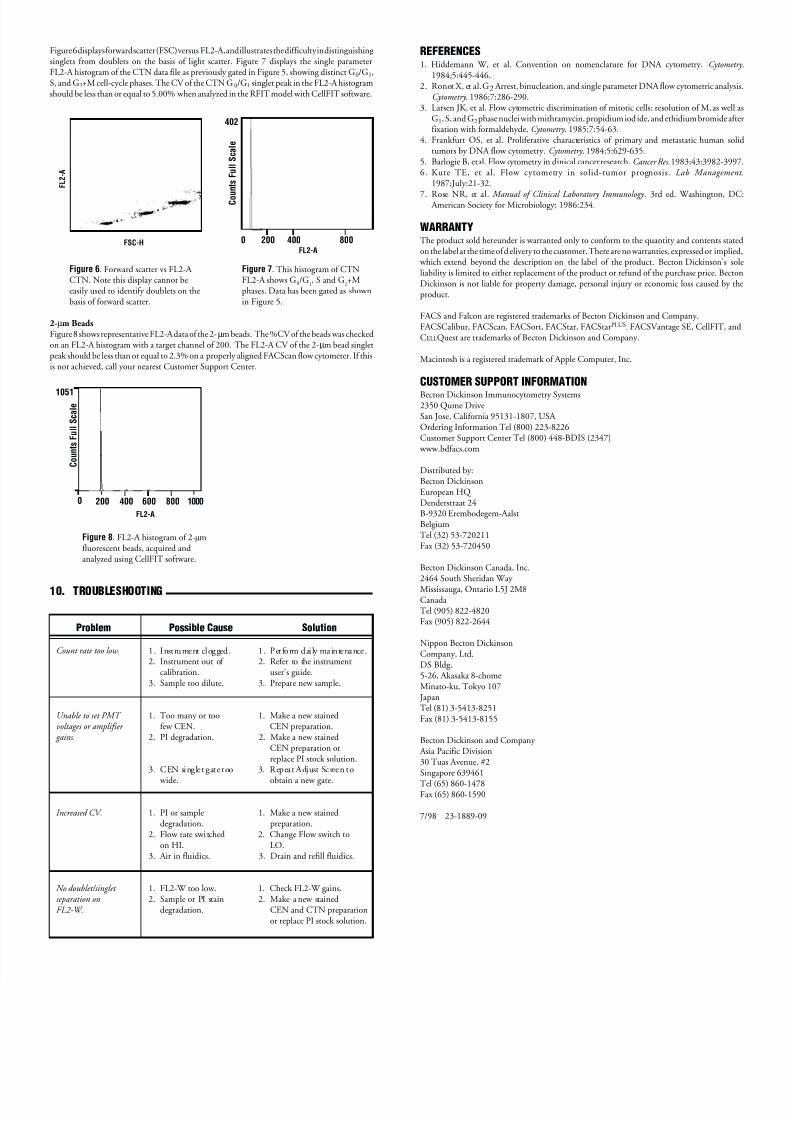
Figure 6. Forward scatter vs FL2-A CTN. Note this display cannot beeasily used to identify doublets on thebasis of forward scatter.
Figure 7. This histogram of CTNFL2-A shows G0/G1
, S and G2+M
phases. Data has been gated as shownin Figure 5.
Figure 6 displays forward scatter (FSC) versus FL2-A, and illustrates the difficulty in distinguishing singlets from doublets on the basis of light scatter. Figure 7 displays the single parameterFL2-A histogram of the CTN data file as previously gated in Figure 5, showing distinct G0/G1,S, and G2+M cell-cycle phases. The CV of the CTN G0/G1 singlet peak in the FL2-A histogramshould be less than or equal to 5.00% when analyzed in the RFIT model with CellFIT software.
2-µm BeadsFigure 8 shows representative FL2-A data of the 2-µm beads. The %CV of the beads was checkedon an FL2-A histogram with a target channel of 200. The FL2-A CV of the 2-µm bead singletpeak should be less than or equal to 2.3% on a properly aligned FACScan flow cytometer. If thisis not achieved, call your nearest Customer Support Center.