Embed Size (px)
Citation preview

2.2 Index Profiles and Types of Fibers 65
2.2 Index Profiles and Types of Fibers
After the theoretical descriptions on the properties of optical fibers in the section on the fundamentals of light propagation and the observations indicated above on mode propagation and the essential characteristics of fibers this following section will deal with concrete, available fibers. First, the different index profiles, as briefly mentioned in 1.1.6, will be introduced using examples.
The next section shows the historical development especially in regard to the different POF variants. Thereafter the important characteristics attenuation and bandwidth will be shown in a series of experimental results.
Three parameters are basically responsible for the actual properties of optical fibers. The core and cladding materials used determine the attenuation and chro-matic dispersion. The refractive index profile determines the mode dispersion and the core diameter is also responsible for the number of modes. Especially the core material and the index profile are at least recognizable from the name of the fiber, a designation method widely used in this book.
In the following section the historical development of the different polymer fibers is summarized. The POFs are dealt with in regard to their index profiles. Thereafter, different hybrid and glass fibers for short-range data transmission will also be introduced. The following chapter deals especially with the bandwidth of thick optical fibers since this characteristic is particularly important and also it makes the greatest demands on measurement techniques.
2.2.1 Step Index Profile Fibers (SI)
As was the case with silica glass fibers, the first polymer optical fibers were pure step index profile fibers (SI-POF). This means that a simple optical cladding sur-rounds a homogenous core. For this reason a protective material is always in-cluded in the cable. Figure 2.39 schematically represents the refractive index curve.
As already shown above, the refractive index step determines the numerical aperture (NA) and thus the acceptance angle. Some typical values are shown in Table 2.1. The refractive index of the core was always taken as 1.5, whereas the cladding has a correspondingly smaller refractive index. The last line is valid for wave guiding against air (n = 1). Here an acceptance angle of 90° is valid since the NA exceeds the value of 1.
ncore
jacket
optical cladding optical cladding
jacket core
ncladd
Fig. 2.39: Structure of a step index profile fiber
66 2.2 Index Profiles and Types of Fibers
Table 2.1: Relationship between relative refractive index difference and numerical aper-ture (core refractive index = 1.50)
Relative Refractive-Index-Difference
Refractive Index of the Cladding
Numerical Aperture
Acceptance Angle of the Fiber
0.22 % 1.497 0.10 6° 0.4 % 1.494 0.13 8° 0.8 % 1.488 0.19 11° 1.0 % 1.485 0.21 12° 1.5 % 1.478 0.26 15° 2.0 % 1.470 0.30 17° 2.7 % 1.460 0.35 20° 4.0 % 1.440 0.42 25° 5.8 % 1.413 0.50 30° 8.0 % 1.380 0.59 36° 12.0 % 1.320 0.71 45° 20.0 % 1.200 0.90 64° 33.3 % 1.000 1.12 90°
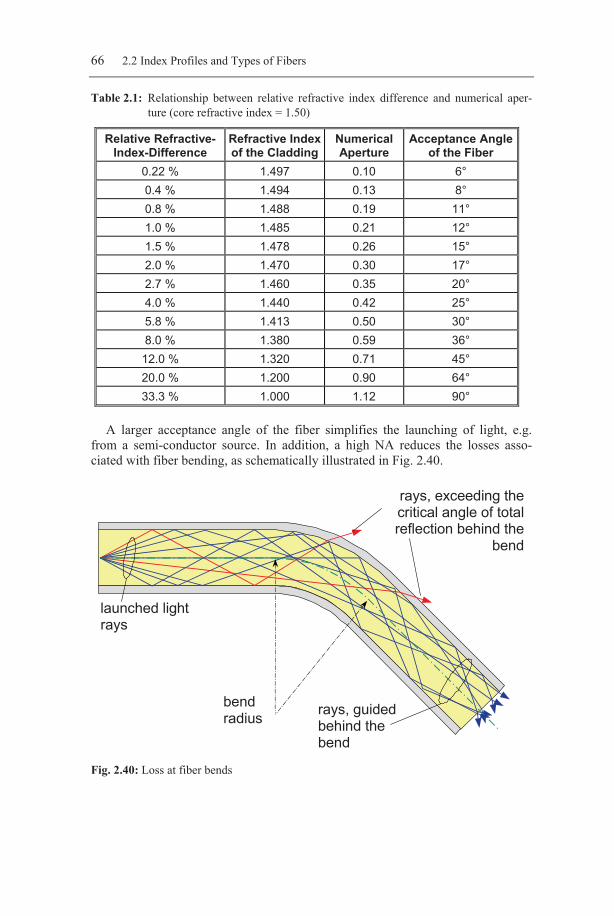
A larger acceptance angle of the fiber simplifies the launching of light, e.g.
from a semi-conductor source. In addition, a high NA reduces the losses asso-ciated with fiber bending, as schematically illustrated in Fig. 2.40.
launched light rays
rays, exceeding the critical angle of total reflection behind the
bend
rays, guided behind the bend
bend radius
Fig. 2.40: Loss at fiber bends
2.2 Index Profiles and Types of Fibers 67
Due to the effects of bending, the propagation direction of each individual ray is changed relative to the axis of the fiber. In the case of multi-mode fibers, a part of the rays is always extracted because the rays exceed the angle of total reflection at the interface between core and cladding. For fibers with a large NA, the effect of a change in angle for a certain amount of bending is not so significant so that the bending losses diminish. Likewise, when coupling fibers to each other (at connectors) the loss due to angle errors is less significant when there is a large numerical aperture.
A disadvantage of fibers with a large NA is the greater difference in time delay between the different light paths, and this in turn leads to a greater level of mode dispersion. This limits the bandwidth. In addition, the loss at coupling points in-creases if there is a gap between the abutting faces. Some advantages of larger or smaller numerical apertures are listed in Table 2.2.
Table 2.2: Influence of higher NA to various fiber parameters
Property of the Fiber Behavior with increasing NA bending sensitivity becomes smaller fiber coupled power becomes higher connecting loss for fiber angular mismatch becomes smaller connecting loss for axial fiber gap becomes higher connecting loss for fiber axis lateral gap becomes higher bandwidth becomes smaller
Silica glass multi-mode fibers usually have an NA of approximately 0.20. Silica
glass fibers with polymer cladding have an NA in the range of 0.30 to 0.40 (some-times 0.65). The large refractive index difference between the materials that are used for the core and the cladding of polymer fibers allows significantly higher NA values. The majority of the initially produced SI-POF had an NA of 0.50 (e.g. [Asa96], [Esk97], [LC95]). SI-POF with an NA around this value are nowadays generally called standard NA-POF or standard POF for short. The bandwidth of such fibers is approximately 40 MHz for a 100 m long link (quoted as the band-width-length product 40 MHz · 100 m). For many years this was a completely satisfactory solution for most applications.
2.2.2 The Step Index Fiber with Reduced NA (low-NA)
However, when it became necessary to replace copper cables with polymer optical fiber to accomplish the transmission of ATM data rates of 155 Mbit/s (ATM: asynchronous transfer mode) over a distance of 50 m, a higher bandwidth was required for the POF. In the mid-nineties all three important manufacturers deve-loped the so-called low-NA POF.
POF with a reduced numerical aperture (low-NA POF) feature a bandwidth increased to approximately 100 MHz · 100 m because the NA has been reduced to approximately 0.30. The first low-NA POF was presented in 1995 by Mitsubishi
68 2.2 Index Profiles and Types of Fibers
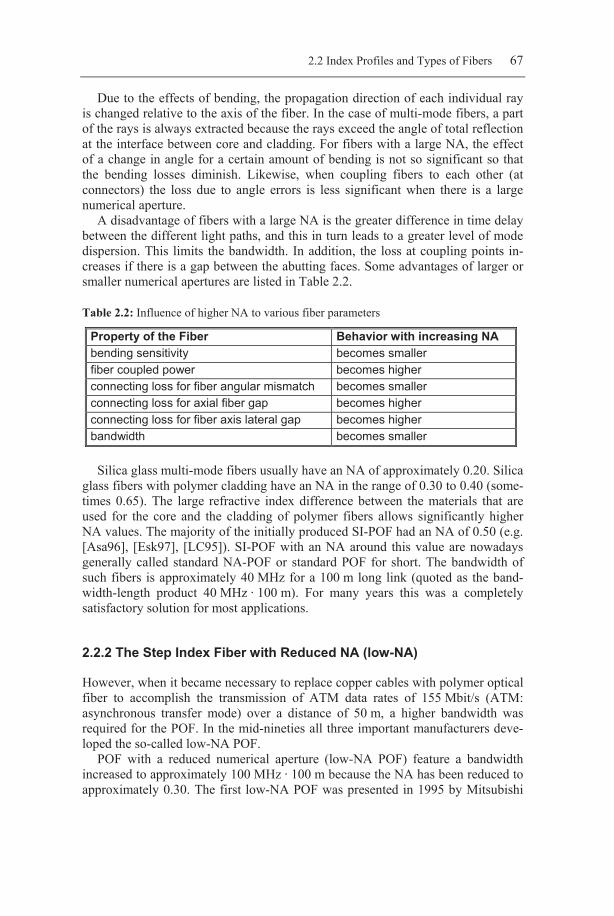
Rayon ([Koi98]). Figure 2.41 shows that the fiber construction corresponds to the standard POF, the distinction being that the refractive index difference is smaller (approximately 2 %). Usually the same core material is used, but the cladding material has a modified composition.
ncore
jacket
optical cladding optical cladding
jacket core
ncladding
Fig. 2.41: Structure of a low-NA step index profile fiber
Unfortunately, practical testing showed that although this fiber met the require-ments of the ATM forum ([ATM96b]) with respect to bandwidth, it did not meet the requirements with respect to bending sensitivity. These requirements specify that for a 50 m long POF link the losses resulting from a maximum of ten 90° bends having a minimum bending radius of 25 mm should not exceed 0.5 dB. In order to meet both these requirements at the same time it became necessary to find a new structure.
2.2.3 The Double-Step Index Optical Fiber (DSI)
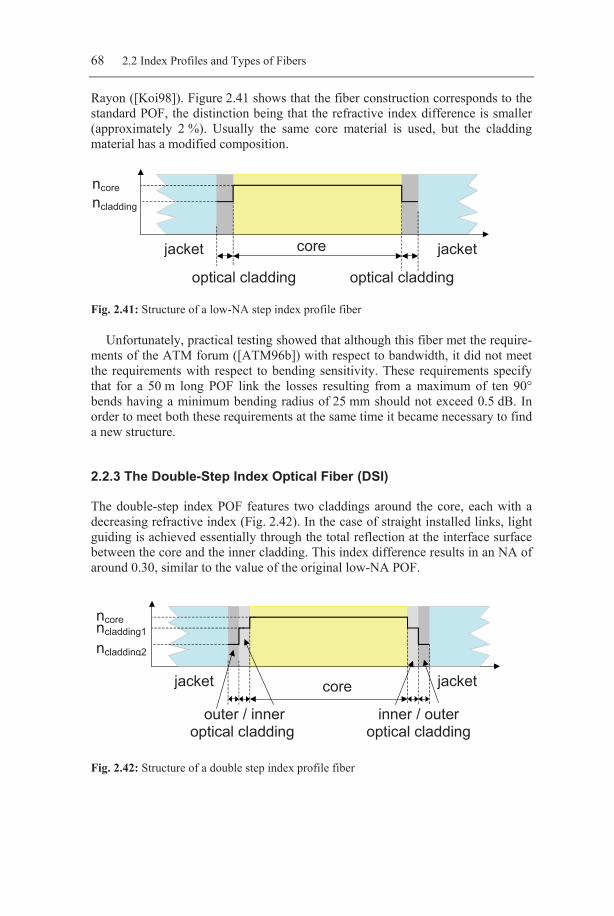
The double-step index POF features two claddings around the core, each with a decreasing refractive index (Fig. 2.42). In the case of straight installed links, light guiding is achieved essentially through the total reflection at the interface surface between the core and the inner cladding. This index difference results in an NA of around 0.30, similar to the value of the original low-NA POF.
ncore
jacket
inner / outer optical cladding
outer / inner optical cladding
jacket core
ncladding1
ncladding2
Fig. 2.42: Structure of a double step index profile fiber
2.2 Index Profiles and Types of Fibers 69
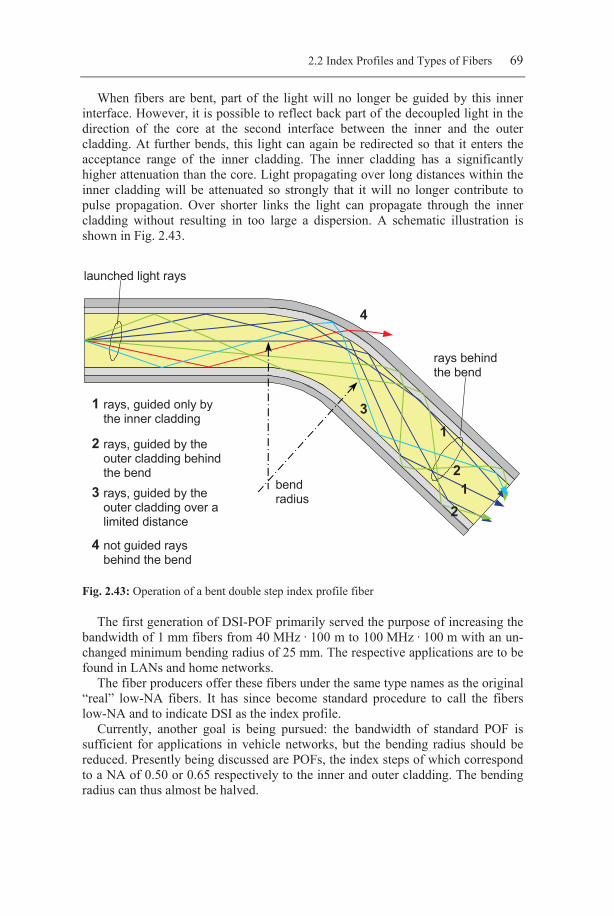
When fibers are bent, part of the light will no longer be guided by this inner interface. However, it is possible to reflect back part of the decoupled light in the direction of the core at the second interface between the inner and the outer cladding. At further bends, this light can again be redirected so that it enters the acceptance range of the inner cladding. The inner cladding has a significantly higher attenuation than the core. Light propagating over long distances within the inner cladding will be attenuated so strongly that it will no longer contribute to pulse propagation. Over shorter links the light can propagate through the inner cladding without resulting in too large a dispersion. A schematic illustration is shown in Fig. 2.43.
launched light rays
rays behind the bend
bend radius
1
2
3
4
1
1 2
2
3
4
rays, guided only by the inner cladding
rays, guided by the outer cladding behind the bend rays, guided by the outer cladding over a limited distance
not guided rays behind the bend
Fig. 2.43: Operation of a bent double step index profile fiber
The first generation of DSI-POF primarily served the purpose of increasing the bandwidth of 1 mm fibers from 40 MHz · 100 m to 100 MHz · 100 m with an un-changed minimum bending radius of 25 mm. The respective applications are to be found in LANs and home networks.
The fiber producers offer these fibers under the same type names as the original “real” low-NA fibers. It has since become standard procedure to call the fibers low-NA and to indicate DSI as the index profile.
Currently, another goal is being pursued: the bandwidth of standard POF is sufficient for applications in vehicle networks, but the bending radius should be reduced. Presently being discussed are POFs, the index steps of which correspond to a NA of 0.50 or 0.65 respectively to the inner and outer cladding. The bending radius can thus almost be halved.
70 2.2 Index Profiles and Types of Fibers
2.2.4 The Multi-Core Step Index Optical Fiber (MC)
As described above, the requirements of high bandwidth and low sensitivity to bending are difficult to accomplish together within one and the same fiber having a diameter of 1 mm. Fibers with a smaller core diameter can solve this problem since the ratio to the fiber radius is larger for the same absolute bending radius. However, this contradicts the requirements for easy handling and light launching. A PCS with a core diameter of 200 μm and an AN = 0.37 permits, for example, a bending radius of 5 mm with very low bending losses.
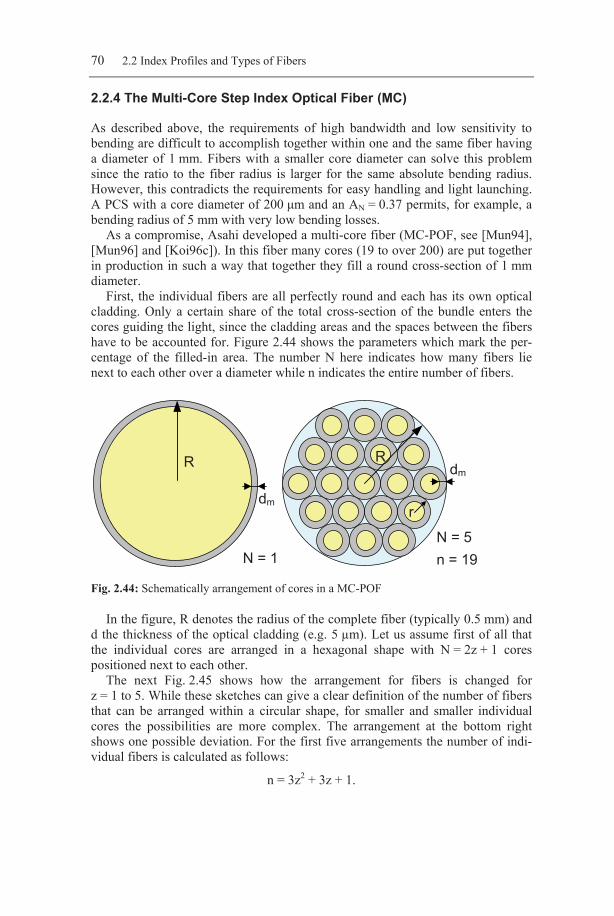
As a compromise, Asahi developed a multi-core fiber (MC-POF, see [Mun94], [Mun96] and [Koi96c]). In this fiber many cores (19 to over 200) are put together in production in such a way that together they fill a round cross-section of 1 mm diameter.
First, the individual fibers are all perfectly round and each has its own optical cladding. Only a certain share of the total cross-section of the bundle enters the cores guiding the light, since the cladding areas and the spaces between the fibers have to be accounted for. Figure 2.44 shows the parameters which mark the per-centage of the filled-in area. The number N here indicates how many fibers lie next to each other over a diameter while n indicates the entire number of fibers.
R
dm
Rdm
N = 1 N = 5 n = 19
r
Fig. 2.44: Schematically arrangement of cores in a MC-POF
In the figure, R denotes the radius of the complete fiber (typically 0.5 mm) and d the thickness of the optical cladding (e.g. 5 µm). Let us assume first of all that the individual cores are arranged in a hexagonal shape with N = 2z + 1 cores positioned next to each other.
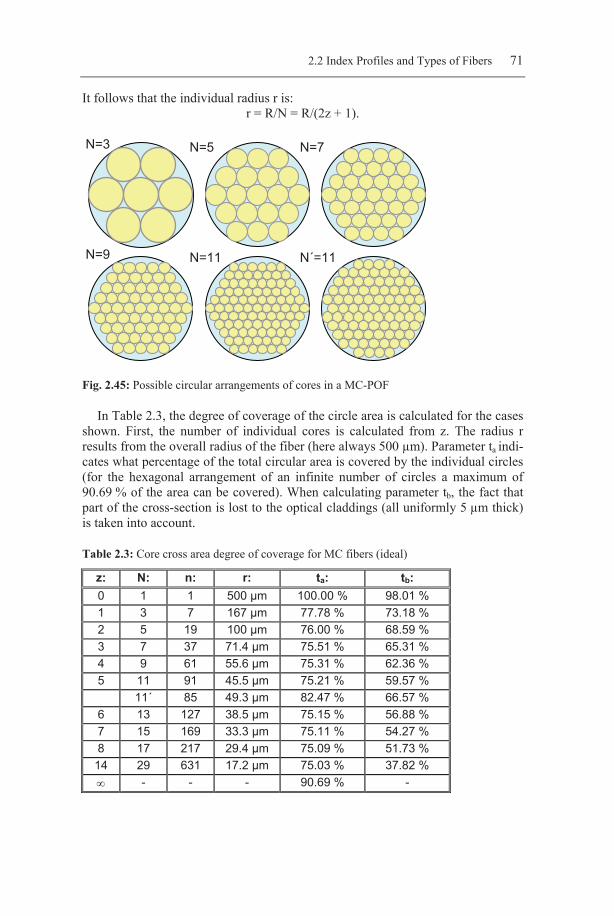
The next Fig. 2.45 shows how the arrangement for fibers is changed for z = 1 to 5. While these sketches can give a clear definition of the number of fibers that can be arranged within a circular shape, for smaller and smaller individual cores the possibilities are more complex. The arrangement at the bottom right shows one possible deviation. For the first five arrangements the number of indi-vidual fibers is calculated as follows:
n = 3z2 + 3z + 1.
2.2 Index Profiles and Types of Fibers 71
It follows that the individual radius r is: r = R/N = R/(2z + 1).
N=3
N=9
N=5
N=11
N=7
N´=11
Fig. 2.45: Possible circular arrangements of cores in a MC-POF
In Table 2.3, the degree of coverage of the circle area is calculated for the cases shown. First, the number of individual cores is calculated from z. The radius r results from the overall radius of the fiber (here always 500 µm). Parameter ta indi-cates what percentage of the total circular area is covered by the individual circles (for the hexagonal arrangement of an infinite number of circles a maximum of 90.69 % of the area can be covered). When calculating parameter tb, the fact that part of the cross-section is lost to the optical claddings (all uniformly 5 µm thick) is taken into account.
Table 2.3: Core cross area degree of coverage for MC fibers (ideal)
z: N: n: r: ta: tb: 0 1 1 500 µm 100.00 % 98.01 % 1 3 7 167 µm 77.78 % 73.18 % 2 5 19 100 µm 76.00 % 68.59 % 3 7 37 71.4 µm 75.51 % 65.31 % 4 9 61 55.6 µm 75.31 % 62.36 % 5 11 91 45.5 µm 75.21 % 59.57 % 11´ 85 49.3 µm 82.47 % 66.57 % 6 13 127 38.5 µm 75.15 % 56.88 % 7 15 169 33.3 µm 75.11 % 54.27 % 8 17 217 29.4 µm 75.09 % 51.73 %
14 29 631 17.2 µm 75.03 % 37.82 % ∞ - - - 90.69 % -

72 2.2 Index Profiles and Types of Fibers
Figure 2.46 shows the proportion of core area tb as depending on the number of cores for four different thickness’ of the optical cladding.
0%
20%
40%
60%
80%
100%
1 7 19 37 61 91 127 169 217
dm = 5 µmdm = 10 µm
dm = 20 µm dm = 30 µm
use of the total cross area tb
number of single cores
Fig. 2.46: Proportion of core area for different cladding thickness
As can be expected, the proportion of the overall covered area decreases with an increasing number of cores because the proportion of cladding area will be-come larger and larger. A certain minimum thickness of cladding is necessary for it to be able to fulfill its function and still be technologically feasible. The four individual data points show the case of the optimized fiber arrangement with 85 individual cores in accordance with Fig. 2.45.
Given a minimum thickness of the optical cladding between 5 µm and 10 µm, these considerations indicate that a maximum number of some 100 single cores should be used, in which case the proportion of useable area will hardly exceed 70 %. It is easy to conclude that a smaller proportion of useable core area would lead to an increase in the losses encountered when connecting transmitters to, and fibers between each other.
Fig. 2.47: 37 core POF with deformed single cores (schematically)

2.2 Index Profiles and Types of Fibers 73
Practical experience shows that a better utilization of the area can be achieved. During the manufacturing process the fibers are placed together at higher tempe-ratures which means that they change their shape and thus reduce the gaps bet-ween the fibers. Apparently, the resulting deviations from the ideal round shape do not play a significant role in light propagation (the causes for this are not yet completely understood; some points worth discussing can be found in the chapter on light propagation in POF). Figure 2.47 shows a schematic illustration of the cross-section of a fiber with 37 cores, such as e.g. in [Tesh98]. Data of available MC-POF and -GOF are grouped together later.
Figure 2.48 shows the refractive index profile of a MC-POF, shown as a cross-section through the diameter of the fiber. The index steps correspond to those of a standard POF.
ncore
jacket
optical cladding
jacket cores
ncladding
optical cladding
Fig. 2.48: Structure of a step index multi core fiber
Since the bandwidth only depends on the NA for SI fibers, it should be possible to measure values comparable to the standard POF. However, the fact is that the measured values are actually significantly higher, which has been explained in the chapter 2.1.5.2 discussing mode-selective attenuation mechanisms.
Glass fibers are also produced for use in many areas as fiber bundles. In lighting technology fiber glass bundles with a large NA are widely spread. (The lighting of the headlight outer ring at BMW via such a fiber bundle is well-known.) In the meantime, such fibers are also available for data communication ([Lub04b]).
2.2.5 The Double Step Index Multi-Core Fiber (DSI-MC)
In the MC-POF, too, an increase in bandwidth was achieved by reducing the index difference. Due to the smaller core diameters it was still possible to avoid an increase in bending sensitivity.
Even better values were achieved with individual cores having a two-step optical cladding such as illustrated in Fig. 2.49. The principle is the same as in the double-step index POF with an individual core. In this case a bundle with single cladding is completely surrounded by a second cladding material (“sea/islands” structure).
74 2.2 Index Profiles and Types of Fibers
ncore
jacket
outer / inner optical cladding
jacket cores
ncladding1ncladding2
Fig. 2.49: Structure of a double step index profile multi core POF
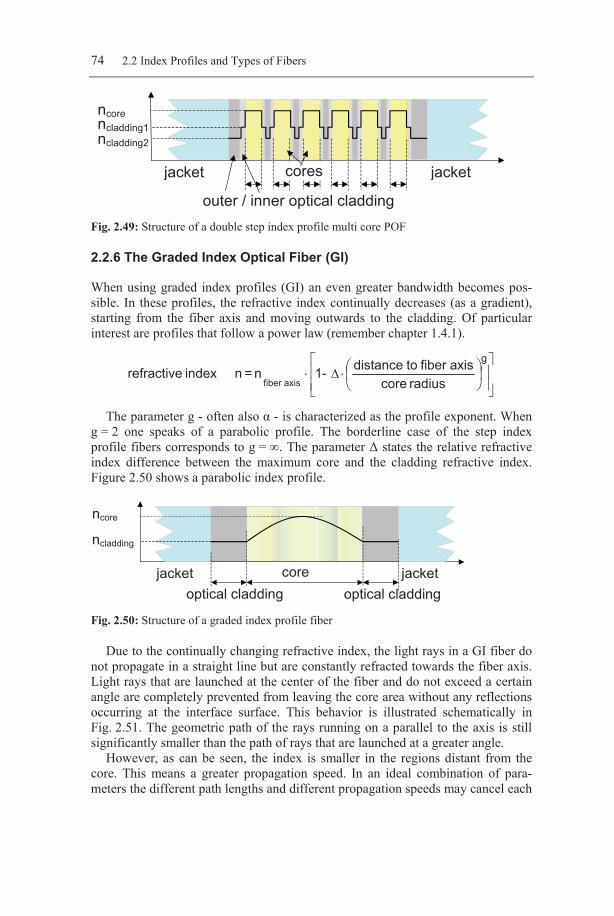
2.2.6 The Graded Index Optical Fiber (GI)
When using graded index profiles (GI) an even greater bandwidth becomes pos-sible. In these profiles, the refractive index continually decreases (as a gradient), starting from the fiber axis and moving outwards to the cladding. Of particular interest are profiles that follow a power law (remember chapter 1.4.1).
⎥⎥⎦
⎤
⎢⎢⎣
⎡⎟⎠⎞
⎜⎝⎛⋅Δ⋅
g
radius coreaxis fiber to distance-1n = nindex refractive
axis fiber
The parameter g - often also α - is characterized as the profile exponent. When g = 2 one speaks of a parabolic profile. The borderline case of the step index profile fibers corresponds to g = ∞. The parameter Δ states the relative refractive index difference between the maximum core and the cladding refractive index. Figure 2.50 shows a parabolic index profile.
ncore
jacket optical cladding
jacket core
ncladding
optical cladding Fig. 2.50: Structure of a graded index profile fiber
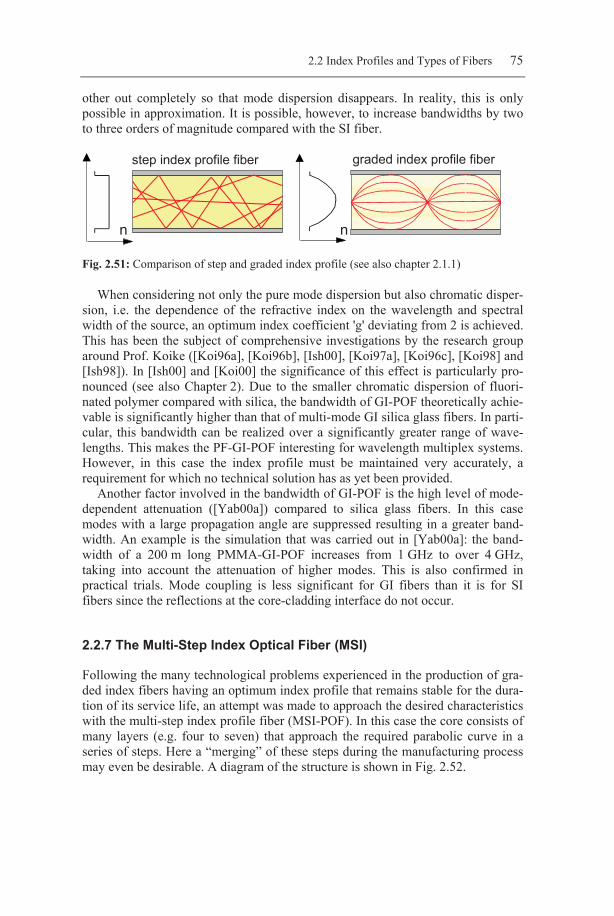
Due to the continually changing refractive index, the light rays in a GI fiber do not propagate in a straight line but are constantly refracted towards the fiber axis. Light rays that are launched at the center of the fiber and do not exceed a certain angle are completely prevented from leaving the core area without any reflections occurring at the interface surface. This behavior is illustrated schematically in Fig. 2.51. The geometric path of the rays running on a parallel to the axis is still significantly smaller than the path of rays that are launched at a greater angle.
However, as can be seen, the index is smaller in the regions distant from the core. This means a greater propagation speed. In an ideal combination of para-meters the different path lengths and different propagation speeds may cancel each
2.2 Index Profiles and Types of Fibers 75
other out completely so that mode dispersion disappears. In reality, this is only possible in approximation. It is possible, however, to increase bandwidths by two to three orders of magnitude compared with the SI fiber.
n
step index profile fiber graded index profile fiber
n
Fig. 2.51: Comparison of step and graded index profile (see also chapter 2.1.1)
When considering not only the pure mode dispersion but also chromatic disper-sion, i.e. the dependence of the refractive index on the wavelength and spectral width of the source, an optimum index coefficient 'g' deviating from 2 is achieved. This has been the subject of comprehensive investigations by the research group around Prof. Koike ([Koi96a], [Koi96b], [Ish00], [Koi97a], [Koi96c], [Koi98] and [Ish98]). In [Ish00] and [Koi00] the significance of this effect is particularly pro-nounced (see also Chapter 2). Due to the smaller chromatic dispersion of fluori-nated polymer compared with silica, the bandwidth of GI-POF theoretically achie-vable is significantly higher than that of multi-mode GI silica glass fibers. In parti-cular, this bandwidth can be realized over a significantly greater range of wave-lengths. This makes the PF-GI-POF interesting for wavelength multiplex systems. However, in this case the index profile must be maintained very accurately, a requirement for which no technical solution has as yet been provided.
Another factor involved in the bandwidth of GI-POF is the high level of mode-dependent attenuation ([Yab00a]) compared to silica glass fibers. In this case modes with a large propagation angle are suppressed resulting in a greater band-width. An example is the simulation that was carried out in [Yab00a]: the band-width of a 200 m long PMMA-GI-POF increases from 1 GHz to over 4 GHz, taking into account the attenuation of higher modes. This is also confirmed in practical trials. Mode coupling is less significant for GI fibers than it is for SI fibers since the reflections at the core-cladding interface do not occur.
2.2.7 The Multi-Step Index Optical Fiber (MSI)
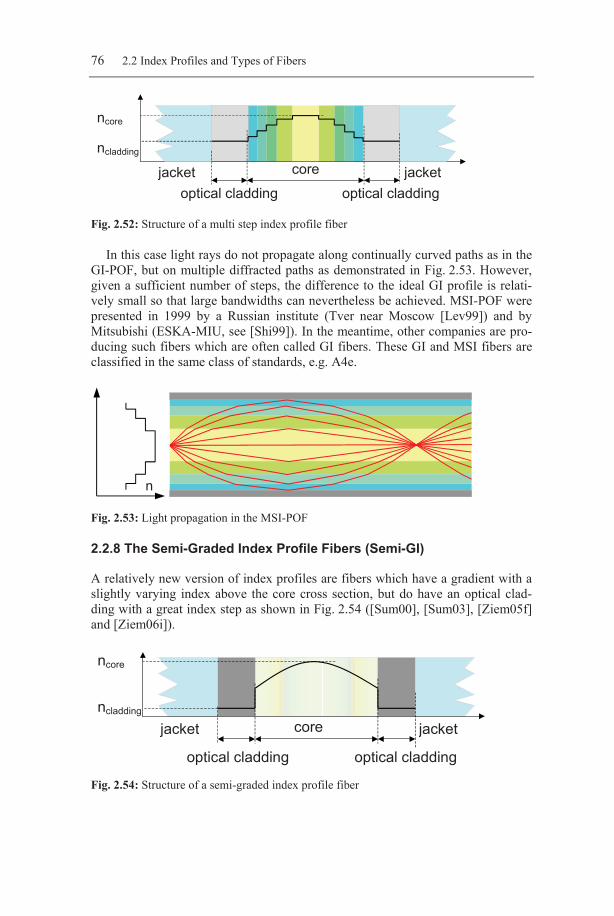
Following the many technological problems experienced in the production of gra-ded index fibers having an optimum index profile that remains stable for the dura-tion of its service life, an attempt was made to approach the desired characteristics with the multi-step index profile fiber (MSI-POF). In this case the core consists of many layers (e.g. four to seven) that approach the required parabolic curve in a series of steps. Here a “merging” of these steps during the manufacturing process may even be desirable. A diagram of the structure is shown in Fig. 2.52.
76 2.2 Index Profiles and Types of Fibers
ncore
jacket optical cladding optical cladding
jacket core ncladding
Fig. 2.52: Structure of a multi step index profile fiber
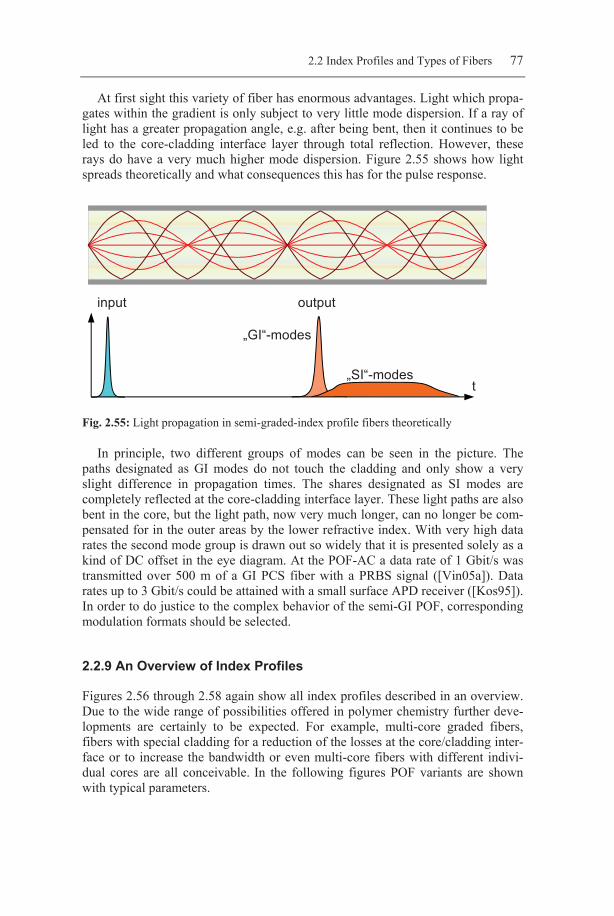
In this case light rays do not propagate along continually curved paths as in the GI-POF, but on multiple diffracted paths as demonstrated in Fig. 2.53. However, given a sufficient number of steps, the difference to the ideal GI profile is relati-vely small so that large bandwidths can nevertheless be achieved. MSI-POF were presented in 1999 by a Russian institute (Tver near Moscow [Lev99]) and by Mitsubishi (ESKA-MIU, see [Shi99]). In the meantime, other companies are pro-ducing such fibers which are often called GI fibers. These GI and MSI fibers are classified in the same class of standards, e.g. A4e.
n
Fig. 2.53: Light propagation in the MSI-POF
2.2.8 The Semi-Graded Index Profile Fibers (Semi-GI)
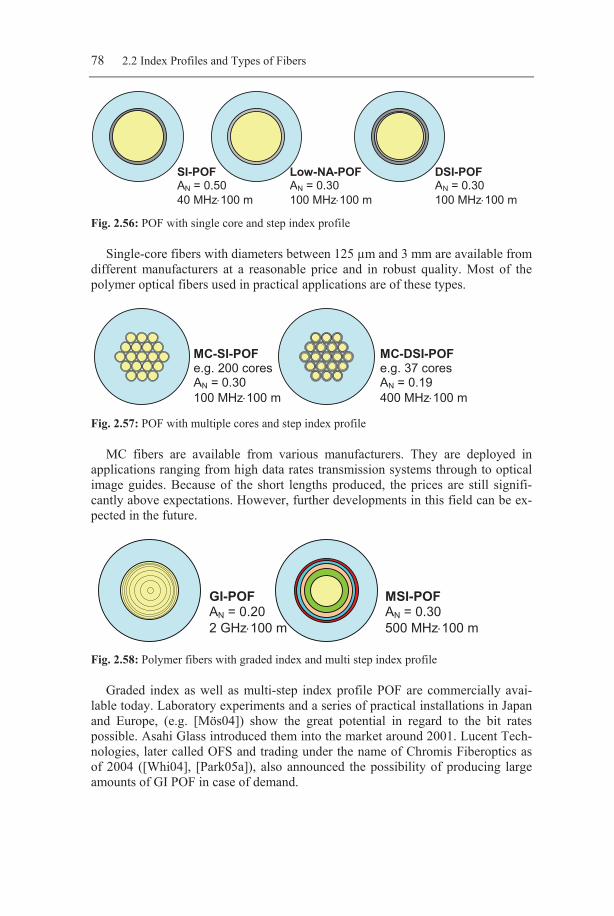
A relatively new version of index profiles are fibers which have a gradient with a slightly varying index above the core cross section, but do have an optical clad-ding with a great index step as shown in Fig. 2.54 ([Sum00], [Sum03], [Ziem05f] and [Ziem06i]). ncore
jacket
optical cladding optical cladding
jacket core ncladding
Fig. 2.54: Structure of a semi-graded index profile fiber
2.2 Index Profiles and Types of Fibers 77
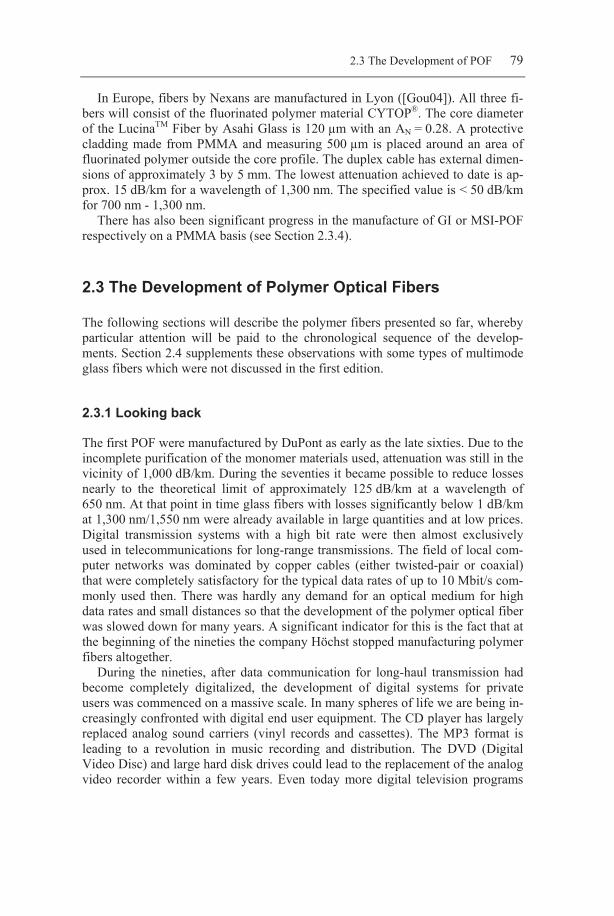
At first sight this variety of fiber has enormous advantages. Light which propa-gates within the gradient is only subject to very little mode dispersion. If a ray of light has a greater propagation angle, e.g. after being bent, then it continues to be led to the core-cladding interface layer through total reflection. However, these rays do have a very much higher mode dispersion. Figure 2.55 shows how light spreads theoretically and what consequences this has for the pulse response.
input output
„GI“-modes
„SI“-modest
Fig. 2.55: Light propagation in semi-graded-index profile fibers theoretically
In principle, two different groups of modes can be seen in the picture. The paths designated as GI modes do not touch the cladding and only show a very slight difference in propagation times. The shares designated as SI modes are completely reflected at the core-cladding interface layer. These light paths are also bent in the core, but the light path, now very much longer, can no longer be com-pensated for in the outer areas by the lower refractive index. With very high data rates the second mode group is drawn out so widely that it is presented solely as a kind of DC offset in the eye diagram. At the POF-AC a data rate of 1 Gbit/s was transmitted over 500 m of a GI PCS fiber with a PRBS signal ([Vin05a]). Data rates up to 3 Gbit/s could be attained with a small surface APD receiver ([Kos95]). In order to do justice to the complex behavior of the semi-GI POF, corresponding modulation formats should be selected.
2.2.9 An Overview of Index Profiles
Figures 2.56 through 2.58 again show all index profiles described in an overview. Due to the wide range of possibilities offered in polymer chemistry further deve-lopments are certainly to be expected. For example, multi-core graded fibers, fibers with special cladding for a reduction of the losses at the core/cladding inter-face or to increase the bandwidth or even multi-core fibers with different indivi-dual cores are all conceivable. In the following figures POF variants are shown with typical parameters.
78 2.2 Index Profiles and Types of Fibers
Low-NA-POF AN = 0.30 100 MHz⋅100 m
DSI-POF AN = 0.30 100 MHz⋅100 m
SI-POF AN = 0.50 40 MHz⋅100 m
Fig. 2.56: POF with single core and step index profile
Single-core fibers with diameters between 125 µm and 3 mm are available from different manufacturers at a reasonable price and in robust quality. Most of the polymer optical fibers used in practical applications are of these types.
MC-SI-POF e.g. 200 cores AN = 0.30 100 MHz⋅100 m
MC-DSI-POF e.g. 37 cores AN = 0.19 400 MHz⋅100 m
Fig. 2.57: POF with multiple cores and step index profile
MC fibers are available from various manufacturers. They are deployed in applications ranging from high data rates transmission systems through to optical image guides. Because of the short lengths produced, the prices are still signifi-cantly above expectations. However, further developments in this field can be ex-pected in the future.
GI-POF AN = 0.20 2 GHz⋅100 m
MSI-POF AN = 0.30 500 MHz⋅100 m
Fig. 2.58: Polymer fibers with graded index and multi step index profile
Graded index as well as multi-step index profile POF are commercially avai-lable today. Laboratory experiments and a series of practical installations in Japan and Europe, (e.g. [Mös04]) show the great potential in regard to the bit rates possible. Asahi Glass introduced them into the market around 2001. Lucent Tech-nologies, later called OFS and trading under the name of Chromis Fiberoptics as of 2004 ([Whi04], [Park05a]), also announced the possibility of producing large amounts of GI POF in case of demand.
2.3 The Development of POF 79
In Europe, fibers by Nexans are manufactured in Lyon ([Gou04]). All three fi-bers will consist of the fluorinated polymer material CYTOP®. The core diameter of the LucinaTM Fiber by Asahi Glass is 120 µm with an AN = 0.28. A protective cladding made from PMMA and measuring 500 µm is placed around an area of fluorinated polymer outside the core profile. The duplex cable has external dimen-sions of approximately 3 by 5 mm. The lowest attenuation achieved to date is ap-prox. 15 dB/km for a wavelength of 1,300 nm. The specified value is < 50 dB/km for 700 nm - 1,300 nm.
There has also been significant progress in the manufacture of GI or MSI-POF respectively on a PMMA basis (see Section 2.3.4).
2.3 The Development of Polymer Optical Fibers
The following sections will describe the polymer fibers presented so far, whereby particular attention will be paid to the chronological sequence of the develop-ments. Section 2.4 supplements these observations with some types of multimode glass fibers which were not discussed in the first edition.
2.3.1 Looking back
The first POF were manufactured by DuPont as early as the late sixties. Due to the incomplete purification of the monomer materials used, attenuation was still in the vicinity of 1,000 dB/km. During the seventies it became possible to reduce losses nearly to the theoretical limit of approximately 125 dB/km at a wavelength of 650 nm. At that point in time glass fibers with losses significantly below 1 dB/km at 1,300 nm/1,550 nm were already available in large quantities and at low prices. Digital transmission systems with a high bit rate were then almost exclusively used in telecommunications for long-range transmissions. The field of local com-puter networks was dominated by copper cables (either twisted-pair or coaxial) that were completely satisfactory for the typical data rates of up to 10 Mbit/s com-monly used then. There was hardly any demand for an optical medium for high data rates and small distances so that the development of the polymer optical fiber was slowed down for many years. A significant indicator for this is the fact that at the beginning of the nineties the company Höchst stopped manufacturing polymer fibers altogether.
During the nineties, after data communication for long-haul transmission had become completely digitalized, the development of digital systems for private users was commenced on a massive scale. In many spheres of life we are being in-creasingly confronted with digital end user equipment. The CD player has largely replaced analog sound carriers (vinyl records and cassettes). The MP3 format is leading to a revolution in music recording and distribution. The DVD (Digital Video Disc) and large hard disk drives could lead to the replacement of the analog video recorder within a few years. Even today more digital television programs

http://www.springer.com/978-3-540-76628-5