Embed Size (px)
Citation preview

2.1 - 1Copyright © 2013, 2009, 2005 Pearson Education, Inc. 1
2Graphs and Functions
Copyright © 2013, 2009, 2005 Pearson Education, Inc.

Copyright © 2013, 2009, 2005 Pearson Education, Inc. 2
2.1Rectangular Coordinates and Graphs
• Ordered Pairs• The Rectangular Coordinate System• The Distance Formula• The Midpoint formula• Graphing Equations in Two Variables
Copyright © 2013, 2009, 2005 Pearson Education, Inc. 3
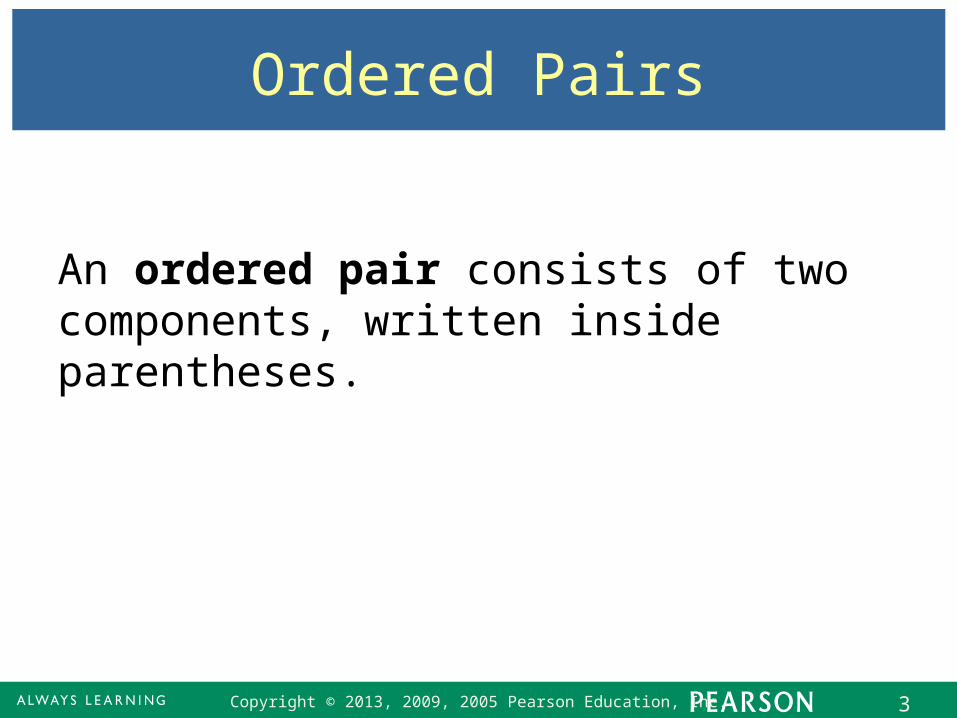
Ordered Pairs
An ordered pair consists of two components, written inside parentheses.
Copyright © 2013, 2009, 2005 Pearson Education, Inc. 4
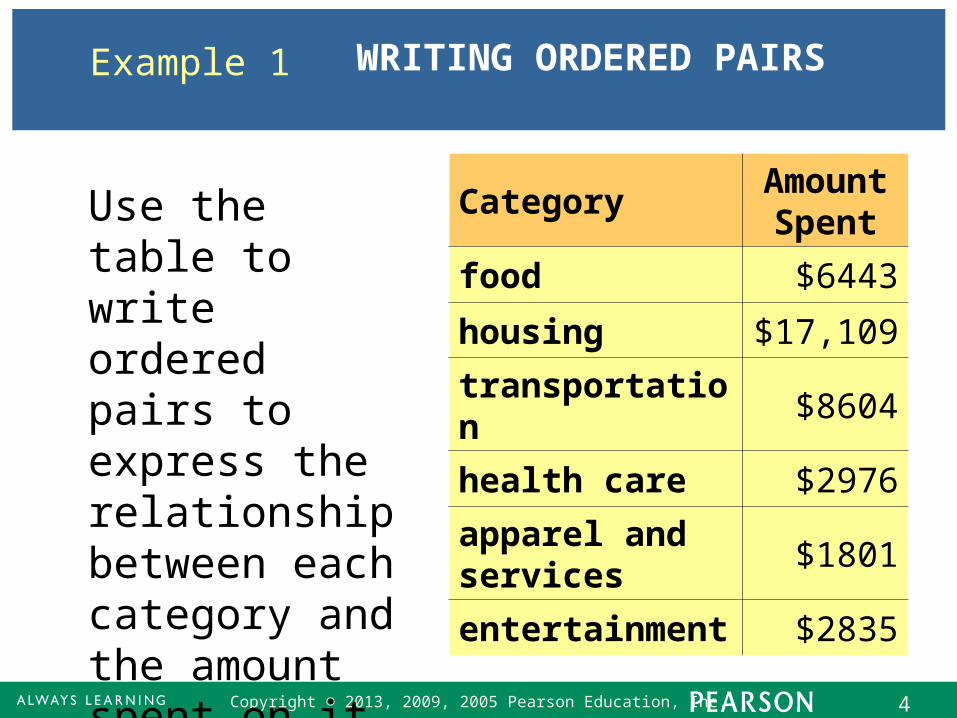
Example 1 WRITING ORDERED PAIRS
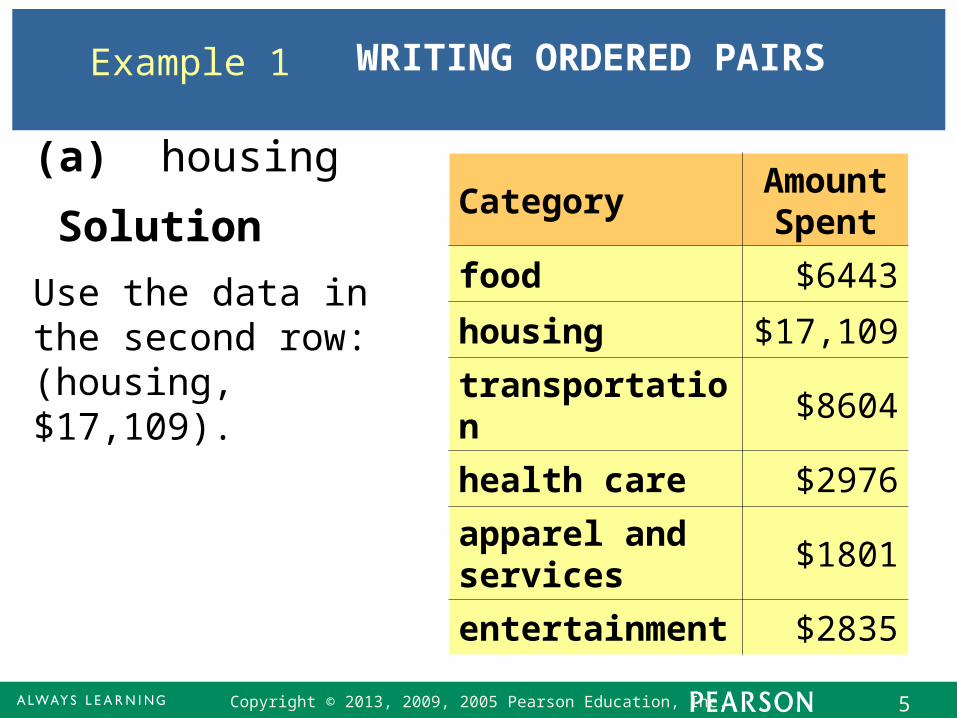
CategoryAmount Spent
food $6443
housing $17,109
transportation $8604
health care $2976
apparel and services
$1801
entertainment $2835
Use the table to write ordered pairs to express the relationship between each category and the amount spent on it.
Copyright © 2013, 2009, 2005 Pearson Education, Inc. 5
Example 1 WRITING ORDERED PAIRS
Solution
(a) housing
Use the data in the second row: (housing, $17,109).
CategoryAmount Spent
food $6443
housing $17,109
transportation $8604
health care $2976
apparel and services
$1801
entertainment $2835
Copyright © 2013, 2009, 2005 Pearson Education, Inc. 6
Example 1 WRITING ORDERED PAIRS
Solution
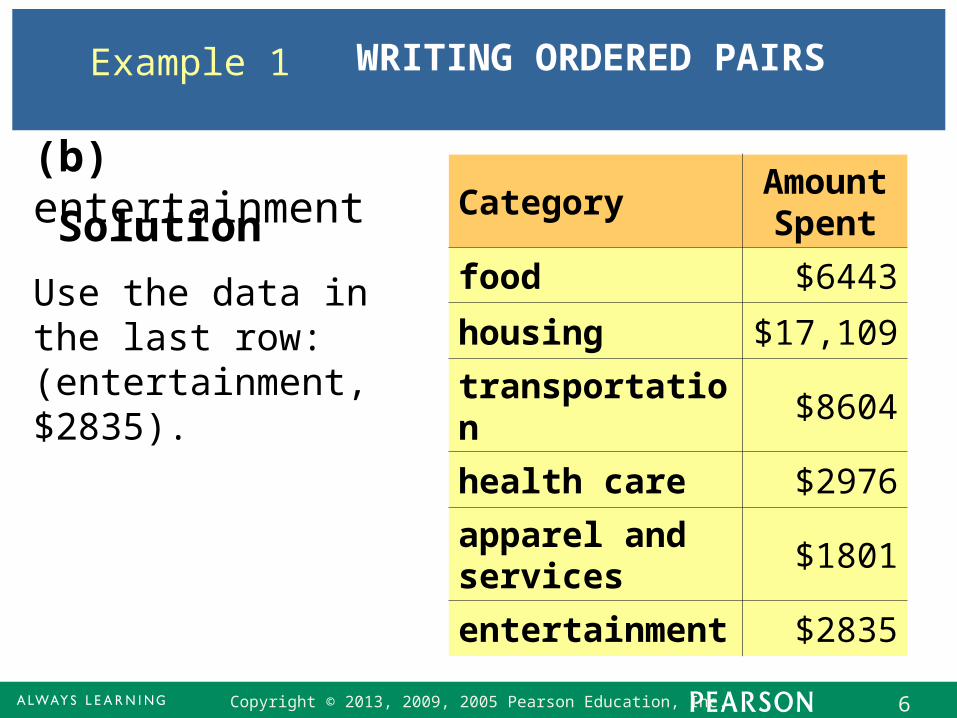
(b) entertainment
Use the data in the last row: (entertainment, $2835).
CategoryAmount Spent
food $6443
housing $17,109
transportation $8604
health care $2976
apparel and services
$1801
entertainment $2835

2.1 - 7Copyright © 2013, 2009, 2005 Pearson Education, Inc. 7
The Rectangular Coordinate System
Quadrant IQuadrant II
Quadrant III Quadrant IV
0x-axis
y-axis
a
bP(a, b)
Copyright © 2013, 2009, 2005 Pearson Education, Inc. 8
The Distance Formula
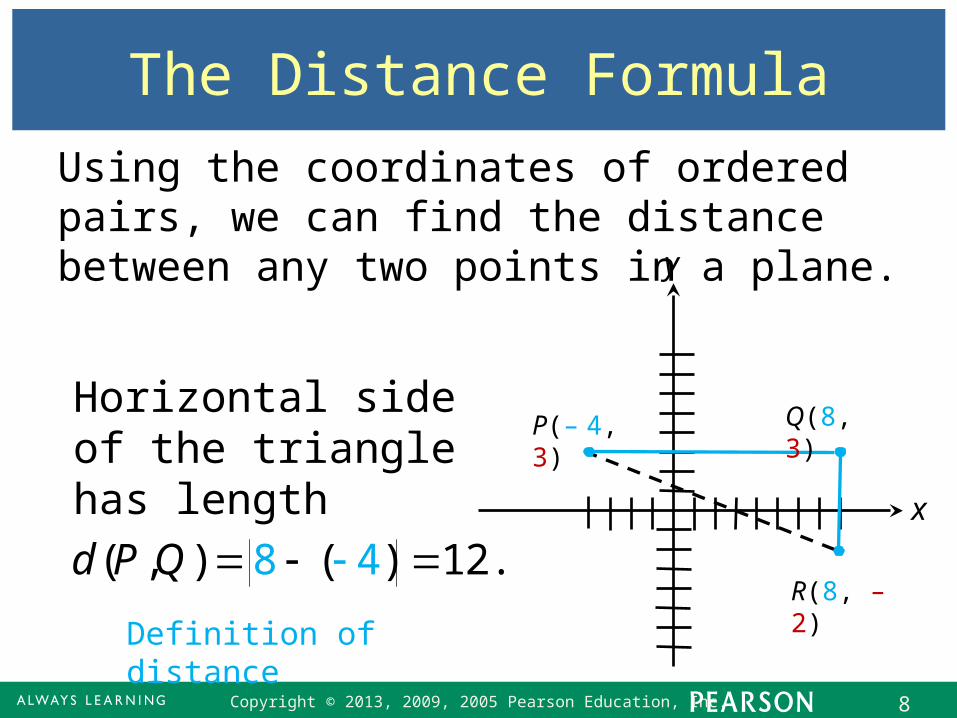
Using the coordinates of ordered pairs, we can find the distance between any two points in a plane.
P(– 4, 3) Q(8, 3)
R(8, – 2)8( , ) ( ) 12.4d P Q
Horizontal side of the triangle has length
Definition of distance
x
y
Copyright © 2013, 2009, 2005 Pearson Education, Inc. 9
The Distance Formula
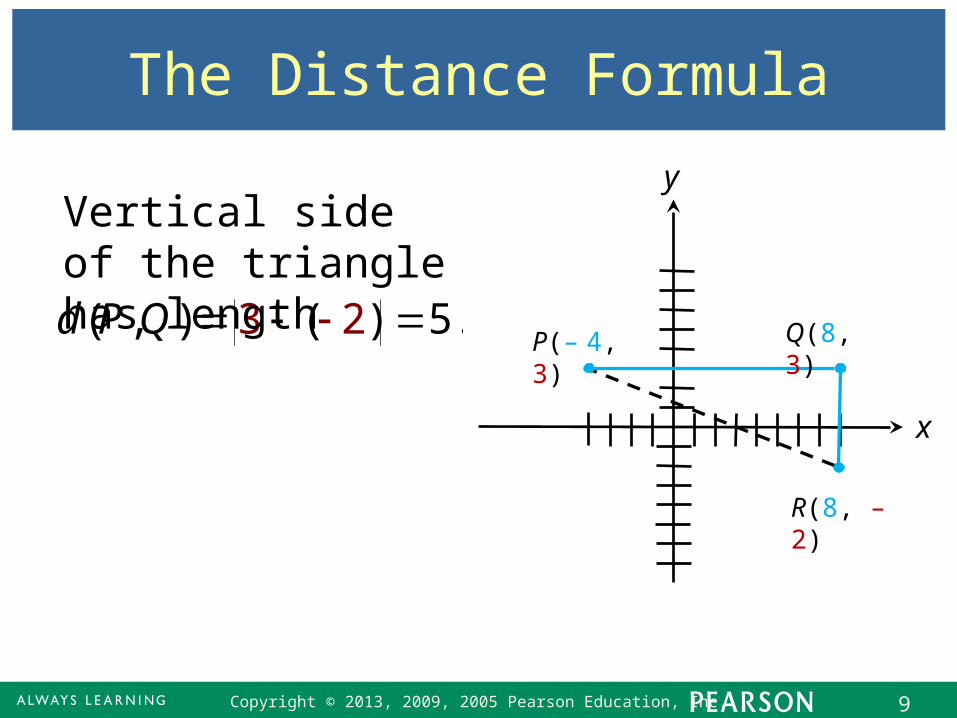
P(– 4, 3) Q(8, 3)
R(8, – 2)
( , ) ( ) 53 2 .d P Q
Vertical side of the triangle has length
x
y
Copyright © 2013, 2009, 2005 Pearson Education, Inc. 10
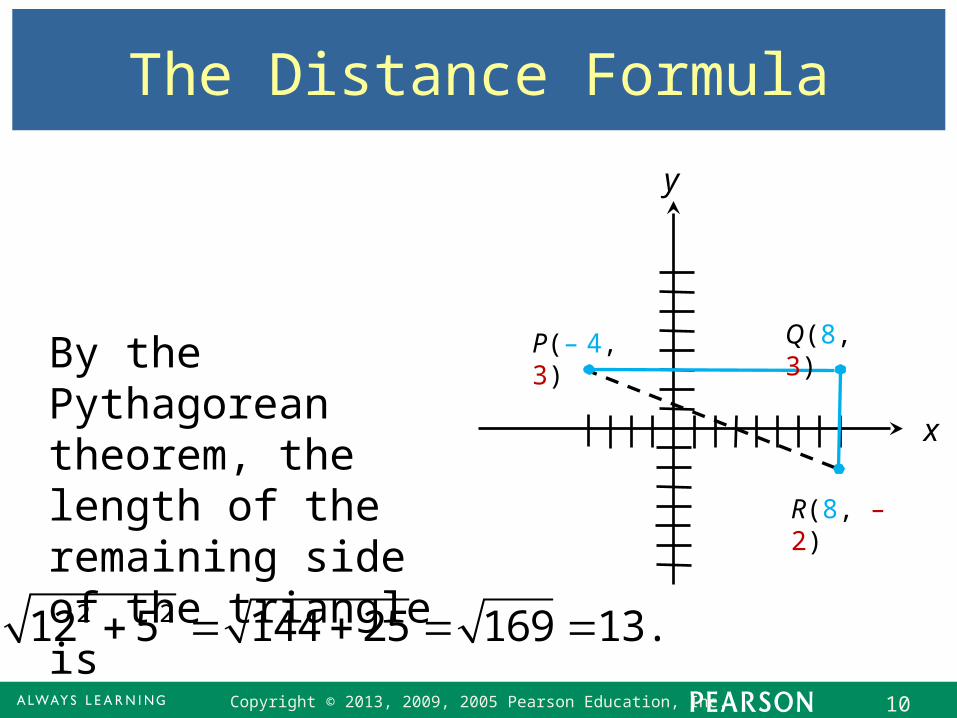
The Distance Formula
P(– 4, 3) Q(8, 3)
R(8, – 2)
By the Pythagorean theorem, the length of the remaining side of the triangle is
2 212 5 144 25 169 13.
x
y
Copyright © 2013, 2009, 2005 Pearson Education, Inc. 11
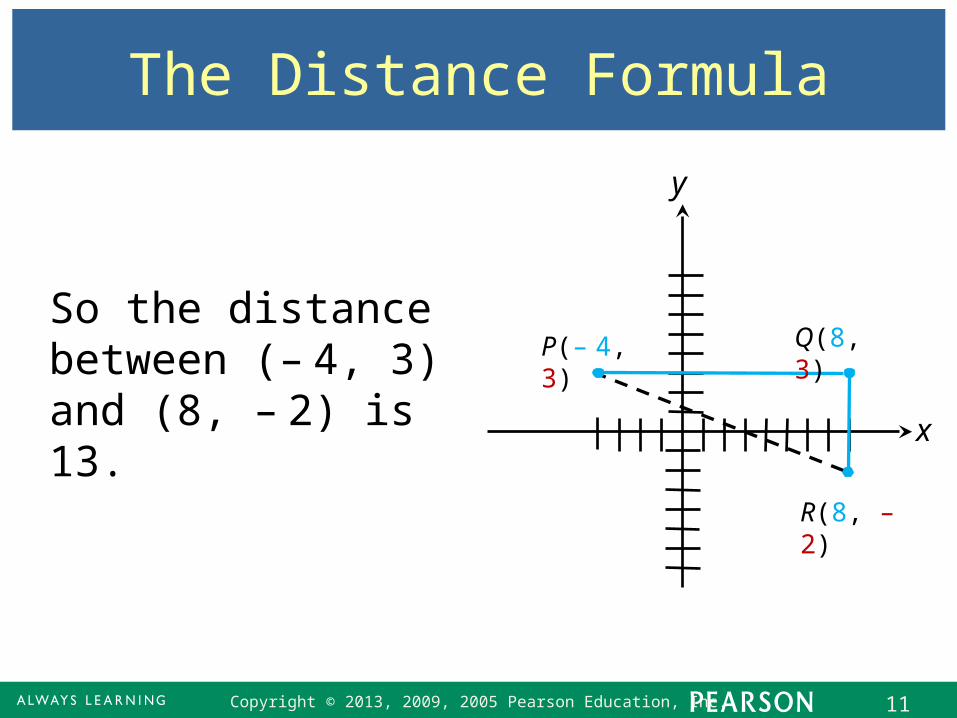
The Distance Formula
P(– 4, 3) Q(8, 3)
R(8, – 2)
So the distance between (– 4, 3) and (8, – 2) is 13. x
y
Copyright © 2013, 2009, 2005 Pearson Education, Inc. 12
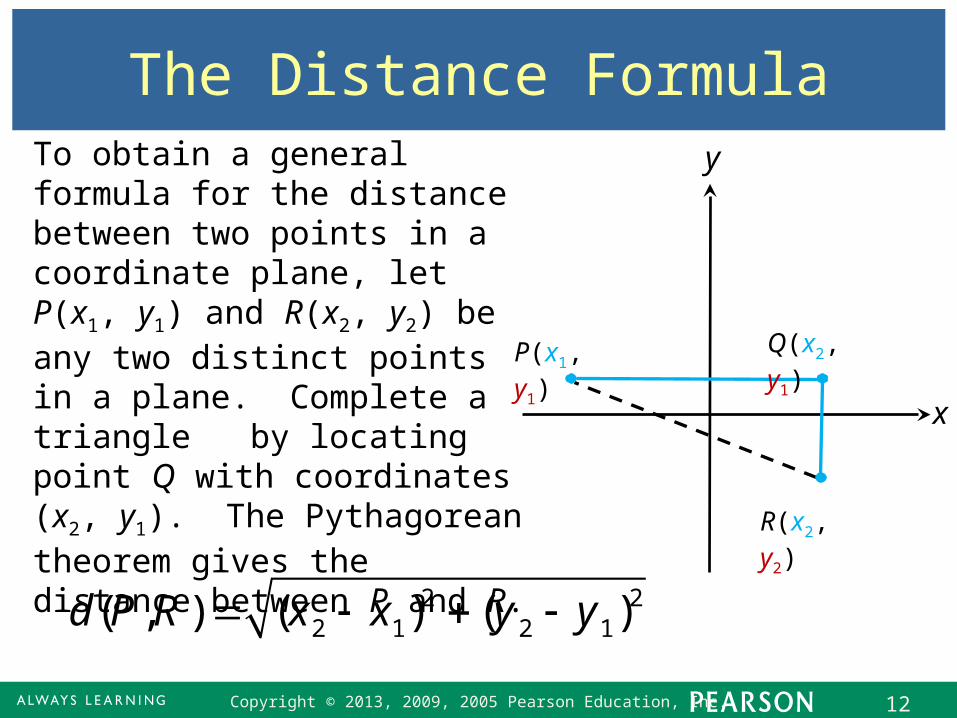
The Distance FormulaTo obtain a general formula for the distance between two points in a coordinate plane, let P(x1, y1) and R(x2, y2) be any two distinct points in a plane. Complete a triangle by locating point Q with coordinates (x2, y1). The Pythagorean theorem gives the distance between P and R.
2 22 1 2 1( , ) ( ) ( )d P R x x y y
P(x1, y1)Q(x2, y1)
R(x2, y2)
x
y
2.1 - 13Copyright © 2013, 2009, 2005 Pearson Education, Inc. 13
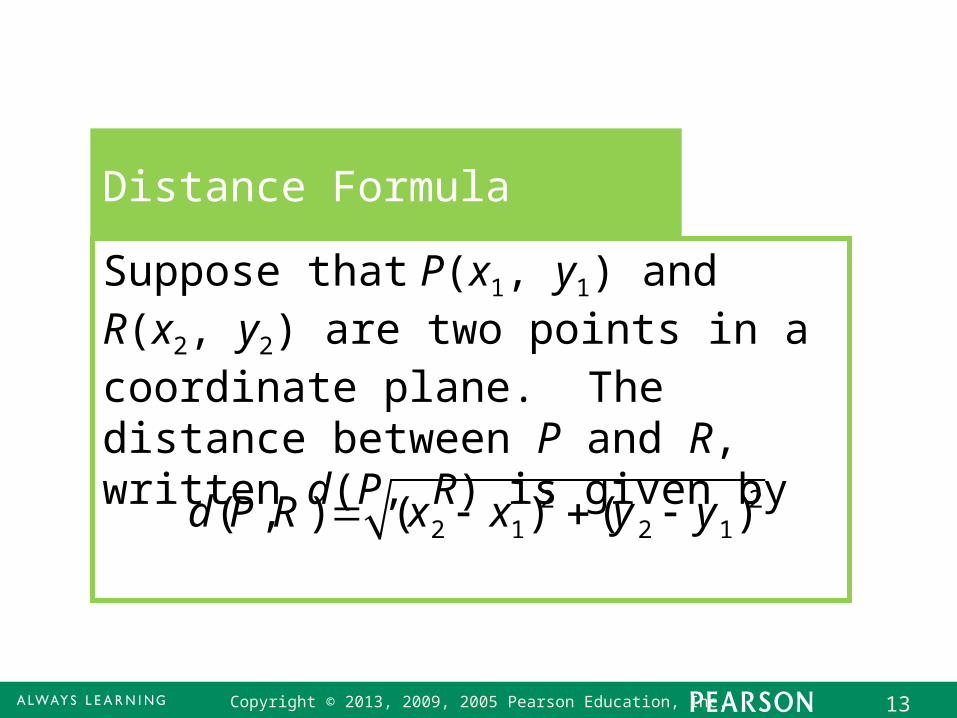
Distance Formula
Suppose that P(x1, y1) and R(x2, y2) are two points in a coordinate plane. The distance between P and R, written d(P, R) is given by
2 22 1 2 1( , ) ( ) ( )d P R x x y y
Copyright © 2013, 2009, 2005 Pearson Education, Inc. 14
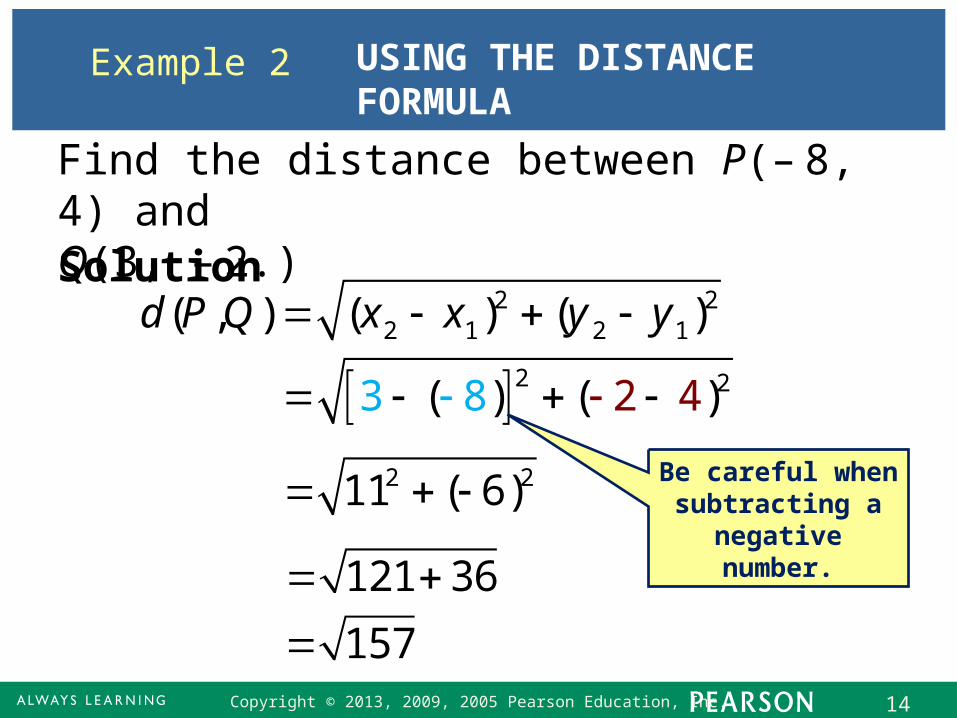
Example 2 USING THE DISTANCE FORMULA
Solution
Find the distance between P(– 8, 4) and Q(3, – 2.)
2 2( ) 28 43 ( )
2 211 ( 6) Be careful when subtracting a
negative number.121 36
157
2 22 1 2 1( , ) ( ) ( )d P Q x x y y
Copyright © 2013, 2009, 2005 Pearson Education, Inc. 15
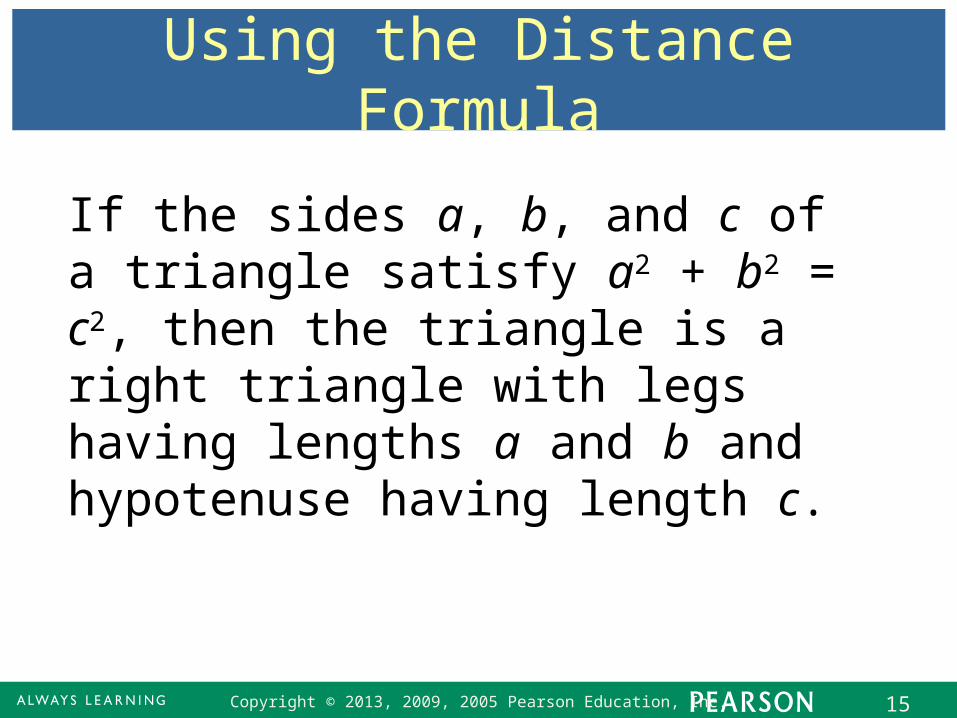
Using the Distance Formula
If the sides a, b, and c of a triangle satisfy a2 + b2 = c2, then the triangle is a right triangle with legs having lengths a and b and hypotenuse having length c.

Copyright © 2013, 2009, 2005 Pearson Education, Inc. 16
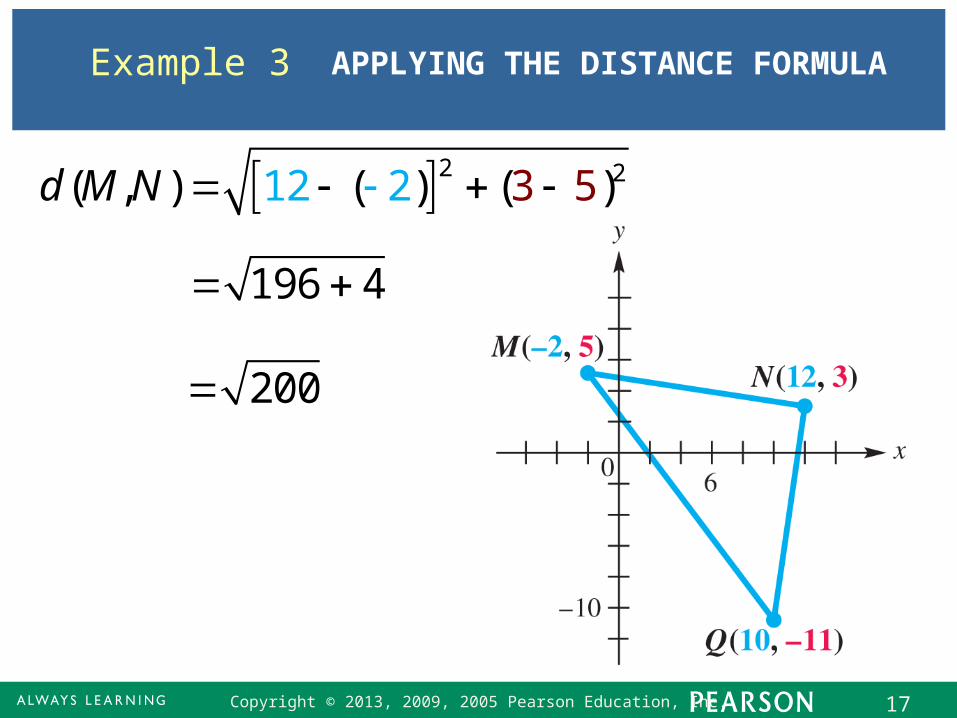
Example 3 APPLYING THE DISTANCE FORMULA
Are points M(– 2, 5), N(12, 3), and Q(10, – 11) the vertices of a right triangle?
Solution A triangle with the three given points as vertices is a right triangle if the square of the length of the longest side equals the sum of the squares of the lengths of the other two sides.
Copyright © 2013, 2009, 2005 Pearson Education, Inc. 17
Example 3
2 212( , ) ( 2 ( )3 5)d M N
200
196 4
APPLYING THE DISTANCE FORMULA

Copyright © 2013, 2009, 2005 Pearson Education, Inc. 18
Example 3
2 210 2( , ) ( 5( 11) )d M Q
400
144 256
20
APPLYING THE DISTANCE FORMULA
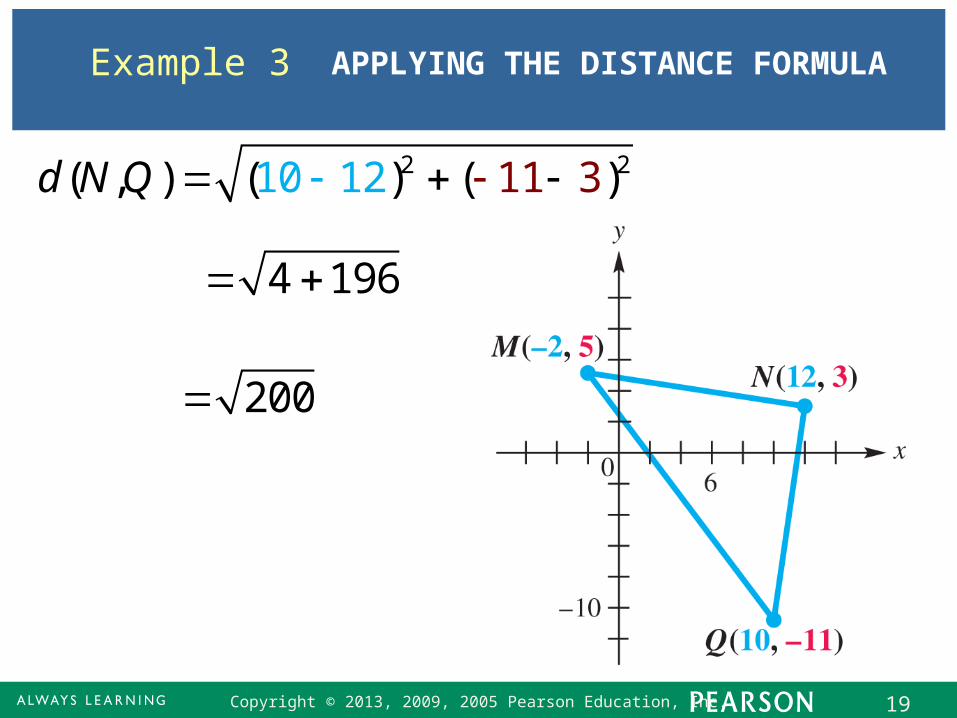
Copyright © 2013, 2009, 2005 Pearson Education, Inc. 19
Example 3
2 210 12( , ) ( ) 1( 3)1d N Q
200
4 196
APPLYING THE DISTANCE FORMULA

Copyright © 2013, 2009, 2005 Pearson Education, Inc. 20
Example 3
The longest side, of length 20 units, is chosen as the possible hypotenuse. Since
2 22200 200 400 20
is true, the triangle is a right triangle with hypotenuse joining M and Q.
APPLYING THE DISTANCE FORMULA

Copyright © 2013, 2009, 2005 Pearson Education, Inc. 21
Collinear Points
We can tell if three points are collinear, that is, if they lie on a straight line, using a similar procedure.
Three points are collinear if the sum of the distances between two pairs of points is equal to the distance between the remaining pair of points.
Copyright © 2013, 2009, 2005 Pearson Education, Inc. 22
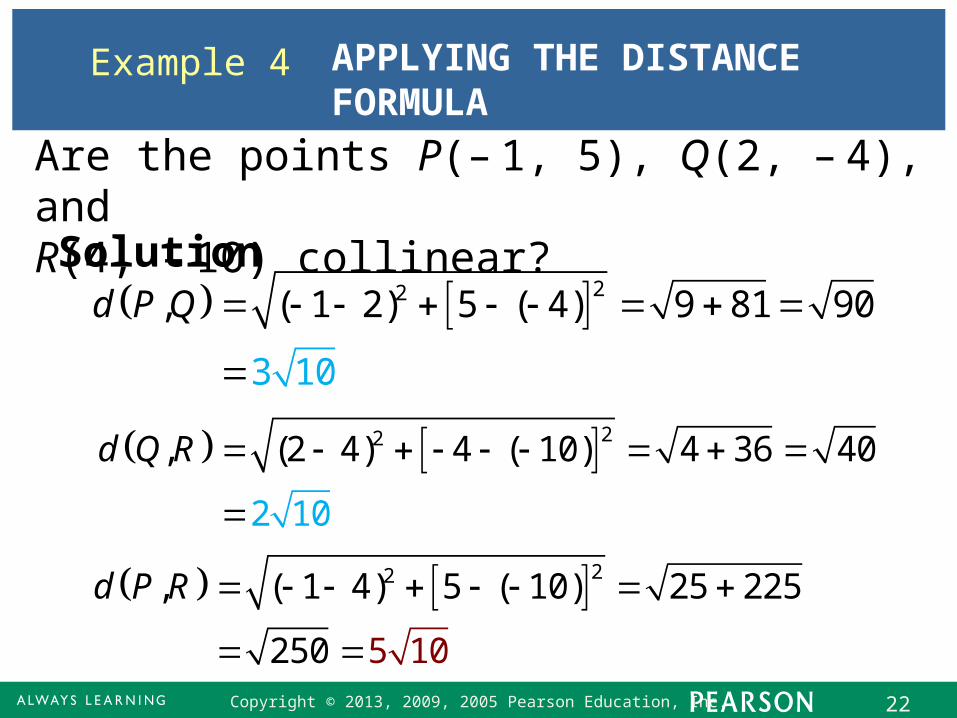
Example 4 APPLYING THE DISTANCE FORMULA
Are the points P(– 1, 5), Q(2, – 4), and R(4, – 10) collinear?Solution 22, ( 1 2) 5 ( 4) 9 81
3 0
90
1
d P Q
22, (2 4) 4 ( 10)
2 1
3 0
0
4 6 4d Q R
22, ( 1 4) 5 ( 10) 25 225
25 5 100
d P R

Copyright © 2013, 2009, 2005 Pearson Education, Inc. 23
Example 4 APPLYING THE DISTANCE FORMULA
Are the points P(– 1, 5), Q(2, – 4), and R(4, – 10) collinear?
Solution
Because is true,
the three points are
5
c
10
ol
3 1
li
0 2 10
near.

2.1 - 24Copyright © 2013, 2009, 2005 Pearson Education, Inc. 24
Midpoint Formula
The midpoint M of the line segment with endpoints P(x1, y1) and Q(x2, y2) has the following coordinates.
1 2 1 2,2 2
x x y y
Copyright © 2013, 2009, 2005 Pearson Education, Inc. 25
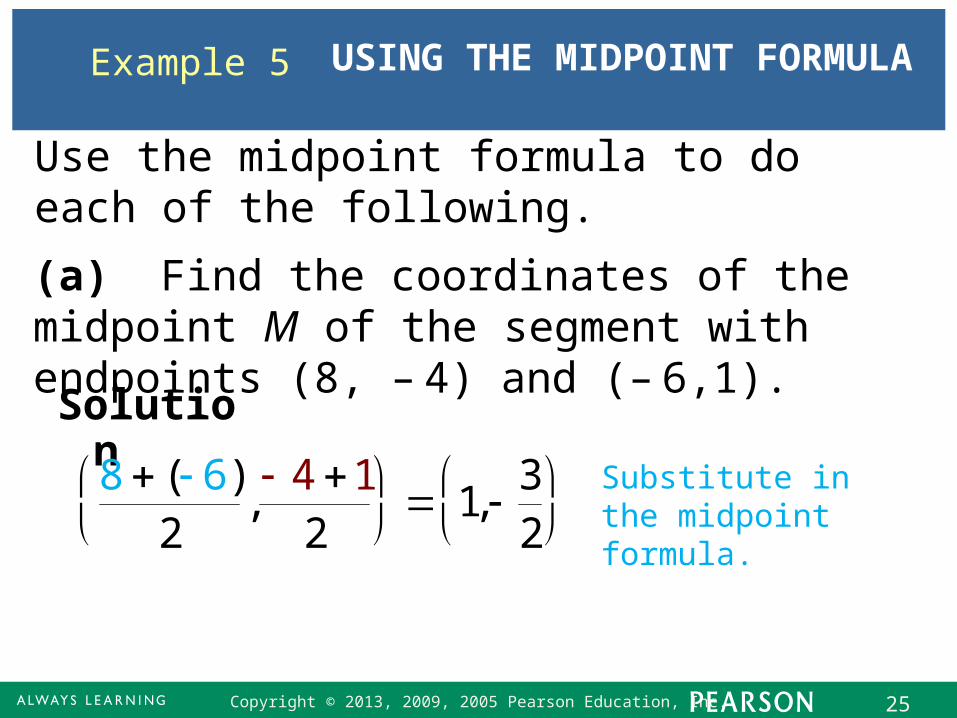
Example 5 USING THE MIDPOINT FORMULA
Use the midpoint formula to do each of the following.
Solution
(a) Find the coordinates of the midpoint M of the segment with endpoints (8, – 4) and (– 6,1).
( ) 3,
48 61,
2 21
2
Substitute in the midpoint formula.
Copyright © 2013, 2009, 2005 Pearson Education, Inc. 26
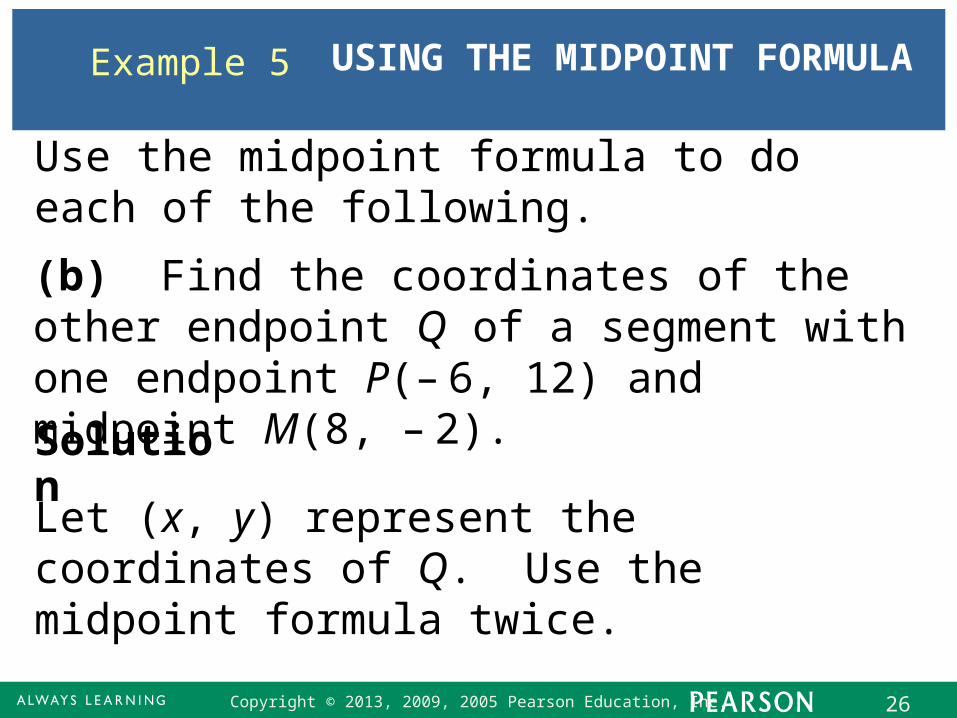
Example 5 USING THE MIDPOINT FORMULA
Use the midpoint formula to do each of the following.
(b) Find the coordinates of the other endpoint Q of a segment with one endpoint P(– 6, 12) and midpoint M(8, – 2).
Let (x, y) represent the coordinates of Q. Use the midpoint formula twice.
Solution

Copyright © 2013, 2009, 2005 Pearson Education, Inc. 27
Example 5 USING THE MIDPOINT FORMULA
( 6)8
2x
6 16x
22x
x-value of P x-value of M
Substitute carefully.
x-value of P y-value of M
122
2y
12 4y
16y
The coordinates of endpoint Q are (22, – 16).

Copyright © 2013, 2009, 2005 Pearson Education, Inc. 28
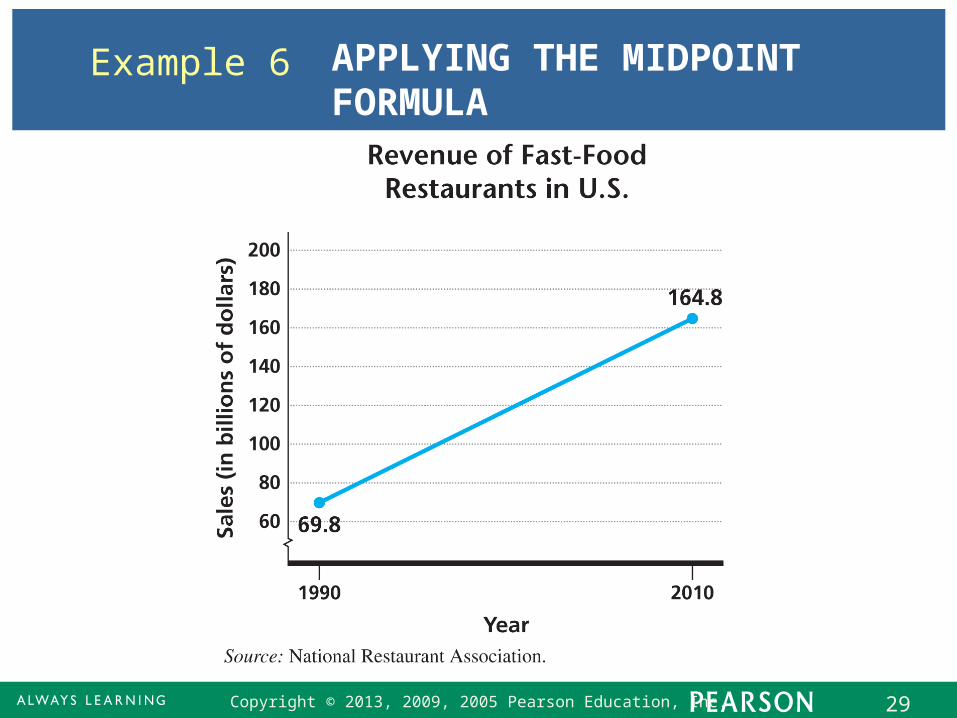
Example 6 APPLYING THE MIDPOINT FORMULA
The following figure depicts how a graph might indicate the increase in the revenue generated by fast-food restaurants in the United States from $69.8 billion in 1990 to $164.8 billion in 2010. Use the midpoint formula and the two given points to estimate the revenue from fast-food restaurants in 2000, and compare it to the actual figure of $107.1 billion.
Copyright © 2013, 2009, 2005 Pearson Education, Inc. 29
Example 6 APPLYING THE MIDPOINT FORMULA

Copyright © 2013, 2009, 2005 Pearson Education, Inc. 30
Example 6 APPLYING THE MIDPOINT FORMULA
Solution The year 2000 lies halfway between 1990 and 2010, so we must find the coordinates of the midpoint of the segment that has endpoints(1990, 69.8) and (2010, 164.8).
69.8 164., (2000, 117.3)
2 21990 82010
Thus, our estimate is $117.3 billion, which is greater than the actual figure of $107.1 billion.
Copyright © 2013, 2009, 2005 Pearson Education, Inc. 31
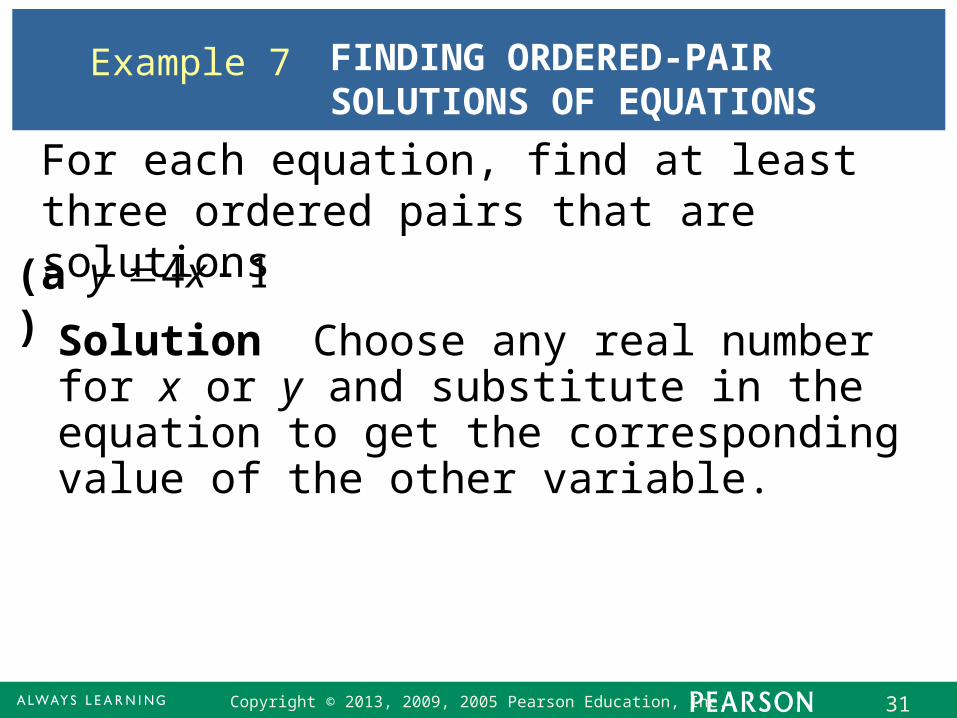
Example 7 FINDING ORDERED-PAIR SOLUTIONS OF EQUATIONS
For each equation, find at least three ordered pairs that are solutions
Solution Choose any real number for x or y and substitute in the equation to get the corresponding value of the other variable.
(a) 4 1y x

Copyright © 2013, 2009, 2005 Pearson Education, Inc. 32
Example 7 FINDING ORDERED-PAIR SOLUTIONS OF EQUATIONS
Solution
(a) 4 1y x
4 1y x 4( ) 12y Let x = – 2.
8 1y Multiply.
9y
4 1y x 3 4 1x Let y = 3.
4 4x Add 1.
1 x Divide by 4.
This gives the ordered pairs (– 2, – 9) and (1, 3).Verify that the ordered pair (0, –1) is also a solution.

Copyright © 2013, 2009, 2005 Pearson Education, Inc. 33
Example 7 FINDING ORDERED-PAIR SOLUTIONS OF EQUATIONS
Solution
(b) 1x y Given equation
Let x = 1.
Square each side.
One ordered pair is (1, 2). Verify that the ordered pairs (0, 1) and (2, 5) are also solutions of the equation.
1x y
1 1y
1 1y
2 y Add 1.

Copyright © 2013, 2009, 2005 Pearson Education, Inc. 34
Example 7 FINDING ORDERED-PAIR SOLUTIONS OF EQUATIONS
Solution
(c) A table provides an organized method for determining ordered pairs.
2 4y x
Five ordered pairs are (–2, 0), (–1, –3), (0, –4), (1, –3), and (2, 0).
x y
– 2 0
– 1 – 3
0 – 4
1 – 3
2 0
2.1 - 35Copyright © 2013, 2009, 2005 Pearson Education, Inc. 35
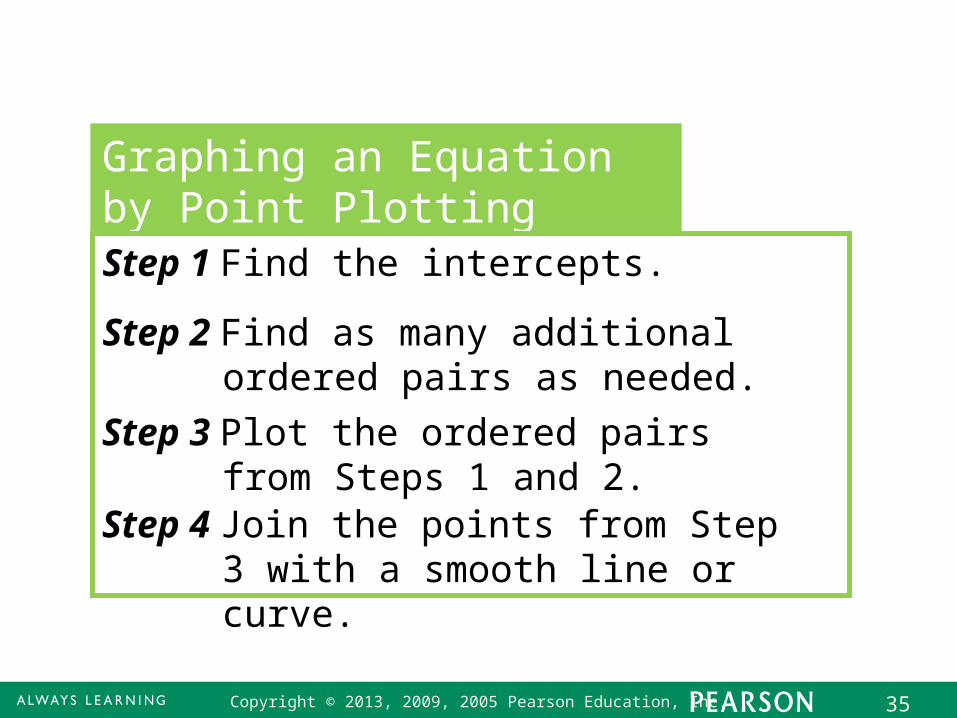
Graphing an Equation by Point PlottingStep 1 Find the intercepts.
Step 2 Find as many additional ordered pairs as needed.
Step 3 Plot the ordered pairs from Steps 1 and 2.
Step 4 Join the points from Step 3 with a smooth line or curve.

Copyright © 2013, 2009, 2005 Pearson Education, Inc. 36
Step 1 Let y = 0 to find the x-intercept, and let x = 0 to find the y-intercept.
Example 8 GRAPHING EQUATIONS
(a) Graph the equation Solution
4 1.y x
4 1y x 0 4 1x 1 4x14
x
4 1y x 4( ) 10y 0 1y
1y
1,0 and 0, 1 .
4 These intercepts lead to the ordered pairs

Copyright © 2013, 2009, 2005 Pearson Education, Inc. 37
Step 2 We find some other ordered pairs (also found in Example 7(a)).
Example 8 GRAPHING EQUATIONS
(a) Graph the equation Solution
4 1.y x
4 1y x 4( ) 12y Let x = – 2.
8 1y Multiply.
9y
4 1y x 3 4 1x Let y = 3.
4 4x Add 1.
1 x Divide by 4.
This gives the ordered pairs (– 2, – 9) and (1, 3).
Copyright © 2013, 2009, 2005 Pearson Education, Inc. 38
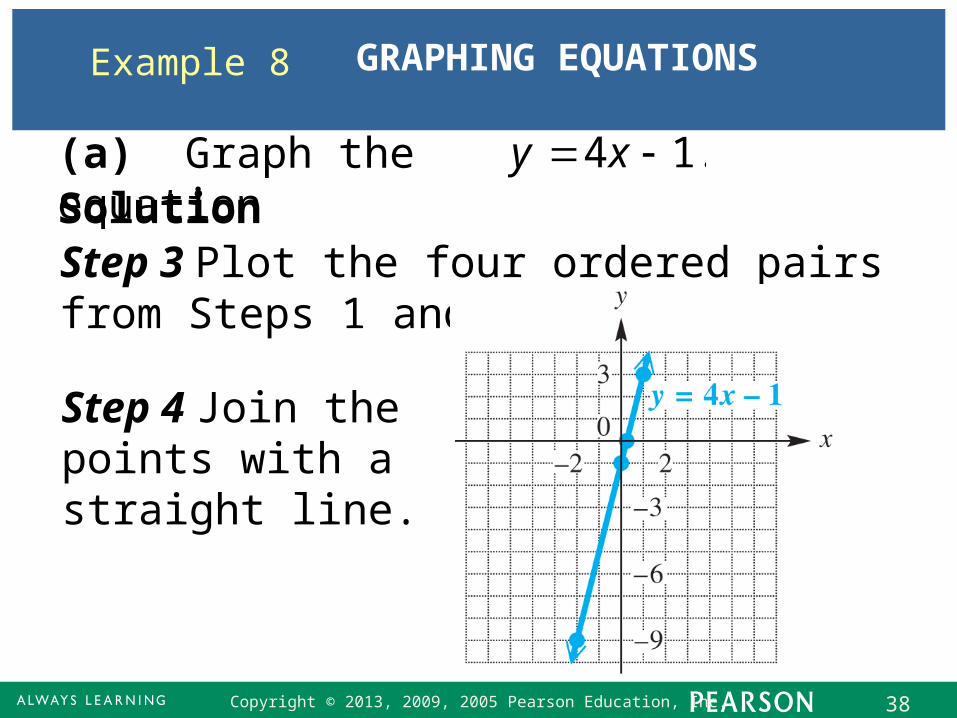
Step 3 Plot the four ordered pairs from Steps 1 and 2.
Example 8 GRAPHING EQUATIONS
(a) Graph the equation Solution
4 1.y x
Step 4 Join the points with a straight line.
Copyright © 2013, 2009, 2005 Pearson Education, Inc. 39
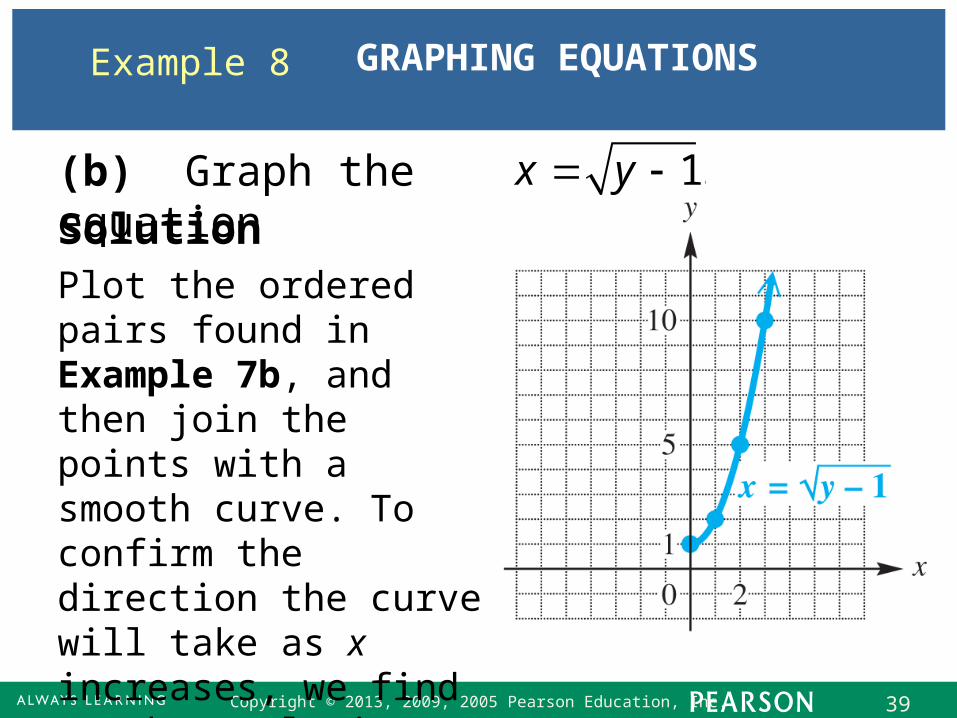
Example 8 GRAPHING EQUATIONS
(b) Graph the equation Solution
1.x y
Plot the ordered pairs found in Example 7b, and then join the points with a smooth curve. To confirm the direction the curve will take as x increases, we find another solution, (3, 10).
Copyright © 2013, 2009, 2005 Pearson Education, Inc. 40
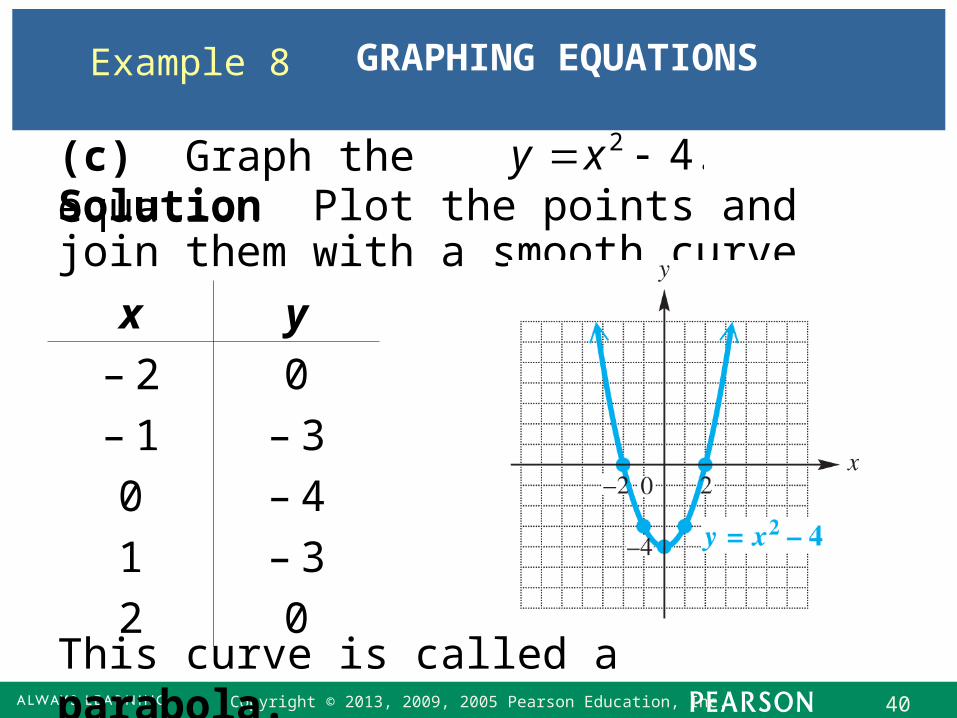
Example 8 GRAPHING EQUATIONS
(c) Graph the equation Solution Plot the points and join them with a smooth curve.
2 4.y x
x y
– 2 0
– 1 – 3
0 – 4
1 – 3
2 0This curve is called a parabola.