Embed Size (px)
Citation preview

3SOCIOECONOMIC
PROFILE
SOCIOECONOMIC PROFILE
2040 LONG RANGE TRANSPORTATION PLAN December 2015 | 47
3.0 Socioeconomic Profile
3.1 Regional Profile Pueblo’s existing transportation system includes roadways, railroads, bicycle and pedestrian trails, the Pueblo Memorial Airport, and several public and private transit services. Together, these facilities support an integrated transportation system that serves both area residents, visitors and those passing through the region.
This section of the Long Range Transportation Plan (LRTP) provides a snapshot of regional demographics and of the existing transportation systems.
3.1.1 Population
Population Growth Trends
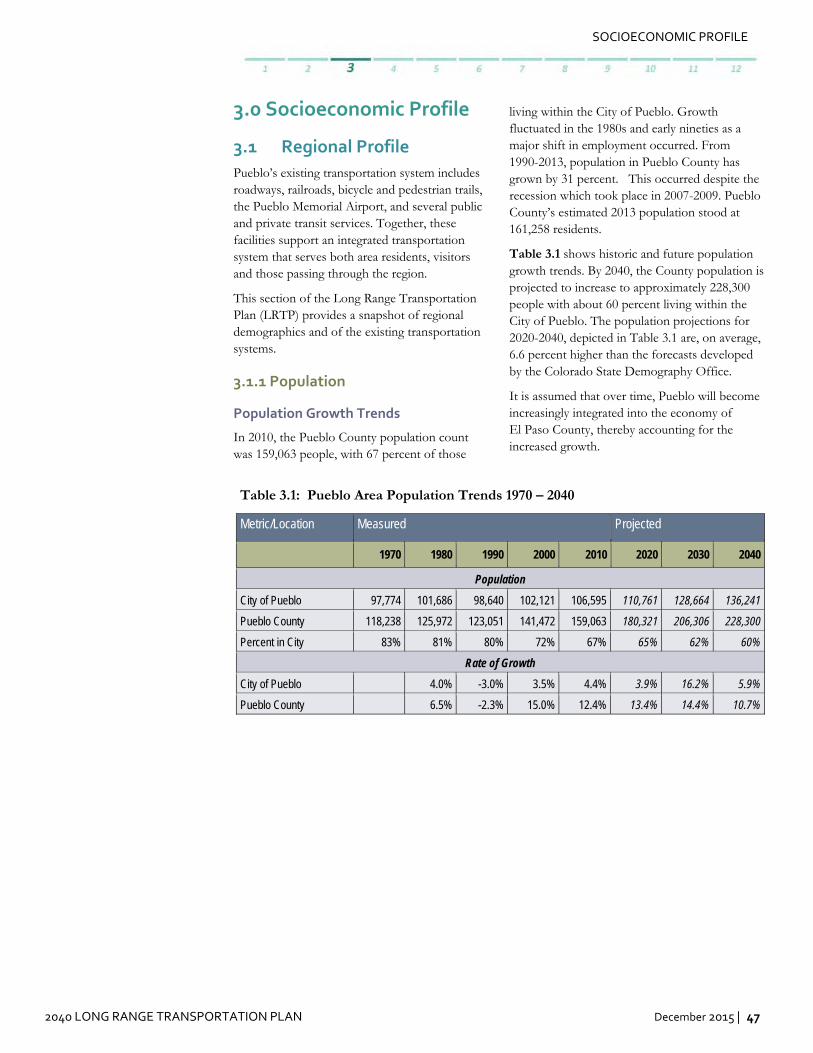
In 2010, the Pueblo County population count was 159,063 people, with 67 percent of those
living within the City of Pueblo. Growth fluctuated in the 1980s and early nineties as a major shift in employment occurred. From 1990-2013, population in Pueblo County has grown by 31 percent. This occurred despite the recession which took place in 2007-2009. Pueblo County’s estimated 2013 population stood at 161,258 residents.
Table 3.1 shows historic and future population growth trends. By 2040, the County population is projected to increase to approximately 228,300 people with about 60 percent living within the City of Pueblo. The population projections for 2020-2040, depicted in Table 3.1 are, on average, 6.6 percent higher than the forecasts developed by the Colorado State Demography Office.
It is assumed that over time, Pueblo will become increasingly integrated into the economy of El Paso County, thereby accounting for the increased growth.
Table 3.1: Pueblo Area Population Trends 1970 – 2040
Metric/Location Measured Projected
1970 1980 1990 2000 2010 2020 2030 2040
Population
City of Pueblo 97,774 101,686 98,640 102,121 106,595 110,761 128,664 136,241
Pueblo County 118,238 125,972 123,051 141,472 159,063 180,321 206,306 228,300
Percent in City 83% 81% 80% 72% 67% 65% 62% 60%
Rate of Growth
City of Pueblo 4.0% -3.0% 3.5% 4.4% 3.9% 16.2% 5.9%
Pueblo County 6.5% -2.3% 15.0% 12.4% 13.4% 14.4% 10.7%

SOCIOECONOMIC PROFILE
48 | December 2015 2040 LONG RANGE TRANSPORTATION PLAN
Composition of the Population
The racial and ethnic composition of Pueblo’s population has undergone significant changes in the past three decades. This is particularly the case with the City of Pueblo, which has experienced a substantial growth in its Hispanic population. Table 3.2 depicts these changes.
Pueblo’s population can be expected to see some fundamental changes in its age composition in the next thirty years. Figure 3.1 illustrates the changes as the “Baby Boom” generation joins the ranks of the elderly.
Over the thirty year period of 2010-2040, the population under age 20 is expected to decrease from 27.4 percent to 21.9 percent. Conversely, those age 65 and above are expected to increase from 15.3 to 24.5 percent of the population, so that by 2040, almost one in four persons will be this age. The working age population, classically defined as being those age 20 to 65, is slated to shrink from 57.2 to 53.5 percent of total population. Median age, the interval where one-half of the population is older than this value, and one-half younger, is expected to increase from 38.7 years in 2010 to 43.5 years by 2040.
Table 3.2: Population by Race and Hispanic Origin
City of Pueblo Pueblo County
Population Count
1990 2000 2010 1990 2000 2010
NON-HISPANIC ORIGIN
White 56,451 52,202 48,195 75,382 82,266 86,054
Black 1,932 2,199 2,221 2,029 2,421 2,646
American Indian, Alaska Native 484 622 682 614 950 985
Asian 504 623 792 605 866 1,123
Native Hawaiian, Pacific Islander - 39 79 - 59 111
Other, including 2 or More Races 300 1,370 1,528 331 1,200 2,333
HISPANIC OR LATINO 38,969 45,066 53,098 44,090 53,710 65,811
TOTALPOPULATION 98,640 102,121 106,595 123,051 141,472 159,063
Percent of Total Population
1990 2000 2010 1990 2000 2010
NON-HISPANIC ORIGIN
White 57.2% 51.1% 45.2% 61.3% 58.2% 54.1%
Black 2.0% 2.2% 2.1% 1.6% 1.7% 1.7%
American Indian, Alaska Native 0.5% 0.6% 0.6% 0.5% 0.7% 0.6%
Asian 0.5% 0.6% 0.7% 0.5% 0.6% 0.7%
Native Hawaiian, Pacific Islander 0.0% 0.0% 0.1% 0.0% 0.0% 0.1%
Other, including 2 or More Races 0.3% 1.3% 1.4% 0.3% 0.8% 1.5%
HISPANIC OR LATINO 39.5% 44.1% 49.8% 35.8% 38.0% 41.4%
TOTAL POPULATION 100.0% 100.0% 99.9% 100.0% 100.0% 100.0%

SOCIOECONOMIC PROFILE
2040 LONG RANGE TRANSPORTATION PLAN December 2015 | 49
Figure 3.1: Pueblo County Age Distribution
Source: Colorado State Demography Office
-5.0% 0.0% 5.0%
0 to 4
5 to 9
10 to 14
15 to 19
20 to 24
25 to 29
30 to 34
35 to 39
40 to 44
45 to 49
50 to 54
55 to 59
60 to 64
65 to 69
70 to 74
75 to 79
80 to 84
85 to 89
90+
Percent of Population
Age
Coh
ort
2040--Female 2040--Male 2010--Female 2010--Male
5.0% 2.5% 0.0% 2.5% 5.0%

SOCIOECONOMIC PROFILE
50 | December 2015 2040 LONG RANGE TRANSPORTATION PLAN
3.1.2 Housing As was the case with communities nationwide, housing development in Pueblo slowed from 2007-2013, as shown by Figure 3.2. Prior to this, housing growth was steady, increasing slightly faster than population due to shrinking household size. At the beginning of 2015, Pueblo County had an estimated housing unit inventory of more than 70,000 units; representing a 38 percent rate of growth relative to the 1990 statistic. The City of Pueblo currently has 68 percent of the housing stock. A related statistic, home ownership showed a decline over that same period as shown by Figure 3.3.
Historically, Pueblo was, and continues to be, a community that is defined by its neighborhoods. An indication of the degree of cohesiveness within the community is the high rate of homeownership, as shown in Figure 3.3. This has changed in recent years as the general trend of owner-occupied housing has shown a decline, particularly within the City of Pueblo.
Figure 3.4 shows the relationships among home value in the Pueblo Metropolitan Area, the state and the nation. In rounded figures, median home value for the Pueblo metropolitan area is currently about 60 percent of the State of Colorado value, and 80 percent of the corresponding U.S. statistic. From 2010 to 2013, median home value in Pueblo showed no growth; at least based on Census Bureau data. A brief glance at recent statistics of the median price of sold homes shows a 19% gain in Pueblo during the 2011-2014 timeframe. This rate essentially matches the State of Colorado growth rate of 20% for the period.

SOCIOECONOMIC PROFILE
2040 LONG RANGE TRANSPORTATION PLAN December 2015 | 51
Figure 3.2: Housing Growth Trends
Source: U.S. Bureau of the Census, American Community Survey
Figure 3.3: Home Ownership
Source: U.S. Bureau of the Census, Decennial Census; ACS, 2013, 1-yr. estimate
Figure 3.4: Median Home Value
Source: U.S. Bureau of the Census, American Community Survey
0.0%10.0%20.0%30.0%40.0%50.0%60.0%70.0%80.0%
1980 1990 2000 2010 2013
Perc
ent
Hom
e O
wne
rshi
p
YearCity of Pueblo Pueblo County
2005 2010 2013
Pueblo, CO Metro Area $121,700 $141,200 $141,000
Colorado $223,300 $236,600 $240,500
U.S. $167,500 $179,900 $173,900
$-
$50,000
$100,000
$150,000
$200,000
$250,000
$300,000
010,00020,00030,00040,00050,00060,00070,00080,000
1990 2000 2010 2015H
ousi
ng U
nits
Year
Total Pueblo County City of Pueblo Balance of County

SOCIOECONOMIC PROFILE
52 | December 2015 2040 LONG RANGE TRANSPORTATION PLAN
3.1.3 Income Trends show the median income for Pueblo is increasing, but it remains low compared to other metropolitan areas. The 2013 median household income in Pueblo was $41,218 compared to Colorado’s $58,823, and the US value of $52,250.
On the basis of American Community Survey statistics compiled for 2009-2013, over 13 percent of Pueblo County’s population lived in families with incomes below the poverty level as measured by the federal government’s official poverty definitions. On average, areas within the City of Pueblo have higher concentrations of poverty. Over 17 percent of families citywide are living at or below the poverty line. This compares to 8.8 percent Statewide
The Pueblo metro area is economically diverse. While many areas are impacted by high levels of poverty, others, as for example, Pueblo West, are economically relatively affluent. The following graph and map (Figure 3.5 and Figure 3.6) illustrates this.
Figure 3.5: Median Household Income of Select Colorado Metro Areas
Source: U.S. Bureau of the Census, American Community Survey, 2005-2013
$-
$10,000
$20,000
$30,000
$40,000
$50,000
$60,000
$70,000
2005 2010 2013
Med
ian
Hou
seho
ld In
com
e
Year
Pueblo
Colorado Springs
Denver-Aurora-Lakewood
Fort Collins
Greeley
State of Colorado

SOCIOECONOMIC PROFILE
2040 LONG RANGE TRANSPORTATION PLAN December 2015 | 53
Figure 3.6: Families below Poverty Level

SOCIOECONOMIC PROFILE
54 | December 2015 2040 LONG RANGE TRANSPORTATION PLAN
3.1.4 Employment
The following chart, Figure 3.7, depicts job growth for the Pueblo metropolitan area and State of Colorado. The impacts of the recession of 2007-2009 are immediately apparent. Economic recovery commenced in 2010. Subsequent job growth reveals that while the Colorado economy has made good progress in overcoming the effects of the recession, Pueblo’s economy has lagged in its rate of growth in jobs.
Figure 3.7: Job Growth (Percent Increase Over Prior Year)
Source: U.S. Bureau of Labor Statistics; 2014 preliminary data, subject to revision
Table 3.3: Place of Work for Pueblo Residents (2000 and 2010)
Counties 2000 2006 - 2010
Count % Count %
Pueblo County 57,721 91.1% 57,390 89.2%
El Paso County 3,137 5.4% 3,355 5.2%
Fremont County 1,129 2.0% 1,445 2.2%
Denver County 290 0.5% 315 0.5%
Huerfano County 216 0.4% 240 0.4%
Crowley County 250 0.4% 215 0.3%
Otero County 130 0.2% 120 0.2% All other counties 835 1.4% 1,232 1.9% Sub-Total Other Counties 5,987 10.2% 6,922 10.8% Total 58,706 64,312 100.0%
Source: U.S. Census. American Community Survey 2006-2010
-6.0%
-5.0%
-4.0%
-3.0%
-2.0%
-1.0%
0.0%
1.0%
2.0%
3.0%
4.0%
Job
Gro
wth
Per
cent
age
YearPueblo Colorado

SOCIOECONOMIC PROFILE
2040 REGIONAL TRANSPORTATION PLAN December 2015 | 55
Between 2000 and 2010 an increased percentage of the workforce travelled to neighboring counties for employment. In 2006-2010, approximately 89 percent of the 64,000 workers living in Pueblo County worked in the County. Approximately 6,900 commuted outside the county each day to work, as shown in Table 3.3. The majority of these commuters work at jobs in El Paso County or Fremont County. The following graph, Figure 3.8, shows the recent trend in the rate of unemployment for Pueblo, the State of Colorado, and the United States. Even a cursory perusal of it reveals the impact the recent recession has had on the level of unemployment. Examining the data from 1990 forward seems to reveal a cyclical trend in the rate of unemployment of approximately seven years duration. Since 2012, Pueblo’s annual unemployment rate has dropped from 10.4 percent to 7.2 percent. The rate of unemployment, however, is nonetheless significantly higher than either the State of Colorado or the U.S. rates. It appears that the recovery of Pueblo’s economy has lagged somewhat behind that of Colorado and the country as a whole. Nationally, and on a statewide basis, the reduction in the level of unemployment commenced in 2010. For
Pueblo, the process appears to not have materialized until 2012.
3.1.5 The Communities of Pueblo County As briefly alluded to, the Pueblo Metropolitan Planning Organization (MPO) shows a great deal of diversity in its demographic makeup. Its communities consist of three incorporated places (the City of Pueblo, Town of Boone, and Town of Rye), two metropolitan districts (Pueblo West and Colorado City), and a variety of residentially developed areas which are generally known to long-time residents, but have no legally mandated boundaries. This last group is particularly interesting. Local residents know where they are located, more or less, but any attempt to define their boundaries precisely is likely to vary based upon whom one is speaking with about them. For purposes of this analysis, eleven are identified, and demographics are readily available for them from the Bureau of the Census (see Figure 3.9). The following map, Figure 3.10, shows the locations of these communities, but long-time resident might look in vain to find Baxter, North Avondale, Lombard Village, or West Park, though they are known by many.
Figure 3.8: Comparative Unemployment Rate Trends
Source: U.S. Bureau of Labor Statistics; 2014 data is preliminary
0.0
2.0
4.0
6.0
8.0
10.0
12.0
Pueblo Colorado U.S.

SOCIOECONOMIC PROFILE
56 | December 2015 2040 LONG RANGE TRANSPORTATION PLAN
Figure 3.9: Pueblo County Communities Summary Demographics
Source: U.S. Bureau of the Census; in 1990 Pacific Islander included in Asian category
Avondale BeulahValley Blende Boone Colorado
City Pueblo PuebloWest Rye
SaintCharlesMesa
SaltCreek Vineland
Population 2010 674 556 878 339 2,193 106,595 29,637 153 7,117 587 251
Median Age 37.5 54.2 41.3 41.4 45.9 37.5 37.6 48.4 45.8 44.9 42.4
Percent Minority 62.5 8.3 47.9 30.7 16.2 54.8 27.3 15.7 32.2 87.7 36.7
Percent Owner-Occ. Homes, 2010 75.5 85.4 68.4 74.8 80.0 60.2 81.8 60.6 89.9 66.2 76.5
674
556
878
339
2,193
106,595
29,637
153
7,117
587
251
-
10.0
20.0
30.0
40.0
50.0
60.0
70.0
80.0
90.0
100.0
1
50
2,500
125,000
Perc
ent o
f Tot
al
Population
Population 2010 Median Age Percent Minority Percent Owner-Occ. Homes, 2010

SOCIOECONOMIC PROFILE
2040 LONG RANGE TRANSPORTATION PLAN December 2015 | 57
Figure 3.10: Communities in Pueblo County

SOCIOECONOMIC PROFILE
58 | December 2015 2040 LONG RANGE TRANSPORTATION PLAN
3.1.6 Density of Population and Employment Figure 3.11 and Figure 3.12 show the density of population in the Pueblo Urbanized Area, and Pueblo County in 2010 and as forecast for 2040, respectively. Figure 3.13 and Figure 3.14 show the density of employment in the Pueblo
Urbanized Area, and Pueblo County in 2010 and as forecast for 2040, respectively. Densities in Pueblo are relatively low in most areas. However, some of the older developed areas, and regional commercial centers, such as the Pueblo Mall have higher densities due to either employment centers or denser housing development.
Figure 3.11: Population Density (2010 Population per Acre)

SOCIOECONOMIC PROFILE
2040 LONG RANGE TRANSPORTATION PLAN December 2015 | 59
Figure 3.12: Population Density (2040 Population per Acre)

SOCIOECONOMIC PROFILE
60 | December 2015 2040 LONG RANGE TRANSPORTATION PLAN
Figure 3.13: Employees per Acre, 2010

SOCIOECONOMIC PROFILE
2040 LONG RANGE TRANSPORTATION PLAN December 2015 | 61
Figure 3.14: Employees per Acre, 2040

SOCIOECONOMIC PROFILE
62 | December 2015 2040 LONG RANGE TRANSPORTATION PLAN
3.2 Environmental Justice On February 11, 1994, President Clinton issued Executive Order 12898, "Federal Actions to Address Environmental Justice (EJ) in Minority Populations and Low‐Income Populations." This Order elaborates upon and expands the provisions of the Civil Rights Act of 1994 by mandating that Federally-funded projects must be aware of the issues affecting minority and low-income populations. As a recipient of Federal funding, the Pueblo MPO is required to abide by the provisions of the legislation. Under Executive Order 12898, each Federal agency is required to develop a program which implements its provisions. The Federal agency which is most directly involved with the functioning of the Pueblo MPO is the Federal Highway Administration (FHWA).
The intent of the analysis presented in this section is to identify concentrations of low-income and minority populations in Pueblo that are most readily at risk of being overlooked in the process of developing and implementing transportation-related projects. Four major components are evaluated: low-income, minority, the disabled population, and the population with no vehicle available. The first two are specifically mandated by the Order; the third and fourth, though not specifically mentioned, represents a demographic segment that historically has been overlooked in the transportation planning process. These four variables are identified on the basis of data aggregated by census block groups.
3.2.1 Low-Income Population
Estimates of the low and moderate income population are published by the U.S. Department of Housing and Urban Development (HUD) for evaluating the eligibility of local jurisdictions to receive Community Development Block-Grant (CDBG) funding. The U.S. Bureau of the Census is responsible for the compilation of the data for HUD. The 2006-2010 American Community Survey (ACS) provides the basis for the tabulation. The source of the data is the
following website: https://www.hudexchange.info/manage-a-program/acs-low-mod-summary-data/
An area is considered entitled to receive CDBG funding if more than 51 percent of its residents fall within the low or moderate income household category. The following map, Figure 3.15, depicts these block groups.

SOCIOECONOMIC PROFILE
2040 LONG RANGE TRANSPORTATION PLAN December 2015 | 63
Figure 3.15: Low-Moderate Income Block Groups

SOCIOECONOMIC PROFILE
64 | December 2015 2040 LONG RANGE TRANSPORTATION PLAN
3.2.2 Minority Status
Data are readily available from the U. S. Bureau of the Census which facilitates identifying the concentrations of minority groups. For purposes of this report, “minority” is defined as follows:
American Indian and Alaskan Native – a person having origins in any of the original people of North America and who maintains cultural identification through tribal affiliation or community recognition.
Asian or Pacific Islander (including Native Hawaiian) – a person having origins in any
of the original peoples of the Far East, Southeast Asia, the Indian subcontinent, or the Pacific Islands.
Black/African American – a person having origins in any of the black racial groups of Africa, or
Hispanic/Latino – a person or Mexican, Puerto Rican, Cuban, Central or South American, or other Spanish culture or origin, regardless of race.
The distribution of minority groups within the PACOG region is shown in Figure 3.16, below.
Figure 3.16: Minority Population Block Groups

SOCIOECONOMIC PROFILE
2040 LONG RANGE TRANSPORTATION PLAN December 2015 | 65
3.2.3 Disabled Population and Households with No Vehicle As noted previously, these two population components, while not specifically addressed in the Executive Order, have historically been placed at a disadvantage with regard to their fair access to transportation facilities. As will hopefully become apparent if the user examines the maps included below as Figure 3.17 and Figure 3.18., there is, in many cases a high
correlation between these population segments regarding their geographic distribution. Census block groups having a high minority concentration frequently also have a high proportion of low income households. Disabled population concentrations frequently reflect high numbers of persons without access to a vehicle. Data which can be portrayed in a format which can be mapped are readily available from the Census Bureau’s ACS. The subsequent maps present this information.
Figure 3.17: Percent Disabled Aged 16-64 Years by Block Groups

SOCIOECONOMIC PROFILE
66 | December 2015 2040 LONG RANGE TRANSPORTATION PLAN
Figure 3.18: Percent with No Vehicle Available by Block Groups

SOCIOECONOMIC PROFILE
2040 LONG RANGE TRANSPORTATION PLAN December 2015 | 67
The final map of the series, Figure 3.19, shows block groups which fall within the following criteria:
Low-moderate income >= 51 percent; Minority population >= 50 percent;
Disabled population >= 20 percent; Households with no vehicles >= 10 percent
The census block groups that meet these criteria are also listed on this map.
Figure 3.19 Census Block Groups Meeting EJ Criteria