Embed Size (px)
Citation preview

2021
State of Reliability An Assessment of 2020 Bulk Power System Performance
August 2021

NERC | State of Reliability | 2021 ii
Table of Contents
Preface ........................................................................................................................................................................... iii
About This Report .......................................................................................................................................................... iv
Impact of February 2021 Cold Weather Event ........................................................................................................... iv
Development Process ................................................................................................................................................. iv
Primary Data Sources ................................................................................................................................................. iv
Reading this Report ..................................................................................................................................................... v
Executive Summary ....................................................................................................................................................... vii
Key Findings .............................................................................................................................................................. viii
Recommendations...................................................................................................................................................... ix
Chapter 1: The North American BPS—By the Numbers ................................................................................................. 1
2020 Key Occurrences ................................................................................................................................................. 3
Chapter 2: Event Analysis Review ................................................................................................................................. 11
Bulk Power System Awareness, Inputs, and Products .............................................................................................. 11
2020 Event Analysis Summary .................................................................................................................................. 12
Event Trends .............................................................................................................................................................. 15
Event Analysis Lessons Learned ................................................................................................................................ 16
Chapter 3: Reliability Indicators .................................................................................................................................... 18
Reliability Indicators and Trends ............................................................................................................................... 18
Resource Adequacy ................................................................................................................................................... 20
Transmission Performance and Unavailability .......................................................................................................... 25
Generation Performance and Availability ................................................................................................................. 33
System Protection and Disturbance Performance .................................................................................................... 35
Chapter 4: Severity Risk Index ....................................................................................................................................... 40
Severity Risk Index and Trends .................................................................................................................................. 41
Severity Risk Index by Interconnection ..................................................................................................................... 44
Chapter 5: Trends in Priority Reliability Issues .............................................................................................................. 50
Emerging Risk Areas .................................................................................................................................................. 50
BPS Planning and Adapting to the Changing Resource Mix ...................................................................................... 50
Protection and Control Systems ................................................................................................................................ 53
Transmission Outages Related to Human Performance ........................................................................................... 55
Loss of Situation Awareness ...................................................................................................................................... 59
Bulk Electric System Impact of Extreme Event Days ................................................................................................. 61
Restoration Analysis to Evaluate Resilience of the Transmission System under Extreme Weather ........................ 67
Cyber and Physical Security ....................................................................................................................................... 72
Appendix A: Reliability Indicator Ratings and Descriptions .......................................................................................... 79
Appendix B: Contributions ............................................................................................................................................ 88

NERC | State of Reliability | 2021 iii
Preface
Electricity is a key component of the fabric of modern society and the Electric Reliability Organization (ERO) Enterprise serves to strengthen that fabric. The vision for the ERO Enterprise, which is comprised of the North American Electric Reliability Corporation (NERC) and the six Regional Entities (REs), is a highly reliable and secure North American bulk power system (BPS). Our mission is to assure the effective and efficient reduction of risks to the reliability and security of the grid.
Reliability | Resilience | Security Because nearly 400 million citizens in North America are counting on us
The North American BPS is made up of six RE boundaries as shown in the map and corresponding table below. The multicolored area denotes overlap as some load-serving entities participate in one RE while associated Transmission Owners/Transmission Operators participate in another.
MRO Midwest Reliability Organization
NPCC Northeast Power Coordinating Council
RF ReliabilityFirst
SERC SERC Reliability Corporation
Texas RE Texas Reliability Entity
WECC WECC

NERC | State of Reliability | 2021 iv
About This Report
The purpose of this yearly report is to provide objective and concise information to policymakers, industry leaders, and the NERC Board of Trustees (Board) on issues that affect the reliability and resilience of the North American BPS. Specifically, the report does the following:
Identifies system performance trends and emerging reliability risks
Reports on the relative health of the interconnected system
Measures the success of mitigation activities deployed NERC, as the ERO of North America, works to assure the effective and efficient reduction of risks to reliability and security for the North American BPS. Annual and seasonal risk assessments look to the future and special reports on emergent risks serve to identify and mitigate potential risks. Additionally, analyses of past BPS performance serve to document BPS adequacy and to identify positive or negative performance trends. The annual State of Reliability report is one such analysis of past performance that informs regulators, policymakers, and industry leaders while providing strong technical support for those interested in the underlying data and detailed analytics.
Impact of February 2021 Cold Weather Event The Federal Energy Regulatory Commission (FERC), NERC, and RE staff (MRO, RF, SERC, Texas RE) are conducting a joint inquiry into the operations of the BPS during the extreme winter conditions experienced by the Midwest and South-Central United States in February 2021. The inquiry includes the following:
Assessing what occurred during this event
Identifying commonalities with previous cold weather events
Any lessons to be incorporated in the on-going development by NERC of cold weather Reliability Standards
Making recommendations to avoid similar events and identifying best practices
Market issues are not part of the inquiry. An in-depth evaluation of any impacts due to the February 2021 Cold Weather Event on BPS operations in 2021 will be included in the 2022 State of Reliability report, which is typically published mid-year. The 2021 Long-Term Reliability Assessment, which is expected to be published in December 2021, will also assess any longer-term reliability issues that need to be considered in future operations and planning of the BPS.
Development Process The ERO staff developed this independent assessment with support from the Performance Analysis Subcommittee (PAS). The 2021 State of Reliability report focuses on BPS performance during the prior complete year as measured by a predetermined set of reliability indicators and more detailed analysis performed by ERO staff and technical committee participants. This report has been endorsed by the Reliability and Security Technical Committee (RSTC) and accepted by the NERC Board.
Primary Data Sources In addition to a variety of information-sharing mechanisms—including (but not limited to) the NERC RSTC and the Electricity Information Sharing and Analysis Center (E-ISAC)—the ERO administers and maintains the information systems described in Figure AR.1.

About This Report
NERC | State of Reliability | 2021 v
Figure AR.1: Information Systems Administered and Maintained by the ERO
Reading this Report This report is divided into five chapters (see Table AR.1).
Table AR.1: State of Reliability Major Parts
Chapter 1: The North American BPS–By the Numbers1
Detailed statistics on peak demand, energy, generation capacity, fuel mix, transmission miles, and functional organizations
Chapter 2: Event Analysis Review
A detailed review of qualified events analyzed by NERC, including root cause statistics, historical trends, and highlights of published lessons learned
Chapter 3: Reliability Indicators
A set of reliability metrics that evaluate four core aspects of system performance: resource adequacy, transmission performance and availability, generation performance and availability, and system protection and disturbance performance
Chapter 4: Severity Risk Index
A composite daily severity index based on generation, transmission, and load loss as compared to prior years
Chapter 5: Trends in Priority Reliability Issues
Data and analysis from various NERC data sources are compiled to provide clear insights on a variety of priority reliability issues (included assessments help provide guidance to policy makers, industry leaders, and the NERC Board)
1 Definition of BPS: https://www.nerc.com/pa/Stand/Glossary%20of%20Terms/Glossary_of_Terms.pdf

About This Report
NERC | State of Reliability | 2021 vi
Additional Considerations
The data in this report represents the performance for the January–December 2020 operating year unless otherwise noted.
Analysis in this report is based on 2016–2020 data and provides a basis to evaluate 2020 performance relative to performance over the last five years.
This report is a review of industry-wide trends and not a review of the performance of individual entities. Accordingly, information presented in this report is always aggregated to the Interconnection level or the Regional Entity level in order to maintain the anonymity of individual reporting organizations.
The background on approaches, method, statistical tests, and procedures are available by request.
When analysis is presented by Interconnection, the Québec Interconnection (QI) is combined with the Eastern Interconnection (EI) for confidentiality unless specific analysis for the QI is shown.

NERC | State of Reliability | 2021 vii
Executive Summary
The 2021 State of Reliability report captures a year of significant challenges for the BPS. A pandemic, extreme weather, cyber security, and supply chain issues impacted the grid, which is transforming at an incredible pace. This transformation is changing the operational characteristics of the grid in important and meaningful ways, especially the increasing importance and stress being placed on balancing resources generally fueled by natural gas to integrate large amounts on variable generation, and managing this change presents one of the greatest challenges to reliability. Operators and planners are being asked to maintain a system that is becoming more complex and less visible to them, further increasing the risk to reliability. This report highlights events in 2020 that had significant impact to the BPS that reflects this increased risk. However, despite all of these challenges, the BPS continued to perform well since most metrics that are within an operator’s control show a continual improvement or remain stable. As can be found in this report, performance trends in terms of generation, transmission, and protection and control measures are generally positive. 2020 was an exceptional year when considering the conditions within which the BPS performed. It was a year of a COVID-19 global pandemic and one of extreme weather events affecting every Interconnection. In addition, persistent cyber and physical security threats presented critical challenges to BPS reliability that required industry and regulators to remain vigilant. Importantly, the SolarWinds compromise discovered in December 2020 highlighted the extraordinary capability and persistence of adversaries. With appropriate insight, careful planning, and continued support, the sector will continue to navigate the challenges in a manner that maintains reliability. As a core element of the ERO’s mission, NERC remains focused on identifying emerging risks in order to maintain a proactive posture to assure that the BPS remains highly reliable. The majority of technical metrics tracked improvement or remained stable. Planning reserve margins continued to decline, and transmission performance/unavailability declined due to extreme weather and wild fires. The reliability indicators detailed in Chapter 3 are as indicated in Table E.1.
Table E.1: Reliability Indicators
Improving Stable Monitor Actionable
Energy Emergency Alerts in the Texas Interconnection and
Québec Interconnection
Automatic AC Transformer Outages
Transmission Element Unavailability for AC
Circuits
Planning Reserve Margin
Transmission Outage Severity Generation Weighted-
Equivalent Forced Outage Rate
Transmission-Related Events
Resulting in Loss of Load Supported by Event Analysis Data
Automatic AC Transmission Outages
Interconnection Frequency Response
Transmission Element Unavailability for Transformers
Interconnection Reliability Operating Limit
Exceedances
Disturbance Control Standard Metric
Protection System Misoperations

Executive Summary
NERC | State of Reliability | 2021 viii
Key Findings Based on data and information collected for this assessment, NERC has identified seven key findings for 2020.
Key Finding 1 The system was reliable in 2020 despite unprecedented conditions.
2020 was a year of extreme conditions. The global COVID-19 pandemic resulted in work force and process changes that were unprecedented. 2020 was also a year of extreme weather conditions with a record hurricane season, heat waves, derechos, ice storms, and wildfires that challenged the BPS throughout the year. Among the measures tracked, firm load (representing 0.0003% of total energy served) was interrupted due to operator-initiated load shed. This represents approximately 22 hours of the year where localized load loss occurred, which is greater than the number of hours for the previous four years combined. Operator-initiated load shed primarily was experienced in the areas where Hurricane Laura made landfall, the California heat wave, and western wild fires. For more detailed information, refer to Chapter 1. No Level 3, 4, or 5 events were identified in the Event Analysis Process (EAP). Refer to Chapter 2 for more details.
Key Finding 2 In Texas and parts of the Western Interconnection, energy and resource adequacy issues escalated in 2020. Local energy-assured generation remains necessary for reliability. The projected capacity deficit in Texas remained a reliability risk in 2020; however, mild weather and better-than-expected performance from the generation fleet, coupled with aggressive demand-side management and price response, helped Texas meet its 2020 summer peak demand. Texas now depends on significant contributions from variable energy resources to meet peak demand. The risk of resource shortfalls is no longer restricted to the summer peak demand periods and must now be anticipated during shoulder months or even winter. NERC’s winter seasonal reliability assessment identified potential EEA risk in parts of North America, including Texas and the United States parts of the WI, due to extreme weather, fuel, and energy issues. Fortuitous conditions enabled Texas to meet peak demand during Summer 2020, but the underlying resource mix and forecasts of future loads remain a significant resource and energy adequacy concern for Texas. A broad-based cold weather event across the middle part of the country and reaching into the southernmost part of Texas led to unprecedented load shedding in February of 2021, which will be detailed in a joint NERC-FERC inquiry underway at the time of this publication and summarized in next year’s 2022 State of Reliability Report. For more detailed information, refer to Chapter 3. In the West, electricity supplies fell short of record-high demand during a wide-area heatwave that resulted in load shedding for over 800,000 customers in August. This event highlights the resource and energy adequacy risks from extreme events. This event is analyzed in Chapter 1.
Key Finding 3 In 2020, cyber security attacks and vulnerabilities remain a significant concern. The threat landscape continued to expand as an increase of cyber incidents that involved ransomware and supply chain compromises were conducted by capable nation-state and criminal adversaries. NERC released two Level 2 NERC alerts related to specific cyber and supply chain-related threats from nation-state adversaries to help industry understand the extent of conditions. The information gleaned from the alerts demonstrated the complexity of the threat and suggested the need for the reliability and security ecosystem, including government partners in the United States and Canada, to rethink how the industry supply chain is secured. While these threats impacted information technology networks, the E-ISAC also began to address operational technology risk through new pilot projects designed to enhance visibility into critical operational technology systems (e.g., supervisory control and data acquisition and energy management systems). Additionally, the expansion of new technologies and the number of utilities participating in the Cybersecurity Risk Information Sharing Program (CRISP) has given the E-ISAC additional visibility into the threat facing industry corporate and operational technology networks. However, as the threat has grown, so too has the voluntary reporting of incidents to the E-ISAC, resulting in greater industry awareness. Reports of suspicious cyber activity, vulnerabilities, phishing, malware, denial of service, and other cyber-related reports increased significantly, showing a greater focus on voluntary information sharing by industry. Finally, there were no

Executive Summary
NERC | State of Reliability | 2021 ix
reported cyber or physical security incidents in 2020 that resulted in loss of load. For more detailed information, refer to Chapter 5.
Key Finding 4 In 2020, large weather-related event restoration supported resilience of the BPS in measuring restoration after
extreme weather.
New areas of analysis that were performed in 2020 support an understanding of the trends in transmission outage severity and restoration of large weather-related transmission outage events. In the transmission outage severity analysis, there was an improving trend identified over the last five years that showed that transmission outages resulted in less severe reliability impacts. In the large weather-related transmission event restoration analysis, NERC demonstrated new analysis that examined large event restoration. This analysis concerns events with 20 or more transmission outages and illustrates the time it takes to restore 95% of elements or 95% of the transmission capacity. The analysis presents a study of 18 such large events in 2020 that create a starting point for measuring the resilience of the transmission system following a major event initiated by weather. For more detailed information, refer to Chapter 5.
Key Finding 5 In 2020, the protection system misoperations rate continues to decrease.
Protection system misoperations exacerbate the severity of transmission outages. The overall misoperations rate was slightly lower in 2020 versus 2019 (6.36%, down from 6.97% in 2019). The misoperations rate trends downward as registered entities continue to place importance on improving focus in this area. For more detailed information, refer to Chapter 3.
Key Finding 6 2020 was the highest year for ac circuit unavailability of the five-year analysis period due to extreme weather. The increase in ac circuit unavailability to its highest point in the five-year average was the result of the extreme weather in 2020. In particular, Hurricane Laura, the August western heat event, and the October ice storm in Texas contributed to the decline in this metric; absent those events, this metric’s performance would be on par with previous years. The trend of transmission outages caused or initiated by human error and equipment failures has been improving over the five-year analysis period. For more detailed information, refer to Chapter 3.
Key Finding 7 In 2020, the number of EAP-qualified transmission-related events that resulted in load loss was greater than the previous year and the five-year median. Twelve distinct non-weather-related transmission events resulted in loss of firm load that met the EAP reporting threshold. Analysis indicates no discernable trend in the number of annual events. The median firm load loss over the past five years was 183 MW; in 2020, the median was 95 MW. This represents an increase in the number of events in 2020 but a decrease in the median load loss below the five-year median firm demand interrupted. For more detailed information, refer to Chapter 3.
Recommendations Based on these key findings, NERC formulated the following high-level recommendations:
The ERO and industry should continue improving their ability to model, plan, and operate a system with a significantly different resource mix. Priority should be given to understanding the implications of the following:
Frequency response under low inertia conditions
Contributions of inverter-based resources to essential reliability services
Increasing protection system and restoration complexities with increased inverter-based resources

Executive Summary
NERC | State of Reliability | 2021 x
With the transformation of the resource mix towards one that can exhibit energy limitations during wide-spread, long-duration extreme events, application of energy planning approaches, including expected unserved energy metrics should be used alongside traditional capacity planning approaches that highlight the implications of the planned resource mix on the sufficiency of energy. Application of energy metrics can lead to a resource mix that can be more resilient to widespread, long-duration extreme events.
System planners should evaluate the need for flexibility as conventional generation retirements are considered by industry and policymakers. Retirement planning studies should consider Interconnection-level impacts and sensitivity assessments associated with the loss of critical transmission paths and the loss of local generation in larger load pockets.
The ERO and industry should develop comparative measurements and metrics to understand the different dimensions of resilience (e.g., withstanding the direct impact, managing through the event, recovering from the events, preparing for the next event) during the most extreme events and how system performance varies with changing conditions.
The ERO, industry, and government should significantly increase the speed and detail of cyber and physical security threat information sharing in order to counter the increasingly complex and targeted attacks by capable nation-state adversaries and criminals on critical infrastructure. This should be complemented by a review of cyber security standards, supply chain procurement, and risk assessment. In addition, with the successful SolarWinds compromise, a new single-attack vector that would effectively mimic a coordinated attack raises significant concerns about protection of any and all externally routable devices regardless of their individual scale or impact. This suggests a review of the CIP standard’s bright-line criteria between high, medium, or low impact assets should be initiated.
Emerging Risk Areas In the 2019 ERO Reliability Risk Priorities Report,2 high level risks were identified. The following recommendations for these risks are included in Chapter 5:
Grid Transformation:
BPS Planning and Adapting to the Changing Resource Mix
Protection and Control Systems
Transmission Outages Related to Human Performance
Loss of Situation Awareness
Extreme Natural Events:
Bulk Electric System Impact of Extreme Event Days
Security Risks:
Cyber and Physical Security
2 https://www.nerc.com/comm/RISC/Related%20Files%20DL/RISC%20ERO%20Priorities%20Report_Board_Accpeted_November_5_2019.pdf

NERC | State of Reliability | 2021 1
Chapter 1: The North American BPS—By the Numbers
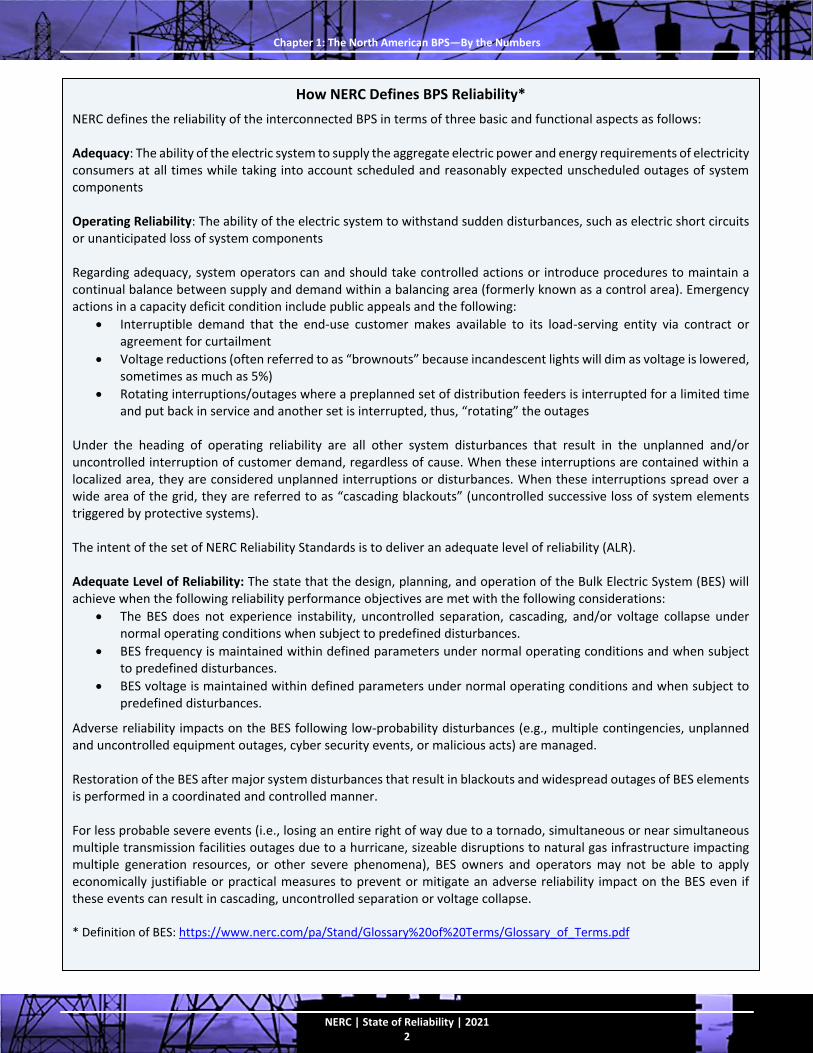
Figure 1.1 highlights a few key numbers and facts about the North American BPS. The How NERC Defines BPS Reliability* on the next page contains the definition of BPS reliability.
Figure 1.1: 2020 BPS Inventory and Performance Statistics and Key Functional Organizations
Chapter 1: The North American BPS—By the Numbers
NERC | State of Reliability | 2021 2
How NERC Defines BPS Reliability*
NERC defines the reliability of the interconnected BPS in terms of three basic and functional aspects as follows: Adequacy: The ability of the electric system to supply the aggregate electric power and energy requirements of electricity consumers at all times while taking into account scheduled and reasonably expected unscheduled outages of system components Operating Reliability: The ability of the electric system to withstand sudden disturbances, such as electric short circuits or unanticipated loss of system components Regarding adequacy, system operators can and should take controlled actions or introduce procedures to maintain a continual balance between supply and demand within a balancing area (formerly known as a control area). Emergency actions in a capacity deficit condition include public appeals and the following:
Interruptible demand that the end‐use customer makes available to its load-serving entity via contract or agreement for curtailment
Voltage reductions (often referred to as “brownouts” because incandescent lights will dim as voltage is lowered, sometimes as much as 5%)
Rotating interruptions/outages where a preplanned set of distribution feeders is interrupted for a limited time and put back in service and another set is interrupted, thus, “rotating” the outages
Under the heading of operating reliability are all other system disturbances that result in the unplanned and/or uncontrolled interruption of customer demand, regardless of cause. When these interruptions are contained within a localized area, they are considered unplanned interruptions or disturbances. When these interruptions spread over a wide area of the grid, they are referred to as “cascading blackouts” (uncontrolled successive loss of system elements triggered by protective systems). The intent of the set of NERC Reliability Standards is to deliver an adequate level of reliability (ALR). Adequate Level of Reliability: The state that the design, planning, and operation of the Bulk Electric System (BES) will achieve when the following reliability performance objectives are met with the following considerations:
The BES does not experience instability, uncontrolled separation, cascading, and/or voltage collapse under normal operating conditions when subject to predefined disturbances.
BES frequency is maintained within defined parameters under normal operating conditions and when subject to predefined disturbances.
BES voltage is maintained within defined parameters under normal operating conditions and when subject to predefined disturbances.
Adverse reliability impacts on the BES following low-probability disturbances (e.g., multiple contingencies, unplanned and uncontrolled equipment outages, cyber security events, or malicious acts) are managed. Restoration of the BES after major system disturbances that result in blackouts and widespread outages of BES elements is performed in a coordinated and controlled manner. For less probable severe events (i.e., losing an entire right of way due to a tornado, simultaneous or near simultaneous multiple transmission facilities outages due to a hurricane, sizeable disruptions to natural gas infrastructure impacting multiple generation resources, or other severe phenomena), BES owners and operators may not be able to apply economically justifiable or practical measures to prevent or mitigate an adverse reliability impact on the BES even if these events can result in cascading, uncontrolled separation or voltage collapse. * Definition of BES: https://www.nerc.com/pa/Stand/Glossary%20of%20Terms/Glossary_of_Terms.pdf

Chapter 1: The North American BPS—By the Numbers
NERC | State of Reliability | 2021 3
2020 Key Occurrences 2020 was an historic year with the BPS facing many challenges, such as a global pandemic, a record-breaking hurricane season, destructive wildfires, and increasing threats to the supply chain. It is important to acknowledge these occurrences and the context they provide to the assessment of the state of reliability for 2020. This section highlights some of the key occurrences and underscores the importance of human resources, generating resources, extreme climate conditions, grid transformation, and cyber and physical security.
COVID-19 Pandemic While the full impact of the pandemic will not be known for some time, there is no evidence to suggest that the pandemic adversely affected the reliability of the BPS in 2020. Instead, there is ample evidence to suggest that advance planning by the industry and the consistent execution of these plans was highly successful in addressing the unprecedented reliability operating challenges caused by the pandemic. In the spring of 2020, NERC issued a Special Report: Pandemic Preparedness and Operational Assessment.3 Additionally, the NATF, NERC, the U.S. Department of Energy (DOE), and FERC jointly developed the Epidemic/Pandemic Response Plan Resource4 to complement an organization’s business or operations continuity plans with a focus on activities that are specific to the outbreak of a severe epidemic/pandemic. Regular industry-wide table top planning exercises anticipated the impacts of pandemic-like events years ago. They led directly to the development of and regular training for the emergency operating procedures that would be required. In 2020, these procedures were fully deployed. They included sequestering operators for weeks at a time, regular rotations between alternate control centers to allow for deep cleaning between shifts, and testing employees for infection. There are anecdotal reports from many grid operators that, as a result of the procedures, there were few or no reported infections among control room or transmission operating crews. The success of these efforts can be seen in the numbers. By the many measures reported in this report, there were no reductions in the overall reliability performance of the BPS that can be uniquely attributed to the pandemic. Instead, the overall reliability performance of the BPS was largely consistent with that in prior years. Restoration efforts were adapted to adhere to pandemic prevention guidelines, and business continuity plans were activated. A limited number of equipment supply-related disruptions affected the availability of a small number of generators. According to the Generating Availability Data System (GADS), less than 1/2 of 1% of generation outages and derates, calculated by lost potential energy, were attributed to the pandemic, and less than 1/3 of 1% of the total duration of all generator outages and derates can be attributed to pandemic-related causes. None of these impacts, however, prevented the BPS from serving load. The ongoing pandemic did not cause degradation to the operation of the BPS in 2020.
Extreme Weather Conditions Extreme weather events caused challenges at all levels of the BPS—demand, generation, and transmission. Strategies to meet demand need to consider factors beyond traditional resource planning, including the variability of resources, the limited generation caused by large increases in demand, the influence of extreme temperatures on certain forms of generation, and anticipating congestion on transmission lines. Increases in the frequency and duration of extreme weather conditions challenged the BPS. 2020 saw an historic number of hurricanes make landfall on the continental United States, resulting in significant damage to the transmission system, distribution system, and customer facilities across a wide swath of the southeastern United States. Extreme heat and wildfires occurred across a large portion of the WI; an ice storm in Texas and parts of the southeast; thunderstorms, tornados, and other damaging wind events occurred across North America. Several of these extreme weather events are highlighted below.
3 https://www.nerc.com/pa/rrm/bpsa/Alerts%20DL/NERC_Pandemic_Preparedness_and_Op_Assessment_Spring_2020.pdf 4 https://www.natf.net/documents

Chapter 1: The North American BPS—By the Numbers
NERC | State of Reliability | 2021 4
2020 Hurricane Season Impacts A record 30 named storms formed during the 2020 hurricane season in the Atlantic with 13 becoming hurricanes and 6 becoming major hurricanes—Category 3 or higher. This compares to the long-term average of 12 named storms, 6 hurricanes, and 3 major hurricanes.5 This resulted in 60–65 billion dollars of physical and economic damage according to AccuWeather estimates.6
With very few exceptions, the BPS reacted correctly to the damage it sustained with relays acting properly to protect the system by removing lines that experienced faults. There were some control centers that temporarily lost the ability to monitor their system due to either loss of data feeds or loss of power. In these cases, the entities were able to successfully transition to backup control centers. Efforts to restore power were aided by mutual assistance agreements with other utilities and use of contractors. One method being used to evaluate resilience is the measurement of the time to substantial system recovery. To translate this to the transmission system, this is being measured as the time to restore the availability of the elements using data reported to Transmission Availability Data Systems (TADS). The Restoration Analysis to Evaluate Resilience of the Transmission System under Extreme Weather section in Chapter 5 provides details on a method under development by NERC and industry.
Texas Ice Storm October 2020 An ice storm moved across northern Texas on October 26–28, tripping 47 345 kV lines (8% of total ERCOT 345 kV circuits)7 at various times and ultimately isolated the Panhandle; the storm moved from the west to the east and tripped transmission lines causing islanding of the Panhandle from the rest of the ERCOT grid. The amount of generation and load in the Panhandle was not sufficient to support the island after the last transmission line tripped off-line. The wind generation in the Panhandle was forecasted to be low in the days leading to October 27 and 28 due to a cold front approaching the area. Multiple wind generators experienced forced outages or derates that started on October 26 and 27. The wind turbines eventually were unable to generate due to equipment icing. One natural gas generation facility was producing the majority of the generation in the Panhandle before the last line connecting the Panhandle was lost at 10:28 a.m. Central time on October 28 with 201.6 MW of generation tripped off. The storm reached the Panhandle late in the evening on October 27 and peaked the morning of October 28. In addition to causing widespread wind turbine outages, the weather conditions caused ice to build up on Panhandle transmission lines, leading to galloping conductors and static wire and arm failures. Secondary station service sources were lost during the event because local distribution feeds were unavailable due to system damage (Figure 1.2). Portable generators were used for establishing emergency local station services. Due to the effects of the ice storm on transportation infrastructure, crews were not able to immediately assess damage to the transmission lines. The ERCOT TOPs in the area impacted by the ice storm only knew that damage existed by observing repeated trips when attempts were made to remotely energize the outaged lines. Panhandle generation was not connected back to the grid until enough lines were restored such that reliable operations in the Panhandle could be re-established. The majority of the transmission was restored within two to three days. The longest circuit restoration was 24 days.
5 https://www.nhc.noaa.gov/text/MIATWSAT.shtml 6This comes from https://www.accuweather.com/en/hurricane/record-breaking-2020-hurricane-season-caused-60-billion-to-65-billion-in-economic-damage/858788 7 Included in the transmissions lines tripped were five generator lead lines that are not required to report to TADS.

Chapter 1: The North American BPS—By the Numbers
NERC | State of Reliability | 2021 5
Figure 1.2: Location of October 2020 Ice Storm and Examples of Transmission System Damage
California Load Shed Event August 20208 From August 14–19, the western United States suffered an intense and prolonged heatwave that affected many areas across the WI. Because of above-average temperatures, generation and transmission capacity strained to keep up with increased electricity demand. The impacts of the August heatwave struck the entirety of the WI and caused a peak demand record of just over 162,000 MW on August 18, 2020, at 4:00 p.m. Pacific time. This increased demand caused several Balancing Authorities (BA) to declare energy emergencies. One BA, the California Independent System Operator, shed firm load to maintain the operating reserves needed to preserve the reliability and security of the BPS. Several other entities reported being one contingency away from needing to shed load as well. Because of the extreme effects on the entire WI, WECC analyzed this heatwave event by using the structure of the ERO’s EAP. WECC identified four contributors to the Interconnection’s susceptibility to the heatwave event:
Extremely high demand
Transmission system constraints
Inaccurate demand and generation forecasting
Resource adequacy NERC’s seasonal assessments include seasonal risk assessments (i.e., Summer Reliability Assessments and Winter Reliability Assessments) as part of assessing resource adequacy.9,10 The operational risk analysis provides a deterministic scenario for understanding how various factors affecting resources and demand can combine to impact overall resource adequacy. The 2020 Summer Reliability Assessment indicated potential resource shortfalls in the event of extreme operating conditions for WECC-CAMX and WECC-SRSG, shown in Figure 1.3 and Figure 1.5. Anticipated resources shown are not inclusive of any import capabilities either area may have. Comparatively, the real-time operating conditions on August 14, 2020, for the WECC-CAMX and WECC-SRSG areas are shown in Figure
8 Summary based on the following: WECC August 2020 Heatwave Event Analysis Report 9 More details on Seasonal Risk Assessments can be found in the 2020 Summer Reliability Assessment on page 15. 10 Winter Reliability Assessment: https://www.nerc.com/pa/RAPA/ra/Reliability%20Assessments%20DL/NERC_WRA_2020_2021.pdf

Chapter 1: The North American BPS—By the Numbers
NERC | State of Reliability | 2021 6
1.4 and Figure 1.6.11 The seasonal risk scenarios provided by NERC look at the anticipated risk hour as opposed to the real-time conditions figures that are a snapshot in time during the heatwave event. Figure 1.4 includes the California BA portions of WECC-NWPP as part of the forecasts and actual conditions.
Figure 1.3: WECC-CAMX Seasonal Risk Assessment
Figure 1.4: WECC-CAMX 7:00 p.m. Pacific Time. Forecast vs. Actual Conditions
11 Net Internal Demand is defined on page 163 of NERC’s 2020 Long-Term Reliability Assessment. A 50/50 forecast means there is a 50% probability that the actual demand will be higher and a 50% probability that the actual demand will be lower than the provided value for the given season/year. A 90/10 forecast means there is a 10% probability that the actual demand will be higher and a 90% probability that the actual demand will be lower than the provided value for the given season/year.

Chapter 1: The North American BPS—By the Numbers
NERC | State of Reliability | 2021 7
Figure 1.5: WECC-SRSG Seasonal Risk Assessment
Figure 1.6: WECC-SRSG 5:00 p.m. Pacific Time. Forecast vs. Actual Conditions
Extremely High Demand The heatwave affected the entire WI with prolonged high temperatures that resulted in record demand for electricity. With temperatures between 15 and 30 degrees Fahrenheit above normal, many areas in the western United States broke daily heat records. Although demand peaked on August 18, the most severe reliability consequence of the heatwave event, California Independent System Operator’s load shedding, occurred at the beginning of the heatwave on August 14 and 15. WECC analysis found that increased demand during summer months is creating more competition for available generation, and EEAs, during the heatwave, indicate generation availability challenges and that Reliability Standard BAL-002-WECC-2a may not be applied consistently by BAs.
Transmission System Constraints The WI is characterized by abundant generation in the north and large load centers in the south. The system that connects these generation and load centers contains transmission facilities along the west and east sides of the Interconnection with few facilities in the middle, creating a transmission system loop. During the August heatwave, generation from the north flowed south to feed demand, travelling through the west and east sides of the transmission loop. As demand increased in the south, energy flow on the west side of the loop increased, creating congestion.

Chapter 1: The North American BPS—By the Numbers
NERC | State of Reliability | 2021 8
WECC analysis found that planned and forced transmission outages limited north-to-south energy transfers, unscheduled flow contributed to transmission line congestion in Northwest AC Intertie (NWACI), and phase-shifting transformers (PST) were not used to mitigate unscheduled flow on non-qualified paths, such as NWACI. Planned outages that were returnable were recalled prior to the heat wave. PST's were not used to manage congestion on NWACI caused by unscheduled flow during the heatwave because NWACI was not a qualified path included in the WECC Unscheduled Flow Mitigation Procedure (UFMP). Inaccurate Demand and Generation Forecasting Many entities’ demand and generation availability forecasting proved inaccurate during the heatwave event. Even day-ahead demand forecasting may have been inaccurate and may have masked potential reliability problems. Responding to resource shortfalls in real-time does not give entities enough time to enact mitigation measures like using generators that require longer start-up times or restoring generation and transmission facilities that may be out of service for maintenance. WECC analysis found that inaccurate day-ahead demand forecasts caused an increase in real-time requests for available generation that contributed to reduced generation availability.
Resource Adequacy Resource adequacy was identified as one of the top reliability risks at WECC’s Reliability Workshop held in February 2020. WECC subsequently adopted resource adequacy as one of its four reliability risk priorities for 2020 and beyond. The August 2020 heatwave event underscores the urgency for WECC to address resource and energy adequacy challenges more aggressively. WECC analysis found that variable energy resources contributed to the inability to meet peak demand and that outreach programs played a role in avoiding additional outages during the heatwave event. Extreme weather events caused challenges at all levels of the BPS—demand, generation, and transmission. Strategies to meet demand need to consider factors beyond traditional resource planning that include the variability of resources, the limited generation caused by large increases in demand, the influence of extreme temperatures on certain forms of generation, and the anticipating of congestion on transmission lines.
Wildfires Wildfires are extreme natural events that can impact the equipment, resources, or infrastructure required to operate the BPS. In recent years, wildfires have wrought havoc throughout the WI and the change of weather conditions increase the opportunities for wildfires to ignite and propagate throughout North America. In recognition of this threat, NERC created a reference guide12 to serve as a resource for utilities in high fire-threat areas that want to proactively develop wildfire mitigation plans to maintain and promote the reliability and resilience of the electric grid. While 2020 was a year of significant acreage burned, no correlation is seen between annual wildfire acreage and number of transmission outages caused by wildfire in TADS outage data. This is because transmission outages are caused not by wildfire acreage in general but by their very specific locations. Nevertheless, fire risk conditions (long term dry conditions and extreme weather, such as elevated temperatures and wind) can cause changes in operating protocols and will result in additional automated operations within the electrical network. For example, lines may be taken out of service to support fire suppression operations near BPS elements. The principal impact of wildfires on the BPS is that they can initiate automated actions to take transmission lines off-line. Figure 1.7 shows a map of the west with transmission lines and footprint of wildfires in 2020.
12 https://nerc.com/comm/RSTC/Documents/Wildfire%20Mitigation%20Reference%20Guide_January_2021.pdf

Chapter 1: The North American BPS—By the Numbers
NERC | State of Reliability | 2021 9
Figure 1.7: Map of Transmission Lines and Footprint of Wildfires in 2020 Operation of the BPS can be impacted in areas where wildfires are active as well as areas where there is heightened risk of wildfire ignition due to weather and ground conditions. Wildfire prevention planning in California and other areas include power shut-off programs in high fire-risk areas. When conditions warrant implementing these plans, power lines, including transmission-level lines, may be preemptively de-energized in high fire-risk areas to prevent the facilities from igniting wildfire. Other wildfire risk mitigation activities include implementing enhanced vegetation management, equipment inspections, system hardening, added situational awareness measures, and operational strategies. When wildfire weather conditions exist, operators may reconfigure network settings, and as the conditions worsen or fires occur, they may de-energize lines to limit damage or facilitate fire responses. In extreme instances, these actions also involve the shedding of firm load. Well-publicized instances of these actions are the Power Safety
Wildfire Perimeters 2020 WECC Transmission Lines 100–199 kV 200–299 kV 300–399 kV 500 kV + 500 kV DC

Chapter 1: The North American BPS—By the Numbers
NERC | State of Reliability | 2021 10
Power Shutoff (PSPS)13 events initiated by California utilities in 2019 and 2020. Review of 2020 PSPS events by NERC staff reveals that the events affected only distribution circuits; no bulk transmission lines were involved. NERC also records operator-initiated outages of transmission lines in TADS, but TADS does not record whether the actions were initiated due to the threat of wildfires. While the majority of wildfires result from natural causes, there can be situations where utility equipment may operate or be damaged and result in an ignition risk. The cause of the devastating Camp Fire in Paradise, California, in 2019, for example, has been traced to flashover from transmission lines owned by Pacific Gas and Electric during a high wind event. Looking to the future, various factors are expected to contribute to ongoing elevated fire risks, including extreme weather, fuel management practices, and increased human occupation of the wildland urban interface.
Cyber and Physical Security
December 2020 Supply Chain Compromise Increasing threats to the supply chain continued to be front and center throughout 2020 that culminated with the disclosure in December 2020 of a complicated supply chain attack that leveraged SolarWinds’ Orion software and Microsoft’s Azure cloud environment by a capable nation-state adversary. In response to the significant and wide-reaching threat posed by the SolarWinds compromise, the E-ISAC hosted a rapid industry and partner call, activated the E-ISAC Critical Broadcast Program, and shared actionable information from FireEye, Microsoft, CrowdStrike, the U.S. Department of Homeland Security, the National Security Agency, and the Canadian Cybersecurity Centre with U.S. government officials and industry. NERC also issued a Level 2 alert to understand the extent of condition in the industry and determined that 25% of electric utilities had downloaded malicious software; that said, no outages were related to the event. Industry worked well with Canadian and U.S. government officials to share information, develop tools to aid in detection, and identify lessons for future response. The response carried well into 2021, and lessons continue to emerge as this report is published.14 While there was no loss of load in North America from SolarWinds or any other reportable cyber security incidents in 2020, the cyber and physical security of industry supply chains must remain in the forefront of industry resilience planning. In order to improve the collective defense of the industry (or BPS), industry should share more information with the E-ISAC. Industry must also adapt to a threat landscape where adversaries adopt new tactics, new vulnerabilities are exploited, and the magnitude of potential impacts change as the grid evolves and cross-sector interdependencies increase.
13 https://www.cpuc.ca.gov/psps/ 14 Further information on this extensive campaign may be found in the joint FERC-E-ISAC White Paper: https://www.nerc.com/pa/CI/ESISAC/Documents/SolarWinds%20and%20Related%20Supply%20Chain%20Compromise%20White%20Paper.pdf

NERC | State of Reliability | 2021 11
Chapter 2: Event Analysis Review
The EAP15 is used when examining events that cause disruptions on the BPS. The EAP makes use of the ERO Bulk Power System Awareness (BPSA) program to provide real-time notification of potential events on the BPS. When a participating NERC registered entity experiences an event, a determination of analysis qualification is made based on certain BPS reliability impact criteria. Qualifying events are assigned to one of five categories described by this criteria as listed in Figure 2.2. Analysis is conducted based on reporting and dialogue with the impacted registered entity. Review and analysis of this information helps identify potential reliability risks, corroborate established reliability risks, and/or emerging reliability threats. The ERO and partner entities can address these reliability concerns by promoting reliability through collaboration with each other and by being learning organizations. The primary reason for participating in an event analysis is to determine if there are lessons to be learned and shared with the industry. The analysis process involves identifying what happened, why it happened, and what can be done to prevent recurrence. Identification of the sequence of events answers the “what happened” question, and determination of the root cause of an event answers the “why” question. Event analysis ultimately helps to identify trends on the BPS. These trends may reveal a need for action, such as the issuance of a NERC alert to the owners and operators of the system or to initiate the development of or revisions to Reliability Standards.
Bulk Power System Awareness, Inputs, and Products NERC BPSA collects and analyzes information on system disturbances and other incidents that have an impact on the North American BPS and disseminates this information to internal departments, registered entities, regional organizations, and governmental agencies as necessary. Also, BPSA monitors ongoing storms, natural disasters, and geopolitical events that may potentially impact or are currently impacting the BPS. Figure 2.1 illustrates several monitoring sources, which includes owners and operators submitting a U.S. Department of Energy: Office of Electricity (DOE-OE) Form 417 and/or the event reporting form found in NERC Reliability Standard EOP-004. NERC also processes data coming in from intelligent alarms, GPS-synchronized frequency sensors via the FNET monitoring operated by the University of Tennessee, and messages through the Reliability Coordinator Information System. As a result of the gathering and analysis of BPSA data, a NERC alert may be published if warranted.
Figure 2.1: Bulk Power System Awareness by the Numbers
15 For purposes of this report, the EAP in effect was version 4.0: https://www.nerc.com/pa/rrm/ea/ERO_EAP_Documents%20DL/ERO_EAP_v4.0_final.pdf

Chapter 2: Event Analysis Review
NERC | State of Reliability | 2021 12
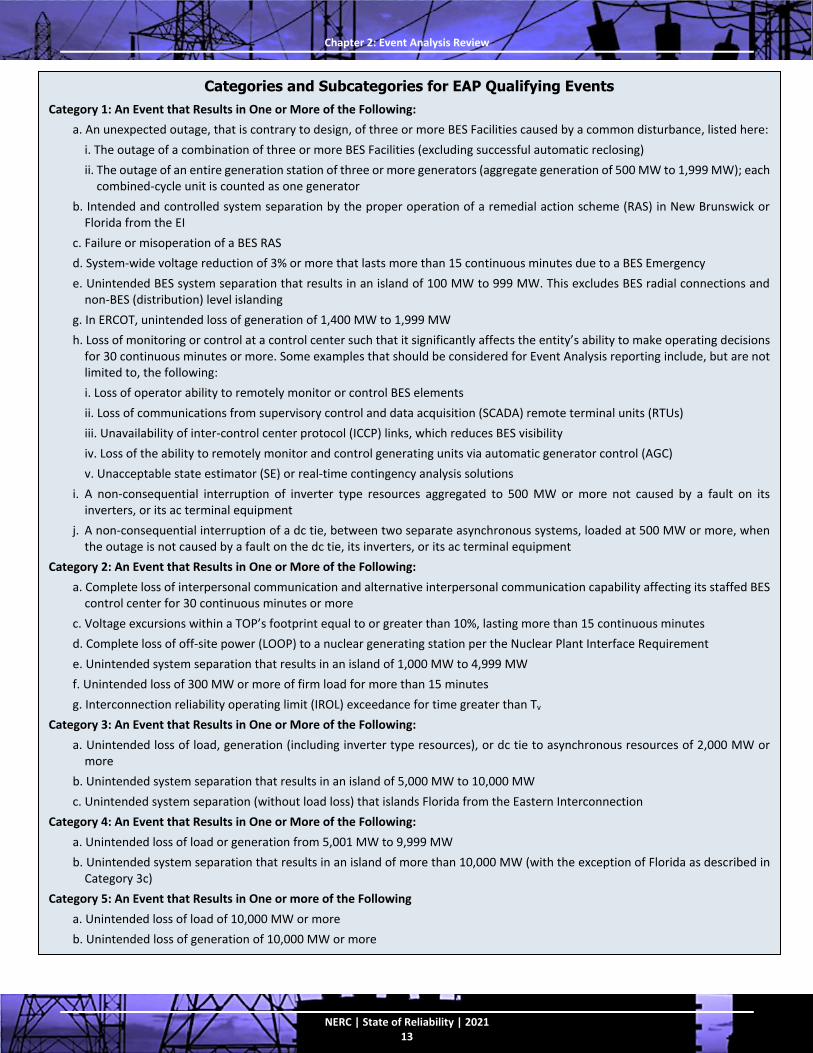
2020 Event Analysis Summary In 2020, industry reported 118 qualified events to the ERO Enterprise. The majority of the reports (117) were Category 1 events. The most common event categories reported in 2020 were the loss of monitoring or control at a control center (58) and the loss of three or more BPS facilities (53). There was one Category 2 event and no Category 3, 4, or 5 events in 2020. See Figure 2.2–Figure 2.4 for a summary of events.
Figure 2.2: 2020 Qualified Events by Category Events are assigned Category 1 through 5 in accordance with the ERO EAP version 4.0. The text box on the next page is an excerpt with the full definitions of the categories used in 2020.16
16 Category 1f and 2b were retired as of Version 3.0 of the ERO EAP.
Chapter 2: Event Analysis Review
NERC | State of Reliability | 2021 13
Categories and Subcategories for EAP Qualifying Events
Category 1: An Event that Results in One or More of the Following:
a. An unexpected outage, that is contrary to design, of three or more BES Facilities caused by a common disturbance, listed here:
i. The outage of a combination of three or more BES Facilities (excluding successful automatic reclosing)
ii. The outage of an entire generation station of three or more generators (aggregate generation of 500 MW to 1,999 MW); each combined-cycle unit is counted as one generator
b. Intended and controlled system separation by the proper operation of a remedial action scheme (RAS) in New Brunswick or Florida from the EI
c. Failure or misoperation of a BES RAS
d. System-wide voltage reduction of 3% or more that lasts more than 15 continuous minutes due to a BES Emergency
e. Unintended BES system separation that results in an island of 100 MW to 999 MW. This excludes BES radial connections and non-BES (distribution) level islanding
g. In ERCOT, unintended loss of generation of 1,400 MW to 1,999 MW
h. Loss of monitoring or control at a control center such that it significantly affects the entity’s ability to make operating decisions for 30 continuous minutes or more. Some examples that should be considered for Event Analysis reporting include, but are not limited to, the following:
i. Loss of operator ability to remotely monitor or control BES elements
ii. Loss of communications from supervisory control and data acquisition (SCADA) remote terminal units (RTUs)
iii. Unavailability of inter-control center protocol (ICCP) links, which reduces BES visibility
iv. Loss of the ability to remotely monitor and control generating units via automatic generator control (AGC)
v. Unacceptable state estimator (SE) or real-time contingency analysis solutions
i. A non-consequential interruption of inverter type resources aggregated to 500 MW or more not caused by a fault on its inverters, or its ac terminal equipment
j. A non-consequential interruption of a dc tie, between two separate asynchronous systems, loaded at 500 MW or more, when the outage is not caused by a fault on the dc tie, its inverters, or its ac terminal equipment
Category 2: An Event that Results in One or More of the Following:
a. Complete loss of interpersonal communication and alternative interpersonal communication capability affecting its staffed BES control center for 30 continuous minutes or more
c. Voltage excursions within a TOP’s footprint equal to or greater than 10%, lasting more than 15 continuous minutes
d. Complete loss of off-site power (LOOP) to a nuclear generating station per the Nuclear Plant Interface Requirement
e. Unintended system separation that results in an island of 1,000 MW to 4,999 MW
f. Unintended loss of 300 MW or more of firm load for more than 15 minutes
g. Interconnection reliability operating limit (IROL) exceedance for time greater than Tv
Category 3: An Event that Results in One or More of the Following:
a. Unintended loss of load, generation (including inverter type resources), or dc tie to asynchronous resources of 2,000 MW or more
b. Unintended system separation that results in an island of 5,000 MW to 10,000 MW
c. Unintended system separation (without load loss) that islands Florida from the Eastern Interconnection
Category 4: An Event that Results in One or More of the Following:
a. Unintended loss of load or generation from 5,001 MW to 9,999 MW
b. Unintended system separation that results in an island of more than 10,000 MW (with the exception of Florida as described in Category 3c)
Category 5: An Event that Results in One or more of the Following
a. Unintended loss of load of 10,000 MW or more
b. Unintended loss of generation of 10,000 MW or more

Chapter 2: Event Analysis Review
NERC | State of Reliability | 2021 14
The data in Figure 2.3 demonstrates a continued decrease in the total number of EAP qualified events over the past five years.
Figure 2.3: Number of EAP Qualified Events per Category by Year Figure 2.4 indicates the identified event root cause as a percentage of the total for EAP qualified events processed to date. The largest percentage of root causes for each year are Management/Organization and Design/Engineering. These are discussed in more detail in the Event Trends section below.
Figure 2.4: Identified Event Root Causes by Percentage (Processed to Date17)
17 The event analysis processing cycle is such that reporting and analysis of the previous year (2020) are not necessarily complete by the data cutoff time of this report.

Chapter 2: Event Analysis Review
NERC | State of Reliability | 2021 15
Event Trends There were 782 event reports submitted between 2016 and 2020 with 118 of those submitted during 2020. Of the total reported events, 724 have been processed to date. Of the total events processed over the past five years, 42% did not yield a root cause due to inconclusive information. A root cause could not be identified in 13% of the processed events due to third parties18 involved in the event beyond the reporting entity’s control, 9% due to difficulty in discerning a singular event root cause from the available information, and 20% due to reporting limited to what happened (Failure/Error Mode) rather than why it happened. Over the past five years, the percentage of events where a root cause could not be identified has decreased; this is down from a high of 48% of reports in 2016 to 34% in 2020 as of data cutoff for this report. Potential reasons for this reduction are the following: increased industry awareness, strengthened collaboration within the ERO Enterprise and with industry, and the availability of reportable data. Over the past five years, the percentage of processed events where a root cause could not be identified demonstrates a decreasing trend as shown in Figure 2.5. Continued focus by industry on reporting and information quality will support a continued reduction in the percentage of events where a root cause cannot be identified.
Figure 2.5: Percentage of Processed Events with No Root Cause Identified
Of the 418 identified root causes from 2016 to 2020, Management/Organization was identified in 42% as the leading root cause (see Figure 2.6, upper left), a total of 175 events of all identified root causes. Some topics considered in Management/Organization causes are management/supervisory methods, resource management, work organization and planning, and change management efforts. Some examples of these causes are the correct identification of a cause for a previous event but failure to implement corrective actions prior to another similar event occurring, not identifying a special circumstance that needed to be addressed during work, work planning not coordinated with all departments, and failure to recognize that a second system might be impacted by work currently being performed. Design/Engineering was the second leading cause at 29%, or 123 events (see Figure 2.6, upper right), of all identified root causes. Cause considerations include design input, design output, documentation, installation, verification, and operability of design and/or environment issues. Some examples of these causes are shortfall in the scoping of the
18 Third parties may consist of contractors, vendors, or neighboring entities.
Additional Information Sources Required

Chapter 2: Event Analysis Review
NERC | State of Reliability | 2021 16
design because of failure to realize that a protection system was not configured to account for mutual coupling or a protection system’s timer setting was not set to allow another action to complete prior to timing out. In many cases, there were usually processes, procedures, or other barriers that either were not sufficient to catch the error or were not in use. See Figure 2.6 for a summary of event analysis trends.
Figure 2.6: Summary of 2016–2020 Event Analysis Trends In the last five years, the number of events with load loss peaked in 2018 before falling in 2019 and 2020 as shown in the lower left of Figure 2.6. While the number of annual load loss events have varied the associated load loss, averages show no increasing or decreasing trend. The lower right of Figure 2.6 shows a decrease in the number of Category 1 events from 2016 to 2020. A more detailed discussion of Category 1h events is found in Chapter 5 under the Loss of Situation Awareness section.
Event Analysis Lessons Learned In support of the industry led EAP, one the ERO‘s primary objectives is to publish lessons learned that chronicles issues faced by industry and the ways in which those entities who reported the events have changed or are changing their systems, process, procedures, equipment, and/or methods in order to prevent the reoccurrence of such events in the future. By using these lessons learned, entities can better understand challenges experienced by others in similar circumstances that they have faced. They can then examine their own systems to see where they might be able to implement changes in order to prevent a similar event or occurrence on their own system.

Chapter 2: Event Analysis Review
NERC | State of Reliability | 2021 17
In 2020, a total of 11 lessons learned were published. Topics covered included operations, communications, transmission facilities, and relay and protection systems. These topics contain a variety of subjects, including two that focus on cold weather issues. See Table 2.1 for a list of lessons learned published in 2020. The lifetime total for publication of lessons learned through 2020 is 171. Visit the Lessons Learned19 page on the NERC website for a full list of lessons learned published to date.
Table 2.1: Lessons Learned Published in 2020
LL # Category Title
LL20201102 Communications Loss of State Estimator due to Contradicting Information from Dual ICCP Clusters
LL20201101
Transmission Facilities, Bulk-Power System Operations
Cold Weather Operation of SF6 Circuit Breakers
LL20201001 Transmission Facilities Single Phase Fault Precipitates Loss of Generation and Load
LL20200703 Relaying and Protection Systems Lockout Relay Component Failure Causes Misoperation and Reportable Event
LL20200702 Relaying and Protection Systems Verification of AC Quantities during Protection System Design and Commissioning
LL20200701 Relaying and Protection Systems Mixing Relay Technologies in Directional Comparison Blocking Schemes
LL20200602 Bulk-Power System Operations Preventing Energy Emergency Alerts
LL20200601 Bulk-Power System Operations Unanticipated Wind Generation Cutoffs during a Cold Weather Event
LL20200403 Communications Loss of Automatic Generation Control During Routine Update
LL20200402
Transmission Facilities, Bulk-Power System Operations
Protracted Fault in a Transmission Substation
LL20200401
Transmission Facilities, Bulk-Power System Operations
Misoperation of 87N Transformer Ground Differential Relays Causing Loss of Load
19 https://www.nerc.com/pa/rrm/ea/Pages/Lessons-Learned.aspx

NERC | State of Reliability | 2021 18
Chapter 3: Reliability Indicators
This chapter provides a summary of the reliability indicators established by the ERO in concert with the PAS. Reliability indicators tie the performance of the BPS to a set of reliability performance objectives defined by NERC. Reliability performance objectives are established and defined using NERC’s definition of Adequate Level of Reliability. Each reliability indicator is mapped to a specific performance objective and is then evaluated to determine whether the actual performance of the system meets the expectations of ALR. Trending is also developed (typically, a prior five-year historical period), which helps determine whether certain aspects of reliability are improving, declining, or stable. A summary and additional details on methods and approaches follows.
Reliability Indicators and Trends The reliability indicators below represent four core aspects to system performance that are measurable and quantifiable:
Resource Adequacy: Does the system have enough capacity, energy, and ancillary services?
Transmission Performance and Availability: What is the impact of outages on transmission availability? How are the frequency and duration of the causes of transmission outages changing?
Generation Performance and Availability: What is the outage performance of the generation fleet?
System Protection and Disturbance Performance: Will the system withstand disturbances and remain stable?
Reliability performance and trends of individual metrics should be evaluated within the context of the entire set of metrics. Definitions for each metric can be found in Appendix A. Metrics are rated on a four-point color scale:
Red: Actionable, may lead to key finding
Yellow: Monitor
Gray: Stable or no change
Green: Improving Table 3.1 summarizes the reliability indicators categories and names, the color scale applied, and links to each indicator’s chapter of details. Some of the reliability indicators have been evaluated to determine whether they exhibit statistically significant trends or whether the year-on-year changes all fall within a narrower band of confidence. Where statistically significant trends are observed, NERC uses the following notation:

Chapter 3: Reliability Indicators
NERC | State of Reliability | 2021 19
Table 3.1: Summary of Reliability Indicators
Indicator Category
Indicator Name 2020 Performance and Trend Results
Resource Adequacy
Planning Reserve Margin Texas RE-ERCOT Assessment Area
Energy Emergency Alerts
Eastern and Western Interconnections – Not rated for 202020
Texas Interconnection
Québec Interconnection
Transmission Performance
Transmission-Related Events Resulting in Loss of Load Supported by Event Analysis Data
Transmission greater than 100 kV
Transmission Outage Severity Sustained Events of AC Circuits and Transformers
Automatic AC Transmission Outages
Protection System
Human Error
AC Substation Equipment
AC Circuit Equipment
Automatic AC Transformer Outages
Protection System
Human Error
AC Substation Equipment
Transmission Element Unavailability AC Circuits
Transformers
Generation Performance
Generation Weighted-Equivalent Forced Outage Rate
Conventional Generation greater than 20 MW
System Protection and
Disturbance Performance
Interconnection Frequency Response
Eastern Interconnection
Western Interconnection
Texas Interconnection
Québec Interconnection
Disturbance Control Standard Metric Disturbance Recovery Period
Protection System Misoperations BES Protection Systems
Interconnection Reliability Operating Limit Exceedances
Eastern–Québec Interconnection21
Western Interconnection
Texas Interconnection
20 The EEAs rating assignment has been not rated for the EI and WI due to changes in EOP-011, BAL-002, and EEAs related to load shed. The PAS will review and update the ratings for this metric. 21 Eastern and Quebec Interconnections combines the Eastern Interconnection and Québec Interconnection for confidentiality.

Chapter 3: Reliability Indicators
NERC | State of Reliability | 2021 20
Resource Adequacy For this report, two measures have been selected to indicate the status of resource adequacy for the BES: Planning Reserve Margin and EEAs. Planning Reserve Margins present a forward-looking perspective on whether sufficient resources are expected to be available to meet demand. The EEAs provide a real-time indication of potential and actual energy emergencies within an Interconnection.
Planning Reserve Margin
Planning Reserve Margin Texas RE-ERCOT Assessment Area
This indicator answers the following questions:
What assessment areas are anticipating potential capacity deficiencies?
How likely is a capacity deficiency?
How significant is the potential capacity deficit? Planning Reserve Margins are NERC’s primary long-term resource adequacy indicator, defined as the difference in resources (anticipated or prospective) and net internal demand then divided by net internal demand and shown as a percentage. The Planning Reserve Margins (Anticipated Reserve Margin or Prospective Reserve Margin) are compared against the Reference Margin Level to measure resource adequacy for the planning period. Figure 3.1 shows the 2020 summer peak Planning Reserve Margin by assessment area.
Figure 3.1: 2020 Summer Peak Planning Reserve Margins (Anticipated and Prospective
Reserve Margins) 2020 Performance and Trends Projections for increased peak demand in Texas RE-ERCOT indicated the potential for EEAs during summer peak periods. Prior to the arrival of COVID-19 and the resulting mitigations that have impacted electricity demand, ERCOT planners were expecting similarly tight operating conditions to those faced in Summer 2019. The ERCOT Anticipated Reserve Margin had risen from 8.5% in Summer 2019 to 12.9% for Summer 2020. The increase in reserve margin was driven by the addition of over 1.9 GW of on-peak resource capacity. ERCOT’s forecast of peak demand for Summer 2020 was also forecasted to grow in 2020, but higher-growth projections were tempered by COVID-19 economic impacts. The potential for EEAs and operating mitigation at peak load remained into Summer 2020.

Chapter 3: Reliability Indicators
NERC | State of Reliability | 2021 21
The waterfall chart in Figure 3.2 shows that typical generation outages coupled with resource derates for extreme conditions during Summer 2020 could be expected to result in energy emergencies in ERCOT on peak load days, and more severe load or generation outage scenarios had the potential to require load shedding for management. The scenario is based on historic ranges or expectations for generation maintenance outages, forced outages, and capacity derates as well as normal and extreme peak demand scenarios. NERC uses risk analysis such as this to enhance its resource adequacy assessments in each assessment area.
Figure 3.2: Texas RE-ERCOT Seasonal Risk Assessment NERC’s analysis for winter identified potential EEA risk in parts of North America due to extreme weather, fuel, and energy issues for the December 2020 through February 2021 period.22 In the extreme weather risk areas shown in Figure 3.3, NERC warned of the potential for increased demand caused by frigid temperatures along with higher generator forced outages and derated output of some generation resources to create conditions for EEAs. Fuel supply and energy assurance risks were also noted along with concerns in New England, California, and the U.S. Southwest. An in-depth evaluation of impacts due to February 2021 cold weather event on BPS operations will be included in the 2022 State of Reliability report.
22 NERC 2020-2021 Winter Reliability Assessment
Texas RE-ERCOT: Large Assessment Area
2020 Anticipated Reserve Margin: 12.9%
Amount Needed to Meet Reference Margin Level: 2,297 MW

Chapter 3: Reliability Indicators
NERC | State of Reliability | 2021 22
Figure 3.3: 2020–2021 Winter Reliability Assessment Risk Area Map Source, Assumptions, and Limitations This data is gathered and reported annually as part of the NERC long-term and seasonal reliability assessments. The reports are the 2020 Summer Reliability Assessment,23 the 2020/2021 Winter Reliability Assessment,24 and the 2020 Long-Term Reliability Assessment.25
23 NERC 2020 Summer Reliability Assessment 24 NERC 2020/2021 Winter Reliability Assessment 25 NERC 2020 Long-Term Reliability Assessment

Chapter 3: Reliability Indicators
NERC | State of Reliability | 2021 23
Energy Emergency Alerts
Energy Emergency Alerts
Eastern and Western Interconnections – Not rated for 202026
Texas Interconnection
Québec Interconnection
This indicator answers the following questions:
How often is the BPS in an energy emergency condition?
What areas are experiencing the most energy emergency conditions? 2020 Performance and Trends In 2020, a total of 17 EEA Level 3 alerts were declared, three fewer than the previous year. While the number of EEAs decreased, five in 2020 included the shedding of firm load compared to last year, and four of the five events in 2020 had a larger magnitude of load shedding than the largest load shed event in 2019. The operator-initiated shedding of firm load reported through EEA Level 3 alerts is the basis for the metric shown in Figure 1.1. Figure 3.4 shows the percentage of time without operator-initiated firm load shed and duration for each of the past five years. The dashed lines and percentages shown for 2020 illustrate the impact that major operator-initiated load-shed events in 2020 had on this measure of BPS performance.
Figure 3.4: Hours without Operator-Initiated Firm Load Shed (%/year)
26 The EEAs rating assignment has not been made for the EI and WI because established ratings for this metric do not reflect the status for these Interconnections due to changes in EOP-011, BAL-002, and recognition of EEAs related to load shed. The PAS will review the ratings for this metric and propose changes for future reports.

Chapter 3: Reliability Indicators
NERC | State of Reliability | 2021 24
Figure 3.5 shows the year-over-year changes in EEA Level 3 alerts by Interconnection. The 17 EEA Level 3 alerts declared in 2020 resulted in a cumulative total of 54 hours. The largest load loss associated with an EEA Level 3 in 2020 was 1,087 MW for 5 hours and 37 minutes. In 2020, there were no EEA Level 3 alerts in the QI and Texas Interconnection (TI).
Figure 3.5: Number of EEA Level 3 Alerts by Interconnection
The WI and EI experienced the same or fewer EEAs in 2020 than in 2019; however, averages for both exceeded the five-year rolling average. Three of the alerts in the WI resulted in firm load shed. Therefore, the ratings for the Eastern and WIs have not been assigned to allow the ratings to be revised to recognize load shed. Source, Assumptions, and Limitations NERC collects EEA data from Reliability Coordinators (RCs) based on NERC Reliability Standard EOP-011-1.27 Ratings are based on the Metric Worksheet.28
27 https://www.nerc.com/pa/Stand/Reliability%20Standards/EOP-011-1.pdf 28 https://www.nerc.com/comm/PC/Performance%20Analysis%20Subcommittee%20PAS%202013/ALR6-2_clean.pdf

Chapter 3: Reliability Indicators
NERC | State of Reliability | 2021 25
Transmission Performance and Unavailability When evaluating transmission reliability, an important concept is that transmission line outages have different impacts on BPS reliability. Some impacts could be very severe, such as impacting other transmission lines and load loss. Additionally, some outages are longer than others—long duration outages could leave the transmission system at risk for longer periods of time. Reliability indicators for the transmission system include Events Analysis data and outages reported to TADS. The number of qualified events that include transmission outages that resulted in firm load loss not related to weather is provided below.
Transmission-Related Events Resulting in Loss of Load Supported by Event Analysis Data
Transmission-Related Events Resulting in Loss of Load Supported by Event Analysis Data
Transmission greater than 100 kV
This indicator answers the following questions:
How many transmission-related events occur on the BPS that lead to loss of firm load?
How much firm load loss occurred during these events? 2020 Performance and Trends In 2020, 12 distinct non-weather-related transmission events resulted in loss of firm load meeting the EAP reporting threshold (see Figure 3.6). Analysis indicates no discernable trend in the number of annual events. The median firm load loss over the past five years was 183 MW. In 2020, the median was 95 MW. This represents an increase in the number of events in 2020 but a decrease in the median load loss below the five-year median firm demand interrupted.
Figure 3.6: Transmission-Related Events Resulting in Loss of Firm Load and Median Amount of Firm Load Loss

Chapter 3: Reliability Indicators
NERC | State of Reliability | 2021 26
Source, Assumptions, and Limitations NERC collects data on transmission related load loss from the following:
EEA 3 Reporting Form
The Reliability Coordinator Information System
EOP-004-4
NERC EAP
TADS Reliability Indicators A TADS event is an unplanned transmission incident that results in the automatic outage (sustained or momentary) of one or more elements. TADS event information was analyzed for the following indicators in this section:
Transmission Outage Severity
Automatic AC Transmission Outages
Automatic AC Transformer Outages
Transmission Element Unavailability

Chapter 3: Reliability Indicators
NERC | State of Reliability | 2021 27
Transmission Outage Severity
Transmission Outage Severity Sustained Events of 100 kV+ AC Circuits and
Transformers
This indicator answers the following questions:
What is the impact of outages on transmission availability?
How are the frequency and duration of the causes of transmission outages changing? 2020 Performance and Trends The impact of a TADS event to BPS reliability is called the transmission outage severity (TOS) of the event, which is defined by the number of outages in the event and by the type and voltage class of transmission elements involved in the event. TADS events are categorized by initiating cause codes (ICCs). These ICCs facilitate the study of cause-effect relationships between each event’s ICC and event severity. By examining the average TOS, duration, and frequency of occurrence for events with different ICCs (see Figure 3.7) it is possible to determine which ICCs contribute most to reliability performance for the time period considered. The average TOS for an ICC’s events is displayed on the Y-axis. A higher TOS for an ICC indicates more outages or higher voltage elements were involved in an event. The average duration for a given ICC’s events is displayed on the X-axis; events with a longer duration generally pose a greater risk to the BPS. The number of ICC occurrences is represented by the bubble size; larger bubbles indicate an ICC occurs more often. The faded colors correspond to the same groups of events for the 2015–2019 period. Change in size or position of a bubble with the same number (delineating ICC) may indicate improved or declined performance. Lastly, the color represents statistical correlation, or lack thereof, relative to other ICCs. There was a statistically significant reduction in the average event TOS and duration from 2015–2019 to 2016–2020 that indicates an improvement in the TOS and duration submetrics.

Chapter 3: Reliability Indicators
NERC | State of Reliability | 2021 28
Figure 3.7: Transmission Outage Severity vs. Expected TADS Event Duration An analysis of the total TOS by year indicates a statistically significantly improving trend for the last five years (see Figure 3.8); this is a positive indication that transmission outages are leading to less severe reliability impacts.
Figure 3.8: TOS of TADS Sustained Events of 100 kV+ AC Circuits and Transformers by Year

Chapter 3: Reliability Indicators
NERC | State of Reliability | 2021 29
Automatic AC Transmission Outages
Automatic AC Transmission Outages
Protection System
Human Error
AC Substation Equipment
AC Circuit Equipment
This indicator answers the following questions:
What is the impact of these high risk failure modes on transmission availability?
How are active mitigation measures impacting transmission performance? 2020 Performance and Trends The average number of outages per circuit due to Failed Protection System Equipment and Failed AC Substation Equipment has continued to improve consistently over the last four years. The number of outages per circuit due to Human Error saw an increase from 2019 to 2020; however, there was still a statistically significant improvement compared to the average of the prior four years. (See Figure 3.9 and Figure 3.10).
Figure 3.9: Number of Outages per AC Circuit due to Various Initiating Causes

Chapter 3: Reliability Indicators
NERC | State of Reliability | 2021 30
Figure 3.10: Number of Outages per Hundred Miles due to Failed AC Circuit Equipment Source, Assumptions, and Limitations TADS provides the total number and causes of automatic transmission system outages and for all transmission lines 100 kV and above.

Chapter 3: Reliability Indicators
NERC | State of Reliability | 2021 31
Automatic AC Transformer Outages
Automatic AC Transformer Outages
Protection System
Human Error
AC Substation Equipment
This indicator answers the following question:
What is the impact of these high risk failure modes on transformer availability? 2020 Performance and Trends From 2016 through 2020, the trend of automatic ac transformer outages caused by Failed Protection System Equipment, Human Error, and Failed AC Substation Equipment is stable and flat. A slight decrease in the number of overall outages per transformer was observed in 2020 for outages caused by Failed Protection System Equipment and Failed AC Substation Equipment; however, these are within normal performance and not statistically significant. A slight increase in the number of overall outages per transformer was observed in 2020 for outages caused by Human Error; however, this is within normal performance and not statistically significant. See Figure 3.11 for the number of outages per transformer due to various initiating causes.
Figure 3.11: Number of Outages per Transformer Due to Various Initiating Causes Source, Assumptions, and Limitations The NERC TADS provides the total number and causes of automatic transformer outages for transformers 100 kV and above.

Chapter 3: Reliability Indicators
NERC | State of Reliability | 2021 32
Transmission Element Unavailability
Transmission Element Unavailability AC Circuits
Transformers
This indicator answers the following question:
How often are transmission lines and transformers unavailable? 2020 Performance and Trends In 2020, ac circuits over 200 kV across North America had an unavailability rate of 0.30% (meaning there is a 0.30% chance that a transmission circuit is unavailable due to sustained automatic and operational outages at any given time). Transformers had an unavailability rate of 0.18% in 2020. Figure 3.12 shows 2020 was the highest year for ac circuit unavailability of the five-year analysis period. Figure 3.13 shows 2020 was the lowest year for transformer unavailability, at only 67% of the five-year average.
Figure 3.12: AC Circuit Unavailability
Figure 3.13: Transformer Unavailability Source, Assumptions, and Limitations The NERC TADS provides the total number and duration of automatic and non-automatic transmission system outages. Planned outages are not included in the unavailability values.

Chapter 3: Reliability Indicators
NERC | State of Reliability | 2021 33
Generation Performance and Availability GADS contains information that can be used to compute reliability measures, such as megawatt-weighted equivalent forced outage rate (WEFOR). GADS collects and stores unit operating information; by pooling individual unit information, overall generating unit availability performance and metrics are calculated. The information supports equipment reliability, availability analyses, and risk-informed decision making to industry. Reports and information resulting from the data collected through GADS are used by industry for benchmarking and analyzing electric power plants.
Generation Weighted-Equivalent Forced Outage Rate
Generation Weighted-Equivalent Forced Outage Rate Conventional
Generation Greater than 20 MW
This indicator answers the following questions:
On average, what is the availability of generators?
What is the seasonal trend for availability?
How do generator outages differ between different fuel types? 2020 Performance and Trends The horizontal lines in Figure 3.14 show the annual WEFOR compared to the monthly WEFOR columns; the solid horizontal bar shows the mean outage rate over all years in the analysis period, which is 7.18% and only slightly higher than the 2020 annual WEFOR of 7.17%. The WEFOR has been fairly consistent and has a statistical distribution that is nearly an exact standard distribution. The 2020 annual WEFOR is below the five-year average but slightly higher than the 2019 annual WEFOR.
Figure 3.14: Monthly Capacity WEFOR and Five-Year Rolling Average Monthly WEFOR for select fuel types is shown in Figure 3.15. The dashed line shows the monthly WEFOR of all fuel types reported to NERC, and the yellow line shows the mean outage rate of all fuel types reported to NERC over the five years in the analysis period. Coal-fired generation shows a slight increasing trend over the five-year period and

Chapter 3: Reliability Indicators
NERC | State of Reliability | 2021 34
represents the highest forced-outage rate of all conventional fuels except during extreme winter weather when natural-gas-fired generation outages generally spike above coal.
Figure 3.15: Overlaid Monthly Capacity WEFOR by Fuel Type Source, Assumptions, and Limitations NERC GADS provides the event and performance information necessary to calculate the WEFOR.

Chapter 3: Reliability Indicators
NERC | State of Reliability | 2021 35
System Protection and Disturbance Performance Reliability indicators selected to signal system protection and disturbance performance include the following:
Interconnection Frequency Response
Disturbance Control Standard Metric
Protection System Misoperations
Interconnection Reliability Operating Limit Exceedances
Interconnection Frequency Response
Interconnection Frequency Response
Eastern Interconnection
Western Interconnection
Texas Interconnection
Québec Interconnection
This indicator answers the following questions:
What is the performance trend for frequency response?
How close has the system come to activating under-frequency load shedding (UFLS)? 2020 Performance and Trends Frequency response analysis for all of the Interconnections indicates acceptable and improving performance. The EI, TI, QI, and WI showed no statistically significant changes during the arresting period from 2016 through 2020. The WIs exhibited statistically significant improvement during the stabilizing period from 2016 through 2020. In the 2020 operating year, the largest M-4 event occurred in the WI, which was 2,507 MW (compared to a resource loss protection criteria (RLPC)29 of 2,626 MW), and resulted in a Point C of 59.744 Hz and a UFLS margin of 0.244 Hz from a Value A starting frequency of 59.896 Hz; the event occurred in September of 2020 during the hour ending 6:00 p.m. Pacific time. During the arresting period, the goal is to arrest frequency decline for credible contingencies before the activation of UFLS. The calculation for Interconnection frequency response obligation under BAL-003, Frequency Response and Frequency Bias Setting, is based on arresting the Point C Nadir before the first step of UFLS for resource contingencies at or above the RLPC for the Interconnection. Measuring and tracking the margin between the first step UFLS set point and the Point C Nadir is an important indicator of risk for each Interconnection. Figure 3.16 represents an analysis of the arresting period of M-4 events. The Y-axis shows the percent UFLS margin from 100% (60 Hz) to 0% (first step UFLS set point for the Interconnection). The X-axis represents the MW loss for the event, expressed as a percentage of the RLPC for the Interconnection. Analysis for each of the Interconnections indicates an adequate level of reliability. The WI had four events at or greater than 100% of the RLPC and maintained sufficient UFLS margin. The QI had five events greater than 80% of the RLPC and maintained sufficient UFLS margin. The largest events as measured by percentage of RLPC for the EI and TI were 45% and 50%, respectively.
29 The RLPC is the predetermined contingency in each Interconnection used to determine the respective Interconnection frequency response obligation.

Chapter 3: Reliability Indicators
NERC | State of Reliability | 2021 36
Figure 3.16: Operating Year (OY) 2016–2020 Qualified Frequency Disturbances and Remaining UFLS Margin
Frequency response for all of the Interconnections indicates stable and improving performance as shown in Table 3.2.
Table 3.2: 2020 Frequency Response Performance Statistics and Trend Assessment
Interconnection
2020 OY Arresting Period Performance 2020 OY Stabilizing Period Performance
Mean UFLS Margin (Hz)
Lowest UFLS Margin (Hz)
2016–20 OY30 Trend
Mean IFRMA-B
(MW/0.1 Hz)
Lowest IFRMA-B
(MW/0.1 Hz)
2016–20 OY Trend
Eastern 0.452 0.428 Stable 2,583 1,419 Stable
Texas 0.576 0.443 Stable 863 464 Stable
Québec 1.020 0.738 Stable 1095 272 Stable
Western 0.406 0.244 Stable 2,423 1,036 Improving
Source, Assumptions, and Limitations The data supporting these findings can be found on the NERC Resources Subcommittee website.31
30 The operating year for frequency events begins on December 1 and ends on November 30 the following year in accordance with the NERC Reliability Standard BAL-003-1. 31 https://www.nerc.com/comm/OC/Pages/Resources-Subcommittee.aspx

Chapter 3: Reliability Indicators
NERC | State of Reliability | 2021 37
Disturbance Control Standard Metric
Disturbance Control Standard Metric Disturbance Recovery Period
This indicator answers the following question:
How successful are BAs at restoring their system to predisturbance levels following reportable balancing contingency events (RBCE)?
2020 Performance and Trends In 2020, the total number of RBCEs was greater than 2019 but still significantly less than the years 2016 through 2018. Over the last five years, the average percent recovery was 99.7%. In 2020, there were no events where the BA did not restore its system to predisturbance levels within the contingency event recovery period. See Figure 3.17 and Figure 3.18.
Figure 3.17: Number of RBCEs32 Figure 3.18: Percent of RBCEs with 100%
RecoverySource, Assumptions, and Limitations Prior to December 31, 2017, NERC Reliability Standard BAL-002-133 required that a BA or reserve sharing group (RSG) report all disturbance control standard events and nonrecoveries to NERC. On January 1, 2018, NERC Reliability Standard BAL-002-234 became effective, requiring a BA or RSG to document all RBCEs and their recoveries but no longer requiring them to be reported to NERC. The disturbance control standard data used for 2018–2020 is from voluntary submissions from the BAs and RSGs.
32 MSSC: Most Severe Single Contingency 33 https://www.nerc.com/pa/Stand/Reliability%20Standards/BAL-001-1.pdf 34 https://www.nerc.com/pa/Stand/Reliability%20Standards/BAL-002-2(i).pdf

Chapter 3: Reliability Indicators
NERC | State of Reliability | 2021 38
Protection System Misoperations
Protection System Misoperations BES Protection Systems
This indicator answers the following question:
What is driving the change in the misoperations rate; Is it a decline in misoperations or an increase in protection system operations?
2020 Performance and Trends By evaluating the annual misoperations rates across North America and separately for each RE over the last five years and comparing the average of the first four years with the most recent year (see Figure 3.19), a statistically significant decreasing trend can be observed in the misoperations rate for SERC, WECC, and overall MIDAS data reported to NERC. No statistically significant trend is observed for MRO, NPCC, RF, or Texas RE.
Figure 3.19: Changes and Trends in the Annual Misoperations Rate by Regional Entity Table 3.3 shows the reported protection system operations and misoperations by year with details for North America as a whole and for each RE.
Table 3.3: Five-Year Protection System Misoperations Rate 2016 through 2020
Area Protection System Operations Misoperations
2016 2017 2018 2019 2020 2016 2017 2018 2019 2020
North America 19,457 20,978 19,917 19,305 18,295 1,592 1,548 1,545 1,346 1,163
MRO 3,081 3,683 3,740 3,734 3,054 362 322 307 272 254
NPCC 2,305 2,032 2,117 1,661 1,760 190 163 187 131 130
RF 2,442 2,264 2,278 2,148 1,881 277 262 257 246 205
SERC 5,246 5,411 4,873 4,753 5,284 392 351 350 286 258
Texas RE 2,493 2,386 2,281 2,640 1,996 136 154 168 167 116
WECC 3,890 5,202 4,628 4,369 4,320 235 296 276 244 200
Source, Assumptions, and Limitations Protection system operations and misoperations are reported by Transmission Operators, Generator Owners, and Distribution Providers via MIDAS.35
35 https://www.nerc.com/pa/RAPA/Pages/Misoperations.aspx

Chapter 3: Reliability Indicators
NERC | State of Reliability | 2021 39
Interconnection Reliability Operating Limit Exceedances
Interconnection Reliability Operating Limit Exceedances
Eastern–Québec Interconnection
Western Interconnection
Texas Interconnection
This indicator answers the following questions:
How often does the system exceed an established IROL?
How quickly are IROL exceedances mitigated? 2020 Performance and Trends Each RC has a different methodology to determine IROLs based on the make-up of their area and what constitutes an operating condition that is less than desirable. The following discussion of performance on an Interconnection basis is for clarity, not for comparison:
Eastern–Québec Interconnections:36 In 2020, there were exceedances in three of the four ranges of the metric as shown in Figure 3.20. The largest number of exceedances was below 10 minutes (range not shown). The 10-minute to 20-minute range dropped from its all-time peak in 2019, returning to more historical levels with 19 in 2020. There was one exceedance in the 20-minute to 30-minute range, down from 6 in 2019 and no IROL exceedance of more than 30 minutes. The total of 20 exceedances that lasted more than 10 minutes in 2020 places it just below the five-year average. The single entity that was largely responsible for the increase in IROL activity in 2019 has improved its processes and the IROL exceedances have decreased.
Western Interconnection: Prior to 2014, only system operating limits were reported. Since 2014, the trend has been stable with no IROL exceedances reported.
Texas Interconnection: ERCOT had zero IROL exceedances from 2016 Q1 through 2020 Q3. In October 2020, ERCOT made a change to its system operating limit methodology that increased the number of IROLs for the Interconnection from one to five. In 2020 Q4, there were six exceedances; all were less than 10 minutes.
Source, Assumptions, and Limitations RCs provide this data to NERC. Each RC currently collects and records IROL data as required by IRO-009-2.37
36 Eastern and Quebec Interconnections combines the Eastern Interconnection and Québec Interconnection for confidentiality. 37 https://www.nerc.com/pa/Stand/Reliability%20Standards/IRO-009-2.pdf
Figure 3.20: Eastern–Québec Interconnections IROL Exceedances

NERC | State of Reliability | 2021 40
Chapter 4: Severity Risk Index
The severity risk index (SRI) measures the severity of daily conditions based on the combined impact of load loss, loss of generation, and loss of transmission on the BPS (see the following text box). The SRI provides a quantitative measure that assesses the relative severity of these events on a daily basis (see Severity Risk Index and Trends), and it provides a comprehensive picture of the performance of the BPS and allows NERC to assess year-on-year trends of its reliability (see Figure 4.1).
Figure 4.1: Severity Risk Index Concept
How the SRI Is Calculated The SRI provides a daily measure of BPS performance that is the sum of the following components (Figure 4.2):
Weighted Transmission System Sustained Unplanned or Operational Outages for AC Circuits, DC Circuits, and Transformers with Voltages Greater than 100 kV: The weighted capacity of daily sustained unplanned transmission and operational elements’ outages is divided by the total capacity of the elements. The weighting is based on an assumed average capacity for each outaged element and varies by voltage level. This component represents 30% of the SRI score.
Weighted Generation System Unplanned Outages: Total daily unplanned generation capacity lost is divided by the monthly capacity of the generation fleet. This component represents 10% of the SRI score.
Weighted Distribution Load Lost due to Loss of Supply to the Distribution System: Weighted distribution load lost due to loss of supply to the distribution system is divided by daily system peak loading. The weighting reflects the promptness with which load has been restored and is based on CAIDI. This component represents 60% of the SRI score.
Figure 4.2: SRI Loss Components

Chapter 4: Severity Risk Index
NERC | State of Reliability | 2021 41
Severity Risk Index and Trends The cumulative performance of the BPS is calculated by summing each day’s SRI for the year. Table 4.1 shows the annual cumulative SRI for the five-year period of 2016–2020. For this period, 2020 had the best (lowest) annual cumulative SRI with a 10% reduction over the five-year period. 2020 is statistically significantly lower than 2016, 2017, and 2018. This improvement is due to substantive improvements in the generation and transmission components, despite a corresponding deterioration in the load loss component.
Table 4.1: Annual Cumulative SRI
Year Cumulative Weighted
Generation
Cumulative Weighted
Transmission
Cumulative Weighted Load Loss
Annual Cumulative
SRI
Average Daily SRI
2016 388.0 81.7 57.4 527.1 1.44
2017 370.7 79.5 66.7 517.0 1.42
2018 389.9 73.5 68.4 531.7 1.46
2019 368.7 69.9 57.0 495.6 1.36
2020 337.2 65.4 72.5 475.1 1.30
Figure 4.3 plots the daily SRI scores for 2020 against control limits that were calculated using 2016–2019 seasonal daily performance. On a daily basis, a general normal range of performance exists, which is visible by the gray-colored band or within the daily seasonal 90% control limits.38 Days of stress to the system are identified by those that extend above the seasonal daily control limits. The top 10 days of 2020 are labeled with the rank of severity.
Figure 4.3: 2020 Daily SRI with Top 10 Days Labeled, 90% Confidence Interval Table 4.2 provides details of the scores for the top 10 SRI days during 2020. For each top SRI days, the table includes whether a specific event was a contributing factor, the type of event that occurred, and its general location by RE. All
38 The 90% confidence interval (CI) of the historic values is between 5th percentile and 95th percentile.

Chapter 4: Severity Risk Index
NERC | State of Reliability | 2021 42
but one of the top 10 SRI days in 2020 was attributed to some type of weather occurrence: 5 occurred as result of hurricanes or tropical storm(s), 2 were related to wild fires, and 3 days were indicated by extreme cold. July 1, 2020, had the highest amount of generator outages in 2020, and there was no single identifiable weather or other extreme event. 2020 was unique in that two major events occurred on the same day due to two different weather incidents (ice storm and hurricane), making October 28, 2020, the day with the highest SRI score for the year.
Table 4.2: 2020 Top 10 SRI Days
Rank Date
SRI and Weighted Components 2020 Event Type (*Weather Influenced)
Regional Entities SRI
Weighted Generation
Weighted Transmission
Weighted Load Loss
1 October 28 3.98 1.22 2.06 0.71 Ice Storm* and Hurricane Zeta*
Texas RE, MRO, SERC
2 August 4 3.72 1.22 0.77 1.73 Hurricane Isaias* SERC, RF, NPCC
3 August 27 3.63 1.52 0.51 1.60 Hurricane Laura* MRO, SERC, Texas RE
4 January 12 3.59 0.63 0.92 2.04 Arctic outbreak and extreme cold,* Nor'easter*
WECC NPCC, RF, SERC
5 October 29 3.44 0.92 1.07 1.45 Hurricane Zeta* MRO, RF, SERC
6 September 8 3.29 1.47 0.71 1.12 Wild fires* WECC
7 September 7 3.29 0.95 0.57 1.77 Wild fires* WECC
8 July 1 3.22 2.77 0.26 0.19 Unrelated coincidental generator outages
WECC, MRO, RF, SERC, NPCC
9 January 11 2.90 1.38 0.58 0.94 Arctic outbreak and extreme cold,* thunderstorms*
WECC MRO
10 June 9 2.73 2.11 0.43 0.18 Tropical Storm Amanda: Cristobal*
WECC, RF, SERC
SRI Performance Trends Performance trends can be recognized by comparing the top 2020 SRI days to those of prior years. Figure 4.4 shows the top 10 SRI days for each of the past five years in descending rank order. Although the top days in 2020 exceeded the top 10 days in three of the prior years, the scores of half the top 10 days in 2020 were markedly below the top days of 2018, with the remainder at or just below the similarly-ranked days of 2018.

Chapter 4: Severity Risk Index
NERC | State of Reliability | 2021 43
Figure 4.4: Top Annual Daily Severity Risk Index Days Sorted Descending To put the severity of days in 2020 into context with historic BPS performance, the top 10 days over the five-year period are updated annually. Table 4.3 identifies the top 10 SRI days occurring between 2016–2020 with the contribution of the generation, transmission, and load loss components to the SRI for each day as well as contributing event information and the REs impacted by the event. Four of the top days for 2020, shown in bold below, have replaced earlier top SRI days, indicating the severity of these days not just for 2020, but also over the past five years.
Table 4.3: 2016-2020 Top 10 SRI Days
Rank Date
SRI and Weighted Components Event Type
(*Weather Influenced) Regional
Entity SRI Weighted
Generation Weighted
Transmission Weighted Load Loss
1 September 14, 2018
4.33 1.34 0.46 2.53 Hurricane Florence* SERC
2 March 2, 2018 4.22 0.90 0.41 2.90 Winter Storm Riley* NPCC
3 January 2, 2018
4.06 3.81 0.15 0.10 Winter Storm Grayson* SERC, RF, MRO, NPCC, Texas RE
4 November 15, 2018
4.05 1.85 0.25 1.95 Winter Storm Avery* RF, NPCC
5 October 28, 2020
3.98 1.22 2.06 0.71 Ice Storm* and Hurricane Zeta*
Texas RE, MRO, SERC
6 August 4, 2020 3.72 1.22 0.77 1.73 Hurricane Isaias* SERC, RF, NPCC
7 October 11, 2018
3.70 0.98 0.53 2.19 Hurricane Michael* SERC
8 August 27, 2020
3.63 1.52 0.51 1.60 Hurricane Laura* MRO, SERC, Texas RE
9 May 1, 2017 3.59 1.76 0.31 1.53 Unrelated coincidental generator outages
SERC, RF
10 January 12, 2020
3.59 0.63 0.92 2.04 Arctic outbreak and extreme cold* Nor'easter*
WECC NPCC, RF, SERC

Chapter 4: Severity Risk Index
NERC | State of Reliability | 2021 44
Severity Risk Index by Interconnection This year, the SOR report introduces SRI analysis at the Interconnection level for the combined Eastern Interconnection and Québec Interconnection (EI–QI)39 and WI. Sufficient representative load loss data were unavailable for the TI at the time this year’s report was prepared. While the averages of daily SRIs for the entirety of North America, EI–QI, and the WI are similar (with the average 2016–2020 daily SRI of 1.39, 1.33, and 1.61, respectively), the variability of daily SRI differs considerably between North America and each of the two Interconnections. The standard deviation of the North America SRI is statistically significantly lower than for the EI–QI and the WI. A larger variability and a wider range of values for the Interconnections mean that there is a greater rate of high (especially) and also low SRI values in each of these two Interconnections compared to that of the entire North America; this result is to be expected. During extreme weather events, for example, the same transmission MVA loss, generation loss, and the number of customers interrupted will result in a greater daily SRI value when calculated for a single Interconnection than the same value when calculated on a North America-wide basis. While the SOR analysis primarily focuses on the large SRI values that determine the extreme days for the BPS, a smaller base also means more days with very low SRI. For example, in 2016–2020 there were no days without a transmission loss in North America, but there were six such days in the EI–QI and 72 in the WI with much smaller transmission inventory (and 713 zero-automatic outage days in the TI that are not included in the analysis). The following section present a review of trends over the past five years, the top 10 days for the current year, and the top 10 days for the prior five years for the EI–QI and WI.
Eastern–Québec Interconnection The cumulative SRI for the EI–QI in Table 4.4 shows a 14% decrease over the five-year period of 2016–2020 as well as a slightly higher rate of improvement over the North America annual cumulative SRI, annually averaging 5% less than the overall cumulative SRI. In the EI–QI, the 2020 cumulative SRI is not only the best (lowest) among the five years, it is statistically significantly lower than 2018, 2016, and 2017. This improvement was due to decreases in transmission and generation component, which were the lowest over the five years that offset the load loss increase from 2019.
Table 4.4: Annual Cumulative SRI—EI–QI
Year Cumulative Weighted
Generation
Cumulative Weighted
Transmission
Cumulative Weighted Load Loss
Annual Cumulative
SRI
Average Daily SRI
2016 374.9 69.8 62.1 506.8 1.38
2017 350.7 68.3 68.8 487.8 1.34
2018 383.4 65.7 96.4 545.5 1.49
2019 345.8 62.4 51.3 459.5 1.26
2020 314.2 53.8 67.4 435.4 1.19
The top SRI days of the EI–QI were distributed throughout the year as shown in Figure 4.5. Six of the top days that occurred in the EI–QI contributed to the top SRI days reported for North America. Crossover tropical storms Amanda and Cristobal40 impacted the EI–QI in early June with a tornado, other high wind events, and extreme temperatures reported as causes for the remaining high SRI days.
39 The EI–QI combines the Quebec and Eastern Interconnections for confidentiality. 40 Amanda and Cristobal were two consecutive tropical storms that affected Central America, the central United States, and Canada in late May and early June 2020. The first tropical cyclone formed in the East Pacific as Amanda and regenerated into a second one in the North Atlantic as Cristobal: https://weather.com/storms/hurricane/news/2020-06-08-tropical-depression-cristobal-forecast-flooding-rain-gusty-winds

Chapter 4: Severity Risk Index
NERC | State of Reliability | 2021 45
Figure 4.5: 2020 EI–QI Daily SRI with Top 10 Days Labeled, 90% Confidence Interval When comparing the top days in 2020 to of each of the previous four years as shown in Figure 4.6, 2020 had the second-highest daily SRI values for the majority of the top 10 days. Half of the top 10 days in 2020 for the EI–QI were associated with hurricanes or tropical storms with the remaining days attributed to high winds or extreme temperatures.
Figure 4.6: EI–QI Top Annual Daily Severity Risk Index Days Sorted Descending Table 4.5 provides details on each component’s contribution to the top 10 SRI days for the EI–QI. Transmission system load loss was a major contributor to seven of the top days. In 2020, generation outages contributed almost twice as much to the daily SRI as transmission outages in the EI–QI.
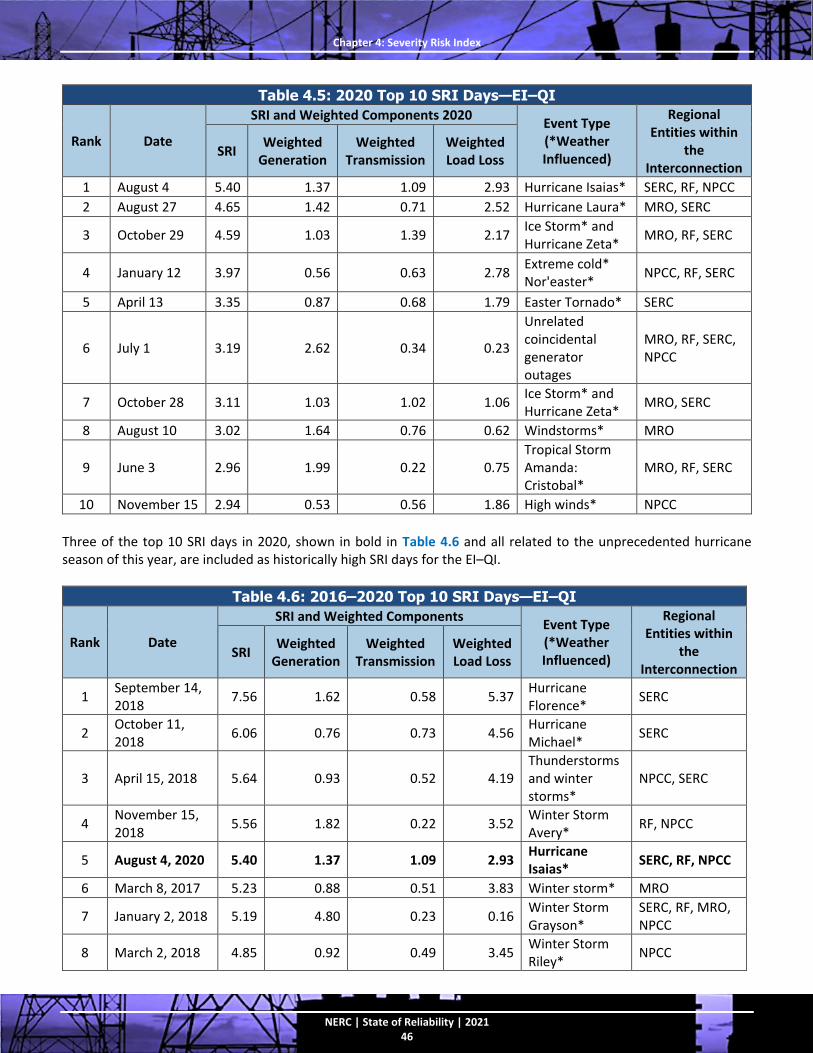
Chapter 4: Severity Risk Index
NERC | State of Reliability | 2021 46
Table 4.5: 2020 Top 10 SRI Days—EI–QI
Rank Date
SRI and Weighted Components 2020 Event Type (*Weather Influenced)
Regional Entities within
the Interconnection
SRI Weighted
Generation Weighted
Transmission Weighted Load Loss
1 August 4 5.40 1.37 1.09 2.93 Hurricane Isaias* SERC, RF, NPCC
2 August 27 4.65 1.42 0.71 2.52 Hurricane Laura* MRO, SERC
3 October 29 4.59 1.03 1.39 2.17 Ice Storm* and Hurricane Zeta*
MRO, RF, SERC
4 January 12 3.97 0.56 0.63 2.78 Extreme cold* Nor'easter*
NPCC, RF, SERC
5 April 13 3.35 0.87 0.68 1.79 Easter Tornado* SERC
6 July 1 3.19 2.62 0.34 0.23
Unrelated coincidental generator outages
MRO, RF, SERC, NPCC
7 October 28 3.11 1.03 1.02 1.06 Ice Storm* and Hurricane Zeta*
MRO, SERC
8 August 10 3.02 1.64 0.76 0.62 Windstorms* MRO
9 June 3 2.96 1.99 0.22 0.75 Tropical Storm Amanda: Cristobal*
MRO, RF, SERC
10 November 15 2.94 0.53 0.56 1.86 High winds* NPCC
Three of the top 10 SRI days in 2020, shown in bold in Table 4.6 and all related to the unprecedented hurricane season of this year, are included as historically high SRI days for the EI–QI.
Table 4.6: 2016–2020 Top 10 SRI Days—EI–QI
Rank Date
SRI and Weighted Components Event Type (*Weather Influenced)
Regional Entities within
the Interconnection
SRI Weighted
Generation Weighted
Transmission Weighted Load Loss
1 September 14, 2018
7.56 1.62 0.58 5.37 Hurricane Florence*
SERC
2 October 11, 2018
6.06 0.76 0.73 4.56 Hurricane Michael*
SERC
3 April 15, 2018 5.64 0.93 0.52 4.19 Thunderstorms and winter storms*
NPCC, SERC
4 November 15, 2018
5.56 1.82 0.22 3.52 Winter Storm Avery*
RF, NPCC
5 August 4, 2020 5.40 1.37 1.09 2.93 Hurricane Isaias*
SERC, RF, NPCC
6 March 8, 2017 5.23 0.88 0.51 3.83 Winter storm* MRO
7 January 2, 2018 5.19 4.80 0.23 0.16 Winter Storm Grayson*
SERC, RF, MRO, NPCC
8 March 2, 2018 4.85 0.92 0.49 3.45 Winter Storm Riley*
NPCC

Chapter 4: Severity Risk Index
NERC | State of Reliability | 2021 47
Table 4.6: 2016–2020 Top 10 SRI Days—EI–QI
Rank Date
SRI and Weighted Components Event Type (*Weather Influenced)
Regional Entities within
the Interconnection
SRI Weighted
Generation Weighted
Transmission Weighted Load Loss
9 August 27, 2020
4.65 1.42 0.71 2.52 Hurricane Laura*
MRO, SERC
10 October 29, 2020
4.59 1.03 1.39 2.17 Ice Storm* and Hurricane Zeta*
MRO, RF, SERC
Western Interconnection The cumulative SRI for the WI (see Table 4.7) shows a 7% decrease over the five-year period of 2016–2020 that is a slightly lower rate of improvement over the North America annual cumulative SRI. The annual cumulative SRI for the WI is on average 16% higher than the overall cumulative SRI. The 2020 cumulative SRI was the second best (lowest) among the five years after 2018 and was statistically significantly lower than 2017 and similar to others. The transmission and generation components were the lowest among the five years while the cumulative load loss in 2020 decreased from 2019 but was still higher than the average over the five-year period.
Table 4.7: Annual Cumulative SRI—WI
Year Cumulative Weighted
Generation
Cumulative Weighted
Transmission
Cumulative Weighted Load Loss
Annual Cumulative
SRI
Average Daily SRI
2016 417.8 129.7 54.7 602.2 1.65
2017 433.8 123.1 75.2 632.2 1.73
2018 395.9 105.7 41.0 542.5 1.49
2019 421.0 105.4 74.9 601.3 1.65
2020 385.2 103.3 72.1 560.6 1.53
Unlike the EI–QI, the top SRI days of the WI are primarily clustered in the months of August and September with one high SRI day in June as shown in Figure 4.7. Three top SRI days are related to wild fires throughout California and the Pacific Northwest. Six of the top 10 SRI days were related to the extreme heat, high demand, and load shed that occurred in California from August 14–19, 2020. Although the load shed days dominate the top SRI days for the WI, none of the load shed days were identified as overall top SRI days for North America. When resources across are evaluated in aggregate, outages with the greatest overall impact may not reflect the locational nature of some events. Three of the top days that occurred in the WI contributed to top SRI days reported: two of the three wild fire days and the June day.

Chapter 4: Severity Risk Index
NERC | State of Reliability | 2021 48
Figure 4.7: 2020 WI Daily SRI with Top 10 Days Labeled, 90% Confidence Interval When comparing the top days in 2020 to each of the previous four years as shown in Figure 4.8, 2020 had the highest daily SRI values for all but one of the top 10 days.
Figure 4.8: WI Top Annual Daily Severity Risk Index Days Sorted Descending Table 4.8 provides details on each component’s contribution to the top 10 SRI days for the WI; WECC is the only RE in the WI. Transmission system load loss was a major contributor to seven of the top days. In 2020, generation outages contributed almost twice as much to the daily SRI as transmission outages in the WI.

Chapter 4: Severity Risk Index
NERC | State of Reliability | 2021 49
Table 4.8: 2020 Top 10 SRI Days—WI
Rank Date
SRI and Weighted Components 2020 Event Type
(*Weather Influenced) SRI Weighted
Generation Weighted
Transmission Weighted Load Loss
1 September 8 9.31 3.38 3.21 2.73 Wild Fires*
2 September 7 8.69 2.51 2.41 3.78 Wild Fires*
3 August 14 7.71 1.29 0.00 6.43 Extreme heat and demand with load shed-California*
4 August 15 5.79 0.99 0.25 4.55 Extreme heat and demand with load shed-California*
5 August 17 5.60 2.13 0.89 2.58 Extreme heat and demand with load shed-California*
6 August 16 5.03 2.05 0.95 2.04 Extreme heat and demand with load shed-California*
7 August 19 4.29 1.63 2.15 0.51 Extreme heat and demand with load shed-California*
8 August 18 4.07 2.61 0.84 0.62 Extreme heat and demand with load shed-California*
9 June 9 3.71 2.73 0.79 0.19 Tropical Storm Amanda: Cristobal*
10 August 28 3.62 2.53 1.09 0.01 Johnson Fire*
Half of the top 10 SRI days in 2020, shown in bold in Table 4.9, are included as historically high SRI days for the WI. A total of 3 days from 2020 are associated with the load shed in August and 2 with wild fires in September.
Table 4.9: 2016–2020 Top 10 SRI Days—WI
Rank Date
SRI and Weighted Components Event Type
(*Weather Influenced) SRI Weighted
Generation Weighted
Transmission Weighted Load Loss
1 April 7, 2017 9.32 3.16 1.86 4.29 Wind storm*
2 September 8, 2020 9.31 3.38 3.21 2.73 Wild Fires*
3 December 4, 2017 9.24 1.05 0.07 8.12 Thomas Fire*
4 September 7, 2020 8.69 2.51 2.41 3.78 Wild Fires*
5 August 14, 2020 7.71 1.29 0.00 6.43 Extreme heat and demand with load shed-California*
6 December 10, 2017 7.32 0.99 2.16 4.16 Thomas Fire*
7 October 11, 2019 6.29 0.75 5.51 0.02 Saddle Ridge Fire*
8 August 11, 2018 5.99 1.63 2.42 1.93 Natchez Fire *
9 August 15, 2020 5.79 0.99 0.25 4.55 Extreme heat and demand with load shed-California*
10 August 17, 2020 5.60 2.13 0.89 2.58 Extreme heat and demand with load shed-California*

NERC | State of Reliability | 2021 50
Chapter 5: Trends in Priority Reliability Issues
NERC routinely prioritizes emerging and known reliability issues. The Reliability Issues Steering Committee (RISC) is an advisory committee to the NERC Board that provides front-end, high-level leadership and accountability for the emerging and known issues of strategic importance to BPS reliability. The RISC provides a framework for prioritizing reliability issues and offers recommendations to help NERC and industry effectively focus their resources on the critical issues needed for improving the reliability of the BPS. This section integrates data, information, and insights from across prior sections of this report and other NERC sources to shed light on the key reliability issues that the RISC identified. Following the discussion of each issue is a summary of actions under way to address the topic.
Emerging Risk Areas In 2019, the RISC identified four high level risks: grid transformation, extreme natural events, security risks, and critical infrastructure interdependencies. This year’s SOR report focuses on these aspects of the high-level risk areas:
BPS Planning and Adapting to the Changing Resource Mix
Protection and Control Systems
Transmission Outages Related to Human Performance
Loss of Situation Awareness
Bulk Electric System Impact of Extreme Event Days
Cyber and Physical Security
BPS Planning and Adapting to the Changing Resource Mix
Changes in the Peak Resource Mix over the Past 10 Years Over the past 10 years, the BPS has reduced its on-peak capacity of coal by 56 GW. During this time, the BPS added 29.5 GW of natural gas, 7.7 GW of wind, and 21.4 GW of solar generation on-peak capacity.41 Variable generation from renewable wind and solar resources contribute to resource adequacy, but because their output depends on the environment and local weather conditions, they often do not provide the same contribution to capacity at the peak demand hour (i.e., on-peak) as conventional generation resources. Figure 5.1 and Table 5.1 show the changing on-peak capacity composition of generating resources in North America over the past 10 years. Although wind and solar resources have grown considerably over the past decade, their contribution to on-peak electricity capacity has been less substantial.
41 Data obtained from Energy Information Administration (EIA) and NERC Long-Term Reliability Assessments.

Chapter 5: Trends in Priority Reliability Issues
NERC | State of Reliability | 2021 51
Figure 5.1: 2010 and 2020 North America-Wide Capacity Resource Mix
Table 5.1: Generation Resource Capacity by Fuel Type
Generation Fuel Type
2010 On-Peak 2020 On-Peak
GW Percent GW Percent
Coal 294.9 27.7% 235.9 22.6%
Natural Gas 417.7 39.2% 447.2 42.9%
Hydro 165.6 15.5% 140.7 13.5%
Nuclear 114.0 10.7% 110.1 10.6%
Oil 27.8 2.6% 40.2 3.9%
Wind 17.0 1.6% 24.7 2.4%
Solar 0.0 0.0% 21.4 2.1%
Other 28.9 2.7% 22.2 2.1%
Total: 1,065.8 100.0% 1,042.5 100.0%
The resource mix and speed at which it is changing varies considerably across different parts of the North American power system. Figure 5.2 provides an Interconnection-level view of the generation resource mix since 2010. NERC’s Long-Term Reliability Assessment reports on both the current generation resource mix and projections for the next 10 years for each of the 20 assessment areas within the 4 Interconnections that encompass the North American BPS.

Chapter 5: Trends in Priority Reliability Issues
NERC | State of Reliability | 2021 52
Figure 5.2: 2010 and 2020 Capacity Resource Mix By Interconnection
Managing Risks as the Resource Mix Evolves The addition of variable resources, primarily wind and solar, and the retirement of conventional generation are fundamentally changing how the BPS is planned and operated. Planning and operating the grid must increasingly account for greater uncertainty across the resource fleet as well as uncertainty in electricity demand that is being affected by increasing amounts of demand-side resources. Energy assessments that consider variability in resources and demand across all hours of the assessment period are increasingly important to maintaining resource adequacy of the BPS.42 Important reliability implications include ensuring sufficient flexible resources, maintaining fuel assurance, and planning and operating the BPS with inverter-based resources.
Ensuring Sufficient Flexible Resources With increasing levels of variable renewable generation in the resource mix, there is a growing need to have resources available that can be reliably called upon on short notice to balance electricity supply and demand if shortfall conditions occur. Flexible resources that can include responsive generators with assured fuel or energy and demand response are necessary in some areas today to ensure resource adequacy and meet ramping needs. ERCOT and California rely on the output from wind and solar generation to meet projected peak demand as shown in Figure 5.3. Should solar and wind output fall below expectations during peak conditions, these areas may need to draw on unanticipated resources or additional imports from outside of the area to maintain balance between load and generation. Additionally, the high levels of solar resources in these areas cause the daily load shape to change such that greater amounts of flexible resources are needed to match steep ramping conditions during times when the change in wind or solar output changes rapidly.
42 For more information on energy assessments, see the 2020 LTRA and the included 2020 ERO probabilistic assessment, which accounts for all hours in selected study years of 2022 and 2024.

Chapter 5: Trends in Priority Reliability Issues
NERC | State of Reliability | 2021 53
Figure 5.3: Wind and Solar Contribution to Resource Mix and Meeting Net Internal Demand in
Texas RE-ERCOT and WECC CA/MX Assessment Areas Actions in Progress
Assess resource adequacy, operating reliability, and emerging reliability issues through NERC’s long-term, seasonal, and probabilistic reliability assessments
Perform seasonal risk scenarios in seasonal assessments to assess low-likelihood extreme scenarios
Conduct technical analysis and develop guidelines and recommendations as specified in the work plans for the IRPWG, SPIDERWG, and the Resources Subcommittee
Develop requirements to collect GADS data for solar, wind, and energy storage installations
Adopt and implement guidelines for assessing fuel assurance and fuel-related reliability risk by registered entities
Protection and Control Systems Failure to properly design, coordinate, commission, operate, maintain, and prudently replace and upgrade BPS control system assets causes misoperation of protection and control systems. Misoperations can initiate more frequent and/or more wide-spread outages. Resource mix changes involving growth in inverter-based generation sources can also impact wide-area protection and increase the need to coordinate protection with the distribution system.
Leading Causes of Misoperations The top causes of misoperations over the past five years have consistently been Incorrect Settings/Logic/Design Errors and Relay Failures/Malfunctions (See Figure 5.4). For each five-year period analyzed since data collection started, these two causes account for around 50% of all misoperations.

Chapter 5: Trends in Priority Reliability Issues
NERC | State of Reliability | 2021 54
Figure 5.4: Misoperations by Cause Code (2016–2020)
Protection System Failures Leading to Transmission Outages AC circuits saw a statistically significant decrease in the number of outages per circuit. While there was a slight decrease in the number of outages per transformer, it was not statistically significant (see Chapter 3, Figure 3.9, and Figure 3.11).
Event-Related Misoperations An analysis of misoperations data and events reported through the ERO EAP found that there were 86 transmission-related system disturbances that resulted in a qualified event in 2016.43 Of those 86 events, a total of 54 events (63%) had associated misoperations. Since 2016, the ERO and industry stakeholders have continued efforts to reduce protection system misoperations through initiatives that included formation and participation in various task forces, workshops, and conducting more granular root cause analysis. In 2020, there were 60 transmission-related qualified events. Of those 60 events, 29 events (or 48% of them) involved misoperations (see Figure 5.5). The efforts taken by the ERO and implemented by industry have resulted in a declining trend in the number of events with misoperations over the last five years.
43 For a list of definitions of qualified events, see the Categories and Subcategories for EAP Qualifying Events text box.
Year 2016 2017 2018 2019 2020
Misoperation Count 1,592 1,548 1,545 1,346 1,163

Chapter 5: Trends in Priority Reliability Issues
NERC | State of Reliability | 2021 55
Figure 5.5: Events with Misoperations
Actions in Progress
NERC, REs, and stakeholders continue to conduct industry webinars on protection systems and document success stories on how Generator Owners and Transmission Owners are achieving high levels of protection system performance.
The MIDAS User Group (MIDASUG) continues to collect and analyze protection system misoperations data and information through MIDAS and provide training to ensure consistency of operations and misoperations reporting.
NERC continues to report the quarterly protection system misoperations data on NERC’s website.
Transmission Outages Related to Human Performance NERC TADS collects transmission outage data with a variety of causes that include human error. The definition of human error as a cause of transmission outage is defined in the TADS Data Reporting Instructions.44 The effective use of human performance (HP) will help mitigate the active and latent errors that negatively affect reliability. Weaknesses in HP hampers an organization’s ability to identify and address precursor conditions that degrade effective mitigation and behavior management. Statistical significance testing was done that compared 2020 to the average outage rate of the prior four years. For ac circuits, all forced outages caused by human error have seen a statistically significant decrease in frequency (see Figure 5.6). For transformers, all forced outages caused by human error have seen no statistically significant change in frequency (see Figure 5.7).
44 Human Error: Relative human factor performance that include any incorrect action traceable to employees and/or contractors to companies operating, maintaining, and/or assisting the TO.

Chapter 5: Trends in Priority Reliability Issues
NERC | State of Reliability | 2021 56
Figure 5.6: AC Circuit Outages Initiated by Human Error
Figure 5.7: Transformer Outages Initiated by Human Error
Human Performance and Generation Outages NERC GADS collects generation outage data associated with a variety of causes that include human error. Over the past five years, forced outages attributed to human error have averaged around 1% of all forced generator outage events and no fuel type showed a notable increase in 2020.

Chapter 5: Trends in Priority Reliability Issues
NERC | State of Reliability | 2021 57
Trends of Events Involving Human/Organization Performance as a Root Cause In the ERO EAP, the individual human performance and management/organization cause sets identify events or conditions that are directly traceable to individual or management actions or organization methods (or lack thereof) that caused or contributed to the reported event. In 2020, human/organization performance was identified as the root cause for 38% of processed events (see Figure 5.8). While this is higher than the four previous years, analysis found no increasing or decreasing trend from 2016 to 2020. For the same period, the top five detailed root causes listed, in priority order, below are members of the management or organization performance categories:
1. Job scoping did not identify special circumstances and/or conditions
2. System interactions not considered or identified
3. Management policy guidance or expectations are not well-defined, understood, or enforced
4. Inadequate work package preparation
5. Risks/consequences associated with change not adequately reviewed/assessed Events processed during 2020 saw the same top five root causes as 2019 (listed above) although the order of occurrence changed. The top five detailed root causes coupled with the apparent underlying increase shown in Figure 5.8 suggests that an opportunity exists for industry to improve BPS reliability through increased focus in the area of management and organization performance. Possible contributing and root causes in the area of management and organization performance include subcategories where methods, actions, and/or practices are less than adequate such as: management methods, resource management, work organization and planning, supervisory methods, and change management.
Figure 5.8: Human/Organization Performance Root Cause by Year

Chapter 5: Trends in Priority Reliability Issues
NERC | State of Reliability | 2021 58
Human Error and Protection System Misoperations Protection system misoperations remain an important indicator of the reliability of the BPS. Human error is one of the potential causes for misoperations to occur. Figure 5.9 shows the number of misoperations due to human error by RE for the past five years. There are two different causes of human error misoperations reported in MIDAS: As-left Personnel Errors and Incorrect Settings/Logic/Design Errors. Together, these account for roughly 40% of misoperations over the last five years, described in more detail as follows:
As-left Personnel Errors: These misoperations are due to the as-left condition of the composite protection system following maintenance or construction procedures. These include test switches left open, wiring errors not associated with incorrect drawings, carrier grounds left in place, settings placed in the wrong relay, or settings left in the relay that do not match engineering intended and approved settings. This includes personnel activation of an incorrect settings group.
Incorrect Settings/Logic/Design Errors: These are misoperations due to errors in the following:
Incorrect Settings: These are errors in issued settings associated with electromechanical or solid-state relays, the protection element settings in microprocessor-based relays, and setting errors caused by inaccurate modeling; it excludes logic errors discussed in the Logic Error cause code.
Logic: This includes errors in issued logic settings and errors associated with programming microprocessor relay inputs, outputs, custom user logic, or protection function mapping to communication or physical output points.
Design: This involves incorrect physical design. Examples include incorrect configuration on ac or dc schematic or wiring drawings or incorrectly applied protective equipment.
Figure 5.9 indicates the number of misoperations varying among REs; however, the five-year trends generally show a stable or downward trend in misoperations with causes attributed to human error.
Figure 5.9: Protection System Misoperations Due to Human Error by Regional Entity45
45 Protection System Operation data collection for WECC began in Q2 2016.

Chapter 5: Trends in Priority Reliability Issues
NERC | State of Reliability | 2021 59
Actions and Mitigations in Progress
The ERO has identified work force capability and human error as possible threats to the reliability of the BPS. These broad topics are categorized for analysis by the ERO under management, organization, and individual contributions. The reported occurrences in Figure 5.9 illustrate two areas of focus that will help improve the misoperations rate on the BPS. The data suggests a need for focus on both individual actions and organizational processes/procedures pertaining to protective systems.
The ERO Enterprise provides educational opportunities annually to help industry understand and focus on reducing human error through human performance concepts, methods, techniques, and procedures. The ERO/NATF-led HP awareness and education event is scheduled annually.
The REs have been working with local industry working groups to review and aid in addressing reported misoperations and other human performance issues.
The ERO Event Analysis Program continues.
The NERC cause analysis course is offered periodically.
RE-specific HP-related activities continue to occur.
Loss of Situation Awareness The BES operates in a dynamic environment, and its physical properties are constantly changing. Situational awareness is necessary to maintain reliability, anticipate events, and respond appropriately when or before events occur. In order to maintain the reliability of the BES, entities use various situational awareness tools that include, but are not limited to, six main areas: EMSs, transmission outage planning, load forecasting, geomagnetic disturbance/weather forecasting, data from neighboring entities’ operations, and interpersonal communication within their own company and with neighboring systems. Without the appropriate tools and up-to-date data, system operators may have degraded situational awareness that impacts their ability to make informed decisions to ensure reliability for the given state of the BES. Unexpected outages of systems needed for communications, monitoring and control of equipment, or planned outages without appropriate coordination or oversight, can leave system operators with impaired visibility. For system operators, the EMS is a critical component of situational awareness.
Impacts from the Loss of EMS An EMS is a computer-aided environment used by system operators as a primary means to monitor, control, and optimize the performance of the generation and/or transmission system. The EMS allows system operators to monitor and control the frequency; the status (open or closed) of switching devices and real and reactive power flows on the BES tie-lines and transmission facilities within the control area; and the status of applicable EMS applications like SE, real-time contingency analysis, automatic generator control (AGC), and/or alarm management. There were 58 EMS related events reported in 2020. In total, 411 EMS related event reports were submitted between 2016 and 2020. There were no reported EMS-related events that caused loss of generation, transmission lines, or customer load. Figure 5.10 shows a trend of the reported EMS events by loss of EMS functions over the 2016–2020 period. Both loss of SE/RTCA and ICCP events have been declining since 2018. The complete loss of monitoring or control capability events was stable from 2017 to 2019 but increased in 2020. There are two reasons for the declining trend of loss of SE/RTCA and ICCP:
Partial loss events (e.g. loss of SE/RTCA, loss of ICCP, loss of RTU, or loss of AGC) are no longer captured as part of EOP-004-4 reporting. NERC standard EOP-004-4 was modified to require the complete loss of monitoring or control capability at a BES control center for 30 continuous minutes or more. The modified NERC Reliability Standard went into effect on April 1, 2019, in the United States and some Canadian provinces. However, some entities still report partial EMS loss.

Chapter 5: Trends in Priority Reliability Issues
NERC | State of Reliability | 2021 60
The industry has made significant effort to enhance EMS reliability and resilience. For example, many entities built a 24x7 onsite team that works along with system operators and provides dedicated support to SE and RTCA. This action has significantly reduced the outage duration resulting in many SE/RTCA issues not being reportable.
Figure 5.10: Number of EMS-Related Events Over the five-year period, the average partial or full function outage time (see Figure 5.11) was 69 minutes, making the calculated reported EMS availability 99.99%.
Figure 5.11: Average EMS Outage Time

Chapter 5: Trends in Priority Reliability Issues
NERC | State of Reliability | 2021 61
Largest Contributor to Loss of EMS Reported EMS events can be grouped by the following attributes:
Software: software defects, modeling issues, database corruption, memory issues, etc.
Communications: device issues, less than adequate system interactions, etc.
Facility: loss of power to the control center or data center, fire alarm, ac failure, etc.
Maintenance: system upgrades, job-scoping, change-management, software configuration, settings failure, etc.
Figure 5.12 shows that, over the evaluation period from 2016–2020, outages associated with software and communications challenges were the leading contributors to EMS outages.
Assessment Software and communications failures are major contributors to EMS loss. The complete loss of monitoring or control capability is the most prevalent event failure in 2020, but the loss of SE/RTCA is the most prevalent one over the evaluation period from 2016–2020. Both loss of SE/RTCA events and loss of ICCP events have been declining since 2018 due to the EOP-004-4 impact on partial loss of EMS functions reporting and the industry’s efforts to enhance EMS reliability and resilience. While failure of a decision-support tool has not directly led to the loss of generation, transmission lines, or customer load, EMS failures may hinder the decision-making capabilities of system operators during normal operations or, more importantly, during a disturbance. The ERO has analyzed data and identified that short-term outages of tools and monitoring systems are not uncommon, and the industry is committed to reducing the frequency and duration of these types of events.
Bulk Electric System Impact of Extreme Event Days Extreme event days are identified as events that fall above of the 95th percentile upper bound relative to historical severity measures for any season within North America or a specified Interconnection.46 This analysis expands on the transmission and generation components that contribute to the SRI reported in Chapter 4 to explore the causes of the extreme days and introduces restoration analysis that presents a method for measuring how quickly the transmission system is restored after extreme weather events. The response to extreme days is characterized by the amount of transmission or generation reporting immediate outages or derates on a given day. By analyzing the impact and causes of extreme event days, it is possible to identify which conditions pose the highest risk to the BES; restoration and recovery actions can mitigate exposure from these risks. While this analysis cannot address every potential scenario, learning from performance during extreme events helps provide insight into how the system may respond to a range of conditions and events. Extreme day outages for transmission and generation are presented for North America and by Interconnection.47 The analysis listed below is reported separately for transmission and generation; it is arranged with North America first
46 The 90% confidence interval of the historic values is between 5th percentile and 95th percentile. 47 For extreme day interconnection-level analysis, the Québec Interconnection is included in the analysis labeled as EI–QI.
Figure 5.12: Contributors to Loss of EMS
functions (2016–2020)

Chapter 5: Trends in Priority Reliability Issues
NERC | State of Reliability | 2021 62
and followed by each Interconnection. The maximum MVA or generating capacity for 2020 is shown in the lower right corner of each figure.
Transmission Impacted: North America In 2020, 14 days qualified as extreme transmission days for the BPS in North America. On these days, the aggregated potential MVA capacity impacted due to automatic transmission outages was 2.4 to 10.2 times as high as the average day, which is 0.06738% of total MVA capacity across North America. Weather (excluding lightning) and fire were the primary initiating cause codes reported during these extreme days. 2020’s most extreme transmission-impacting day was on October 28 and was the most extreme day in the last five years (see Figure 5.13). In the TI, 42 outages on 300–399 kV ac transmission lines and 10 outages on 100–199 kV ac transmission lines48 occurred as a result of an ice storm event. Most of the higher voltage lines lost on October 28 primarily functioned to transfer energy generated by wind farms in the Texas panhandle that, in conjunction with a low-wind forecast, allowed the remainder of the BES to maintain reliability. The ice storm also affected the MRO area in the EI–QI.
Figure 5.13: Transmission Outages during Extreme Days—North America
Conventional Generation Impacted: North America Based on analysis of GADS data, four days in 2020 qualified as extreme for North America’s BES (see Figure 5.14). On these days, the generation portion of the BES experienced outages that were 1.9–2.7 times as severe as the average day, which is 1.015% of total generating capacity. In July, high temperatures and winds across North America and fire warnings in the west contributed to two of the four days; the June and December days do not have common causes that may be attributable to extreme weather. Boiler tube leaks, electrical, and controls were the main initiating causes of outages on these extreme days, primarily located in the EI.
48 The element count includes TADS reportable elements. Non-TADS reportable elements, such as generator lead lines and metered load, are not included. For more information, reference the SRI Enhancements paper.

Chapter 5: Trends in Priority Reliability Issues
NERC | State of Reliability | 2021 63
Figure 5.14: Generation Impacted during Extreme Days—North America Detailed figures showing transmission impacts of extreme days by Interconnection are presented for the EI–QI (Figure 5.15), Texas (Figure 5.16), and WIs (Figure 5.17). Figure 5.18–Figure 5.20 illustrate the daily impacted generation for the EI–QI, Texas, and WIs, respectively.
Figure 5.15: EI–QI—Transmission Impacts during Extreme Days

Chapter 5: Trends in Priority Reliability Issues
NERC | State of Reliability | 2021 64
Figure 5.16: TI—Transmission Impacts during Extreme Days
Figure 5.17: WI—Transmission Impacts during Extreme Days

Chapter 5: Trends in Priority Reliability Issues
NERC | State of Reliability | 2021 65
Figure 5.18: EI–QI—Generation Impacts during Extreme Days
Figure 5.19: TI—Generation Impacts during Extreme Days

Chapter 5: Trends in Priority Reliability Issues
NERC | State of Reliability | 2021 66
Figure 5.20: WI—Generation Impacts during Extreme Days The top causes reported for outages that occurred on extreme days are shown below in rank order for North America as a whole and each Interconnection. Weather, excluding lightning, Fire, and Failed AC Substation Equipment were the top two causes for transmission systems (Table 5.2). The primary causes of generation outages on extreme days were equipment-related to boiler tubes and electrical (Table 5.3).
Table 5.2: Top Transmission Outage Causes on Extreme Days
Area Cause #1 Cause #2 Cause #3 Cause #4 Cause #5
North America Weather, excluding lightning
Fire Unknown Failed AC
Circuit Equipment
Power System Condition
Eastern–Québec Interconnections
Weather, excluding lightning
Failed AC Circuit
Equipment
Failed Protection
System Equipment
Vegetation Lightning
Texas Interconnection
Weather, excluding lightning
Failed AC Substation Equipment
Lightning Power System
Condition Foreign
Interference
Western Interconnection
Fire Weather, excluding lightning
Unknown Lightning Power System
Condition

Chapter 5: Trends in Priority Reliability Issues
NERC | State of Reliability | 2021 67
Table 5.3: Top Generation Outage Causes on Extreme Days
Area Cause #1 Cause #2 Cause #3 Cause #4 Cause #5
North America Boiler Tube
Leaks Electrical Controls
Fuel, Ignition, Combustion
Systems
Auxiliary Systems
Eastern–Québec Interconnections
Boiler Tube Leaks
Electrical Feedwater System Controls Auxiliary Systems
Texas Interconnection
Electrical Controls Fuel, Ignition,
Combustion Systems Auxiliary Systems
Valves
Western Interconnection
Boiler Tube Leaks
Miscellaneous (Balance of
Plant)
Miscellaneous (External)
Controls Fuel, Ignition, Combustion
Systems
Restoration Analysis to Evaluate Resilience of the Transmission System under Extreme Weather Rapid recovery, defined as “the ability to get services back as quickly as possible in a coordinated and controlled manner and taking into consideration the extent of the damage,” is identified by the 2018 NERC RISC Report on Resilience as one of four outcome-based abilities of resilience.49 Similarly, the definitions of resilience developed by FERC, DOE, NATF, and IEEE all include a rapid recovery as an ability of resilience.50 With this year’s SOR, NERC introduces a new analysis of large transmission events caused by extreme weather that quantifies aspects of these restoration activities. This new analysis is comprised of the following:
Statistics for outage and restoration processes for different types of extreme weather and allows for the measurement and tracking of transmission restoration and recovery during and after extreme weather events
An exclusive focus on the restoration of transmission elements that are outaged during severe weather events (Note that this analysis focuses on restoration of outaged transmission elements, not restoration of customer load. Restoration of the transmission system so that customer's loads can be served is always the priority and generally takes place long before all outaged transmission elements are returned to service.)
Weather-Related Transmission Outage Events
TADS Outage Grouping and 2020 Large Weather Events An algorithm groups automatic outages reported in TADS based on the Interconnection and associated start and end times.51 The resulting transmission outage events are determined as weather-related if at least one outage in the event is initiated or sustained by one the following TADS cause codes: Weather (excluding lighting), Lightning, Fire, and Environmental. The grouping produces transmission events that can cross boundaries of different utilities and different REs and allows for capture of significant events caused by extreme weather, such as hurricanes.
Large Weather-Related Events Stats: The algorithm found 18 large weather-related events (events with the event size of 20 or more outages) that occurred in the year 2020. Table 5.4 lists these 18 events in chronological order and shows the extreme/severe weather type for each event and statistics that quantify the impact of the event to the system. Only two days shown in Table 5.4 did not qualify as extreme event days, using the historical severity measure described in the previous subsection: September 16, 2020, in the combined EI–QI and November 17, 2020, in the WI.
49https://www.nerc.com/comm/RISC/Related%20Files%20DL/RISC%20Resilience%20Report_Approved_RISC_Committee_November_8_2018_Board_Accepted.pdf#search=RISC%20resilience%20report 50 Resilience Framework, Methods, and Metrics for the Electricity Sector (ieee-pes.org) 51 http://iandobson.ece.iastate.edu/PAPERS/ekishevaPESGM21.pdf

Chapter 5: Trends in Priority Reliability Issues
NERC | State of Reliability | 2021 68
Average Large Weather-Related Events Stats: The average large event in 2020 contained 50 outages and had an average event duration of 19.4 days. The largest number of outages in a single event occurred in the EI–QI on October 28, 2020, with Hurricane Zeta (153 transmission outages reported), shown in red in Table 5.4. On the same day as the start of Hurricane Zeta, two other large weather events, ice storms, began. The ice storm events are due to the same extreme weather, but they are separated into two events because they occurred in different Interconnections. The coincidence and magnitude of these events resulted in October 28, 2020, as the top extreme transmission day over the latest five years in the TI, the EI–QI, and all of North America.
Table 5.4: 2020 Large Transmission Weather-Related Events
Event Start Event
Outage Count
Inter-connection
Extreme/Severe Weather Event
MVA Affected
Miles Affected
Duration (Days)
Element-Days Lost
MVA-Days lost
January 12 22 Eastern and
Québec Thunderstorm,
wind 5,666 564 6.9 25 7,670
March 19 35 Western Winter storm,
snow 12,984 905 1.0 3 847
April 12 116 Eastern and
Québec Tornado (Easter
Tornado) 42,085 2,630 16.1 143 40,948
May 30 24 Western Thunderstorm,
wind 15,825 1,230 93.1 151 316,302
August 4 108 Eastern and
Québec Hurricane (Isaias) 43,404 1,352 9.4 79 27,033
August 10 74 Eastern and
Québec Thunderstorm,
wind 26,488 1,217 22.1 234 65,693
August 16 27 Western Thunderstorm,
wind 11,715 1,170 4.2 16 6,222
August 17 21 Western Thunderstorm, wind (Tropical
Storm) 7,190 694 0.7 3 702
August 27 49 Eastern and
Québec Hurricane (Laura) 17,604 791 14.6 176 55,865
August 31 24 Eastern and
Québec Thunderstorm,
wind 5,464 375 0.1 0.3 73
September 7 46 Western Fire 19,797 1,618 87.2 225 47,126
September 16 21 Eastern and
Québec Hurricane (Sally) 6,214 361 3.7 24 6,251
October 13 29 Western Thunderstorm,
wind 7,444 699 2.6 17 3,162
October 28 42 Texas Winter storm,
snow (Ice storm) 59,730 1,770 22.3 75 78,769
October 28 44 Eastern and
Québec Winter storm,
snow (Ice storm) 20,175 923 20.3 46 23,515
October 28 153 Eastern and
Québec Hurricane (Zeta) 56,740 3,731 40.7 197 105,788
November 15 33 Eastern and
Québec Thunderstorm,
wind 10,140 917 3.1 16 3,937
November 17 30 Western Fire 5,448 888 1.5 12 1,795

Chapter 5: Trends in Priority Reliability Issues
NERC | State of Reliability | 2021 69
Outage, Restoration, and Restoration Performance Curves Figure 5.21 illustrates the variability in the event size and event duration; however, these statistics do not completely explain what happened over the event. The outage, restoration, and restoration performance functions of the event defined from the outage data in TADS provide more details on how an event unfolded (Figure 5.21).
Figure 5.21: Outage, Restoration, and Restoration Performance Curves for a
Transmission Event
The outage curve represents the cumulative number of elements or equivalent MVA impact outaged by the time shown on the x-axis. The restoration curve represents the cumulative number of elements or equivalent MVA impact restored by the time shown on the x-axis. Lastly, the restoration performance curve is representative of the elements or equivalent MVA Impact restored minus the elements outaged at the time shown on the x-axis. This curve illustrates the degradation and restoration phases of the event and allows for the calculation of several important event statistics, some of which are also included in Figure 5.21.
The nadir of a restoration performance curve indicates the maximum simultaneous number of elements out (or the maximum simultaneous amount of MVA out). Other important statistics of a large event, the total element-days lost, and the total MVA-days lost are calculated from the event restoration performance curve as the area between the time axis and the curve. Figure 5.22 shows curves for the August 10 windstorm in the EI–QI that had the largest loss of 234 element-days and the May 30 thunderstorm event in the WI with the largest loss of 316,302 MVA-days; the patterned area illustrates the area used in the calculation. The latter was also the longest large event in 2020. A 500 kV ac circuit outage with a 30-day duration contributed more than 23% to the total MVA-day loss of the thunderstorm.
Figure 5.22: 2020 Large Weather Events with the Largest Element-Days and MVA-Days Lost

Chapter 5: Trends in Priority Reliability Issues
NERC | State of Reliability | 2021 70
Figure 5.23 shows the element and MVA-based curves for two significant 2020 events that occurred on the same day: Hurricane Zeta with the largest number of outages and the ice storm that affected the TI (the most impactful 2020 event as measured by the total MVA affected). The southeast portion of the EI–QI was also impacted by the ice storm of October 28, 2020. The element-based curves in the top row of Figure 5.23 show that Zeta had almost four times as many outages and was almost twice as long as the ice storm event in the TI. For both events, outages accumulated very fast compared with the event duration (for about 16 hours for Zeta and less than 3 hours for the ice storm) and the maximum number of elements and MVA out (i.e., the minimum of the corresponding resilience function) were reached even faster. The Texas ice storm’s maximum simultaneous MVA loss was the largest among 2020 events. The restoration process started in less than 1 hour from the event start for both events and was typical for the large events: it progressed rapidly to recover almost all elements except a few that remained out for many days and sometimes weeks. For Zeta, 95% of the elements were restored in 4 days (9.5% of the total event duration) and 95% of the MVA affected—in six days (14.7% of the total duration). For the Texas ice storm, these statistics equal 6 days (30%) and 5.2 days (23.3%), respectively.52
Figure 5.23: Element- and MVA-based Outage, Restoration, and Restoration Performance Curves for the Top Weather-Related Transmission Events in 2020
Impact of October 28, 2020 Large Weather Events on BPS October 28, 2020, was the most extreme day of 2020 for the North American BPS. Two large weather-related transmission events started on this day: An ice storm spanning the TI and a large portion of the MRO RE in the EI–QI
52 Industry is evaluating the level of restoration at 95% of outaged equipment based on the industry practice for identifying the end of an event.

Chapter 5: Trends in Priority Reliability Issues
NERC | State of Reliability | 2021 71
and Hurricane Zeta, primarily impacting the SERC RE in the EI–QI. As the analysis was done at the Interconnection level, the ice storm has been analyzed as two events below. Figure 5.24 shows the element and MVA-based curves for these three large events as well as combined curves that provide the information about their cumulative impact on the North American transmission system. The aggregated element-day loss and MVA-day loss are the sums of those for the three events and equal 319 element-days and ~208k MVA-days, respectively. The maximum simultaneous number of elements out, 135, (indicated by the nadir of the combined element-based restoration performance curve in Figure 5.24) lasted from for five minutes on October 29. This number is smaller than the sum of the three respective maximums: 27 (the EI ice storm), 39 (the Texas ice storm), and 102 (Zeta). Similarly, the maximum simultaneous amount of MVA out, 67,088, is smaller than the sum of the three respective maximums: 12,252 (the EI–QI ice storm), 55,606 (the Texas ice storm), and 32,406 (Zeta). The differences in events’ starting times and the fast restoration process started less than 40 minutes from each event start alleviated the cumulative impact to the transmission system. The restoration of the 95% of elements and the 95% of MVA for the events occurred in less than 27% of their respective total durations.
Figure 5.24: Element- and MVA-based Outage, Restoration, and Restoration Performance Curves for October 28, 2020, Large Weather-Related Transmission Events NERC-wide
In order to begin tracking the ability of the transmission system to recover from large disturbances, NERC has analyzed the largest transmission events caused by severe weather in 2020 and introduced new quantitative measures to assess their severity and the ensuing restoration processes. The measures confirm that restorations begin immediately so the net number of outaged elements is always less than the total number of elements outaged during an event. The measures also confirm that complete restoration of outaged elements, especially following large events, can take many days—long after all customers loads have been restored. NERC will continue to refine these measures in order to create a more comprehensive record of transmission system performance during large extreme events.

Chapter 5: Trends in Priority Reliability Issues
NERC | State of Reliability | 2021 72
Actions and Mitigations in Progress
Mutual assistance agreements provide essential personnel, equipment, and material following extreme weather events. NERC continues to encourage participation with assistance from government and nongovernmental authorities where applicable.
NERC continues to emphasize cold weather preparation. An annual cold weather preparation webinar is
provided in addition to a standard online training package and other resources. Version 3 of the Generating
Unit Winter Weather Readiness Reliability Guideline53 was approved by the RSTC at the end of 2020. The changes between Versions 2 and 3 were discussed in the 2020 Winter Weather Webinar.54
Studies assessing single points of failure for pipeline disruptions that affect a number of generators are being done at the regional, market, or utility level to understand the impact of limitations on natural gas supply.
Training on reporting for GADS and TADS is offered to ensure the continuous improvement of data integrity and quality related to equipment outages and causes.
Cyber and Physical Security
2020 Cyber Security Environment In 2020 as in years past, NERC received no reportable cyber security incidents that resulted in a loss of load under the CIP-008-5 standard; however, increased vulnerability disclosures by security and equipment vendors and increased voluntary sharing by entities gave the E-ISAC a greater picture of the cyber security threat environment. Cyber security shares on the E-ISAC’s secure portal increased by 96% in 2020 compared to 2019, leading to greater industry awareness of threat. Furthermore, the unprecedented COVID-19 pandemic created an increased remote cyber security attack surface for industry due to increased telework and required greater sharing and collaboration by the E-ISAC with all levels of the electricity industry, United States and Canadian governments, and partners than ever before. Despite these challenges, the combined efforts of industry, NERC, the E-ISAC, and government partners continued to ensure the BPS’s security and reliability. While there was no loss of load in North America from reportable cyber security incidents in 2020, incidents related to the major software supply chain compromise in December 2020 keeps cyber security in the forefront of industry security and resilience planning. NERC and industry must maintain a continued focus on improving defenses by increased sharing with the E-ISAC. Industry must also adapt to a threat landscape where adversaries adopt new tactics, new vulnerabilities are exploited, and the magnitude of potential impacts change as the grid evolves and cross-sector interdependencies increase. The specific techniques and tactics used by adversaries remained similar to previous years, but their unique deployments and targeting shifted, highlighting a greater focus on supply chains. Learning from the December 2020 supply chain compromise, ransomware infections, and other advanced persistent threat (APT) actors, cyber criminal, and hacktivist campaigns will enable better sector defense and response. Below is a list of threats utilities need to continue to focus on for their own systems as well as their trusted vendors and their supply chains:
Cyber Hygiene: Adversaries will find and exploit weaknesses in basic cyber hygiene, such as known vulnerabilities in popular software, inappropriately configured internet-facing devices, and reuse of credentials that were exposed in prior breaches of other organizations. Weak cyber hygiene in trusted third-parties and supply chains can expose even the most prepared utility to greater risk.
Social Engineering: Targeted phishing and other forms of social engineering exploit human fallibility and trust to gain an initial foothold into targeted systems. Phishing continues to be widely used because it continues
53 https://www.nerc.com/comm/RSTC_Reliability_Guidelines/Reliability_Guideline_Generating_Unit_Winter_Weather_Readiness_v3_Final.pdf 54 https://www.nerc.com/pa/rrm/Webinars%20DL/Winter_Weather_Prep_20200903.pdf

Chapter 5: Trends in Priority Reliability Issues
NERC | State of Reliability | 2021 73
to deliver results for adversaries, and the most advanced examples of targeted spear phishing are practically indistinguishable from legitimate email traffic.
Insider Threats: Recruiting a willing, coerced, or even an unwitting insider to facilitate access is a highly effective (but riskier to the adversary) tactic. Employees, subcontractors, and other business affiliates have good access to the targeted organization and are often knowledgeable about sensitive, non-public systems of particular value. Insider threats are facilitated by lax organizational security cultures. An insider threat is also a consideration for third-party vendors and other service providers who have access to utility systems.
Supply Chain Compromise: An adversary’s goal in supply chain compromise is getting a specific organization or industry to acquire and use equipment that has unknown exploitable features. While there are many methods, supply chain compromise vectors are resource-intensive. Certain vendors can introduce their goods into locations of strategic interest through insurmountable competitiveness on cost likely subsidized by the host vendor’s host nation. Opaque and convoluted networks of largely unknown resellers and brokers with bids deliberately crafted to exploit the acquisition rules of the target customer are sometimes used to mask these activities. For power system and telecommunications facilities, turnkey engineering procurement and construction management contracts are an enduring risk throughout the entire lifecycle of the infrastructure, increasing exposure to the threat. In the most extreme cases, simply acquiring the target organization or a connected entity is a feasible option for well-resourced adversaries. While legal and regulatory controls in the United States and Canada may prevent direct use of this tactic, these defenses would not necessarily preclude the adversary from locking down strategic portions of a broader value chain.
The cyber security landscape continues to evolve, guided by geopolitical events, new vulnerabilities, changes in technologies, and increasingly bold cyber criminals and hacktivists. Unlike the physical grid and traditional reliability metrics, cyber security trend analysis is more nuanced. Table 5.5 shows cyber security incident types shared by members and partners with the E-ISAC in 2019 and 2020. A cyber security incident is defined as an event that may negatively impact an organization and was noteworthy enough to report to the E-ISAC even if there were no outages or reliability impacts (an event is a change in the normal behavior of a system, process, or environment). The typical organization experiences thousands or millions of events every day and very few of these events are incidents. Still, the positive trajectory of voluntary sharing with the E-ISAC is encouraging but must continue as threats increase and evolve to ensure security and reliability of the BPS.
Table 5.5: Grid Security-related Cyber Shares with E-ISAC
Incident Type 2019 2020 Total Percent change
Denial of Service 17 17 34 0%
Malware 145 142 287 -2%
Phishing 289 297 586 3%
Ransomware 27 73 100 170%
Scanning 6 28 34 367%
Supply Chain 39 85 124 118%
Suspicious Activity 453 956 1,409 111%
Vulnerability 128 328 456 156%
Cyber-related Briefings/Reports* 212 685 897 223%
Miscellaneous** 25 13 38 -48%
Total 1,341 2,624 3,965 96%
*Contains briefings, reports, and miscellaneous/unclassified shares **Includes shares with a sample size under 30 (n≤30), such as Generic intrusion, Spam, Waterhole

Chapter 5: Trends in Priority Reliability Issues
NERC | State of Reliability | 2021 74
Figure 5.25 shows the positive trend of increased “cyber shares” with the E-ISAC in 2019 and 2020 via both the E-ISAC Portal and other secure methods. These interactions show increased interaction with the E-ISAC by members (asset owners and operators) and partners (government, vendors) on cyber security threats and provide greater information needed for wider industry trend analysis.
Figure 5.25: Cyber Shares by Information Sharing Channel
Ransomware With more organizations than ever relying on remote access technologies, threat actors are increasingly using ransomware to target the availability of organizations’ networks. Ransomware operators have been observed using multiple tactics that include phishing and exploiting remote desktop protocol vulnerabilities and vulnerabilities in common software suites to gain initial access to target networks. Ransomware operators have moved on from generic, widespread phishing campaigns and have become more focused on choosing higher value targets. Instead of targeting each organization individually, some threat actors are seeking to target third party organizations, such as managed service providers, that could act as a gateway to numerous organizations. Additionally, many ransomware operators are exfiltrating data off target networks and ransoming the public disclosure of confidential data.
Ransom Distributed Denial of Service In the fall of 2020, the electricity industry experienced a new and novel distributed denial-of-service (DDoS) threat that involved a ransom component known as ransom distributed denial-of-service (RDDoS). This RDDoS campaign was first reported in the news in August 2020. It targeted thousands of organizations around the world throughout multiple sectors. The actors sent an email to target organizations demanding Bitcoin payment to prevent a planned DDoS attack and followed it with a smaller attack that they claimed would demonstrate their intent and capability. Electricity industry organizations were able to effectively mitigate the impact of these DDoS attacks by working with their internet service providers as well as upstream and DDoS mitigation service providers to help identify and defend against these attacks. While the event did not cause any electrical outages or threaten reliability, its pervasiveness and potential impact caught the attention of the E-ISAC and industry.

Chapter 5: Trends in Priority Reliability Issues
NERC | State of Reliability | 2021 75
Critical Vulnerabilities The COVID-19 pandemic has changed how enterprises operate in various ways; many have switched to a remote workforce in order to continue business operations. As a result, dependencies on network security products, such as popular perimeter firewalls and virtual private network appliances, have reached an unprecedented level of importance for many of these enterprises. Throughout 2020, the E-ISAC shared details on a number of noteworthy critical vulnerabilities. Vulnerabilities in network security products, specifically, remote code execution vulnerabilities that impact F5 and Palo Alto network appliances drew the attention of security researchers and threat actors alike. Vulnerable systems could allow unauthenticated attackers to gain access to the systems, potentially resulting in full system control or in some cases authentication bypass when popular security configurations are enabled. Threat actors have rapidly adopted exploitation tools and techniques that take advantage of vulnerabilities disclosed by F5 and Palo Alto in order to gain initial access to target environments. F5 and Palo Alto appliances can be found in enterprise and industrial control environments, thus raising the level of concern. “Ripple20,” a collection of 19 vulnerabilities in a TCP/IP software library developed by Trek, is present in many OT devices utilized by the energy sector. In 2020, the E-ISAC published an all-points bulletin due to the prevalence of Trek’s software in industrial environments, the high criticality in four of these vulnerabilities, and the difficulty of identifying and patching vulnerable devices. The impact of Ripple20 has continued into 2021 with continuous discoveries of affected products and required patches. The E-ISAC has urged members to monitor vendors for updates and patch when available.
Actions and Mitigations in Progress
Increased Voluntary Sharing to Increase Industry-Wide Threat Visibility: The E-ISAC relies on shares by members and partners, data from the CRISP, and a variety of tools and platforms to identify actionable information for the electricity industry and to share in a timely fashion to drive entity action to defend the BPS and improve their resilience. Voluntary sharing with the E-ISAC enables industry-wide link analysis to spot macro-trends that an individual utility may not see. Sharing increased in 2020, but greater sharing in 2021 would increase visibility further.
Evolving and Maturing CRISP: CRISP facilitates the near real-time bidirectional exchange of cyber security information among industry, the E-ISAC, and the DOE to enable owners and operators to better protect their systems from sophisticated cyber threats. CRISP kicked off new pilots in 2020 focused on operational technology sharing in order to better understand the threat landscape and compare indicators of compromise from several incidents throughout the year.
Cross-Border Collaboration between Canada and the United States: The E-ISAC and Ontario's Independent Electricity System Operator expanded its partnership to include monthly analyst exchanges, threat indicator, and finished report sharing to create a shared understanding of the cyber security threat environment on a continent-wide basis.
Recommendations
Industry and the E-ISAC should continue to actively participate in public-private partnership opportunities discussed in the joint report from the National Infrastructure Advisory Council and the 2020 Cyberspace Solarium Commission, available on the Solarium website.55
The CRISP model should be leveraged to incorporate new data sources for analysis coordinated with the ESCC and DOE as well as expanding the use of CRISP or similar sensor technologies should be further explored.56
Entities should test their incident response, mitigation, and recovery plans with their vendors and state/local government partners in exercises and drills, such as GridEx VI.
55 https://icitech.org/2020-us-cyberspace-solarium-commission-report/?gclid=EAIaIQobChMImvWCnaup8QIVjITICh2idA1_EAAYASAAEgK97_D_BwE 56 https://www.energy.gov/articles/biden-administration-takes-bold-action-protect-electricity-operations-increasing-cyber-0

Chapter 5: Trends in Priority Reliability Issues
NERC | State of Reliability | 2021 76
2020 Physical Security Environment Throughout 2020, the North American electricity industry and the rest of the world faced unprecedented challenges created by the COVID-19 pandemic. In addition, the United States experienced an increase in economic and social tensions, some of which also impacted Canada.
Challenges
Pandemic and Civil Unrest: The COVID-19 pandemic caused terrible loss of life and put utilities under stress (e.g., health and safety, changes in operational environments, budget shortfalls). The year also saw considerable civil unrest with some vandalism at member facilities associated with the pandemic.
Increase in Destructive Incidents: The E-ISAC observed an upward trend in tampering, vandalism, and gunfire incidents that likely related to the economic conditions and social stressors associated with COVID-19. Following the beginning of the civil unrest in late May, those trends started to decline, reverting to levels similar to their historical marks.
Threats from Extremists: Various government bulletins and open source reporting warned of an increase in the level of activity from domestic violence extremists who advocate for violence, some of which included reports on certain groups or individuals discussing targeting electrical infrastructure.
Activism: A variety of activist campaigns took place throughout the United States and Canada that focused on climate change and protesting against fossil fuels, including the development of pipelines. This also included disruptive rail blockades, particularly in Canada.
Successes
Increased Information Sharing: Members shared information with the E-ISAC and each other in greater numbers than ever. There was a 43% increase in the number of members who voluntarily shared security incidents (although the actual number of incidents remained equal to the number shared in 2019). Voluntary sharing accounted for 86% of all incidents.
Pandemic Response: Electricity industry security professionals adapted to meet the needs of a new environment and addressed challenges, including employee safety, remote work, the capability to identify suspicious activity under different baseline conditions, and constrained budgets.
New Analytical Products: The E-ISAC worked with its members to create new products, such as the E-ISAC Physical Security Quarterly report, an industry white paper on physical and cyber threats to wind farms, and analytical reports focused on risks to industry associated with the 2020 United States presidential election.
New Tools and Resources: The E-ISAC, working in concert with the Physical Security Advisory Group, developed and promoted a series of new tools, including a virtual Vulnerability of Integrated Security Analysis workshop, the Protective Measures Index, user guides, training, and an updated version of the Vulnerability of Integrated Security Analysis Implementation Guide.
Increased Information Sharing In 2020, members shared 1,328 physical security incidents with the E-ISAC. The vast majority of these incidents directly stemmed from voluntary information sharing, accounting for 86% of incidents (see Figure 5.26). The number of incidents remained equal to the number of incidents shared in 2019 but with greater engagement from members. The number of members who voluntarily shared with the E-ISAC increased by 43% from the year prior, building a stronger physical security community. Members voluntarily share incident information through phone calls, emails, Portal postings, and bulk data submissions. Bulk data submissions typically occur either weekly or monthly and include wrap-ups of security incidents. Mandatory reports accounted for 11% of the incidents tracked, and the remaining incidents were from open source and partner shares. The E-ISAC encourages participation at all levels but especially from electric utility security, operations, safety, and reliability teams.

Chapter 5: Trends in Priority Reliability Issues
NERC | State of Reliability | 2021 77
New Severity Level Categorization In 2020, the E-ISAC developed a new Severity Level Categorization Data model, which is an assessment of the impact, or potential impact, of physical security incidents shared with the E-ISAC. The E-ISAC uses this model to analyze shared data and add context, which provides critical analysis in accurately assessing risk. The categorization levels (listed below) include physical security incidents, cyber-enabled physical attacks, and physical-enabled cyber attacks. The Severity Level Categorization is adapted from a model utilized by the Royal Canadian Mounted Police to assess incidents for electricity industry use:
Level 0: General observations of suspicious activity or conditions
Level 1: Criminal activity with no impact to the grid
Level 2: Physical security incident with any impact to the grid
Level 3: Physical security incident with direct and significant impact to the grid
Figure 5.27 represents the breakdown by severity level of the incidents shared with the E-ISAC throughout 2020. Note that 0% represents a measurable number of incidents but is a number that totals less than half of 1%. This data model was initiated in the first quarter of 2020 and provides the framework for the Physical Security Quarterly Report. This report was developed in 2020 to provide asset owners and operators with more detailed analysis and information about the physical security incidents shared with the E-ISAC on a quarterly basis. The quarterly report ultimately provides industry with a more accurate overview of the types of incidents occurring across the industry as well as the emerging threats and risks.
Figure 5.26: 2020 Information Sharing Methods
Figure 5.27: 2020 Incidents by
Severity Level

Chapter 5: Trends in Priority Reliability Issues
NERC | State of Reliability | 2021 78
Looking Forward The physical security threat landscape for the electricity industry is likely to become more complex throughout 2021. When assessing the most likely threats anticipated in the electricity industry in 2021, members should maintain a heightened level of awareness of, but not limited to, the following:57
Periods of civil unrest that could serve as flashpoints for violent opportunists to commit acts of vandalism against utility personnel or assets
Continued threats posed by domestic violent extremists (including lone offenders or individuals operating in small groups) in targeting or promoting the targeting and sabotage of electricity assets
Continued activism against the fossil fuel industry, including planned protests that could involve direct action and physical damage
Increased copper theft due to the current economic conditions and high prices of copper In addition, the E-ISAC assesses that drones will continue to be an emerging threat to the industry with the continued improvement of technology, expansion into the commercial market, and capacity for causing harm. Foreign adversaries may also amplify discord and promote misinformation to undermine confidence to achieve their own agendas, including the potential to inspire domestic or homegrown extremists to radicalize or conduct attacks. The power grid continues to be the lynchpin of critical infrastructure and one of the most influential factors within the North American economy; therefore, it will likely remain a target for the foreseeable future. While there are many challenges, risks, and threats posed towards the industry, the increasing willingness to share information with the E-ISAC, government, and other partners will help continue to provide threat awareness and mitigation strategies that ultimately assist in making the North American Grid more resilient.
57 This outlook is based on member and partner-shared data, government reports, and discussions with security professionals across the
industry.

NERC | State of Reliability | 2021 79
Appendix A: Reliability Indicator Ratings and Descriptions
This appendix includes detail on the definition, calculation, rating levels, and purpose for the reliability indicators in Chapter 3. Reliability indicators tie the performance of the BPS to a set of reliability performance objectives defined by NERC. Metrics are rated on a four-point color scale:
Red: Actionable, may lead to key finding
Yellow: Monitor
Gray: Stable or no change
Green: Improving Some of the reliability indicators have been evaluated to determine whether they exhibit statistically significant trends or whether the year-on-year changes all fall within a narrower band of confidence. Where statistically significant trends are observed, NERC uses the following notation:
Resource Adequacy Two measures have been selected to indicate the status of resource adequacy for the BES: Planning Reserve Margin and EEAs. Planning Reserve Margin presents the forward-looking perspective on whether sufficient resources are expected to be available to meet demand. The EEAs provide real-time indication of potential and actual energy emergencies within an Interconnection.
Planning Reserve Margin This metric counts the number of areas reporting “adequate,” “marginal,” or “inadequate” Planning Reserve Margins for the 2020 summer and 2020/2021 winter. NERC assesses resource adequacy by evaluating each assessment area’s Planning Reserve Margins relative to its Reference Margin Level. On the basis of projected reserves, NERC determines the associated risk by using the following framework:
Adequate: Anticipated Reserve Margin is greater than Reference Margin Level, and there is a high degree of expectation in meeting all forecast parameters.
Marginal: Anticipated Reserve Margin is greater than Reference Margin Level and there is a low degree of expectation in meeting all forecast parameters, or the Anticipated Reserve Margin is slightly below the Reference Margin Level and additional and sufficient Tier 2 resources are projected.
Inadequate: Anticipated Reserve Margin is less than the Reference Margin Level; load interruption is likely. Definition and Calculation The Planning Reserve Margin determines the amount of committed capacity a given assessment area expects compared to the projected net internal demand. Each assessment area is evaluated annually through the long-term

Appendix A : Reliability Indicator Ratings and Descriptions
NERC | State of Reliability | 2021 80
and seasonal assessment processes (21 assessment areas are currently evaluated). This metric counts the number of assessment areas reporting “marginal” or “inadequate” for NERC’s prior year Summer Reliability Assessment and Winter Reliability Assessment according to the size of the assessment area in MW of peak total internal demand (small <10,000 MW, medium 10,000–25,000 MW, and large >25,000 MW). Rating
Red (actionable): There is at least one inadequate large assessment area.
Yellow (monitor): There is more than one small or medium inadequate assessment area.
Gray (stable): There is at least one marginal, no inadequate assessments.
Green (good/improving): There are no marginal or inadequate assessments. Purpose The purpose of the Planning Reserve Margin is to determine how many areas and to what extent capacity deficiencies can be expected. Planning Reserve Margins cannot precisely predict capacity deficiencies, but areas below the Reference Margin Level indicate a higher probability of a capacity deficiency occurring than the desired target of 1-day-in-10 years.
Energy Emergency Alerts NERC has established three levels of EEAs that allow for communication of emerging energy emergencies among BAs and RCs within an Interconnection. This metric measures the duration and number of times EEAs of all levels are issued and when firm load is interrupted due to an EEA Level 3 declaration. EEA Level 3 declarations indicate that firm load interruption is imminent or in progress due to the inability of meeting minimum contingency reserve requirements. However, not all EEA Level 3 alerts lead to an operator-controlled firm load interruption. Rating: The rating for this reliability indicator is suspended for 2020 while under review for revisions.
Red (actionable): Year-over-year count increase and continues to be above the five-year average.
Yellow (monitor): Year-over-year count increase and first year that it is above the five-year average.
Gray (stable): Reporting year-over-year count is no change and is less than five-year average.
Green (good/improving): Year-over-year count improvement and less than the five-year average or zero.
Definition and Calculation These metrics track EEA declarations for BAs when actual capacity and/or energy deficiencies occur as defined by EOP-011-1.58 Purpose The purpose of an EEA is to provide real-time indication of potential and actual energy emergencies within an Interconnection. EEA trends may provide an indication of BPS capacity, energy, and transmission insufficiency. This metric may also provide benefits to the industry when considering correlations between EEA events and Planning Reserve Margins.
58 Copy of EOP-011-1: https://www.nerc.com/pa/Stand/Reliability%20Standards/EOP-011-1.pdf

Appendix A : Reliability Indicator Ratings and Descriptions
NERC | State of Reliability | 2021 81
Transmission Performance and Unavailability Five measures have been selected to indicate the status of resource adequacy for the BES:
Transmission-Related Events Resulting in Loss of Load Supported by Event Analysis Data
Transmission Outage Severity
Automatic AC Transmission Outages
Automatic AC Transformer Outages
Transmission Element Unavailability
Transmission-Related Events Resulting in Loss of Load Supported by Event Analysis Data This metric counts BPS transmission-related events resulting in the loss of firm load, excluding weather-related outages. Additional metrics measure the duration and magnitude of the firm load loss. Definition and Calculation An “event” is an unplanned disturbance that produces an abnormal system condition due to equipment failures/system operational actions that result in the loss of firm load. The reporting criteria for such events are as follows:59
The loss of firm load for 15 minutes or more:
300 MW or more for entities with previous year’s demand of 3,000 MW or more
200 MW or more for all other entities
A BES emergency that requires manual firm load shedding of 100 MW or more
A BES emergency that resulted in automatic firm load shedding of 100 MW or more via automatic under-voltage or UFLS schemes or SPS/RAS60
A transmission loss event with an unexpected loss within an entity’s area, contrary to design, of three or more BES elements caused by a common disturbance (excluding successful automatic reclosing) that results in a firm loss of load of 50 MW or more
Excludes weather related events Rating
Red (actionable): The count of events and MW of load loss increased from the year before or the count of events or MW of load loss are greater than median value.
Yellow (monitor): MW load loss increased from year before or stable and greater than median value.
Gray (stable): The count of events or MW of load loss is slightly less than median value or the same as the year before and below the median value.
Green (good/improving): The count of events and MW of load loss for the year is less than the year before and below median value or count of events is zero.
Purpose The purpose of this metric is to track transmission related events that result in loss of firm load. This allows planners and operators to validate their design and operating criteria, assuring acceptable performance of the system.
59 ALR 1-4 Reporting Criteria: http://www.nerc.com/comm/PC/Performance%20Analysis%20Subcommittee%20PAS%202013/ALR1-4_Revised.pdf 60 https://www.nerc.com/pa/Stand/Glossary%20of%20Terms/Glossary_of_Terms.pdf. This document defines SPS as a special protection system and a RAS as a remedial action scheme.

Appendix A : Reliability Indicator Ratings and Descriptions
NERC | State of Reliability | 2021 82
Transmission Outage Severity The impact of a TADS event to BPS reliability is called the TOS of the event, which is defined by the number of outages in the event and by the type and voltage class of transmission elements involved in the event. TADS events are categorized by ICCs. These ICCs facilitate the study of cause-effect relationships between each event’s ICC and event severity. Definition and Calculation TOS (representing the impact of a TADS transmission outage event by its equivalent MVA value), as defined in the SRI, compared to the total equivalent MVA of the BPS. The metric is calculated for transmission outage events that involve sustained outages of 100 kV and above ac circuits and transformers. Rating
Red (actionable): Both average TOS and average duration show a statistically significantly increase compared to the previous five-year period.
Yellow (monitor): Either average TOS or average duration show a statistically significantly increase compared to the previous five-year period.
Gray (stable): No statistically significant change in the average TOS and duration compared to the previous five-year period or either average TOS or average duration show a statistically significantly decrease compared to the previous five year period.
Green (good/improving): Both average TOS and average duration show a statistically significantly decrease compared to the previous five-year period.
Purpose To compare the average impacts and durations of transmission outage events for a specific ICC and the frequency of those events.
Automatic AC Transmission Outages This series of metrics measures the impacts of high-risk failure modes to transmission availability. The metrics include any BES ac transmission element outages that were initiated by the following:
Failed Protection System: Misoperations or failure of protection system equipment, including relays and/or control misoperations except those caused by incorrect relay or control settings
Human Error: Relative human factor performance, including any incorrect action traceable to employees and/or contractors to companies operating, maintaining, and/or assisting the TO
Failed AC Substation Equipment: Equipment inside the substation perimeter, including transformers and circuit breakers but excluding protection system equipment
Failed AC Circuit Equipment: Equipment like overhead or underground equipment outside the substation perimeter (This is the only metric based on outages per hundred miles.)
Definition and Calculation Normalized count (on a per circuit basis, or per 100 miles for ac circuit equipment) of 100 kV and above ac transmission element outages (i.e., momentary and sustained automatic outages) initiated by each of the high-risk failure modes. Failed ac element equipment counts are normalized on a per 100-mile basis. Rating
Red (actionable): The outage frequency statistically significantly increased compared to the previous four years.

Appendix A : Reliability Indicator Ratings and Descriptions
NERC | State of Reliability | 2021 83
Yellow (monitor): The outage frequency increased compared to the previous four years, but the increase is not statistically significant.
Gray (stable): The outage frequency did not change or decreased compared to the previous four years, and the decrease is not statistically significant.
Green (good/improving): The outage frequency statistically significantly decreased compared to the previous four years.
Purpose The purpose of this metric is to evaluate high-risk failure modes for transmission availability as a factor in the performance of the transmission system.
Automatic AC Transformer Outages This series of metrics measure the impacts of high risk failure modes to transformer availability. The metrics include any BES ac transformer outages that were initiated by the following:
Failed Protection System: Misoperations or failure of protection system equipment, including relays and/or control misoperations except those caused by incorrect relay or control settings
Human Error: Relative human factor performance, including any incorrect action traceable to employees and/or contractors to companies operating, maintaining, and/or assisting the TO
Failed AC Substation Equipment: Equipment inside the substation perimeter, including transformers and circuit breakers but excluding protection system equipment
Definition and Calculation Normalized count (on a per transformer basis) of 100 kV and above ac transformer outages (i.e., TADS momentary and sustained automatic outages) that were initiated by each of the high risk failure modes. Rating
Red (actionable): The outage frequency statistically significantly increased compared to the previous four years.
Yellow (monitor): The outage frequency increased compared to the previous four years, but the increase is not statistically significant.
Gray (stable): The outage frequency did not change or decreased compared to the previous four years, and the decrease is not statistically significant.
Green (good/improving): The outage frequency statistically significantly decreased compared to the previous four years.
Purpose The purpose of this metric is to evaluate high risk failure modes for transformer availability as a factor in the performance of the transmission system.
Transmission Element Unavailability This metric determines the percentage of BES ac transmission elements (i.e., transmission lines and transformers) that are unavailable when outages due to automatic and operational events are considered. Transmission and transformer outages can degrade the performance of the transmission system that can result in congestion, equipment overloads, and, in some instances, to cascading conditions and blackout.
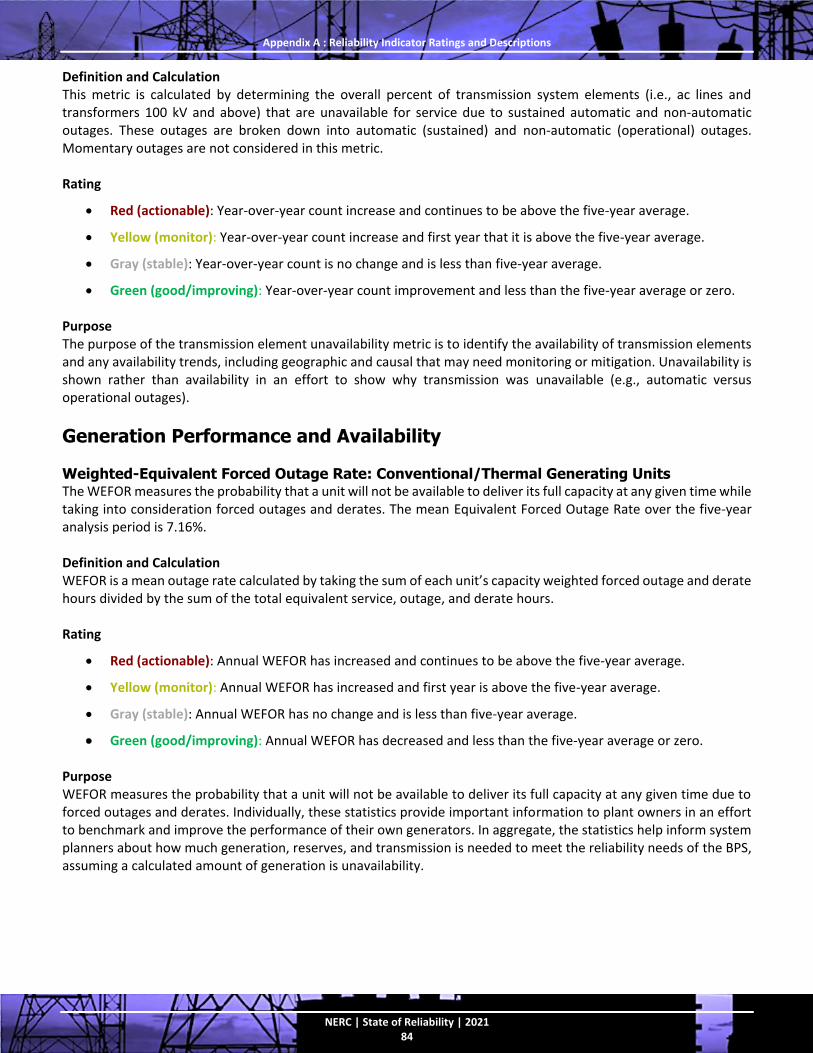
Appendix A : Reliability Indicator Ratings and Descriptions
NERC | State of Reliability | 2021 84
Definition and Calculation This metric is calculated by determining the overall percent of transmission system elements (i.e., ac lines and transformers 100 kV and above) that are unavailable for service due to sustained automatic and non-automatic outages. These outages are broken down into automatic (sustained) and non-automatic (operational) outages. Momentary outages are not considered in this metric. Rating
Red (actionable): Year-over-year count increase and continues to be above the five-year average.
Yellow (monitor): Year-over-year count increase and first year that it is above the five-year average.
Gray (stable): Year-over-year count is no change and is less than five-year average.
Green (good/improving): Year-over-year count improvement and less than the five-year average or zero. Purpose The purpose of the transmission element unavailability metric is to identify the availability of transmission elements and any availability trends, including geographic and causal that may need monitoring or mitigation. Unavailability is shown rather than availability in an effort to show why transmission was unavailable (e.g., automatic versus operational outages).
Generation Performance and Availability
Weighted-Equivalent Forced Outage Rate: Conventional/Thermal Generating Units The WEFOR measures the probability that a unit will not be available to deliver its full capacity at any given time while taking into consideration forced outages and derates. The mean Equivalent Forced Outage Rate over the five-year analysis period is 7.16%. Definition and Calculation WEFOR is a mean outage rate calculated by taking the sum of each unit’s capacity weighted forced outage and derate hours divided by the sum of the total equivalent service, outage, and derate hours. Rating
Red (actionable): Annual WEFOR has increased and continues to be above the five-year average.
Yellow (monitor): Annual WEFOR has increased and first year is above the five-year average.
Gray (stable): Annual WEFOR has no change and is less than five-year average.
Green (good/improving): Annual WEFOR has decreased and less than the five-year average or zero. Purpose WEFOR measures the probability that a unit will not be available to deliver its full capacity at any given time due to forced outages and derates. Individually, these statistics provide important information to plant owners in an effort to benchmark and improve the performance of their own generators. In aggregate, the statistics help inform system planners about how much generation, reserves, and transmission is needed to meet the reliability needs of the BPS, assuming a calculated amount of generation is unavailability.

Appendix A : Reliability Indicator Ratings and Descriptions
NERC | State of Reliability | 2021 85
System Protection and Disturbance Performance Reliability indicators selected to signal system protection and disturbance performance include the following:
Interconnection Frequency Response
Disturbance Control Standard Metric
Protection System Misoperations
Interconnection Reliability Operating Limit Exceedances
Interconnection Frequency Response Primary frequency response is essential for maintaining the reliability of the BPS. When there are disturbances due to the loss of generation or load, it is critical that large rapid changes in Interconnection frequency are arrested quickly and stabilized until frequency can be restored. The metric evaluates the following periods:
Arresting period: The time from predisturbance frequency to the time of the frequency nadir that occurs within the first 12 seconds of the event. It is during the arresting period that the combination of system inertia, load damping, and primary frequency response provided by resources act together to limit the duration and magnitude of the frequency deviation. Loss of load events are excluded from arresting period analysis.
Stabilizing period: The time after primary frequency response is deployed and the system has entered a period of relative balance and stable frequency. It is defined as the average frequency occurring between 20 and 52 seconds after the start of resource or load loss event.
Definition and Calculation This metric is based on methods defined in the ERS Framework Measure 1, 2, and 4 - Historical Frequency Analysis61 report used to calculate an interconnection frequency response performance measure (IFRMA-B) as the ratio of the resource or load megawatt loss that initiated the event to the difference of predisturbance frequency (Value A) and the stabilizing period frequency (Value B). Measurement of frequency performance in that time period is a surrogate for the lowest frequency during the event (the nadir or Point C). Rating
Red (actionable): Any statistical decline in the arresting period rolling five-year time trend or any instance of UFLS activation
Yellow (monitor): Statistical decline in the stabilizing period but not in the arresting period
Gray (stable): Improvement in arresting period or stabilizing period and no declining trend in the other period or no trend in arresting period or stabilizing period
Green (good/improving): Both arresting period and stabilizing period are statistically improving Purpose The purpose of this metric is to determine frequency response trends for each Interconnection so that adequate primary frequency control is provided to arrest and stabilize frequency during frequency excursions of a predefined magnitude.
61 The BAL-003-1.1 standard defines PFR performance at the BA level: https://www.nerc.com/comm/Other/essntlrlbltysrvcstskfrcDL/Item_6b.ii._ERS_Historical_%20Measures_124%20_Technical%20Brief_DRAFT_%2020171107.pdf

Appendix A : Reliability Indicator Ratings and Descriptions
NERC | State of Reliability | 2021 86
Disturbance Control Standard Metric This metric measures the ability of a BA or RSG to balance resources and demand following reportable disturbances. NERC Reliability Standard BAL-002-3, contingency reserve, requires that a BA or RSG maintain sufficient contingency reserves equal to its most severe single contingency and recover their balance of resources and demand within the contingency event recovery period62 for RBCEs. Definition and Calculation The metric is calculated as a percentage of the RBCE recoveries divided by the total number of RBCEs. Rating
Red (actionable): The recovery percentage decreased year-over-year and continues to be below the five-year average.
Yellow (monitor): The recovery percentage decreased year-over-year and is below the five-year average.
Gray (stable): The recovery percentage is ≥ year-over-year and is ≤ five-year average.
Green (good/improving): The recovery percentage is > year-over-year or 100% and is ≥ the five-year average. Purpose The purpose is to measure the ability of the BA or RSG to use contingency reserves to restore the balance of resources and demand within the system following a reportable disturbance. The results help measure the risk the system is exposed to during contingencies, the annual trend in reportable events, and how the BA or RSG’s system performs when they occur.
Protection System Misoperations The Protection System Misoperations metric evaluates the performance of protection systems—both generator and transmission. Protection system misoperations have been identified as a major area of concern as stated in previous State of Reliability reports because misoperations exacerbate event impacts for the BPS. Definition and Calculation The metric is the ratio of protection system misoperations to total protection system operations. Rating
Red (actionable): The misoperations rate for NERC shows a statistically significant increase compared to the past four years for more multiple consecutive years.
Yellow (monitor): The misoperations rate for two REs show a statistically significant increase or the NERC misoperations rate shows a statistically significant increase compared to the past four years for one year.
Gray (stable): There is no statistically significant difference in the NERC misoperations rate compared to the past four years (there may be a numerical change in the NERC misoperations rate).
Green (good/improving): There is a statistically significant decreasing trend in the NERC misoperations rate or zero compared to the past four years.
Purpose The purpose of the Protection System Misoperations metric is to calculate a misoperations rate to determine the relative performance of protection system operations and allow NERC to identify concerning or improving trends.
62 A period that begins at the time that the resource output begins to decline within the first one-minute interval of a RBCE and extends for 15 minutes thereafter.

Appendix A : Reliability Indicator Ratings and Descriptions
NERC | State of Reliability | 2021 87
The misoperations rate provides a consistent way to trend misoperations and to normalize for weather and other factors that can influence the count.
Interconnection Reliability Operating Limit Exceedances This metric measures the number of times and the duration that an IROL is exceeded. An IROL is a system operating limit that, if violated, could lead to instability, uncontrolled separation, or cascading outages. Each RC is required to operate within the IROL limits and minimize the duration of such exceedances. IROL exceedance data are reported per quarter and uses four duration intervals between 10 seconds and greater than 30 minutes. The data is presented at the Interconnection level. Definition and Calculation A simple number count of IROL (real-time or post-contingent) exceedances. Start and end times for IROL exceedance are recorded and the duration is grouped into four time segments as follows:
10 seconds ≤ time IROL has been exceeded < 10 minutes (excluded from metric)
10 minutes ≤ time IROL has been exceeded < 20 minutes
20 minutes ≤ time IROL has been exceeded < 30 minutes
30 minutes ≤ time IROL has been exceeded Rating
Red (actionable): One IROL > 30 minutes or continued count of IROL< 20 minutes greater than five-year average for more than one year or continued count of IROL < 20 minutes is greater than five-year average.
Yellow (monitor): Year-over-year count increase of IROL < 30 minutes or first year count of IROL < 20 minutes is greater than five-year average.
Gray (stable): IROL < 20 minutes count is less than the five-year average.
Green (good/improving): Year-over-year count decrease of IROL < 30 minutes or zero, and IROL < 20 minutes is less than the five-year average or zero.
Purpose The purpose of measuring IROL exceedances is to provide an indication of frequency and duration of IROL mitigation. Exceeding an IROL could cause widespread outages if prompt operating control actions are not taken to return the system to within normal IROL limits.

NERC | State of Reliability | 2021 88
Appendix B: Contributions
NERC would like to express its appreciation to the many people who provided technical support and identified areas for improvement as well as all the people across the industry who work tirelessly to keep the lights on each and every day.
NERC Industry Group Acknowledgements Group Officers
Reliability Security and Technical Committee
Chair: Greg Ford, Georgia System Operations Corporation Vice Chair: David Zwergel, MISO
Performance Analysis Subcommittee
RSTC Sponsor: Jeff Harrison, Associated Electric Cooperative Chair: Brantley Tillis, Duke Energy Vice Chair: David Penney, Texas RE
Events Analysis Subcommittee Chair: Vinit Gupta, ITC Vice Chair: Ralph Rufrano, NPCC
Generation Availability Data System User Group
Chair: Leeth DePriest, Southern Company Vice Chair: Steve Wenke, Avista Corporation
Misoperations Information Data Analysis System User Group
Chair: Brian Kasmarzik Vice Chair: Thomas Teafatiller, Reliability First
Transmission Availability Data System User Group
Chair: John Idzior, Reliability First Vice Chair: Nick DePompei, SERC
Resources Subcommittee Chair: Greg Park, NWPP Vice Chair: Rodney O’Bryant, Southern Company
Real-Time Operating Subcommittee
Chair: Chris Pilong, PJM Vice Chair: Jimmy Hartmann, ERCOT
Frequency Working Group Chair: Tony Nguyen, BC Hydro
Reliability Assessment Subcommittee
Chair: Lewis De La Rosa, Texas RE
Vice Chair: Anna Lafoyiannis, Independent Electricity System Operator
System Protection and Control Subcommittee
Chair: Jeff Iler, AEP
Vice Chair: Bill Crossland, RF
NERC Staff
Name Title
Mark Lauby Senior Vice President and Chief Engineer
John Moura Director, Reliability Assessment and Performance Analysis
Kristen Bove Principal Analyst, Physical Security, E-ISAC
Michael Bowen Acting Director of Security Operations, E-ISAC
Terry Campbell Manager and Editor, Technical Publications
Alex Carlson Senior Technical Publications Specialist
Stephen Coterillo Engineer
Matthew Duncan Director, Intelligence, E-ISAC
Svetlana Ekisheva Principal Data Science Advisor
Brad Gordon Senior Engineer
Bill Graham Manager, Bulk Power System Awareness
Richard Hackman Senior Event Analysis Advisor
Jeff Jones Manager, Cyber Threat Intelligence, E-ISAC
Matthew Lewis Manager of Event Analysis
Robert Maddox Senior Data Analyst

Appendix B : Contributions
NERC | State of Reliability | 2021 89
NERC Staff
Name Title
Mani Mardhekar Senior Engineer
Kimberly Mielcarek Senior Director, Communications
Darrell Moore Director, Situation Awareness
Jack Norris Engineer II
Mark Olson Manager, Reliability Assessments
Margaret Pate Program Liaison
Donna Pratt Manager, Performance Analysis
Wei Qiu Lead Engineer
Ryan Quint Senior Manager, BPS Security and Grid Transformation
Darrel Richardson Principal Tech Advisor
Rachel Rieder Data Analyst
Ed Ruck Senior Engineer
Janet Sena Senior Vice President, Policy and External Affairs
Sandy Shiflett Senior Program Specialist
John Paul Skeath Engineer II
Lee Thaubald Technical Analyst
David Till Senior Manager