Embed Size (px)
Citation preview

1
2021 Review of Orange County’s Infrastructure
To enhance the infrastructure literacy of the residents of Orange County, each
infrastructure segment review, with the volunteer contributions from UCI Civil and
Environmental Engineering (CEE) Affiliates and the CSUF Civil and Environmental
Engineering Department, has been condensed with hyperlinks to further educational
sources of information.
Individual members of Orange County Business Council’s
Infrastructure Committee voluntarily contributed to the review
and development of this report. The report reflects their views
and may not necessarily reflect the views of the organization.

2
October 26, 2021
Table of Contents Preamble ……………………………………………….. Page 3
Message from the OCBC, and the Departments of Civil and Environmental Engineering at UCI and CSUF …………………………………………. Page 4 Introduction …………………………………………… Page 6 The following 13 infrastructure areas were reviewed for the residents of Orange County for them to attain a better level of infrastructure literacy. Bridges …………………………………………………. Page 10 Ground Transportation ……………………………… Page 14 John Wayne Airport …………………………………… Page 19 Cable Communications ………………………………. Page 24 Electrical ………………………………………………... Page 27 Levees …………………………………………………. Page 33 Natural Gas …………………………………………… Page 39 Oil ……………………………………………………… Page 44 School District Facilities ……………………………... Page 49 Solid Waste & Recycling ……………………………… Page 53 Surface Water Quality ………………………………… Page 59 Wastewater ……………………………………………. Page 64 Water Supply …………………………………………... Page 69 Methodology: 2021 Review of Orange County’s Infrastructure ………………………... Page 74 Roster: 2021 Review of Orange County’s Infrastructure. Page 75
3
Preamble:
Historically, every four to five years, the UCI Civil and Environmental Engineering
(CEE) Affiliates and the local Chapter of ASCE have sponsored volunteer efforts to
update the ASCE Regional Orange County Infrastructure Report Card with grades
for the various segments.
The last ASCE Infrastructure Report Card for Orange County was in 2016. The
most recent California ASCE Infrastructure Report Card for California was in
2019. In the past, the ASCE has “rolled” Regional Report Cards into State Report
Cards and then into a National Report Card. Going forward, ASCE will not be
supporting Regional Report Cards, only State and National Report Cards.
The ASCE Region 9 (California) is in full concurrence with the preparation of a
local Review by an independent entity affiliated with the OCBC, UCI, and CSUF.
ASCE Region 9 has been kept abreast of the progress of the Review and the final
Review will be shared with them.
With the economy recovering in 2021 from the impact of the COVID-19 pandemic,
the members of the UCI Civil and Environmental Engineering (CEE) Affiliates,
the CSUF Civil and Environmental Engineering Department, and the Orange
County Business Council (OCBC), were supportive of a “Review”, not a “Report
Card with grades”, of the Orange County Infrastructure Segments to educate and
inform Orange County leadership and the greater community, as well as foster
stronger connections between local engineering businesses with the OCBC, UCI,
and CSUF.
The intent is to present the Review in a PDF format with easy access to hyperlinks
and keyword searching (CTRL+F in a PDF). The Review of the 13 infrastructure
segments of Orange County shall be circulated via social media and shared as an
educational and outreach document for the 3 million residents of Orange County,
City Councils, Public Agencies, Schools, and member companies of the OCBC.
Sponsors of the 2021 “Review”:
The Sponsoring entities behind this voluntary Infrastructure Review effort are:
• UCI Civil and Environmental Engineering (CEE) Affiliates
• CSUF Civil and Environmental Engineering Department
• Orange County Business Council (OCBC) and the Infrastructure
Committee

4
Message from the Departments of Civil and
Environmental Engineering at UCI and CSUF, and the
OCBC
Dear Friends:
Much of the success of Orange County can be attributed to its infrastructure because
of extensive planning, preparation, and execution. The members of the UCI Civil
and Environmental Engineering (CEE) Affiliates, and the CSUF Civil and
Environmental Engineering Department, representing virtually every
infrastructure segment, have supported a 2021 review of the 13 Infrastructure
segments serving the 3 million residents of O.C. Members of Orange County
Business Council (OCBC), including members of OCBC's Infrastructure
Committee, also provided information and contributed to the review of this
document.
The purpose of the Review is to help the community become more infrastructure
literate by informing and educating via “stories” and sharing in a layman’s
explanation, the infrastructure conditions that are providing a strong foundation for
the growth and prosperity of the County. Extensive use of Hyperlinks has been
implemented to provide the readers with further detailed information about the
infrastructure segments. Several “Virtual Tours” have been linked to provide the
readers with an opportunity to further their infrastructure literacy via virtual tour on
various segments.
The Review is presented in a PDF format, with easy access to the Hyperlinks and
keyword searching, and circulated via Social Media and shared, as an educational
and outreach document, with City Councils, Agencies, Schools, all the member
companies of the OCBC, and all the residents of O.C.
As an added benefit to the reader, each Segment of the Infrastructure is a stand-alone
read on thirteen segments of our infrastructure. The readers may not be interested in
the entire spectrum of our infrastructure but can selectively pick and choose hot
topics trending on current news or social media coverage.
The needs of our society are most likely going to remain a constant for reliable,
efficient, and well-maintained infrastructure such as uninterruptable electricity,

5
clean and safe water, advanced telecommunications, manufactured derivatives of
crude oil, and everything else that’s part of our daily lifestyles and economies.
The following 13 infrastructure areas were reviewed for the residents of Orange
County for them to attain a better level of infrastructure literacy.
• Bridges
• Ground Transportation
• John Wayne Airport
• Cable Communications
• Electrical
• Levees
• Natural Gas
• Oil
• School District Facilities
• Solid Waste & Recycling
• Surface Water Quality
• Wastewater
• Water Supply
UCI and CSUF Students participated in the data collection that enhanced their
industry connections and formulated relationships with some of the leaders within
the infrastructure areas. Students learned about the review methods and the
challenges that have been overcome and the obstacles that need to be conquered in
implementing, planning, and execution to complete projects for the continued
growth, maintenance, and expansion of some of the best infrastructure in California,
for the residents of Orange County.
The Review of the Orange County Infrastructure is designed to engage Orange
County’s community leaders and the citizenry at large for better infrastructure
literacy in our county’s infrastructure as Orange County stands poised on the brink
of tremendous growth.
Ronald Stein, P.E.
Executive Chairman of the 2021 Orange County Infrastructure Review Project
6
Introduction:
Orange County, in some respects, is a microcosm of our nation. As such, our
infrastructure is beginning to show its age, especially in the northern and central
portions of the County. Additionally, Orange County is still recovering from the
COVID-19 pandemic recession and, therefore, needs to plan all its infrastructure
investments very carefully. Six years ago, through the efforts of the UC Irvine CEE
Affiliates and ASCE, Orange County became the first County in California to release
its third comprehensive Infrastructure Report Card.
A lot has happened since 2016, and this year we are grateful for the opportunity to
be able to provide you with an OCBC, UCI and CSUF sponsored Review of 13
infrastructure segments. The Review is not a Report Card, but an educational and
outreach document about the Orange County Infrastructure.
Over the next 20 years, Orange County is expecting continued growth. Orange
County is also transitioning from a suburban county to an urban county. With a
population of over 3 million people, Orange County is the third most populous
county in the state of California and the sixth most populous in the United States.
This makes it one of the most sought-after places to work and live in the world. In
the meantime, our task is to educate our public on the importance of infrastructure
maintenance, encourage our colleagues in the public sector to continue advocating
for infrastructure funding and maintenance, and to actively communicate to our
elected officials the important role that infrastructure maintenance plays in our
everyday lives.
The regional infrastructure systems that impact our County’s quality of life receive
significant funding derived from general obligation bonds. For example, the bonds
support the state water supply infrastructure projects, such as public water system
improvements, surface, and groundwater storage, drinking water protection, water
recycling and advanced water treatment technology, water supply management and
conveyance, wastewater treatment, drought relief, emergency water supplies, and
ecosystem and watershed protection and restoration.
Communities with efficient road systems, good schools, and sewers can better attract
residents and businesses. With updated water treatment plants, we can trust our tap
water is safe. When traffic flows, goods and services move to market faster and more
efficiently, lowering the cost to consumers. Modern school buildings provide a

7
secure and healthy environment where our children can concentrate on learning.
Efficient waste management programs reduce waste volume and dispose of and
contain waste effectively.
Our public works are public assets. We all have a stake in their upkeep and operation,
and we all share in the expense of construction and maintenance. Sometimes,
infrastructure is paid for by those who use it most, through tolls, utility bills, or
special taxes on gas, airline tickets, and other items. But because infrastructure
improvements affect us all by supporting our economy and providing fundamental
community services, a portion of the cost is usually borne by the public through
general tax revenues. For years, the federal government has played a large role in
collecting and distributing funds for infrastructure improvements.
Orange County is a relatively young region and enjoys the benefits of relatively new
water, sewer, and transportation systems. Yet, even comparatively new
infrastructure systems require continuous care, maintenance, and ongoing
improvement. We rely upon these systems every day and their dependability and
quality are silent, but significant contributors to our economic prosperity and quality
of life. A well-designed and maintained infrastructure anchors our economy and
lifestyles and secures the public health and well-being.
In the meantime, our task is to educate the public:
1. on the importance of infrastructure renewal,
2. encourage our colleagues in the public sector to continue advocating for
infrastructure funding, and
3. to actively communicate to our elected officials the important role that
infrastructure maintenance plays in our everyday lives.
As you read through this Review, think about being a more infrastructure literate
citizen.
Demand continuous and timely maintenance of infrastructure segments. If
transportation, water, and other infrastructure facilities are not kept in sound
condition, they cannot support the level of service they are designed to handle.
Regular maintenance prolongs use and minimizes the need for costly repairs. The
money saved can be used to fund other community priorities.
Thinking long-term about renewing the county’s infrastructure is an ambitious goal.
It cannot be achieved overnight. Furthermore, the roads, bridges, water treatment
plants, and other facilities built today must serve for decades to come.

8
Comprehensive planning and long-term investment are key to sound decisions about
infrastructure. Consider all the factors influencing infrastructure decisions. Building
a new highway has implications beyond the immediate highway corridor. For
example, concern that a new highway may displace wetlands must be balanced
against the reduction in air pollution that will result from decreased traffic
congestion.
To preserve the environment, and to use the nation’s resources most effectively, we
must balance environmental and economic goals. Land use and transportation
patterns designed to foster economic growth and personal mobility can be developed
in harmony with environmental benefits.
Solutions to urban problems such as traffic congestion and contaminated water
require new technologies and approaches. Research can help identify more efficient
designs and longer lasting, maintenance-free materials. And we can change our
behavior through recycling, telecommuting, or using mass transit, as examples to
reduce the demand on our infrastructure.
Look at the bigger picture beyond the immediate, individual benefits you gain from
infrastructure improvements, as there are broader community benefits. For example,
even though you may not use the new mass transit system, its construction will
reduce traffic congestion on local roads and increase nearby property values.
This Review offers continuing evidence that Orange County’s public works
challenges are enormous and complex and will not solve themselves. It is now up to
you, the concerned citizen, who understands the economic and environmental
benefits of a healthy infrastructure, to push for action. We have reviewed what has
happened and is happening in Orange County. Here are some steps you can take to
do your part in renewing its infrastructure:
1. Learn all you can about Orange County’s infrastructure problems and become
an Infrastructure Champion.
2. When you see a problem, find out what level of government has jurisdiction
over it. Sometimes various levels of government deal with different aspects
of the same problem.
3. Search the Internet. Agencies at all levels of government now have websites
that list laws and regulations that pertain to your problem. Your mayor and
state representatives probably have sites too, which may be your link to other
government and advocacy group resources. If you know of an interest group
that deals with the area you are interested in, visit its site.

9
4. Contact the California Department of Transportation, your city, and/or county
government and other sources to learn about plans for ensuring adequate
roads, schools, parks, and water systems.
5. Ask business groups, such as the OCBC or your Chamber of Commerce, to
examine the infrastructure in your community and its effect on local
businesses, employment, and the economy.
6. Regularly attend meetings held in your community about pressing
infrastructure problems.
7. Express your concern to public officials such as your mayor and school board.
Ask them how they plan to solve infrastructure problems.
8. Volunteer for, or organize, citizen advisory committees dealing with your
community’s infrastructure issues.
9. Support local, State and Federal officials who understand and are committed
to infrastructure renewal. Ask them to make infrastructure an election issue,
just as they would education, crime, or health care.
10. Work to help pass local bond issues to repair, replace, and expand your roads,
parks, water systems, and schools.
11. Write letters to the editor of your newspaper, your state representatives, and
members of Congress, expressing your concerns and opinions on
infrastructure.
Infrastructure is a complex network of public works, which includes roads, bridges,
airports, dams, school facilities, and utilities. The rules governing its planning,
financing, construction, and upkeep are equally complex. Whether your goal is to
shorten your daily commute, attract new business to your community, or protect the
environment for your children, gaining a better level of infrastructure literacy and an
understanding of these issues is the first step toward becoming an advocate for
infrastructure renewal in your community.

10
Bridges
Capacity In Orange County, there are a total of 1,170 bridges, which are owned and maintained by either
the California Department of Transportation (Caltrans) or local agencies. The average age of
these bridges is 42.9 years, which is within their typical design life of 50 years. Progress has been
made over the past decade to increase the percentage of Orange County bridges in good condition.
However, much more remains to be done as it relates to addressing the backlog of recommended
maintenance, repair/replacement work, and seismic retrofitting to improve the safety of bridges
that have exceeded their design life.
Condition
The Federal Highway Administration (FHWA) National Bridge Inventory collects data on the
condition of bridges and classifies them as being in “good”, “fair”, or “poor” condition. Bridge
condition is determined based on the lowest condition rating assigned to various components of a
bridge, including its deck, superstructure, and substructure. All California bridges in the
nationwide inventory are inspected every two years per FHWA guidelines and criteria. The
inspections are typically performed by Caltrans bridge engineers.

11
In California, 12,224 of 25,737 total bridges — or 47.5 percent of the total bridge inventory in the
state —are in good condition. 12,020 bridges — or 46.7 percent — are in fair condition, and the
remaining 1,493 bridges — or 5.8 percent — are in poor condition. The 46.7 percent of bridges in
the state that are in fair condition require maintenance to ensure they do not slip down to the “poor”
category.
In Orange County, 582 of 1,170 total bridges — or 49.7 percent of the total bridge inventory in
the state —are in good condition. 556 bridges — or 47.5 percent — are in fair condition, and the
remaining 32 bridges — or 2.7 percent — are in poor condition. The 47.5 percent of bridges in
Orange County that are in fair condition require maintenance to ensure they do not slip down to
the “poor” category.
Funding Funding for bridge improvements in California is done through a mix of federal, state, and local
sources. Federal revenue is provided through the Federal Highway Bridge Program (FHBP).
During Fiscal Year (FY) 2016, nearly $4.3 billion in federal funding was programmed to
California bridges from the FHBP. State revenue is collected through transportation-related user
fees.
In 2017, the California State Legislature took an important step to provide additional revenue to
the transportation system. They passed The Road and Repair Accountability Act (SB 1), which
is slated to provide $4 billion for bridge projects on the State Highway System over the next 10
years. The SB 1 transportation package is funded by increases in excise taxes on fuel and
surcharges on vehicle registration fees. State and local agencies have already applied for $1.8
billion in SB 1 funds to bridge rehabilitation, replacement, and maintenance projects.
Caltrans has already utilized $33.5 million in SB 1 funds to bridge and culvert rehabilitation,
replacement, and maintenance projects in Orange County.
Future need SB 1 provides much-needed funding for bridges owned at both the state and local level, especially
jurisdictions that have limited resources. These funds ensure bridges that were at risk of being
closed will instead be repaired or replaced. Localities may still need to raise their own revenues to
further close the bridge funding gap. Regardless of state funding, the federal government must also
be a part of the solution as well by increasing the revenue it collects and distributes to the states.
According to the American Road & Transportation Builders Association (ARTBA), nearly
4,400 bridges have been identified as needing repair in California and it is estimated that these
repairs will cost about $12.2 billion.
Operation and Maintenance One cannot overstate the importance of proper maintenance to extend the life of a bridge. Bridges
are subjected to repeated truck loads, debris, severe weather conditions, and in the case of bridges
in marine environments, have elements such as foundations and columns that are exposed to
corrosive seawater. The joints, deck and elements that are near or under water are most vulnerable
to wear and tear and require periodic maintenance.

12
In the FY 2018 State Budget, $131 million was allocated to bridge major maintenance and in
the 2020 Caltrans State Highway Operation and Protection Program (SHOPP), $ 2.3 billion was
allocated to bridge major maintenance for FY 2021 to FY 2024. The ongoing annual need for
bridge maintenance alone is estimated to be about $200 million. Any shortfall in funding for
maintenance will mean that the backlog of bridges requiring maintenance, and potentially, the
number of bridges falling into the “poor” condition category, may grow. Making maintenance a
priority represents a better way to make use of the scarce amount of transportation funds available.
According to the Legislative Analyst’s Office (LAO), every dollar spent on maintenance can
defer between $4 and $12 of cost needed for major rehabilitation.
State bridges are adequately operated and maintained but some local agencies lack the funding to
properly maintain their bridges. In some cases, work recommendations from bridge inspectors are
never implemented because of funding shortfalls. The failure to address such recommendations
can lead to possible advanced sectional loss, which may substantially degrade bridge capacity.
Proper bridge maintenance is required for a bridge to reach its expected lifespan.
Aging bridges are a growing concern. Many bridges in service today were designed for a 50-year
lifespan. As reported by the American Society of Civil Engineers in their 2019 Infrastructure
Report Card for California, over 50 percent of California bridges exceed 50 years in age and 13
percent are over 75 years old. Preventive maintenance can extend the lifespan of a bridge, but most
of the older bridges – particularly those that are in the “poor condition” category – will need major
rehabilitation or reconstruction. Whether a bridge can be rehabilitated or reconstructed is heavily
dependent on the availability of funding. In the meantime, older bridges may require more frequent
inspection and monitoring to ensure they remain safe for the public travel. Increasing shortfalls in
funding resulting in deferring badly needed repairs will likely lead to more of California’s aging
bridges falling into “poor” condition.
Public Safety Public safety is of paramount concern to all government agencies. In the aftermath of the 1989
Loma Prieta earthquake and 1994 Northridge earthquake, major strides have been taken to
seismically retrofit older bridges that were vulnerable. However, there are still bridges requiring
seismic retrofit. As of June 30, 2017, there are 241 locally owned bridges in the state of California
that have been deemed eligible for funding from the Local Bridge Seismic Retrofit Account
(LBSRA), but for which funding has not been programmed.
Vehicle heights and weights have increased over the years. Barriers on older bridges in service
today were not designed to protect today’s vehicles. Thus, barrier rail upgrade to current standards
is also a public safety concern. However, limited funding has delayed implementation of needed
upgrades.
Resilience In addition to earthquakes, California faces many different types of natural and man-made
disasters, including fires, tsunamis, droughts, and landslides. Structural resiliency is the ability to
withstand unexpected loads brought about by climate change or natural disasters.
13
Change in climate conditions has produced heavier rains, stronger storms, and higher winds. This
is the new normal. Old bridges were not designed for these loads. As previously noted, 54 percent
of more than 25,737 California bridges are now 50 years old or older, making them vulnerable
to such load increases. Bridges over waterways are most vulnerable. There are over 17,000 bridges
over waterways in California. Risks are exacerbated in fire-ravaged areas that are vulnerable to
landslides. A consistent strategy on resiliency is needed for California bridges. New guidelines
need to be developed to address the risk and safety issues associated with climate change.
Prioritizing and strengthening vulnerable bridges will require major funding.
Innovation
Innovations in bridge design and materials have potential to increase the durability of a bridge or
prolong its lifespan. Advances in material have made concrete stronger or more durable to
withstand weather conditions. High performance steel has greater strengths, ductility, and fracture
resistance. Electrochemical Chloride Extraction (ECE) treatment, by applying an electric field
at the deck, prolongs the life of historic bridges.
Advances in Accelerated Bridge Construction (ABC) when properly implemented, have made
construction in very challenging conditions possible. Innovative construction methods can also be
used to overcome issues relating to limited space, environmental restrictions, or public safety in
high traffic areas. Innovation and new technology come with a price. Specialty products, services
and construction are high ticket items and can escalate construction costs. While initial costs may
appear to be prohibitive, the intangible benefits such as increased safety, reduced environmental
and traffic impacts, and faster construction, can more than justify the added costs. Additionally,
research and testing of new products need funding to facilitate agency and industry acceptance.

14
Ground Transportation
Capacity Orange County consists of 34 cities and the unincorporated areas; it has approximately 1,886
freeway lane-miles which Caltrans is responsible for operating and maintaining, 1,170 bridges,
thousands of lane-miles of local arterial roadways, three commuter rail (Metrolink) routes with
11 stations, Amtrak services connecting to Los Angeles and San Diego, a freight network run by
Burlington-Northern Santa Fe Railroad (BNSF) along with freight service by the Union Pacific
Railroad, and 58 bus routes by Orange County Transportation Authority (OCTA) with nearly
5,500 bus stops. The current infrastructure serves approximately 3 million Orange County
residents, with approximately 700,000 people commuting into Orange County from
surrounding San Diego, Los Angeles, Riverside, and San Bernardino counties daily. As
infrastructure ages, and with the population of Orange County continuing to grow, the local
transportation infrastructure must be maintained in order to accommodate population projections
and to avoid current pervasive issues that result in Orange County residents spending an average
of 18.5 hours sitting in traffic on Orange County highways. The new challenge is to increase
roadway and highway capacity, without impacting the footprint of existing roads.
The definition of “capacity” of roadway systems is undergoing modifications where the measure
is not how many vehicles can traverse a given roadway segment but how many people can move
through the system. With the passage of Senate Bill 743, Vehicle Miles Traveled (VMT) replaced
Level of Service (LOS) as the metric for measuring traffic related impacts and greenhouse gas

15
analysis. Capacity enhancements may be achieved without adding new lanes but by using
Intelligent Transportation Systems (ITS) and/or Travel Demand Management (TDM) such as
optimizing signal timings, demand pricing (tolls), preferential facilities for High Occupancy
Vehicles (HOV) and buses, as well as new and emerging technologies such as autonomous
vehicles, Vehicle to Vehicle (V2V) communications and Vehicle to Infrastructure (V2I)
communications.
Condition
The conditions of local roadways and arterials controlled by traffic signals and intersection stop
control were ascertained from the 2020 California Local Streets and Roads Needs Assessment.
Pavement conditions are quantitatively graded on a scale of 0 to 100 using the Pavement Condition
Index or PCI. Orange County’s average score was 79. The study also shows that Orange County’s
pavement needs (calculated based on existing conditions, appropriate treatment to be applied,
performance models, and funding available) in the next 10 years will cost upwards of $2.6 billion
(see 2 Figures below). Despite the high price tag, Orange County is one of only two counties
statewide projected to have greater than 80 percent of local streets and roads pavement needs met
over the next ten years. For more information on State Highway System (SHS) asset conditions,
refer to Caltrans’ State Highway System Management Plan (SHSMP).

16
Funding OC Go (formerly Measure M) is Orange County's half-cent sales tax dedicated to funding local
transportation improvements. Wider freeways, well-maintained streets, synchronized traffic
signals and transit programs that improve travel connections are all part of OC Go. Local OC Go
sales tax revenue projections dropped substantially from previous projections due to the impact of
the COVID-19 pandemic but have since nearly returned to pre-pandemic levels. Already low bus
and transit ridership passenger fares present an additional revenue source loss, as nationwide
declines in ridership over the last decade or so, which were accelerated due to the COVID-19
pandemic. Transit ridership has since started to rise as schools return to in-person instruction and
the overall economy continues to open up.
.
OC Transit Vision, developed in 2018, will require modification as Orange County moves into
the future to address the issues behind the long-term decline in transit ridership and emerging
trends like work-from-home.
Senate Bill 1 was signed into law in 2017. SB 1 funding sources include increases in fuel (gas and
diesel) excise taxes, commercial vehicle weight fees, vehicle license fees, $100 annual registration
fee for zero emission vehicles model year 2020 and later. SB 1 does not sunset, and the law
includes an annual inflation adjustment. State and local transportation programs were either
augmented or created by SB 1. Transportation programs augmented include: State Highway
Operation and Protection Program (SHOPP) and the State Transportation Improvement Program
(STIP), which is divided between regions and Caltrans at a 75 percent to 25 percent ratio
Figure 1: Pavement Needs by County (Source: 2020 California Local Streets and Roads Needs Assessment Study)

17
respectively, and the Active Transportation Program (ATP). Newly created programs include:
Local Streets and Roads Program (LSRP) available only to cities, Local Partnership Program
(LPP) only available to self-help counties, Trade Corridor Enhancement Program (TCEP), and
Solutions for Congested Corridor Program (SCCP).
Additional funding was provided by the federal government through the Federal Coronavirus
Response and Relief Supplemental Appropriations Act (CRRSAA) of 2021, apportioning a total
of $911.8 million to California. The Act allows states to cover revenue declines during the
pandemic. California experienced about $1.5 billion in revenue losses due to the pandemic.
Over the long run, the purchasing power of the gas tax will decline as vehicles become more fuel
efficient and increasingly do not use gasoline at all. In addition, potential increases in work-from-
home may further reduce fuel consumption.
As the passage of Senate Bill 743 indicates, there is a push towards more sustainable transportation
options throughout the state of California and Orange County. The Active Transportation
Program (ATP) has become an increasingly popular and competitive funding source, as it
encourages increased use of active modes of transportation, such as walking and biking, rather
than projects that promote more vehicular use. The ATP Cycle 5 Program (2021) revealed over
$2.2B in funding requests across the state of California. Understanding the need to active
transportation components to move projects forward and make them more appealing for funding
will be a critical consideration for Orange County municipalities seeking funding for local projects.
Future Need
The future needs of Orange County residents continue to be accessible transportation
infrastructure, sustainable transportation means, and more reliable transportation funding sources.
Prior to the events of 2020, 77 percent of drivers (in 2019) reported commuting to work alone,
with only 9 percent carpooling, and only about 2 percent utilizing public transportation. Given that
most Orange County residents and workers commute by driving, an effective network of highways
is critical to mobility. Unfortunately, as the number of people who live in and commute to Orange
County continues to grow, average highway speeds are decreasing. This means commuters are
spending more time in traffic, away from home and work.
Conversely, as Orange County began to feel the effects of the coronavirus pandemic that hit in
March of 2020, a new precedent was set for working from home for many workers. This resulted
in less frequent commuting, and more frequent working from home. It is unclear how likely this
trend will continue into the future. Although increased working from home reduces the congestion
that has historically plagued Orange County freeways such as Interstate 405, State Route 55, and
State Route 57, it also impacts gas tax revenue collected statewide to fund road maintenance
projects.
Resilience The resiliency of a piece of infrastructure is measured by assessing its ability to withstand damage
or disruption, and whether it can readily, and cost effectively be restored, as well as considering
infrastructure interdependence and the presence of alternate routes. Orange County scores well on
resiliency overall due to its vast network of local roadways and conventional highways with

18
parallel freeway routes. However, the extreme southern portion of the county and the coastal areas
are more sensitive to disruptions.
Innovation Innovative projects continue to be at the forefront of conversations among Orange County
municipalities and transportation agencies. A critical goal for OCTA is expanding connectivity
within this sprawling county. The OC Streetcar represents an innovative step towards connecting
existing rail and bus routes in Orange County and beyond, including the Santa Ana Regional
Transportation Center that serves Metrolink and Amtrak travelers. Its 4.15-mile route will promote
sustainable local travel into and out of the heart of Santa Ana, a fast-growing economic hub that
in turn generates significant foot traffic with its local businesses, bars, restaurants, and shopping
opportunities.
Along the lines of expanding system choices are projects such as the Oso Parkway Bridge Project
and the Los Patrones Parkway Extension Project. The Transportation Corridor Agencies
(TCA) and Orange County Public Works have replaced a portion of Oso Parkway with a new
bridge structure to provide motorists with a direct connection between Los Patrones Parkway (a
new road connecting with Rancho Mission Viejo) and State Route 241. By increasing access to
the toll roads, projects such as these connect south Orange County to the more urban areas of OC,
while also providing TCA with opportunities to generate funds by charging toll users a small fee
to avoid the congestion on more crowded highways.
Improving system performance is another means of innovating existing infrastructure in Orange
County, and OCTA’s I-405 Improvement Project is a great example of this. In Orange County,
there are 1,170 bridges. The average age of these bridges is 42.9 years. OCTA, in cooperation with
Caltrans, is widening the San Diego Freeway (I-405) between SR-73 and I-605. This $2 billion
project will improve 16 miles of some of the most congested segments of the I-405 including 18
bridge overcrossings replacements over the I-405, rehabilitating and/or reconstructing on-and-
off-ramps, rehabilitating pavement, and constructing new express lanes which will in turn pay
for a major portion of the improvements.
Caltrans also has a number of innovative projects in Orange County including the I-405 Multi-
Asset Project from I-5 to Harbor Boulevard, which is proposed to extend life expectancy of
pavement, improve safety and efficiency for all modes of travelers and maintenance crews,
enhance traffic operation, manage congestion, and provide ability to collect, analyze, and utilize
data for systems performance along the I-405 corridor. Caltrans’ Integrated Corridor Management
(ICM) project in Anaheim will update the freeway infrastructure for effective management of
traffic congestion during planned and unplanned special events, manage availability of excess
capacity along parallel arterials, and provide transit services within the corridors through system
integration and collaboration with partner agencies. Caltrans also conducted a countywide study
on a managed lanes network in Orange County and has a managed lanes project planned along I-
5.

19
John Wayne Airport
Overview John Wayne Airport (JWA) is owned and operated by the County of Orange and is the second
busiest airport in the Greater Los Angeles Area, serving more than 10.6 million passengers
annually. The airport is home to nearly 500 general aviation aircraft and is served by eleven
commercial passenger airlines and two cargo airlines. There are approximately 300,000
commercial and general aviation operations each year, placing JWA in the top 30 busiest airports
in the country.
With two runways, three terminals, four parking garages, a central utility plant, and numerous
roadways, aprons, taxiways, and support facilities housed on over 500 acres, JWA maintains over
$1B worth of facilities and assets. The Thomas F. Riley Terminals (A, B, & C) are 730,505
square feet in total, with 20 commercial passenger gates and two smaller commuter passenger
gates. The Riley Terminal is also home to numerous restaurants, shops, and other services.
JWA’s service area includes more than three million people within the 34 cities and unincorporated
areas of Orange County. The airport has been a vital part of the Orange County community for
nearly 100 years and prides itself on delivering a superior guest experience.
20
Click here for a short video on JWA from its inception as Orange County Airport to today. You
can also view JWA’s 2020 Annual Report to learn about the airport’s operations and
accomplishments during one of the most challenging years in aviation history.
Regulatory Structure JWA falls under the authority of multiple federal, state, and regional governmental agencies
including, but not limited to, the Federal Aviation Administration (FAA), the Transportation
Security Administration (TSA), U.S. Customs and Border Protection (CBP), the Caltrans Division
of Aeronautics, the South Coast Air Quality Management District (SCAQMD), and the Regional
Water Quality Control Board (RWQCB). The airport is governed by a wide variety of local, state,
and federal laws and regulations under the purview of these agencies and others, directly impacting
how JWA’s infrastructure is designed and maintained.
Additionally, JWA is one of the most highly regulated airports in the United States due to the noise
and access regulations that apply to both commercial and general aviation operations. The
landmark 1985 Settlement Agreement formalized the nature and extent of facility and operational
improvements that could be implemented at JWA and has since been amended twice. The
Settlement Agreement established quarterly noise limits at ten defined noise monitoring locations,
created an annual passenger cap, defined certain noise-based classes of aircraft operations, and set
limits on the number of operations.
Funding and Future Needs JWA is a department of the County of Orange and uses an enterprise fund to account for its
operations. All costs to construct, operate, and maintain the airport are generated by the airport
and through various grant programs. There are no city, county, or state general funds used. JWA’s
budget is directly linked to the number of aircraft operations and passengers that travel through
the airport.
The airport’s sources of revenue include Airline Revenue, Non-Airline Revenue, Passenger
Facility Charges (PFC), Federal Grants, and General Aviation. Airline Revenue consists of
terminal rents, landing fees, and other items that account for roughly 41 percent of total operating
revenue. Non-Airline Revenues account for approximately 54 percent of total operating revenue
and include sources such as rents or fees on automobile parking, car rental, food & beverage, and
other concessions, ground transportation, and transportation network companies. PFCs are fees
imposed on enplaned passengers by airports to generate revenue for projects that increase capacity,
enhance competition among air carriers, improve safety and security, or mitigate noise impacts. In
2000, the Aviation Investment and Reform Act (“AIR-21”) increased the maximum PFC airport
sponsors could collect to $4.50 per enplaning passenger. The PFC cap has not been increased since
then. JWA’s average PFC collection has been about $19M annually, which pays for debt service
on bonds issued to fund FAA-approved PFC projects. JWA is also eligible to receive
approximately $2M annually in FAA entitlement grants to fund eligible Airport Improvement
Program (AIP) projects. AIP funds originate from the Airport and Airway Trust fund, which
draws support from user fees, fuel taxes, and other revenue sources. The General Aviation segment
contributes the remaining 5 percent to JWA’s operating revenues.

21
According to a recent Airport Infrastructure Needs Study conducted by Airports Council
International, America’s airports have a backlog of $115B in planned and much-needed
infrastructure projects. To continue responding to the changing needs of the traveling public and
the aviation industry, JWA anticipates spending more than $250M over the next five years to
upgrade and modernize facilities.
The following sections describe some of the airport’s infrastructure, factors that drive needed
upgrades, and how the team maintains JWA’s complex facility and assets.
Safety and Security Safety and security at airports mean protecting the traveling public, the facility, and critical
systems from disruption or outside threats, as well as maintaining structurally sound facilities.
Safety and security infrastructure encompasses everything from physical barricades, fences, and
hard infrastructure to high technology security cameras and systems.
To enhance public safety and ensure emergency operational use of the airport during and after a
major disaster, critical facilities and equipment at the airport have been engineered and retrofitted
to meet Seismic Risk Category IV (essential facility) design requirements. Standardizing a higher
category for design improves structural resiliency in the face of natural disasters, allowing for
continued use and increased levels of safety for our employees and the public.
The airfield is a critical piece of the airport safety infrastructure. JWA maintains continual FAA
operating certification to ensure compliance with operational and safety standards. The
combination of our airfield pavement management system, daily airfield inspections, and
continuous airfield maintenance activities support the uninterrupted certification at the airport.
Maintaining this high level of safety and incorporating changes and innovations required by the
FAA requires continuous capital improvement of pavement, lighting, signage, communication,
and emergency equipment.
An example of a typical airport infrastructure project is the recently completed airfield lighting
and signage improvements project, in part using LED technology. Converting to LED technology
reduces energy usage and maintenance, increases service life, and improves visibility. This $8M
project included various airfield upgrades to meet FAA requirements and was funded primarily
through a federal AIP grant.
Maintenance
JWA’s facilities have miles of plumbing and electrical infrastructure, thousands of doors, and
hundreds of HVAC units. Breaking it down even further, there are over 80 restrooms, one-half
million square feet of floors, and millions of square feet of pavement.
The role of JWA’s Maintenance Division is to ensure all facilities and assets operate in a safe,
clean, efficient, and cost-effective manner. In doing so, facilities and assets run cleaner, last longer,
and have a lower life cycle cost before needing major repairs and replacement. Many assets have
a life expectancy of 10 to 50 years. As equipment gets older, the cost to maintain typically
increases. For reference, Terminals A and B opened in 1990 (31 years ago) and Terminal C in
2011 (10 years ago).

22
As an industry rule of thumb, maintenance investment should be between one percent and six
percent of the total facility value, increasing from the low end in the facility’s younger years to the
higher end as the facility ages. With $1B in assets, this equates to $10M per year in the early years
and $60M per year in the later years for a facility such as JWA.
Deferred maintenance, or maintenance that is delayed due to available resources, results in
unexpected downtime, emergencies, and a much greater cost to replace equipment that was not
properly maintained.
Changing Needs The traveling public wants efficiency and convenience in arriving, departing, and navigating the
airport environment. The airport accommodates this need through infrastructure modifications in
parking, roadways, and public transportation. These efficiency improvements have the added
benefit of reducing air emissions caused by traffic congestion. Airports have also begun to
transform from providing vast parking lots to facilitating mass transit and ease of connection with
transportation network companies such as Uber and Lyft. Planning and building for these changes
are ongoing.
These days, government agencies and the public call for cleaner and quieter aircraft.
Advancements in aviation technology are also continuously underway. The airlines are responding
with new, cleaner, and quieter aircraft. The airport evaluates future proposed aircraft to program
projects that accommodate for changes in design, given the limitations and restrictions at JWA.
This can result in the needed modification of passenger gates, taxiways, and vehicle service roads
to maintain the proper safety clearances and zones. For example, the airport is currently planning
to reconstruct and repave its taxiways and adjust turning radiuses to support changes in aviation
design.
Resiliency and Sustainability As the population grows, so do the stressors on our natural resources, particularly in highly
urbanized areas. The airport is constantly evaluating its need for resources and impacts on the
community. JWA plans and implements improvements to ensure resilient infrastructure that is
sustainable into the future.
JWA’s energy is supplied by a combination of Southern California Edison and the airport’s Central
Utility Plant (CUP), which is a cogeneration plant consisting of four natural gas engines. The CUP
is the primary power supply for JWA Terminals and the airfield, and supplies cooling for the
airport through various systems. To improve resiliency and future sustainability, the airport is
engaging in an upgrade project that includes an energy storage system using large batteries,
improved metering and power management systems, and water conservation equipment.
Orange County’s South Coast Air Basin is listed by the EPA as an extreme air quality non-
attainment area. This means that there is increasing urgency for public entities to reduce air
emissions through changing paradigms and improved infrastructure. At the airport, this means
providing cleaner electricity to replace hydrocarbon-fueled engines and equipment, providing
charging stations for electric vehicles, replacing hydrocarbon-fueled shuttle buses with zero-

23
emission buses, developing the corresponding bus charging grid, and implementing electrical
upgrades and infrastructure projects that increase efficiency and reduce electricity demand.
In an urbanized area such as Orange County, pollutants make their way into stormwater runoff and
ultimately channel to our beautiful beaches and bays. Public entities are called on to be ever more
vigilant to reduce urban and transportation-related pollutants in stormwater runoff. Infrastructure
projects to accomplish this can require capturing and treating millions of gallons of stormwater
and have been estimated at upwards of $35M to implement. The airport is currently evaluating
infrastructure projects to support our region’s clean water goals.

24
Cable Communications
Capacity
Orange County receives its cable and internet from major providers including Cox
Communications, AT&T, Google Fiber, Verizon, and Charter Communications aka
Spectrum.
According to the California Cable and Telecommunications Association (CCTA), “cable’s
broadband service is available to 98 percent of all California households, which encompass 6.25
million California cable subscribers, 3.7 million digital voice customers, 7.9 million high-speed
data customers.” Currently top residential broadband speeds reach up to 2 GBPS. Orange County
providers provide these services to more than 3 million residents, small and regional businesses,
including health care providers, K−12 and higher education, financial institutions, and federal,
state, and local government organizations.

25
Collectively, the major providers in the county maintain and operate thousands of network miles
delivering video, phone, and high-speed internet service to homes and businesses. Spectrum alone
serves 268 communities across the entire state of California and twenty of Orange County’s cities.
From 2018-2020, Spectrum extended its network to reach an additional 2.5 million homes and
small businesses, about a third in rural areas. In 2020 alone, Spectrum extended its network to
reach an additional 145,000 home and small businesses in California.
Condition
California is one of the most connected states in the country and is home to technology companies
that have reshaped the way people around the world communicate with one another. Statewide
more than $40 billion has been invested in infrastructure and network since 1996 according to the
California Cable and Telecommunications Association (CCTA). The industry also maintains more
than 1.9 million Wi-Fi access points statewide, employs nearly 230,000 people, and is responsible
for more than $50 billion in economic revenue in the state.
According to SNL Kagan, 89 percent of households with a broadband connection rely on Wi-Fi.
The maintenance of networks by all providers is more essential than ever for telecommuting,
distance learning, business operations, smart home devices, cloud computing, telemedicine,
wireless communications, social media, and entertainment.
Economic Impact Each year, the State of California and its local governments collects millions in tax revenues and
fees generated by the operations and construction activities of telecommunications companies its
employees, subcontractors, and all related indirect and induced employees. These tax revenues go
to the State, counties, and cities budgets within California.
Telecommunications providers contribute to the generation of thousands of direct, indirect, and
induced jobs per year in California with a total income (including benefits) to these workers equals
hundreds of millions of dollars. Further, the total economic impact from operations, construction,
and capital expenditures in California, including indirect and induced impacts, is in the billions of
dollars annually.
Through Access from the AT&T program, AT&T offers internet access for $10 a month or less to
qualifying limited income households who participate in the Supplemental Nutrition Assistance
Program (SNAP) or receive Supplemental Security Income (SSI) benefits in California.
Bridging the Digital Divide The major telecommunications providers all offer broadband adoption programs for Orange
County residents.
Cox’s Connect2Compete program offers low-cost high-speed internet and in-home WIFI for
$9.95 a month for K-12 families that receive food or housing government subsidies. Similarly,
Charter’s “Spectrum Internet Assist” program is a low-cost, high speed broadband services that
provides qualifying households with internet service for $17.99 per month. When schools switched
to online learning due to the Covid-19 pandemic, Cox provided up to four months of free internet

26
service through Connect2Compete for low-income families that needed an internet connection at
home for their children’s education.
In 2020, Cox spearheaded a “Meet the Need” technology drive in partnership with Orange
County Department of Education (OCDE) and Orange County Business Council (OCBC) to
collect technology for low-income students statewide.

27
Electrical
Capacity Serving the ongoing and future electric energy needs of Orange County involves not only
improving the Electric Power Infrastructure within Orange County, but also improving the Electric
Power Infrastructure external to Orange County. Both SCE and SDG&E have made significant
strides in planning and implementing improvements. In addition to addressing aging existing
infrastructure, SCE and SDG&E plan new infrastructure needed for growing needs, and plan
infrastructure improvements such as the new Smart Meter technology. All these efforts work to
the benefit of Orange County, along with other areas.
Resulting from the Golden State decommissioning natural gas and nuclear generated electricity
for decades that have provided continuous uninterruptable reliable electricity in the past, California
imported more electricity than any other state– between 2013 and 2017 at 32 percent from the
Northwest and Southwest. California electrical grid regulators and policymakers continue relying
on other states to generate enough power to meet the future growing demands of California.
The range of Electric Power Infrastructure issues involving Orange County is challenging. There
is no doubt that there is an extensive network of aging Electric Power Infrastructure. At the same
time, SCE and SDG&E, which largely serve the electric requirements of Orange County, are seen
to be aware of the issues.

28
While California pursues 100 percent intermittent electricity from wind and solar renewables
by 2045 (SB100), it continues to be unable to produce enough in-state electricity to meet the states
demands. This problem with state electrical demands, and the need to continually import electricity
from other nearby states, does not conform with the California 2017 Climate Change Scoping Plan
that requires accountability for and the avoidance of GHG emission displacement. This
“displacement” is called “leakage.” This leakage of environmentally damaging pollution and
emissions continues to be relocated from California to other countries and states, shifting the GHG
emissions contributing to overall global warming impacts.
California’s Global Warming Solutions Act of 2006, commonly known as Assembly Bill 32, or
AB 32, allows for a state-wide program for reducing greenhouse gas emissions to 40 percent
below 1990 levels by 2030 from all sources initiated CO2 “leakage” from energy intensive
manufacturing industries in California to other locations with significantly less environmental
control than California.
Condition California has the least reliable electrical power system in the nation. Between 2008 and
2017, California was the leading U.S. state for power outages with almost 4,297 blackouts in
the ten-year period, more than 2.5 times as many as its closest rival, Texas. Power outages have
been increasing in California.
The origin of the problem is partly California’s Senate Bill 1368, which in 2006 established the
state’s emission standards to reduce greenhouse gases from power plants. Following 2006, eleven
coal-fired power plants were closed and three were converted to biomass. Biomass is now a
significant contributor to GHG and is considered a greater polluter and cause of environmental
degradation than coal-fired power plants.
California continues its intention to transition to 60% renewable energy by 2030 and 100%
“climate-friendly energy” by 2045, as required by state law SB-100. Shutting down coal, gas and
nuclear power plants in California and increasing imported electricity from the Northwest and
Southwest.
It also means people trying to run their homes, offices, factories, hospitals and schools on
intermittent, weather-dependent, much more expensive wind and solar power will have to get used
to never knowing when or for how long their electricity will be on or off. Battery energy storage
systems for electrical grids do not have enough capacity to store electricity for home, consumer,
and business for more than minutes at a time.
Despite California’s high cost of electricity, which is already fifty percent higher than the national
average for residents, and double the national averages for commercial, electricity rates are
projected to go even higher as more closure of continuous uninterruptable electrical generating
plants are implemented. California has largely failed to replace plants coming offline by enough
renewable generation to provide continuous uninterruptable electricity for Orange County.

29
Adding to the onerous problem of affordable electricity, California is closing nuclear reactors that
have been safely generating uninterrupted carbon dioxide-free electricity for decades. In 2013,
California shutdown Southern California Edison’s San Onofre plant, which generated 2,200 MW.
It has ordered the closure of Pacific Gas & Electric’s Diablo Canyon 2,160 MG generators by
2024, which will remove that power from the grid.
Following the eleven closures after 2006, 2018 saw three natural gas-fired power plants shuttered.
The natural gas power plant retirements in 2018 were: 1) Encina at 854 MW, 2) Mandalay at
560 MW, and 3) Etiwanda at 640 MW.
Blackouts have forced the State to admit in 2020 that industrial solar panel and wind turbine farms
are falling short of meeting California electrical generation daily needs. The State has
acknowledged transitioning away from fossil fuels has left California with a gap in the reliability
of its electrical infrastructure.
In addition to the 2020 announced closure of the Natural Gas Power Plant at Redondo Beach,
The City of Los Angeles recently announced forthcoming closures of three natural gas-
powered plants at Scattergood, Haynes, and Harbor. The four upcoming closures are:
• The 1, 310 MW Natural Gas Power Plant at Redondo Beach, that was scheduled to be
shuttered in 2023.
• The 823 MW Natural Gas Power Plant at Scattergood in Playa Del Rey, that was
scheduled to be shuttered in 2024.
• The 575 MW Natural Gas Power Plant at Haynes in Long Beach, that was scheduled
to be shuttered in 2029.
• The 472 MW Natural Gas Power Plant at Wilmington, that was scheduled to be
shuttered in 2029.
In September 2020, following blackouts from a lack of generated electricity being available, State
officials threw a lifeline to four natural gas power plants along the Southern California coast,
deciding the facilities are still needed to provide reliable electricity even as State officials and
policymakers pursue reductions from natural gas contributions to the global climate change crisis.
The four plants, that were given a shuttering deferral for the time being allows them to continue
providing continuous and uninterruptable generated electricity.
Funding The utilities each have periodic General Rate Cases (GRCs) that are proceedings used to address
the costs of operating and maintaining the utility system and the allocation of those costs among
customer classes. Each large electric utility files a GRC application every three years. To the extent
that local governments and others express support for increasing funding for replacing aging
infrastructure in subsequent GRCs, progress can be made, and an acceptable level of reliability
can be maintained.
Future need Ramifications from Governor Newsom’s Executive Order from 2020 to ban the sale of gas-
powered vehicles by 2035 may be devastating to the state’s economy and environment. The State

30
wants to add more electrical charging demands onto a dysfunctional energy program that has
already shuttered one nuclear power plant and three natural gas power plants in recent years (total
of 4 in recent years), and has five more to shutter in the cross hairs – the last nuclear plant at Diablo
Canyon and four more natural gas power plants. The growth of EV’s will further add to the
electrical demands from the grid as electricity consumption may double if the world’s car fleets
are electrified.
Efforts by Southern California Gas Company are continuing to reduce carbon emissions by
switching to renewable natural gas, methane, and biogas which will reduce overall greenhouse
emissions while also keeping a blended energy profile and reduce costs on California residents.
Trends throughout the state, aimed at banning the use of natural gas hook-ups for cooking, heating,
and cooling, and washing and drying clothes, imposes a regressive energy tax on low- and middle-
income consumers. Prohibiting the direct consumption of natural gas in furnaces, stoves, clothes
dryers, and water heaters forces consumers to buy electricity, which in California is four times as
expensive as natural gas on an energy-equivalent basis.
The inability to replace the closure of continuously uninterruptable electricity from nuclear, natural
gas power plants, and hydroelectric plants with intermittent electricity from renewables of
industrial wind and solar will cause the state to increase its importing of electricity and most likely
continue to inflate the cost of electricity to residents and businesses which is already among the
most expensive in the nation.
Recent fires both in Southern California and Northern California have exposed the questionable
reliability of the electrical system. When it is hot and when customers need power most, fires are
more prevalent and electric companies are now authorized to implement Public Safety Power
Shutoff (PSPS) events, shutting down their system to prevent dangerous fires leaving many
customers without power.
While the state needs support of clean-burning or renewable energy generation projects in Orange
County for its over-reliance on intermittent electricity from wind and solar, the state is facing
increasing resistance from the Not-In-My-Backyard ((NIMBY) residents that are rejecting large
renewables in their backyard. Communities like San Bernardino the state’s largest county, has
banned the construction of large solar and wind farms of more than 1 million acres of private land.
Residents have become more vocal about not wanting their rural desert communities littered with
renewables.
Electricity demands from the grid will be increasing as California now requires that all new
homes be all-electric. It wants citizens to switch their natural gas stoves to electric, as part of their
global warming initiatives. More than 40 cities have already enacted bans to achieve a gas-free
future and the use of more electricity.
The August 2019 “common interest agreement” agreement between the California Public
Advocates Office and Sierra Club to help the California Public Utility Commission (CPUC) ban
the use of natural gas will inflict more costs onto those that can least afford more expensive utility
costs as electricity is four times more expensive as natural gas on an energy-equivalent basis.

31
This means demand for reliable, affordable electricity will rise by leaps and bounds, just as in-
state supplies are steadily reduced. The shuttered power plants are partially replaced by expensive,
intermittent, weather-dependent power, and the hope that neighboring Northwest and Southwest
States will have sufficient excess capacity to export electricity to California.
It also means people trying to run their homes, offices, factories, hospitals and schools on
intermittent, weather-dependent, much more expensive wind and solar power will have to get used
to never knowing when or for how long their electricity will be on or off. However, it may spur
sales of candles, flashlights, propane heaters, and natural gas, gasoline, and diesel generators.
Operation and Maintenance To meet the renewable electricity targets with wind and solar by 2045 has necessitated a supply
chain from foreign countries that have less stringent environmental regulations than California for
the mining of exotic mineral and metals required to support wind turbines, solar panels, and EV
battery construction. The leakage of the supply chain for renewables continues to impose
environmental degradation, humanity atrocities, and greater emissions from developing countries.
Virtual Tours are available for the Diablo Canyon Nuclear Generating Plant, a Combined
Cycle Natural Gas Turbine Power Plant. and a Coal-Fueled Power Plant Virtual Tour
Public Safety Residents relocating from the high costs of living in urban areas have created a problem for
California’s forestry maintenance guidelines. Utility services are expected to be brought to them
no matter where they live.
This expansion into once forested areas is causing challenges for utility providers who want more
customers but do not appreciate the burden minimal forest maintenance has placed on their ability
to safeguard their equipment and the public who use it. It has caused them to petition California
Public Utility Commission (CPUC) and receive the authority to shut down services where it deems
those services create a public hazard.
Today, electric utility companies up and down the state have all implemented Public Safety Power
Shutoff (PSPS) events, aka rolling blackouts, as a last line of defense against electric service
disruption and possible massive wildfires to vulnerable communities caused by utility equipment.
Resilience Work is progressing to address aging infrastructure issues, and yet there continues to be funding
issues as well as great public opposition to most any form of infrastructure improvement that
involves any environmental impact whatsoever. There is no cause for panic, nor is there reason to
rest easy. Extensive planning, engineering, and design, environmental, regulatory, and legal efforts
must continue with determination to maintain and improve the Electric Power Infrastructure
necessary to keep Orange County healthy and assist in the widespread economic recovery that is
needed.

32
Innovation The present state of the electric power infrastructure might be characterized as “average” or
“mediocre”, and at the same time events and trends toward more intermittent electricity from
renewables seem to be driving the state of the infrastructure in a negative direction with the
shuttering of nuclear and natural gas power plants, and an absence of plans to replace the shuttered
plants. California will need to increase its imports of high-priced electricity from the Northwest
and Southwest to fill the void.
Orange County’s future under the political platform toward reliance on intermittent electricity
from wind and solar renewables may see more blackouts for the foreseeable future. California’s
trouble is explained by officials who now openly admit to an over-reliance on industrial solar panel
and wind turbine farms for electricity, over the continuous uninterruptible and reliable coal, natural
gas, and nuclear power plants.

33
Levees
Background Within Orange County, approximately 84 miles of levees are part of the 380 miles of Orange
County Flood Control District’s (OCFCD) flood control system. It is a priority as efforts to
complete a study lasting a dozen plus years have been successful and the County’s aging levee
system is being maintained and improved to the best of the County’s ability with the resources
available where funding and regulatory restrictions will allow.
The fiscal impacts of climate change include increased regulatory pressure, more rigorous
maintenance, updated safety standards and higher cost estimates factor into the County’s ability to
maintain and improve its flood control system including levees. OCPW currently spends
approximately $3.2 Million annually on all flood management activities. Part of our required
activities are to recertify and accredit the levees every 10 yrs. Due to aging facilities and exceeding
the service life of the facilities (much of the OCFCD flood control systems were constructed
decades ago), more work and cost is required just to maintain the levees.
Since 2012, several remarkable events have highlighted the importance of levee infrastructure
investment. The past several years, except for 2016-17, have been the driest period since statewide

34
records began in 1896. Climatologists report that this pattern of extreme conditions (prolonged
severe drought with intermittent seasons of severe storms) is the new normal.
The flood risk in Orange County is generally with higher risk in certain watersheds more than
others due to topography and development over the decades. The key to protecting these lives and
livelihoods is our system of flood control channels (including levees), retarding basins, dams and
pump stations that convey floodwaters. All levees can fail even a well-built levee can succumb
to floodwaters.
Flood insurance can reduce the consequences of a levee failure, but unfortunately, less than one-
third of all California homeowners who should have flood insurance are covered.
Capacity and Condition Some of the older levees in Orange County were constructed by farmers to protect farms, not the
people who later took up residence behind these structures. In addition, levees generally are subject
to settlement, under seepage, and seismic activity. Levees are being designed to higher standards
than in the past. The Federal Emergency Management Agency (FEMA), acting through the
National Flood Insurance Program (NFIP), has historically played an important role in the
design capacity of levees by requiring 100-year level of protection to avoid high flood insurance
rates and building restrictions. Orange County has adopted standards for many levees that exceed
the FEMA 100-year standard.
This does not mean the 100-year flood will occur only once every 100 years, and in fact, California
has endured many such floods within the last 100 years. Originally an actuarial insurance value—
not a public safety standard—this became the de facto design event until relatively recently, highly
populated areas such as Orange County have adopted standards for many levees that exceed the
FEMA standard. DWR and other experts have even proposed a goal of 500-year level of
protection for levees with high consequences of failure, but this has not yet been approved as a
standard.
The County, U.S. Army Corps of Engineers (USACE), Federal Emergency Management Agency
(FEMA), and the State of California (State) all play key roles that are integrated and often overlap.
The Corps has traditionally played the predominant role constructing and rehabilitating large-scale
flood infrastructure, such as levee systems, for which there is a federal interest.
Operations and Maintenance Levee operations and maintenance (O&M) standards have become more difficult to meet. Among
the biggest challenges facing routine O&M of levees is the increasing burden of environmental
regulatory compliance. Among the biggest challenges facing routine levee O&M is the increasing
burden of environmental regulatory compliance coupled with the often-conflicting demand for
environmental stewardship in levee maintenance practices.
As an example, floodways that are clogged with sedimentation and vegetation often cannot be
cleaned out in a timely manner, thereby increasing loading on levees. Increasingly, compensatory
mitigation for O&M activities that were once considered routine is having a significant negative
effect on preventative maintenance. Along with other levee owners, OCPW participates in various

35
flood management associations that have a combined collective voice to change regulations that
would help with easing restrictions related to levee maintenance.
Maintenance and capital improvements are often delayed due to funding shortfalls or regulatory
challenges, resulting in increased risk of levee failure. As an example, rehabilitating an existing
federal levee requires at least four dozen permits, including a lengthy, complex federal process
required of non-federal agencies to fix federal levees such as the Santa Ana River.
The USACE plays an important role before, during and following a flood through a federal
authority termed Public Law 84-99. However, Orange County has challenges meeting eligibility
requirements of the USACE PL 84‐99 program. U.S. Army Corps of Engineers (USACE)
standards must be met to be eligible for federal assistance, for levee repairs through PL 84-99.
(Public Law) program.
Levees are susceptible to seepage and settlement are required to be recertified and re-accredited
every 10 years. OCPW is pro-active in its work with FEMA to comply as funding will allow.
This work also includes major and minor repair projects.
Hopefully, the current regulations can be streamlined and the regulatory burden on routine levee
O&M and capital projects can be reduced.
Improvement Projects The Santa Ana River
The Santa Ana River as we know it today, has a long history that is anchored on much work and
coordination by OCPW with USACE. The Mainstem project is designed to provide flood
protection for residences and business in the Southern California communities of Orange,
Riverside, and San Bernardino counties along 75-mile reach. All three counties, collectively,
working closely with the U.S. Army Corps of Engineers to design and construct the project.

36
The Orange County Flood Control District (OCFCD) was formed by the State Legislature in 1927.
The Federal Flood Control Act of 1936 authorized a flood control project to protect metropolitan
Orange County that included the construction of Prado Dam. Major floods in Orange County in
1937 and 1938 prompted Congress to direct the U.S. Army Corps of Engineers (Corps) to proceed
with design and construction of the dam, which was subsequently completed in 1941.
The re-study of the SAR system was approved in 1964 was completed in 1975 by the Corps LA
District Office that concluded that the existing Prado Dam and Santa Ana River improvements
only provided a 70-year level of flood protection. The report recommended an “All River Plan”
alternative (later renamed the Santa Ana River Mainstem) that included the Seven Oaks Dam in
San Bernardino County and the raising of Prado Dam (to increase flood storage capacity) and
improvement of its outlet works, and reconstruction of the lower Santa Ana River Channel to
increase its capacity.
The goal of the 1975 study was to develop a plan to address the “Standard Project Flood”, one that
has about a ½ percent chance of occurring any given year. Congress in the Water Resources
Development Act of 1976 authorized a study for the project that was completed in 1980. In 1986
a more detailed study was completed. The project was authorized for construction that began in
1989 for improvements to the Lower River near the Pacific Ocean.
Over the ensuing 35 years, much of the construction work for the 21 miles of levees have been
improved to provide ultimate capacity for this system as needed by current standards; however,
several key elements remain. The County continues with some of the last major projects in the
system that includes the completion of the Prado Dam and Santiago Creek improvements.

37
San Juan Creek
The Pineapple Express Storms of January 2005 resulted in a breach to the west levee along two
reaches of San Juan Creek Channel. As a result, the County immediately planned for a series of 8
projects to fortify the San Juan and Trabuco Creek channel levees. The completion of 7 of the
major levee fortification projects over the past 12 years along these systems has provided greater
safety and protection to the immediate community covering approximately 6.2 miles of levees in
south Orange County.
Westminster East Garden Grove Wintersburg
The OCPW current focus is on the “C” system facilities where the County recently received
authorization through the 2020 Water Resources Development Act (WRDA), as part of the
Omnibus bill signed in December 2020, for a federal project along four of OCFCD’s regional flood
control systems. In the area of these deficient systems is the largest remaining FEMA floodplain
in Orange County. Some of the fragile levees along these systems have been improved by OCPW
during the past 10 years ahead of the formal agreement with USACE. Our partnership with the
USACE, along with federal and possible State funding will help Orange County complete this
series of projects over the next 12 years or more.
OCPW levee projects incorporate recreational elements where possible. Many OCPW flood
control projects have included bikeways and trails.
Resilience and Innovation Resilience is the capability of levees to withstand and/or quickly recover from hazards. Climate
change is one of the predominant factors along with the many hazards threatening levees. A
community is flood-resilient when it recovers rapidly after a flood event and can do this when the
flood system is robust, incorporates redundant features, and is supported by ample resources.
Older levees were not designed to meet modern engineering standards, much less climate change
impacts. Some are rather fragile and required study and new methods that are applied successfully
to mitigate their existing conditions. Currently, there is no Statewide resiliency standard. Better
design and higher standards will help to provide more resilient facilities resulting in less frequency
and effort to operate and maintain the levees and thus allowing for use of savings towards other
projects.
Funding/Future Need More grant money -federal, State, and local funding is needed. OCPW is involved in legislative
efforts including visits to Washington D.C., work with lobbyists and involvement with
organizations such as the Association of State Floodplain Managers (ASFPM) and the National
Association of Flood & Stormwater Management Agencies (NAFSMA) that regularly meet,
review and comment on proposed changes to upcoming requirements, mandates, and regulations
regarding the design and maintenance of levees. These organizations have a voice in determining
what future legislation, funding and standards will be. OCPW has been a member or participant of
these organizations for many years.
Although funding is sometimes available through State or Federal grants, these opportunities are
not provided on a regular basis.

38
The USACE has traditionally played the predominant role constructing and rehabilitating large-
scale flood infrastructure, such as levee systems, for which there is federal interest. And while this
approach will continue for larger projects, local agencies such as OCPW has recently constructed
projects on its own saving time and money; however, local funding for other flood control projects
are greatly needed. This trend is partly due to the narrow criteria for federal investment, which
often reduces federal funding of flood management projects needed by local interests.
The State has frequently self-funded flood management projects ahead of the lengthy, traditional
federal process via Statewide bond initiatives and local assessments. For example, Proposition 1E
was passed by voters in November 2006, authorizing the state to sell $4.1 billion in general
obligation bonds for flood management projects and programs. Orange County was able to benefit
by receiving funding for some of its levee projects.
Maintenance and capital improvements are often delayed due to funding shortfalls or regulatory
challenges, resulting in increased risk of levee failure. As an example, rehabilitating an existing
federal levee requires at least four dozen permits, including a lengthy, complex federal process
required of non-federal agencies to fix federal levees.
Because primary responsibility for managing flood risk lies with local governments, most funding
is generated and spent at the local level. Local maintaining agencies face increasing financial
burden from increased regulatory pressures, aging infrastructure, changing State and federal levee
standards, and taxpayer protection laws.

39
Natural Gas
Overview As the nation's largest natural gas distribution utility, SoCalGas delivers clean, safe, and reliable
energy to 21.8 million consumers through 5.9 million meters in more than 500 communities. For
more than 150 years, SoCalGas has served Central and Southern California as an environmental
leader, employer, and neighbor. SoCalGas’ service territory encompasses approximately 24,000
square miles in diverse terrain throughout Central and Southern California, from Fresno to the
Mexican border. Orange County specifically accounts for 14,656 miles of distribution pipelines
and 190 miles of transmission pipelines, serving over 980,000 customers using over 50 billion
cubic feet of natural gas annually. These customers range from the most popular tourist resort
destinations to power generators, industrial manufacturers, hospitals, colleges, universities,
government buildings, grocery stores, and of course residents. Some of these customers have even
added natural gas electric generation facilities or operate natural gas fuel cells to provide efficient
and reliable electricity for their operations.
Orange County customers can rest assured that their investment in gas infrastructure is secure. The
infrastructure offers safety, resiliency, choice, affordability, and increasingly renewable energy
for the future.

40
In March 2021, SoCalGas announced its commitment to achieve net zero greenhouse gas
(GHG) emissions in its operations and delivery of energy by 2045. This commitment makes
SoCalGas the largest gas distribution utility in North America to set a net zero target including
scopes 1, 2, and 3 GHG emissions, which would reduce not only its own direct emissions, but also
those generated by customers’ energy delivered by SoCalGas’ energy infrastructure. SoCalGas’
commitment aligns with the Paris Climate Agreement’s recommendations and reflects the
company’s focus on supporting California with a resilient gas grid through the energy transition
to support a carbon neutral economy.
Safety Safety is paramount to SoCalGas as evidenced by the $600 million the company has invested over
the last six years in the operation and maintenance of pipes that run through Orange County.
Whether it is preventive maintenance of pipelines, or repairing leaks caused by damage during
construction, there are crews working 24/7 to ensure the gas is safely flowing to generate
electricity, provide hot water, heat for your equipment or appliances, and fuel to cook.
To safely transport and deliver natural gas, SoCalGas rigorously maintains the natural gas pipeline
system, monitors natural gas quality, and adds a distinctive odor to the gas to help detect leaks. By
using advanced safety inspection tools to monitor pipe conditions, SoCalGas can verify the
effectiveness of ongoing maintenance activities and address any necessary upgrades.
One such upgrade recently occurred at the intersection of Chestnut Street and Grand Avenue in
Santa Ana. Four transmission lines intersect at the corner where SoCalGas routinely conducts
pipeline inspections. The scope and frequency of the work has historically been quite extensive
and required complete excavation of the intersection and blocking lanes of traffic. To address this
issue, SoCalGas purchased the land adjacent to the intersection to allow work equipment to be
relocated from traffic lanes to its own property. This project provided a long-term solution to the
ongoing need to inspect transmission lines to maintain safe natural gas service for Orange County
customers.
Since 2014, SoCalGas has converted approximately 263 mobile home communities to direct utility
service, enhancing both public safety and service reliability of 17,800 mobile homes and providing
families with enhanced access to energy efficiency and customer assistance programs. Specific to
Orange County, there are 55 mobile home communities (4,063 homes) that have benefitted from
the Mobile home Park Utility Conversion Program, a statewide voluntary safety effort that
offers mobile home community owners the opportunity to replace their own natural gas and/or
electric master-metered systems with new utility-owned systems at no cost.
SoCalGas implemented another innovative measure with the update to Advanced Meters—
automated meters that can be read remotely. Advanced Meter technology allows customers to
enhance their privacy, security, energy savings, and can proactively identify possible gas leaks in
a home. It also allows customers to set up Bill Tracker Alerts so they can monitor their gas usage.
Through this remote meter reading, SoCalGas was able to remove 1,000 service vehicles from the
streets which eliminated close to 7 million miles driven to read meters and saves approximately
140,000 tons CO2 emissions each year.

41
Another proactive pipeline safety measure taken is focused on preventing leaks. SoCalGas has a
long-standing commitment to modernizing its system infrastructure to increase safety and
reliability and reduce methane emissions. Some of the most effective steps include:
• Modernizing its equipment at Metering and Regulating (M&R) facilities to more
accurately pinpoint leaks and to increase safety and reliability and reduce methane
emissions.
• Eliminating cast iron pipe from its natural gas system.
• Implementing new operating protocols to minimize any gas released to atmosphere during
routine maintenance.
• Prioritizing the replacement of pipe that does not meet current standards for corrosion
prevention.
• Using helicopters to monitoring methane emissions from the air.
Not all pipeline safety is proactive. Accidents involving contractors and excavators are one of the
leading causes of pipeline damage. It is especially important for contractors and excavators to be
informed of the potential safety issues that might arise when working around natural gas pipelines.
To reduce such damage, SoCalGas partnered with Angel stadium to ensure Orange County is
educated about the importance of notifying 811 prior to any excavation. More than 94 million
impressions were made with tens of thousands of baseball fans. Creative campaigns like this run
across SoCalGas’ entire service territory to highlight the importance of allowing the company to
mark gas line locations prior to construction. These efforts are effective. Excavation damage
decreased by 29 percent from 2018 to 2020 in Orange County while Underground Service Alert
(USA) ticket requests increased by 11 percent.
Reliability & Resilience Infrastructure investment provides safety, but also increases the resiliency of the SoCalGas system-
and energy reliability—including the electric grid. Some of SoCalGas’s biggest customers are
electric generators. As much as 60 percent of the electricity generated in Orange County is
produced with natural gas power plants. This source of energy provides stability with extreme
weather incidents. For example, during the heatwave of August 2020, more than 800,000
Californians experienced rotating electrical outages over the course of 2 days. The California
Public Utilities Commission (CPUC), California Independent System Operator (CAISO), and
the California Energy Commission (CEC) all agreed that “The excessive heat put a strain on the
demand for energy that renewables just cannot supply. In transitioning to a reliable, clean, and
affordable resource mix, resource planning targets have not kept pace to lead to sufficient resources
that can be relied upon to meet demand in the early evening hours. This makes balancing demand
and supply more challenging.” By providing energy anytime the demand for electricity exceeds
what solar and wind power can supply, the gas grid supports California’s ability to put more
and more renewable energy onto the electric grid. Because continuing to decarbonize the
electric grid requires more dispatchable energy from the gas grid, the gas it provides will likewise
be decarbonized over time.
When the sun and wind stop shining and blowing, so do their contributions to the electric grid.
Being weather-dependent, wind and solar are intermittent and unreliable. Natural gas, however, is
readily available to deliver energy at a moment’s notice to maintain a constant source of electricity.
Hospitals, fire stations, and water district are just a few of the critical customers that operate 24/7.

42
So, it is fortunate that natural gas is abundant, easily stored, and protected in underground pipes to
make it a resilient energy choice. Electric generators, as well as the millions of additional
customers relying on a stable source of energy, will increasingly depend on natural gas as
California expands its network of renewable sources.
In fact, Orange County is home to several state-of-the-art projects that demonstrate how natural
gas plays that critical role in expanding California’s renewable energy portfolio:
• University of California, Irvine (UCI) showcases a Power-to-Gas (P2G) Project.
SoCalGas worked with the university to study technology that converts surplus clean
energy from solar panels or wind farms into hydrogen, which can be blended with natural
gas and used in everything from home appliances to power plants. This renewable
hydrogen can also be converted to methane for use in a natural gas pipeline and storage
system or used in hydrogen fuel cell vehicles. Importantly, the hydrogen can enable long-
term storage of large amounts of carbon-free power.
• Renewable Natural Gas (RNG) is a renewable fuel produced from food waste, farms,
landfills, and even sewage. It can rapidly cut greenhouse gas emissions (GHGs) because it
takes more climate pollution out of the air than it emits as an energy source. Orange County
is home to three landfill gas-to-energy sites (i.e., RNG) where customers like Anaheim
Public Utilities can take advantage of using that RNG to provide clean electricity to its
customers.
• Huntington Beach hosts an Advanced Energy Community project. UCI worked with
City of Huntington Beach, Altura Associates, the National Renewable Energy laboratory,
Southern California Edison, and SoCalGas to provide the Huntington Beach neighborhood
of Oak View with a full spectrum of clean energy options, including solar, wind, and RNG.
The partners found they could reduce GHG emissions by 6,849 metric tons annually.
While Orange County is at the forefront of these innovative programs, SoCalGas has much more
on the horizon to address California’s environmental goals, including the company’s pledge to
achieve net zero emissions in its operations by 2045. The state has a goal to reduce greenhouse
gas emissions to 40% below 1990 levels by 2030 (AB32); and to get 100 percent of its electricity
from clean sources by 2045 (SB100). As part of its commitment to achieve net zero GHG
emissions in its entire operation, SoCalGas has $1 billion planned for 2020-2024 in support of
these goals. SoCalGas plans to invest in initiatives to decarbonize, diversify, and digitalize the
business. To guide SoCalGas’ path to net zero, the company announced this Climate
Commitment. .
One cornerstone of this clean energy strategy is SoCalGas' commitment to replace 20 percent of
its traditional natural gas supply with renewable natural gas (RNG) by 2030. RNG is already
helping eliminate emissions from trucks and buses, and recently SoCalGas received approval from
the CPUC to bring this renewable fuel to homes and businesses.
A 2016 law requires 40 percent of methane from California's landfills and farms to be
captured (SB-1383) with provisions to deliver that energy to customers. This will bolster the
supply of RNG that is already growing rapidly as cities and towns across the country look to divert
organic waste from landfills. In addition, the Coalition for Renewable Natural Gas projects that in
California, RNG can generate $14.3 billion in economic growth.

43
In addition to using RNG to decarbonize its system, SoCalGas is researching the use of green
hydrogen to support the growth of renewable electricity and California’s quest to become carbon
neutral by 2045 (California executive order B-55-18). Made from renewable electricity, green
hydrogen is a zero-carbon fuel that can be used in fuel cells or in traditional gas-fired power
generation plants to provide electricity when the sun is not shining, and wind is not blowing. Unlike
batteries, green hydrogen can be stored for days, months, even years, then re-converted to
electricity. The production, transportation, storage, and distribution of large volumes of green
hydrogen will be required to achieve carbon neutrality in California, and SoCalGas’ system and
its 100,000 miles of pipeline is well-positioned to provide these clean molecules to Californians.
The company recently filed an application with the CPUC to begin a hydrogen blending
demonstration program. The first proposed project in the program will blend hydrogen into an
isolated section of primarily polyethylene (PE) plastic distribution system in SoCalGas' service
territory. The initial hydrogen blend level is planned at 1 percent and may increase to as much as
an industry-leading 20 percent. The projects within the program will provide the crucial technical
knowledge needed to identify safe blending standards that preserve the safety, reliability and
integrity of the gas system and our customers’ end use equipment.
In addition, SoCalGas announced recently that it is field testing a new technology that can separate
and compress hydrogen from a blend of hydrogen and natural gas. This technology would
allow hydrogen to be easily and affordably transported via the natural gas pipeline system, then
extracted and compressed at fueling stations that provide hydrogen for fuel cell electric vehicles.
SoCalGas is also building a home to demonstrate, in a microgrid setting, the use of hydrogen
converted from solar energy. Called the “H2 Hydrogen Home,” the project will use solar panels
to create electricity that can be converted to green hydrogen via electrolysis. The hydrogen will be
blended with natural gas for the home’s appliances as well as converted back to electricity using a
residential fuel cell.
Funding SoCalGas keeps its system safe and reliable with funding provided by ratepayers. Every 3-5 years
the utility submits a General Rate Case (GRC) to the CPUC requesting approval for how much
revenue the utility can collect from each customer class. The CPUC approved SoCalGas’ 2019
GRC request which allocated nearly 60 percent of the increase associated with modernizing and
upgrading our infrastructure; and 13 percent to support the growth of more renewable energy
options, as well as improvements to customer services and technology solutions. The next GRC
will be filed in 2022.
Gas infrastructure is an energy storage and delivery system that seamlessly facilitates and
advances the transition to clean fuel solutions like RNG and green hydrogen, recognized around
the world by scientists and experts as crucial components of the clean energy future. Achieving
100 percent clean energy in California depends on the actions SoCalGas has taken, is taking, and
will take to make renewable deployment and decarbonization achievable.

44
Oil
Foreign Crude Oil tankers off the coast of California awaiting offloading at ports.
Capacity Orange County receives 100 percent of its demand for transportation fuels of gasoline, diesel, and
jet fuel from California manufacturers located throughout California to service the more than 3
million residents of O.C. and almost 3 million vehicles registered in Orange County.
With the closure of the Marathon Martinez refinery in Northern California, the future supply of
fuels looks uncertain for the more than 40 million residents of the state as the economy starts to
recover back to near-normal fuel demands after the pandemic for the 5th largest economy in the
world. The near-normal daily fuel demand for California’s 145 airports (inclusive of 33 military,
10 majors, and more than 100 general aviation) was 13 million gallons of aviation fuels, or one-
fifth of the nation’s jet fuel consumption. California’s 31 million registered vehicles were
consuming 10 million gallons a day of diesel and 48 million gallons a day of gasoline.
Collectively, that is about 65 million gallons of various fuels demanded daily to run the California
economy and the lifestyle of its residents, but now with the Marathon Martinez refinery out of
business, the future in-state supply may not be able to meet the demand.
In 2019-20 and 2020-21, it was estimated that fuel consumption accounted for more than $7 billion
for taxes to help maintain the 400,000 miles of roadways in the state. The fuel tax is one of several
sources of revenue for the transportation program.

45
Condition California is an “energy island” inhabited by roughly 40 million citizens and situated between the
Pacific Ocean and the Arizona/Nevada Stateline, with no existing crude oil pipelines over the
Sierra Nevada Mountains that run along the eastern California border and effectively separates
most of the state from the rest of the country.
With the state having no easy access to the abundance of crude oil east of the Sierra Mountains,
California as there are no pipelines over those mountains, it is the only state in contiguous America
that imports most of its crude oil demands from foreign country suppliers to meet the energy
demands of the state. With in-state crude oil production at an all-time low and going lower with
pressure from State regulations, The California Energy Commission (CEC) document’s the states
dependency on other suppliers has increased imported crude oil from foreign countries from 5
percent in 1992 to 58 percent today of total consumption. The imported crude oil costs California
more than $60 million dollars a day, being paid to oil-rich foreign countries.
California Energy Commission graph of the Crude Oil Supply Sources to California Refineries
Funding The state’s few refineries are privately funded by the manufacturers without government funding
for operation, maintenance, and refinery turnarounds (T/A’s), planned and unplanned. The T/A’s
provide essential opportunities for various T/A maintenance and repair issues, improvements, and
modifications to implement technological enhancements.

46
The fuel taxes paid by those using fuels help maintain California’s almost 400,000 miles of
roadways that are heavily dependent on those taxes from fuel that contribute more than $7 billion
annually, the same tax base that will be diminishing in the decades ahead as Governor Gavin
Newsom’s 2020 Executive order to ban the sale of gas-powered vehicles by 2035 will reduce the
fuel tax funds. Increasing fuel efficiencies of the mobile fleet are causing less tax revenue available
to fund the transportation infrastructure and the movement toward more EV’s will see the future
implementation of a VMT (vehicle mileage tax) to require all users of the roadways to pay their
fair share, inclusive of electric vehicles and gas-powered cars and trucks.
Future need Renewables have a role in our energy usage, but we need to consider what they can do, and what
they cannot do. Science shows that wind and solar can generate electricity, but science also shows
us that wind and solar cannot manufacture the oil derivatives that are the basis of more than 6,000
products that we did not have before 1900 that now are part of every transportation infrastructure,
electricity generation, cooling, heating, manufacturing, agriculture, and virtually every product
used in our daily and leisurely lifestyles.
The world has had almost 200 years to develop clones or generics to replace the crude oil
derivatives that are the basis of thousands of products for societies and economies.
Supply side economics has demonstrated that the exotic minerals and metals required to support
the need of wind, solar, and EV batteries and the lack of transparency in the supply chain, are being
provided by developing countries where environmental degradation and humanity atrocities are
occurring to support green electricity in developed countries.
Electricity alone has not, and will not, run the economies and lifestyles in the world, as electricity
alone is unable to support the military, airlines, cruise ships, supertankers, container shipping, and
trucking infrastructures, as wind and solar are incapable of manufacturing any of the oil derivatives
that are required for the thousands of products of the world’s economy.
The two prime movers that have done more for the cause of the advancement of global trade than
any others are the diesel engine and the jet turbine. Both movers get their fuels from oil, and
without this fuel and the 6,000 products that come from oil and petroleum products, transportation
and commerce would return to the pre-Industrial revolution age.
In addition to anti-fracking and anti-directional drilling in the State, there are serious
considerations of minimum “setbacks” for all new oil and gas development outside federal land,
to be located at least 2,500 feet (nearly half a mile) from any residence, school, childcare facility,
playground, hospital, or health clinic. These setback regulations would define re-drilling of a
previously plugged and abandoned well, or other rework operations, as a new development.
There are more than 8,000 active or newly permitted oil and gas wells located within a 2,500’
buffer of sensitive sites, that represents about 30% of the 30,000 active wells in California. These
setbacks would further reduce California crude oil production to the point that the foreign imports

47
needed to make up for the in-state reduction would drive up the monthly cost to more than $80
million dollars a day being sent to oil rich foreign countries, at current crude oil pricing.
The needs of California’s energy island’s growing population would result in transferring the
responsibility for California’s energy island demand requirements to other States or Countries
which have less stringent environmental laws than California with resulting increases in
greenhouse gases “leaked” to other locations in the world, and the increases in cost for Californians
from those imports from afar.
Operation and Maintenance While California pursues 100 percent intermittent electricity from wind and solar renewables by
2045, it continues to be unable to produce enough in-state crude oil to meet the state’s demands
and disregards the California climate policy that is supposed to account for and avoid GHG
emission displacement, or “leakage” to foreign countries that have less stringent environmental
regulations than California and transport their crude oil via air polluting ships delivering that oil
to California ports.
Public Safety According to American Fuel and Petrochemical Manufacturers (AFPM) Occupational Injury &
Illness Report, the total recordable incident rate for both company employees and on-site
contractors working at petroleum refining facilities, were 0.5 incidents per 100 full time
employees. The data shows that it is safer to work within a refinery than in an office building.
Refineries manufacture the various fuels for the transportation industries and the crude oil
derivatives that are the basis of more than 6,000 products that are the basis of lifestyles and
economies around the world. A Virtual Tour of a refinery is available.
Resilience Now, more than a decade since the passage of AB32, California, with 0.5 percent of the world’s
population (40 million vs. 8 billion) remains the most environmentally regulated location in the
world, California continues to contribute a minuscule less than one percent, of global
greenhouse gas emissions. Californians continue to pay almost $1.00 more per gallon of fuel than
the rest of the country due to a) the state sales tax per gallon which is some of the highest in the
country; b) refinery reformatting costs per gallon; c) cap and trade program compliance costs per
gallon; d) low-carbon fuel standard program compliance costs per gallon; and e) renewable fuels
standard program compliance costs per gallon.
Innovation The ongoing and future needs of Orange County are a balance of different sources of affordable,
plentiful, reliable, accessible, and dependable supplies of fuels, inclusive of sustainable aviation
fuels and alternative fuels, electricity, and the thousands of products made from petroleum
derivatives. Therefore, regulators and community leaders need to think broadly to find solutions
across the entire energy system, inclusive of the intermittent electricity from renewables, and fossil
fuels to meet California’s ambitious environmental goals without severely impacting the economy.
With in-state crude oil production on a continuous decline, creative methods to use truck and rail

48
to move that oil over the Sierra Mountains and into the California “energy island” will be required
to meet the energy demands of the 5th largest economy in the world.

49
School District Facilities
Irvine USD, Heritage Fields #3 K8, Courtesy PJHM Architects
Overview Orange County’s public school educational facilities consist of thirteen (13) Elementary School
Districts, three (3) Union High School Districts, and twelve (12) Unified School Districts
providing educational services to 500,000 students in kindergarten through twelfth grade.
Collectively, the districts manage and maintain nearly 600 school facilities.
The condition of school facilities that serve the needs of Orange County have continued to decline
in the past five years, due to a lack of facilities funding. The majority of school districts’ enrollment
has either decreased or remained constant easing near term demand to expand and add new
facilities. Deferred maintenance and upgrading of older school buildings continues to be a daunting
problem to solve.
The School Facilities Subcommittee’s work reflects the following goals and objectives: 1. To increase the accuracy and thoroughness of the discussion of recent school facility
financing activities.
2. To determine if recent school facility financing activities have impacted school
infrastructures in the last five years.
3. Considering the COVID-19 pandemic, reflect upon recent changes in school enrollment,
including changes in overall, as well as the effects of student distribution on capacity
issues.
4. To provide awareness to the public, city officials and representatives alike on the status of
our schools.
The following report assesses Orange County’s school infrastructure from five perspectives:
• Condition
• Cost/Operation
• Capacity
• Resiliency & Sustainability

50
• Innovation
Condition Condition is linked to a diversity of factors. Compared to industry standards, there is an ongoing,
structural pattern of inadequate and inequitable spending in many school districts. Because of
Orange County’s wide range of socio-economic zones, there are varied development levels within
those zones. This defines the extreme delta in facilities conditions not only neighboring county
districts, but within districts themselves. Funding, whether it be federal, state, or local, is in
constant fluctuation and requires districts to keep up on funding availability status.
Federal grants, such as the recent COVID-19 relief efforts put out by the current administration,
seek to provide much needed, but temporary alleviation of overall conditional needs.
In response to escalating construction costs, increasing restrictions on state funding for schools,
and additional pressure to upgrade and proactively maintain school facilities, Orange County
school districts have aggressively sought to pass local general obligation facility bonds, and have
worked closely with residential developers to finance schools through developer fees and the
establishment of Community Facilities Districts (CFDs)
From 1996 to 2006, California voters approved about $109 billion in school construction bonds at
the state and local level. In 2016, voters approved Proposition 51, which authorized $9 billion in
school and college construction bonds. In March 2020 voters rejected Proposition 13, which
would have provided $15 billion in general obligation bonds for school and college facilities,
including $9 billion for preschool and K-12 schools, $4 billion for universities, and $2 billion for
community colleges. Proposition 13 is the first statewide education-related bond issue that voters
rejected since 1994.
Additionally, in March 2020, seven Orange County K-12 School Districts and one Community
College District were unable to pass their local bond measures that would have provided $2.6
billion for renovations and repair of aging facilities.
With voters last passing a State-funded construction bond in 2016, the State has run out of money.
With no other State funds identified for the State Facility Program and federal funds not yet
available for school facilities, local school districts in California must now cover essentially all
costs of construction renovation and maintenance of their schools alone.
School districts typically spend money on their facilities from two separate budgets: the general
district operating budget and the capital budget. Each has different funding streams. General
operating funds largely come from local property tax and State transfers such as those through
the Local Control Funding Formula (LCFF) Capital budgets are largely funded by a
combination of local general obligation bonds, lease obligations, Community Facilities District
bonds, statewide general obligation bonds, locally imposed development fees, and special taxes
levied for Community Facilities Districts.
The conditional status of school facilities depends highly on the fiscal responsibilities of individual
local districts. How do Orange County districts define equality of facilities? Some focus on

51
providing capital improvements district wide and spreading funding when available. Some bridge
the gap by integrating technology into schools with variable vintages. One constant is there is no
constant when it comes to conditional status.
Cost & Operation In addition to constructing and reconstructing school infrastructure, Orange County school districts
have an obligation to keep existing facilities in a state of good repair. Due to restrictions on the
expenditure of certain state and local bond funds on maintenance activities, and the need to spend
General Fund monies on instructional programs and with the state’s poor economy negatively
impacting schools, many districts have postponed maintenance and repairs, which has left some
elements of infrastructure in an impaired state.
The School Districts estimate the value of deferred facilities maintenance at approximately $1
billion. School Districts expend on average over $50 million annually on facilities maintenance.
School Districts have accessed developer fees, utility rebates and federal grants to supplement
local dollars available for maintenance and repairs.
Funding is driving life cycle costs. High impact, low energy design decisions play a huge role in
how districts can maintain their facilities. For example, California’s recent drought restrictions has
allowed districts to rethink their approach on maintaining their exterior grounds and water usage.
Many districts have gone to xeriscape or low water planting to eliminate excess. The days of turf
may be gone, other than for athletic purposes.
Capacity The Orange County region has historically and looks to continue harvesting international talent
and commercial endeavors, providing strong, long term foundational infrastructure for educational
facilities moving forward. Although growth continues to happen, many school districts have or are
nearing capacity, and have begun to focus on modernizations and/or new construction on existing
properties in lieu of new school sites. Growth and demographic projections such as aging
population also plays a large role in whether certain facilities are built, modernized, or renovated.
Each district is tasked with specific mixture of conditions. For example, Santa Ana is a fully built
out district, and must manage and maintain mainly smaller, dense sites, with demographic needs
shifting the priorities between existing facilities. Irvine is reaching the end of an era of expansion
and is slowly making the shift toward modernizations in lieu of new construction. Heritage Park
#3 K8 School, within the Great Park development, pictured above, is in fact the last new school to
be built in Irvine for Irvine Unified School District under current projections.
Developer fees are focused on increasing capacity of a certain restricted area, thus inevitably
creating a divergence of equality. One school within a district may receive funding for
improvements, whilst others may be held to nearly 30-year-old facilities.
COVID-19 has played a large role in the fluctuation of enrollment throughout the county.
Measures are in place to allow for hybrid on-campus / remote learning, but it is difficult to say
whether this will remain a permanent option. Schools are continuing to be renovated based on pre

52
COVID-19 student count projection requirements, and no definite county or statewide measures
have been taken to alter this model.
Resiliency & Sustainability Every public school district that utilizes state funds for site improvement or construction is held to
State building codes, overseen by the Division of State Architect (DSA). Structural integrity, Fire
and Life Safety and Accessibility are the key elements DSA reviews and approves. Further code
compliance to Title 24 Energy Code and Cal Green, the first-in-the-nation mandatory green
building standards code, are setting the standard for creating efficient, low energy focused design
and construction of schools. Recent focus for educational facilities has been the ability to provide
clean, healthy spaces for learning and work. Initiated by the cultural shifts of COVID-19, many
districts have initiated Indoor Air Quality (IAQ) upgrades via HEPA 13 filtration, a turn towards
natural ventilation, and outdoor learning.
Funding plays a large role in providing resilient, sustainable educational infrastructure. The ability
to select and construct school facilities with durable, weather resistant and natural materials
sometimes are limited by funding.
The long-term consequences of the COVID-19 pandemic are yet to be determined. We face not
only the direct impact associated with facility “health and safety” upgrades, the increased operating
expenses associated with more frequent and extensive maintenance requirements, but an evolution
in educational delivery seems to be increasingly inevitable. As a result, the future of our business
and our supporting infrastructure needs are most certainly going to change in the coming months
and years.
Innovation Trends within California’s energy codes are moving toward requirements for school districts that
greatly reduce or eliminate the need for outside power supply. As laid out by the California Public
Utilities Commission in the California Energy Efficiency Strategic Plan, we can anticipate as
early as 2030 all commercial buildings, including educational facilities, are to be designed and
built to Net Zero Energy (ZNE), and 50 percent of commercial buildings will be retrofit to ZNE.
Because most Orange County districts are built out, the latter applies, districts have begun to plan
for it, or have already implemented solutions.
Districts are pursuing multiple innovative strategies that bring us closer to Net Zero Energy. Many
districts have recently installed Photovoltaic array systems to supplement their power usage and
reduce dependance on power supply. Power Purchasing Agreements (PPA’s) are another way
districts’ have provided renewable energy to benefit their school sites and their budget. Some
Orange County districts have begun to implement the use of electric or natural gas power buses.
Due to Orange County’s temperate climate conditions, the region is a prime location for novel
high-performance, climate-based design for school districts, such as furthering reliance on natural
ventilation and daylighting and addressing the growing need for flexibility of learning spaces, both
indoor and outdoor.

53
Solid Waste and Recycling
Capacity OC Waste & Recycling (OCWR) oversees the Countywide Integrated Waste Management
Plan (CIWMP), and is comprised of a landfill system including three active sites, 20 closed sites
and four Household Hazardous Waste Centers. OCWR currently receives and manages all the
municipal solid waste generated by residents and businesses within the County. The landfill system
has a combined permitted capacity of 22,500 tons of waste per day and currently receives
approximately 16,500 tons of waste per day. The current waste stream volume is made up of
10,500 tons per day of in-county municipal solid waste and approximately 6,000 tons per day of
importation. Combined, our three landfills provide another estimated 40 years plus of capacity.
As required by CalRecycle, we update the CIWMP every five years. The update includes review
by an Ad Hoc committee from the Waste Management Commission. The CIWMP specifies
capacity for future disposal. However, increased diversion is mandated by the State of California,
through CalRecycle, to minimize reliance on disposal. CalRecycle is the state agency and
regulatory body that grants permits and sets the standards for recycling and landfill diversion.
• Annual Permitted Capacity is the maximum allowable amount of waste per year within the
landfill system.
• Historical Disposal is the actual amount of disposal received for the year.
• Projected Disposal is the estimated tonnage to be received in the landfill system based on
industry indicators such as, economic factors, recycling efforts and new recycling legislation
impacts for increased landfill diversion.
• Historical Disposal has never reached permitted capacity due to diminishing waste generated,
increased recycling, increase in regulated waste, change in waste stream due to economic
impacts, and operational efficiencies.

54
Condition OCWR is highly regulated by local, state, and federal entities. We must comply with our permit
requirements for tonnage, material acceptance, air and water quality, and operational practices. A
team of industry professionals oversees the design, construction, and operations of the landfill
system. The OCWR landfill system is a perpetual construction site, changing daily by building
lifts – areas where waste is buried -- with municipal solid waste that arrives throughout the day.
The daily lifts – the active fill areas -- are designed to create waste prisms or waste cells. The lifts
are engineered to maintain the waste in place in perpetuity, meeting standards for such naturally
occurring conditions as earthquakes, storm events, and flooding.
In addition, the requirements address ground water monitoring, stormwater management, leachate
(liquid waste) management and the management of the natural byproduct of landfill gas. The
leachate is collected and either re-used for dust control or sent to a sanitary sewer. OCWR
maintains compliance by meeting the regulatory conditional standards and exceeds compliance
that helps mitigate the impacts of landfills on the nearby residential communities.
ANATOMY OF A LANDFILL
Funding OCWR is an Enterprise Fund and not part of the County’s General Fund. Revenue sources
include disposal fees at the landfill, lease agreements, royalties, and other miscellaneous fees. The

55
disposal fees account for 95 percent of revenue generated. The enterprise fund is a “cost recovery”
(versus profit) model. OCWR maintains extremely low disposal rates to benefit the residents and
businesses of Orange County. The disposal fee is based on usage, which is based on weight. As
waste enters one of the landfill sites, the vehicle is weighed and charged a fee based on the amount
of waste brought in. OCWR’s general funds cover the cost of operations during the active life
cycle of the landfill. A restricted fund covers the series of operational actions required for closure
and post closure maintenance once the sites reach full capacity. The restricted funding covers the
cost of operations and maintenance of the closed site into perpetuity.
• Relationship between Gross Domestic Product of Orange County and Disposal in percentage of
change year-over-year. 18-year comparison.
• Impacts to the percentage of change in disposal related to goods and services in the chart,
change may also be related to local recycling efforts and legislation.
Future Need To further preserve natural resources, reduce greenhouse gas emission and prolong the life of
landfills, CalRecycle continues to drive new legislation and implement mandates that require
jurisdictions to divert more material from the landfill system. The recycling industry and
markets are facing new challenges due to increased quality requirements under China’s 2013
Green Fence Initiative and enforcement of China’s 2017 National Sword. With the increasing
demand for cleanliness and purity of recyclable materials, identified in the Green Fence Initiative,
jurisdictions and haulers are challenged by these standards as well as the changing markets and
lack of recycling infrastructure.
Critical needs include: education, training and outreach to residents and businesses; increased
domestic recycling infrastructure; and, where possible, local recycling infrastructure and market
development. A greater emphasis on domestic recycling infrastructure has risen as foreign
recycling infrastructure is currently at a standstill and shows no signs of recovery anytime soon.
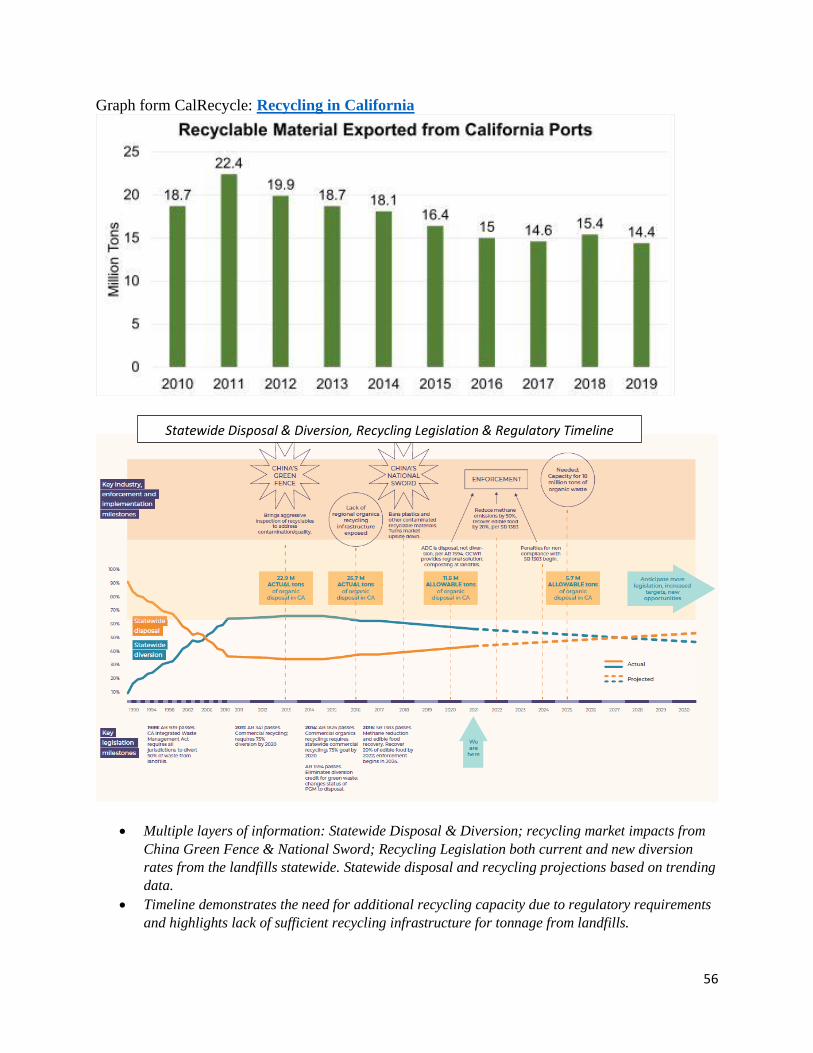
56
Graph form CalRecycle: Recycling in California
• Multiple layers of information: Statewide Disposal & Diversion; recycling market impacts from
China Green Fence & National Sword; Recycling Legislation both current and new diversion
rates from the landfills statewide. Statewide disposal and recycling projections based on trending
data.
• Timeline demonstrates the need for additional recycling capacity due to regulatory requirements
and highlights lack of sufficient recycling infrastructure for tonnage from landfills.
Statewide Disposal & Diversion, Recycling Legislation & Regulatory Timeline

57
Operations and Maintenance The landfill life cycle requires operations and maintenance into perpetuity, involving detailed
planning, regulatory approval, engineering, and design. As active sites, each OCWR landfill builds
lifts toward estimated dates that each will reach its capacity/allowed elevation, identified in its
Solid Waste Facilities Permit (SWFP). The closure date estimate is based on the amount of
permitted tonnage. As a result of declining tonnage in recent years, those estimated dates are
revised into the future. The operations and maintenance continue until final capacity and elevation
is met, then closure activities begin. In the post-closure phase, activities such as groundwater and
stormwater management, gas collection and air quality monitoring continue, as does reporting to
regulators on all such environmental components.
Safety In 2019 the U.S. Department of Labor’s Bureau of Labor statistics listed the waste and recycling
industry amongst the top-10 highest-hazard industries. The Solid Waste Association of North
America (SWANA) is the leading association in the waste and recycling industry. SWANA has
recognized OCWR for our efforts in landfilling and safety. OCWR’s core cultural value is the
protection of public health and the environment. This starts with the safety of our employees but
also the contractors and customers who frequent the landfill system. Our core business is protecting
public health and safety by managing waste responsibly to steward air and water quality.
The landfill system operates at full compliance and uses above-industry standards. This is
demonstrated in our employee safety culture and compliance-plus efforts at each landfill site.
OCWR provides ongoing training for employees on safety, compliance and policy adherence and
utilizes an award-winning online system to track training completion. We perform routine and
random inspections, which both verify compliance and spotlight new opportunities to increase
safety. OCWR requires all contractors, customers, and visitors to follow safety procedures while
on the property.
Resilience Orange County’s current waste and recycling infrastructure provides an excellent level of
resilience based on the number of private waste haulers, local Material Recovery Facilities
(MRFs), and a stable landfill system. The resilience of the infrastructure was tested by the impacts
of the COVID-19 pandemic and major damage caused by the Silverado Fire. The MRF’s had to
temporarily close due to COVID-19, as the workforce was minimized. Closed MRFs resulted in
an increase of recyclable materials coming to the landfill. The Silverado Fire caused a temporary
closure of one landfill, however the other two sites were able to accommodate the additional waste.
In both cases, OCWR received regulatory approval to operate beyond the permitted capacity to
handle the additional waste during the state of emergency. OCWR has proven its capacity to
recover quickly from difficulties, and to spring back into shape. OCWR has demonstrated its
ability to overcome such challenges from natural disasters, regulatory changes, loss of volume and
even a pandemic.

58
Innovation OCWR’s history of innovation reflects broad, forward thinking. The implementation in 1990 of a
liner system set new design standards in the landfilling sector. Our partnerships with private
energy firms to repurpose landfill gas – a byproduct of waste – continue to provide opportunities
for innovation. Each site manages the landfill gas and converts a portion to energy through multiple
energy partner contracts.
The need for continuous innovation has never been greater when it comes to the waste and
recycling industry to further the recycling infrastructure. OCWR developed a regional response to
industry-transforming organic waste management legislation, for which an infrastructure was
virtually nonexistent. Starting from scratch, within two years launched pilot composting projects
at each landfill site. Currently one is a fully operational, commercial composting facility, and the
other two will be operational by 2022. Our compost operation uses preprocessed green waste from
the residential waste stream.
The finished product creates a soil amendment and mulch to be used locally. Siting the
composting operations onsite at the landfills contributes to the shortage of organic processing
facilities within the County. Plans are also underway to incorporate food waste recovery into the
compost operations.
Composting is one element of a business model pivot OCWR launched in 2019. For decades
OCWR provided the singular, essential public service of waste disposal. The pivot moves OCWR
from landfilling alone to resource recovery. In 2020, OCWR launched mattress and scrap metal
recovery programs systemwide. Both programs are in their early infancy but are already making a
difference. Based on visual observation of the waste stream and initial salvaging efforts, there is
tremendous potential to further recover these items from incoming loads. As these efforts continue,
OCWR will be identifying the resources needed to capitalize on these opportunities.

59
Surface Water Quality
Surface Water Quality Setting Orange County is known for great weather, safe communities, beautiful parks, open spaces, and
plentiful beaches along the coastline. But what if residents and visitors were restricted from
enjoying the ocean or recreating in its bays and along its creeks and streams? We may face
restrictions in the future if surface water quality is not properly managed.
In Orange County, the quality of stormwater runoff is regulated through the implementation of
programs and activities required by a series of permits and regulations. The purpose of these
regulations is to protect local receiving water beneficial uses from the impacts of urbanization. A
direct correlation exists between continued urbanization and an increased need to protect surface
water quality, which helps safeguard the receiving waters’ beneficial uses (e.g., swimming,
surfing, and fishing). Managing urban runoff presents an ongoing challenge due to its broad nature
and potential to degrade receiving waterbody quality. Degradation of our creeks, streams, lakes,
and ultimately the ocean can occur from pollutants such as metals, nutrients, bacteria, pesticides,
oil and grease, trash, and sediment; all of which are carried into our waterways via stormwater
runoff and non-stormwater runoff such as overwatering of lawns.
The following regulations drive the development of surface water quality programs and are issued
by state and local regulatory agencies:
• Santa Ana National Pollutant Discharge Elimination System (NPDES) Permit,
• San Diego NPDES Permit,
• Phase II Small Municipal Separate Storm Sewer System Permit,
• Construction General Permit,
• Industrial General Permit, and
• Statewide Trash Provisions
The Orange County Watersheds Program (OC Watersheds) leads implementation of the Santa Ana
and San Diego NPDES Permit requirements for the Orange County Public Works Department and
municipal permittees within Orange County.
Capacity The transformation of undeveloped open space into residential, commercial, and industrial areas
connected by transportation corridors and supported by utilities is the basis of land development
and urbanization. Unfortunately, actions to address the impacts of development on receiving
waters were not taken until the past few decades and the necessary space to mitigate these issues
was not anticipated in the planning efforts throughout Orange County. As a result, Orange County
was largely developed with limited provisions to set aside adequate space to address water quality
issues.
Orange County has experienced consistent population growth (5.5 percent from 2010 to 2020).
As a result of the direct correlation that exists between continued urbanization and an increased
need to protect surface water quality, local municipalities have been challenged to find new ways
60
to treat, store, infiltrate, and/or divert stormwater runoff through enhancements to an existing
stormwater conveyance system.
Water quality issues exist during both dry weather and wet weather. Dry weather water quality
issues can occur because of overwatering landscaping or rising groundwater due to leaking water
pipes, among many other sources. Progress has been made through municipalities working in
partnership with local Water and Sanitation Agencies (Orange County Sanitation District, Moulton
Niguel Water District, South Coast Water District, South Orange County Wastewater Authority)
on their Water Conservation and Dry Weather Urban Runoff Diversion Programs; as well as
other programs in the county. Recent examples include the Santa Ana Delhi Channel Diversion
Pipeline Project (estimated capital cost of $1.7 million) and the Smart Watershed Network Project
(estimated cost of $412,000). However, more efforts like this are needed throughout Orange
County to address water quality issues more effectively.
Managing water quality during wet weather presents a different challenge because of the large
volume of water that must be addressed. Although runoff from an entire storm often does not need
to be treated, the necessary wet weather treatment capacity to consistently meet the water quality
targets does not currently exist.
To meet this demand, municipalities need increased funding and additional or re-purposed space.
Thus, it is imperative for regulated communities to continue fostering collaboration to identify,
fund, design, and construct multi-benefit water quality projects. Multi-benefit projects stretch
available funding and can address both dry and wet weather conditions, along with other needs.
Condition According to Heal the Bay’s 2019-2020 Beach Report Card, 20 Orange County beaches were
highlighted in the program’s Honor Roll, out of 42 statewide. The Honor Roll beaches were
monitored daily and met the specific program requirements during the summer (dry), winter (dry),
and wet-weather seasons. Unfortunately, two (2) of the ten (10) California beaches on the Bummer
list were also in Orange County.
Dry weather conditions during both the summer and winter were very good across Orange County,
which indicates the success of dry weather diversion systems. However, 37% of Orange County
beaches received a low rating during wet weather due to bacteria exceedances. Other pollutants
were not analyzed, although they too impact surface water quality.
Beyond the beaches, water quality conditions in our creeks, streams, and bays have started to
improve due to the implementation of stormwater programs (source control, treatment devices,
etc.) across Orange County, however additional effort is necessary. Municipalities have made
progress as several water bodies from the 2012 list of impaired waters are no longer impaired (as
seen in red within Figure 1 below). However, many of those impaired waters identified in 2012
remain today and additional waterways were added to the list by regulators during the 2014/2016
update.

61
Figure 1: Impaired Water Bodies in Orange County
Funding Unlike potable water and sanitary sewer utilities, stormwater treatment and conveyance must
compete for general fund dollars to complete projects and implement programs. Orange County
has an approved budget of $7.54 billion for fiscal year (FY) 2020-2021, of which an estimated
$17.95 million (0.23%) is for the OC Watersheds. Since FY 2015-2016, expenditures for the
Orange County NPDES program have been approximately $6 million annually (on average) per
the shared cost budget, which supports County-wide common programmatic efforts such as public
education, surface water quality monitoring and reporting, and watershed studies and planning
efforts. These budgets do not reflect the additional funds spent by individual cities on infrastructure
projects to improve water quality or city-specific program efforts.
Consequently, there has been an increasing use of grant programs that encourage collaboration
amongst various jurisdictions through integrated regional water management programs. This effort
enables an effective use of available funding, while also improving surface water quality, water
supply, flood risk, and habitat throughout Orange County.
Preliminary watershed studies in 2015 indicated that it could cost dischargers up to $2.1 billion
to meet future stormwater quality objectives for bacteria and zinc just for south Orange County.
Therefore, generating new funding sources to meet future capital, operations, and maintenance
funding needs should simultaneously occur at the local, state, and federal level.
Voters have approved statewide programs that provide grant funding to projects that would
improve water quality. Most grants require the development of projects that result in multi-benefit
solutions, addressing not only water quality, but flood control, water supply, community

62
development, and habitat improvement at the same time. Planning for multi-benefit projects
requires a collaborative approach to developing infrastructure that not only qualifies for grants,
but efficiently leverages limited resources across Orange County.
At a local level, voters will need to consider funding these programs through fees or taxes, as they
have with other infrastructure needs in the past. For example, voters in Los Angeles County
approved Measure W, the Safe Clean Water Program. The revenue from the parcel tax, estimated
at $275 million dollars a year, will increase local water supply, improve water quality, and help
make communities greener.
Future Need Investment in water quality programs is expected to increase due to more rigorous regulations and
the need to meet compliance schedules. Urbanization, along with the development of stringent
provisions that establish surface water quality objectives for various pollutants, requires
coordination among all regulating agencies and dischargers. Prioritizing the improvement of
stormwater runoff through multi-benefit projects and source controls (i.e., stopping pollutant
generation before it happens) is essential.
Fortunately, these infrastructure investments will help improve water quality and the resiliency of
conveyance systems, encourage economic growth, and support the creation of new local jobs for
both construction and the long-term development of a work force to operate and maintain these
facilities.
Public education about this issue is also part of the solution. True source control is the most cost-
effective strategy to address water quality challenges. This includes education on proper use of
chemicals (e.g., fertilizers and pesticides), sources of heavy metals (e.g., tires and brake pads), and
eliminating dry weather runoff. If potential pollutants are not controlled at the source, then
increased funding to manage pollutants downstream will be required. Educating residents and local
leaders on the need for increased funding is also necessary to address pollution issues.
Operation and Maintenance The ongoing effectiveness of stormwater controls is heavily dependent upon regular operation and
maintenance (O&M). Up to 20% of a project’s capital cost can be associated with the annual
O&M of its stormwater treatment devices. Most of these treatment facilities, known as Best
Management Practices (BMPs), are located on individual parcels, and distributed across Orange
County with the owner responsible for O&M. Managing O&M in this manner is inefficient and
makes confirming effective operation of the BMPs a challenge.
A shift toward regional stormwater facilities operated by municipalities and paid for by
contributing stakeholders is a solution that may, in some circumstances, lower O&M costs.
Centralized systems may also decrease pollutant removal efficiency when compared to a
distributed system and proper optimization of pollutant removal in a given watershed requires
case-by-case analysis. The restructuring of O&M activities would help reduce O&M costs due to
economies of scale and would also help ensure O&M takes place at the required frequencies and
by qualified personnel. This approach will require improved funding mechanisms for O&M.

63
Budget cuts will continue to challenge local municipalities in their ability to maintain infrastructure
as funding drives development, NPDES permit compliance and overall infrastructure
improvements. Therefore, increased investment over the coming years will be critical to ensure
treatment devices are maintained for longevity and effectiveness.
Public Safety Water quality is a direct public safety issue. Not only do pollutants impact the plants and animals
in our receiving waterbodies, but also the Orange County residents who rely on them for recreation.
Beach closures are the clearest manifestation of this, but public safety may also be at risk with the
consumption of fish or wildlife from our bays, piers, and estuaries. If not properly managed,
pollutants can impact ecosystem vitality, cause negative impacts on public health, and ultimately
hurt economic well-being.
Resilience Investment in green infrastructure, low impact development and multi-benefit solutions can help
with resilience in a changing climate. Projects that improve water quality might also retain or use
runoff, which could help increase water supply, introduce improved habitat that could reduce
secondary development effects and bring back native species, or provide storage to extend the life
of a now undersized storm drain system. Targeted investment like this will create redundancies in
our stormwater systems and help make them more resilient. Fortunately, a transition to this
approach is underway and is occurring every day. Accelerating this transition will improve local
communities and may increase local sources of clean water.
Innovation Managing water quality in Orange County will continue to stretch available resources.
Consequently, there is a great demand for innovative and cost-efficient treatment solutions. As
such, improving Orange County’s ability to treat and convey stormwater through investment in
research and development, as well as the development of multi-benefit systems, should be of
utmost importance to communities and policy makers. As innovative, regional facilities become
more common, it may open the door for additional alternative compliance opportunities, such as
water quality trading, fee-in-lieu programs, stormwater banking, and public private partnerships.
These programs are geared towards providing local municipalities a funding source to implement
multi-benefit projects.
Imported drinking water is a part of the water portfolio for most cities. Investing in stormwater
infrastructure that facilitates the harvest and use of stormwater simultaneously augments the
region’s water supply and improves water quality. Opportunities for this may exist at a regional
and local level. Innovative thinking is also needed regarding how to provide funding for these
projects.

64
Wastewater
OC San Plant No. 2, Huntington Beach, CA
Orange County’s (OC) wastewater system comprises thirty-five (35) special districts and cities.
Orange County Sanitation District (OC San) provides regional wastewater collections,
treatment, reuse, and disposal services to central and northwest OC with twenty-one (21) cities,
three (3) special districts, and portions of the unincorporated areas of OC. These central and
northwest OC cities and special districts provide local wastewater collection services that connect
to OC San’s facilities.
In south OC, individual cities and special districts provide wastewater collection, treatment, reuse,
and disposal through a combination of their own or jointly owned facilities. These cities and
special districts are: El Toro Water District (ETWD), Emerald Bay Service District (EBSD),
Irvine Ranch Water District (IRWD), City of Laguna Beach (CLB), Moulton Niguel Water
District (MNWD), City of San Clemente (CSC), City of San Juan Capistrano (CSJC), Santa
Margarita Water District (SMWD), South Coast Water District (SCWD), South Orange
County Wastewater Authority (SOCWA), and Trabuco Canyon Water District (TCWD).

65
Capacity
There are approximately two-hundred twenty (220) wastewater pump stations and fifteen (15)
wastewater treatment and reclamation facilities with total secondary treatment capacity of more
than 750 million gallons per day (MGD) in OC. Average daily flows are approximately 230 MGD,
with most flows (189 MGD) being conveyed to OC San’s facilities. OC wastewater agencies also
operate a total of four (4) ocean outfall facilities with total capacity of approximately 745 MGD.
The vast majority of the OC collection systems do not have capacity deficiencies and are not at
risk for sanitary sewer overflows (SSOs). Despite experiencing more heavily concentrated rain
events in recent years, facilities and procedures have been implemented to handle higher peak
flows (i.e., flow equalization, flow diversion). Areas with identified capacity deficiencies have
future projects to eliminate collection system capacity issues. There are no treatment or outfall
capacity issues for any OC wastewater agencies.
Condition Generally, OC wastewater treatment plants are in good condition and have had ongoing
rehabilitation and upgrades to meet stringent State and Federal regulations on effluent water
quality and discharge. Most OC wastewater agencies employ dedicated asset management efforts
which have helped to extend the useful life of sewers, pumping stations, treatment plants and
reduce hours of reactive maintenance (i.e., equipment breakdown, emergency work) over the last
five years.
The physical condition of the oldest civil infrastructure in sewer facilities continue to be an area
of concern, but system conditions have generally been improving over the last five years through
rehabilitation and replacement programs. Many sanitary sewers built in the late 1940s and 1950s
have reached their original design life. As their condition deteriorates, these older sewers are more
prone to root intrusion, offset joints, debris, and grease build-up, and site-specific failures that can
result in sewer spills.
Funding Although most OC wastewater agency capital outlays are expected to increase over the next several
years, current revenues and funding are adequate to support planned expenditures. Funding to
design, build, operate, maintain, rehabilitate, and replace the facilities comes primarily from local
user fees. All OC wastewater agencies have authority to enact and collect user fees. Most OC
wastewater agencies also receive a share of property tax revenue.
When typical revenue sources are inadequate, major capital projects can be funded in a variety of
ways. Agencies can issue certificates of participation, or repayment obligations based on a lease
or installment sale agreement. However, alternative funding is sometimes needed for the
implementation of newer technology and innovative projects. There are state and federal grant
low-interest loan programs to help fund major capital projects, especially projects that increase
water and energy efficiency. Additionally, increased capacity required for land development is
funded by new development bonds.

66
Future Need Future needs in the county vary based on geographical area. Areas in south OC are experiencing
new development in undeveloped areas, and north and central OC are experiencing redevelopment
such as higher density housing or infill projects. In new development areas, new facilities are
required to convey and treat wastewater whereas long built-out areas have more project needs
based on local wet weather capacity rather than growth. Low flow plumbing has resulted in
reduced wastewater generation per capita in all areas.
Reduced wastewater flowrates may result in pipeline and pump station surplus capacity sufficient
to serve additional flows from higher density housing redevelopment. Areas without significant
industrial flows have been experiencing higher strength wastewater due to lower per capita
wastewater flowrates, in most cases still requiring full existing treatment capacity.
Rehabilitation and replacement of facilities is an ongoing and future need. Throughout the county,
projects are planned for lift station pump rebuilding and replacements, manhole coating, sewer
system repairs, treatment plant repair and maintenance including coating and equipment
rehabilitation or replacement. Some projects are technology driven, where equipment replacement
is justified by cost savings from energy savings or automation resulting in reduced labor costs.
Increased regulatory requirements, in particular the removal of nutrients (nitrogen and phosphorus)
will require upgrades to water reclamation plants. These upgrades will require significant capital
expenditures and space for new processes at treatment plants in the future.
Operation and Maintenance Several factors can have an impact on system operations and maintenance. The use of products
advertised as flushable wipes continues to be a significant cause of increased operation and
maintenance labor and expense. Flushable wipes have caused blockages and damage to pumps in
lift stations and in equipment throughout the treatment plants. Agencies are implementing costly
capital projects to increase screening of wastewater coming into the collections and treatment
facilities to prevent clogging of equipment and other operational issues.
Wastewater flows have decreased because of low flow plumbing fixtures and other water use
efficiency efforts. Drought conditions also result in lower wastewater flows as residents reduce
water usage which, in turn, reduces wastewater flows. In the sewer system, lower flows result in
lower velocity and therefore require more cleaning to prevent settled solids from causing blockages
or odors. In areas without significant industrial flows, lower wastewater flows have resulted in
higher wastewater strength which has impacted treatment facilities.
Wastewater treatment is a biological process with demand for oxygenation, and physical processes
and chemical usage relate to the solid’s concentration of the wastewater. While wastewater flows
may decrease, the treatment demands remain the same or may become more difficult to control.
Potential regulations for more nutrient removal will result in higher operation and maintenance
costs.
With lower flows and higher concentrated wastewater, collections infrastructure is more
susceptible to an advanced rate of corrosion. Most OC wastewater agencies have employed various

67
odor control technologies to minimize nuisance odors as well as protect assets from higher
corrosion rates. In most areas of OC, odor complaints have been reduced significantly in recent
years and response time to odor complaints has also been improved.
Public Safety OC wastewater agencies have always practiced preventive maintenance to reduce the need for
reactive repairs and the frequency of responding to “hot spots”, or sections of the sewer collections
network which require additional attention. Pipeline closed circuit television (CCTV), manhole
CCTV, and in some cases remote monitoring equipment installed on manholes are being used
systematically to monitor the condition of sewer collection networks and need for maintenance,
repairs, rehabilitation, or capital improvements. The ability to accommodate treatment capacity
demands, the established preventive maintenance schedules, CCTV inspections, and continued
odor control provide an increased public safety margin for minimizing wastewater spills which
have an impact on public health.
Additional public safety measures include security at outlying facilities such as pump stations
where cyber locks and CCTV cameras have been installed for surveillance. IT departments are
also investing resources into protecting their internal files and servers from any outside attempts
to disrupt operations.
Resilience Resiliency measures are in place in OC wastewater systems through contingency planning, system
redundancy, and other factors which provide options to wastewater agencies during potentially
catastrophic events. These types of events primarily include earthquakes, significant rainstorms,
and wildfires. In the last five years there have been several earthquakes in OC, though none
significant enough to affect any wastewater facilities. Seismic evaluations have been performed in
recent years to study risks associated with active faults, liquefaction, and lateral sliding to other
structures and buildings.
In January 2017, the region experienced a strong rainstorm which pushed many wastewater
treatment plants close to capacity limits, but ultimately no incidents of significance were reported.
In most rainfall events, OC wastewater agencies can utilize diversion structures to redirect flows
and store peak flows prior to treatment. Wildfires can have an indirect effect on wastewater
facilities due to emergency power utility shutdowns; however, wastewater facilities that require
power tend to be equipped with backup generation systems on-site or generator connections.
At several OC wastewater treatment facilities, gaseous byproducts from the digester process are
used as fuel for resilient power generation as well as battery storage systems to reduce peak grid
demands. To evaluate long term environmental impacts, some OC wastewater agencies have
completed climate resiliency studies evaluating risks associated with various hazards such as
wildfires, flooding, extreme temperatures, sea level rise, and tsunamis.
Resilience also calls for contingency planning for equipment failure and other condition-related
issues. For example, field crews have established plans to bypass pump stations in the event those
pump stations cannot be operated normally due to problems with sewer force mains. These plans

68
include live drills where crews perform a full bypass of the pump station as practice to be familiar
with the needed resources and time.
Innovation
On a limited basis, OC wastewater agencies are installing polymer concrete manholes to eliminate
frequent maintenance due to concrete corrosion. OC wastewater agencies are also using locking
composite manhole frames and covers in some locations, because of resistance to corrosion,
worker safety (lighter lifting), and locking resistance to vandalism.
At specific agencies, OC San has been using centrifuges to thicken sludge and increase digester
efficiency as well using food waste and thermophilic digestion to expand methane gas generation.
SOCWA has also improved digester gas production through biocatalyst addition and is also
studying new technologies for biosolids disposal. SMWD is considering using pasteurization for
disinfection, granular sludge for secondary treatment, high combustion temperature thermal sludge
processing, and use of battery storage in conjunction with solar panel installations at remote
facilities.
Some OC wastewater agencies are using Design-Build for project delivery where appropriate and
favorable. Traditional Design-Bid-Build continues to be the dominant project delivery method.

69
Water Supply
OCWD Reverse Osmosis Array, Fountain Valley, CA
Orange County’s (OC) system of water providers comprises thirty-two (32) special districts and
cities. For access to imported water from the State Water Project (SWP) there are three (3) OC
cities – the City of Anaheim, City of Fullerton, and City of Santa Ana – and the Municipal
Water District of Orange County (MWDOC) are member agencies of Metropolitan Water
District of Southern California (MWD) and receive water from the SWP and Colorado River
Aqueduct in varying quantities. The other twenty-eight (28) special districts and cities in OC are
members of MWDOC and are represented by MWDOC at MWD. Additionally, the Orange
County Water District (OCWD) manages the OC groundwater basin which is under the majority
of northern and central county and provides water to several cities in its service area.
Capacity Approximately two-thirds of OC water supplies are from local sources (i.e., groundwater basin,
recycled water, and surface water), with the balance of supplies imported from two main sources
previously referenced: (1) the Sacramento and San Joaquin Rivers through the State Water
Project, and (2) the Colorado River via the Colorado River Aqueduct. Water supply sources for
areas within OC differ. North and central OC satisfy 75 percent of the water demands from the
basin and can also replenish the basin with local and imported water sources, while the majority
(~75 percent or higher depending on conditions) of south OC water supplies are imported from the
MWD sources (due to a lack of available groundwater).

70
Current water supplies meet average condition demands, but water supply sources have been
stressed during drought years. The Colorado River Basin has been in a drought since 2000 and
climate change continues to reduce snowpack volume. While MWD storage is generally in good
shape state-wide, local storage is limited mainly by a lack of available locations for large-scale
storage facilities and the sustainable rate of withdrawing groundwater supply.
Conservation continues to play a significant role in reducing OC water demands. In 2015, 125
gallons per capita per day (GPCD) in total potable water usage was achieved by the Orange County
20x2020 Regional Alliance of water agencies due in large part to drought conservation efforts. In
south OC, agencies and cities have invested significantly in the conversion of outdoor and other
potable water use to recycled water use and as a result have successfully reduced regional reliance
on imported water supplies. In 2020, OC water demands have fallen even further to 109 GPCD.
Condition The water supply infrastructure (pipelines, reservoirs, pumping stations, etc.) in OC is in generally
good and reliable condition. For example, the number and frequency of leaks continue to be lower
than industry averages. Several rehabilitation projects for the imported water system have been
completed within the past 5 years and system reliability has improved.
OC water agencies have made significant investments in their distribution systems as well, with
several capital improvements and rehabilitation projects completed over the last 5 years. These
projects have helped to maintain the overall condition of aging city and agency water systems.
Each year more infrastructure approaches its original design life, causing rehabilitation needs to
generally increase. OC water agencies continue to undergo robust planning and infrastructure
replacement efforts to maintain and improve system conditions. Rehabilitation programs have
been successful in utilizing available trenchless technologies such as cured-in-place pipe to extend
the useful life of pipelines, reduce public impacts, and lower construction costs.
The Mesa Water District (Mesa Water®) Pipeline Integrity Program (PiP) successfully addresses
the industry-wide issue of renewing and replacing water system pipes in an economical, effective,
and timely manner. Through this award-winning, innovative program, Mesa Water uses a
condition-based approach to determine a pipe’s useful life by conducting non-destructive and
destructive testing. Through PiP testing data, Mesa Water has demonstrated that its pipelines’
remaining useful life is estimated to be 142 years, which is saving the district and its ratepayers an
estimated $230 million dollars over a 30-year timeframe.
Funding Current revenues and funding are adequate to support planned expenditures for OC water systems.
However, imported water rates are currently under review and subject to increase due to recent
revenue shortfalls. Funding to design, build, operate, maintain, rehabilitate, and replace facilities
comes primarily from local user rates and charges. All OC water agencies have authority to enact
and collect rates and user fees. Most OC water agencies also receive a share of property tax
revenue.
When typical revenue sources are inadequate major capital projects can be funded in a variety of
ways. Some OC water agencies may issue certificates of participation, or repayment obligations

71
based on a lease or installment sale agreement. However, alternative funding is sometimes needed
for the implementation of newer technology and innovative projects. In recent years, California
voters have supported bonds for drinking water infrastructure. In 2014, Proposition 1 provided
$7.5 billion in water bonds, including $520 million to improve water quality, $900 million for
projects that prevent or clean up contamination of groundwater, and $725 million for water
recycling and advanced water treatment technology projects. Additionally, in June 2018,
California voters approved Proposition 68 which authorized $4 billion in bonds for, among other
things, water quality and supply projects. The benefits from these ballot measures have not yet
been fully realized as projects are still underway, and funding has yet to be distributed. A
combination of local revenues and State bonds are expected to be adequate to support OC’s
planned water system improvements for the next 5 years.
Future Need North OC is largely developed with only a few areas with available land for further development.
However, redeveloping single family neighborhoods and/or industrial land uses to multi-family
dwelling units provides space for further population growth. In south OC, major developments are
under construction, and more are planned soon. These trends have resulted in the continuous
regional population growth of approximately 5 percent over the past 10 years with current
projections suggesting similar growth continuing for the next 5 to 10 years. Future per capita water
demands are forecasted to be flat or slightly declining given continued conservation efforts and
new development requirements.
For many years, Orange County Water Agencies have been investing in securing additional
water supplies locally to decrease dependence on imported water. Developing additional local
water supply sources will remain a focus of OC water agencies over the next 5 years to address
future droughts, climate change, and other factors influencing future water supply shortages.
Several local water supply projects under consideration in and near OC will increase local potable
and recycled water supplies.
Implementing comprehensive asset management programs that include condition assessment of
existing infrastructure and prioritization of their rehabilitation and/or replacement remains a
priority for OC water agencies over the next 5 years. Most agencies have an annual pipeline
replacement program and a list of other infrastructure that need to be replaced or rehabilitated.
This kind of system maintenance will continue for years to come.
Operation and Maintenance One challenge facing water providers with groundwater supplies is the presence and regulation of
per- and polyfluoroalkyl substances (PFAS) in the groundwater. PFAS are a group of
manufactured chemicals found in numerous products, such as non-stick coatings and fire-fighting
foams. They are especially resistant to degradation in the environment and have been accumulating
in various groundwater basins across the US since the 1940s. There is some evidence of health
risks with long term exposure and significant accumulation in the body.
Currently there are fifty-five (55) production wells shut down for eleven (11) OC groundwater
producers in response to detected PFAS levels in OC’s groundwater basin. In the short term, the
affected well supplies are being replaced with additional imported water supplies (at added

72
costs). OC water agencies are responding and taking steps to operate and maintain their production
water wells to deliver PFAS-free potable water to OC residents and businesses and implement
treatment systems to restore the original groundwater production.
Public Safety OC water agencies strive to deliver the best water quality possible by using commercially available
water quality sensors to monitor changes and maintain the quality standards. All agencies that
responded have dedicated safety officers and strict safety protocols to ensure that the infrastructure
is operational, and employees work within all safety regulations.
In recent years, water contamination detection has become a significant public safety concern for
water agencies. Newly discovered contaminants such as PFAS have become a substantial threat.
Water agencies are taking several steps to ensure public safety including extensive and continuous
groundwater testing, investment in research of new treatment methods, and design and
construction of treatment facilities to remove contaminant(s).
Another threat to the water supply falls into the broad category of seismic activity. Within the last
5 years, most agencies have taken steps to protect their facilities from earthquakes and other natural
disasters. Additionally, OC water agencies recognize wildfires as a serious public safety threat and
maintain required water pressure in the distribution system as well as adequate water in reservoirs
for fire suppression. Per EPA requirements all agencies must conduct a vulnerability assessment
and develop an Emergency Response Plan to address potential disasters, including a bioterrorism
attack.
Resilience OC water agencies continue to increase water system resiliency by investing in new and additional
water supply sources, increasing wastewater recycling capabilities, and upgrading existing
infrastructure to prevent or protect against significant multi-hazard events. In doing so, OC water
agencies increase their ability to recover quickly following an emergency and resume critical
services with minimum disruption to public safety, health, the economy, and national security.
The groundwater basin serving north, and central OC is continually replenished with high quality
recycled water through Groundwater Replenishment System (GWRS) operated by OCWD. The
GWRS Final Expansion Project is currently under construction to increase its production from
100 million gallons per day (MGD) to 130 MGD.
Several other local water supply projects are under consideration in or near OC that will contribute
to increase resiliency in the region. They include: Doheny Ocean Water Desalination Project (2
- 15 MGD); Poseidon Huntington Beach Ocean Water Desalination Project (50 MGD); San
Juan Watershed groundwater project (8 MGD); MWD Regional Recycled Water Program
(in Carson, CA; up to 150 MGD primarily in Los Angeles County). These projects all offer
increased water reliability and reduction in the need for imported supplies.
Additionally, local water agencies have implemented and continue to grow their recycled water
production in multiple facilities throughout south OC. For example, the recently constructed
Trampas Canyon Reservoir will create winter storage for recycled water (when demands are

73
low) that could be used during dry, hot months (when demands are high) for construction and
landscape irrigation. Trampas Canyon Reservoir will capture and store recycled water from the
Chiquita Water Reclamation Plant and other recycled water supply sources from the Santa
Margarita Water District (SMWD) and the City of San Clemente. Other future upgrades and
expansion of recycled water facilities are in the planning stages and will be implemented in the
next 5-10 years.
Due to its award-winning Mesa Water Reliability Facility (MWRF), Mesa Water provides 100%
locally-reliable water supplies to its service area, and is the only Orange County water provider
that meets water demand exclusively from local groundwater supplies. The deep-water wells
located at the MWRF (pronounced “merph”) pump raw water from approximately 1,000 feet
underground. The water is soft and meets all water quality standards, but contains an amber tint
caused by nature. A state-of-the-art nanofiltration technology treatment process removes the amber
tint while sand separators and other filters remove inorganic materials. Chloramines are used to
disinfect the water which then moves into the on-site reservoir before being pumped into the Mesa
Water distribution system.
Innovation
The GWRS is the world's largest water purification system for indirect potable reuse. The
treatment system process train includes the state-of-the-art microfiltration, reverse osmosis, and
ultraviolet oxidation/disinfection technologies. Other water treatment innovations in OC include
PFAS/PFOS treatment facilities being designed and installed in Yorba Linda Water District,
Anaheim, and other OC cities.
The City of Anaheim implemented Design-Build to install its PFAS treatment plants as well as to
expedite its pipeline replacement program. The City of Anaheim is also conducting pilot programs
for advanced metering infrastructure (AMI) and leak detection.

74
Methodology: 2021 Review of Orange County’s
Infrastructure
To build widespread infrastructure literacy of the public infrastructure facilities
and their impacts on the quality of life and economic vitality in Orange County.
Capacity:
• Review the infrastructure’s capacity to meet current and future demands.
Condition:
• Review the infrastructure’s existing or near future physical condition.
Funding:
• Review the current level of funding (from all levels of government and the
private sector) for the infrastructure category and compare it to the estimated
funding need.
Future Need:
• Review the cost to improve the infrastructure and determine if future funding
prospects will be able to meet the need.
Operation and Maintenance:
• Review the owners’ ability to operate and maintain the infrastructure properly
and determine that the infrastructure is following government regulations.
Public Safety:
• Review to what extent the public’s safety is jeopardized by the condition of
the infrastructure and what the consequences of failure may be.
Resilience:
• Review the infrastructure system’s capability to prevent or protect against
significant multi-hazard events and the ability to expeditiously recover and
resume critical services with minimum disruption to public safety and health,
the economy, and national security.
Innovation:
• Review the implementation and strategic use of innovative techniques and
delivery methods.

75
Roster: 2021 Review of Orange County’s Infrastructure
Executive Committee:
• Ronald Stein, Executive Chairman of the 2021 O.C. Infrastructure Review Project, PTS
Advance
• Kevin Haboian, HNTB
• Steve Bucknam, Bucknam & Associates
• Sunny Jiang, UCI Civil and Environmental Engineering
• Susan Barua CSUF College of Engineering and Computer Science
• Allen Yourman, Diaz Yourman & Associates
Committee Memberships:
Bridges
• Bo Burick, Mark Thomas
• Erik Espinoza, Fluor
• Contributors
o Adnan Maiah, Caltrans District 12
o Ben Nanjappa, Caltrans District 12
o Ashley Penalver, County of Orange
o Co Phung, County of Orange
Ground Transportation
• Tom Kim, HDR
• Dr. Hakob Avetisyan, California State University at Fullerton
• Contributors
o Juliet Su, TCA
o Valerie McFall, TCA
o Kevin Onuma, Orange County Public Works
o Ashley Penalver, County of Orange
o Ryan Chamberlain, Caltrans District 12
o Monica Benavides, Caltrans District 12
o Angela Madison, Caltrans District 12
o Jim Beil, OCTA
o Kia Mortazavi, OCTA
o Kurt Brotcke, OCTA
o Warren Whiteaker, OCTA
John Wayne Airport
• Barry Rondinella JWA
• Nick Dinger JWA

76
• Rick Francis JWA
• Eric Freed JWA
Cable Communications
• Alicia Berhow, Spectrum
• Kristen Camuglia, Cox Communications,
• Steve Lynn, Moran Utility Services
• Contributors
o California Cable and Telecommunications Association (CCTA)
o National Internet & Television Association (NCTA)
Electrical
• Ronald Stein, PTS Advance
• Dr. Hakob Avetisyan, California State University at Fullerton
• Todd Royal, Consultant
Levees
• Penny Lew, Orange County Public Works
• Dr. Xenia Wirth, California State University at Fullerton
• Contributors
o James Tyler from OC Public Works
o Ariel Corpuz from OC Public Works
o Darla Linan from OC Public Works
Natural Gas
• Tina Javid, SoCalGas
• Mehrshad Ketabdar, SoCalGas
• Dr. Hakob Avetisyan, California State University at Fullerton
• Todd Royal, Consultant
• Contributors
o Customer Outreach Team provided the approved photo.
o Director of our Resource Management team provided the investment dollars
specific to Orange County.
o Gas System staff provided safety information.
o Marketing Team provided our large customer profile (we focused on industries)
o Customer Service Staff provided information on the number of customers and
CCF usage.
o Tax Department provided the miles of distribution pipe.
o Transmission Department provided the miles of Transmission pipe running
through Orange County.
o Program Manager for the Mobile Home Park Program provided the mobile home
park information.
o Aspire 2045 information came from our policy team and was proofed by our
external communications team.

77
Oil
• Ronald Stein, PTS Advance
• Dr. Hakob Avetisyan, California State University at Fullerton
• Todd Royal, Consultant
School District Facilities
• Steve Bucknam, Bucknam & Associates
• James Bucknam, PJHM Architects
• Char Yarnall PJHM Architects
• Contributors
o Jerry Marchbank, Coast Community College District
o Nina Boyd, Orange County Department of Education
Solid Waste & Recycling
• Tom Koutroulis, Orange County Waste & Recycling
• Dr. Xenia Wirth, California State University at Fullerton
• Contributors
o Ruth Wardwell (OCWR)
o David Tieu (OCWR)
Surface Water Quality
• Dave Mercier, Michael Baker International
• Ankita Vyas, Michael Baker International
• Dr. David A. Jaffe, David Evans & Associates
• Josh Ruiz, Fuscoe Engineering
• Contributors
o Kevin Onuma, Orange County Public Works
o Amanda Farr, Orange County Public Works
o Kimberly Buss, Orange County Public Works
o Tracy Ingebrigtsen, Orange County Public Works
Wastewater
• Troy Edwards, Orange County Sanitation District
• Dr. Jeff Kuo, California State University at Fullerton
• Tricia Butler, Santa Margarita Water District
• Dickie Fernandez, Orange County Sanitation District
• Contributors
o Amber Baylor, South Orange County Wastewater Authority (SOCWA)
o Marc Serna, South Coast Water District (SCWD)
o Mike Dunbar, Emerald Bay Services District (EBSD)
o Rodney Woods, Moulton Niguel Water District

78
Water Supply
• Troy Edwards, Orange County Sanitation District
• Dr. Jeff Kuo, California State University at Fullerton
• Kevin Saleh, Lee+Ro Water Infrastructure Engineers
• Safa Kamangar, David Evans and Associates
• Contributors
o Craig Parker, City of Anaheim
o Rudy Rosas, City of Santa Ana
o John Kennedy, Orange County Water District (OCWD)
o Charles Busslinger, Municipal Water District of Orange County (MWDOC)
o Tricia Butler, Santa Margarita Water District (SMWD)
o Celeste Carrillo, Mesa Water District