Embed Size (px)
Citation preview
ORD
CENT
RAL Q
UEEN
SLAN
DSO
UTHE
RN Q
UEEN
SLAN
DNO
RTHE
RN N
SWLI
VERP
OOL P
LAIN
S
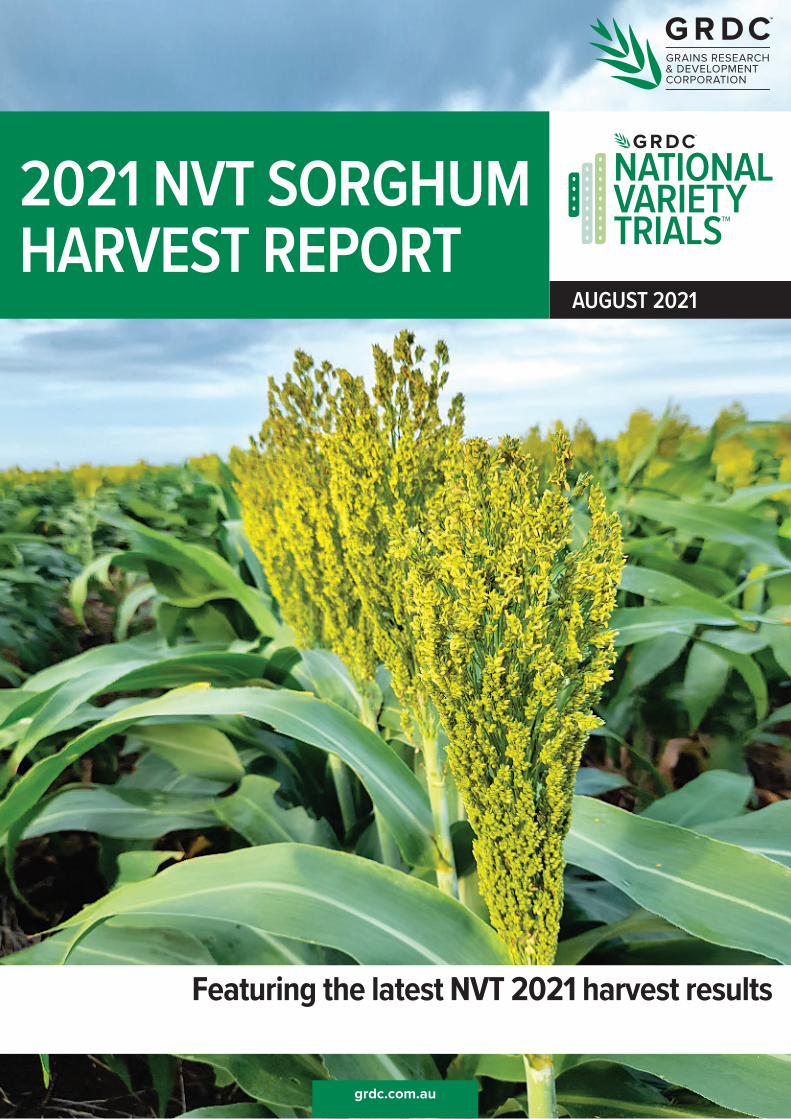
Featuring the latest NVT 2021 harvest results
2021 NVT SORGHUM HARVEST REPORT
AUGUST 2021
Title: 2021 NVT Sorghum Harvest Report
ISSN: 2653-2077 (online)
Published: August 2021
Acknowledgements: Sincere thanks to the following contributors, whose time and industry knowledge have made this publication possible:
Tracey Shatte, Queensland Department of Agriculture and Fisheries
Numerous breeding companies and their representatives
© Grains Research and Development Corporation 2021
This book is copyright. Except as permitted under the Copyright Act 1968 (Commonwealth) and subsequent amendments, no part of this publication may be reproduced, stored or transmitted in any form or by any means, electronic or otherwise, without the specific written permission of the copyright owner.
GRDC contact details: Ms Maureen Cribb Integrated Publications Manager PO Box 5367 KINGSTON ACT 2604
Email: [email protected]
Design and production: Coretext, www.coretext.com.au
COVER: NVT 2021 sorghum trial at Kilcummin, Queensland. PHOTO: Eurofins Agrisearch
DISCLAIMER: Any recommendations, suggestions or opinions contained in this publication do not necessarily represent the policy or views of the Grains Research and Development Corporation. No person should act on the basis of the contents of this publication without first obtaining specific, independent professional advice.
The Grains Research and Development Corporation will not be liable for any loss, damage, cost or expense incurred or arising by reason of any person using or relying on the information in this publication.

32021 NVT SORGHUM HARVEST REPORT
TABLE OF CONTENTS
This guide can be downloaded to your computer or tablet at: grdc.com.au/nvt-sorghum-harvest-report
BELOW MEAN ABOVE
LEGEND: MEAN VARIETY YIELD PERFORMANCE
Variation to mean yield illustrated by colour gradient from below (red) to above (green)
INTRODUCTION 4
LIVERPOOL PLAINS, NEW SOUTH WALES 9
NORTHERN NSW 13
SOUTHERN QUEENSLAND 19
CENTRAL QUEENSLAND 25
ORD, WESTERN AUSTRALIA 31
FURTHER INFORMATION 34
42021 NVT SORGHUM HARVEST REPORT
INTRODUCTION
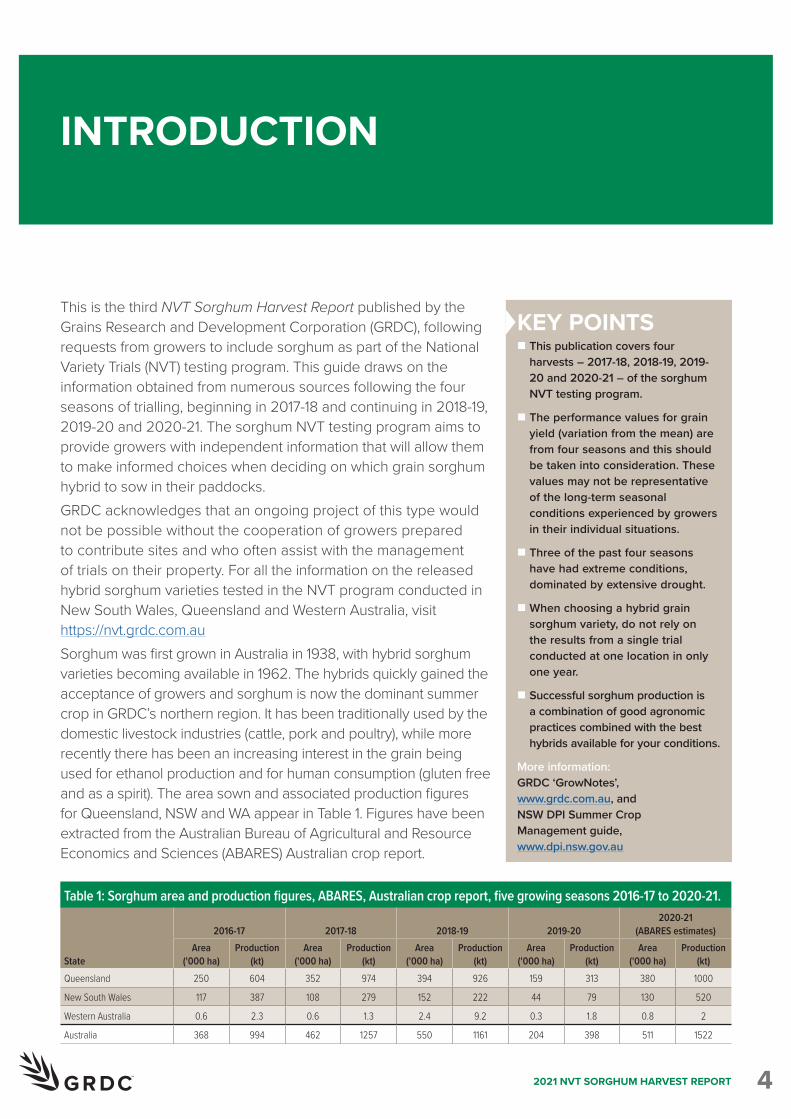
This is the third NVT Sorghum Harvest Report published by the Grains Research and Development Corporation (GRDC), following requests from growers to include sorghum as part of the National Variety Trials (NVT) testing program. This guide draws on the information obtained from numerous sources following the four seasons of trialling, beginning in 2017-18 and continuing in 2018-19, 2019-20 and 2020-21. The sorghum NVT testing program aims to provide growers with independent information that will allow them to make informed choices when deciding on which grain sorghum hybrid to sow in their paddocks.GRDC acknowledges that an ongoing project of this type would not be possible without the cooperation of growers prepared to contribute sites and who often assist with the management of trials on their property. For all the information on the released hybrid sorghum varieties tested in the NVT program conducted in New South Wales, Queensland and Western Australia, visit https://nvt.grdc.com.au Sorghum was first grown in Australia in 1938, with hybrid sorghum varieties becoming available in 1962. The hybrids quickly gained the acceptance of growers and sorghum is now the dominant summer crop in GRDC’s northern region. It has been traditionally used by the domestic livestock industries (cattle, pork and poultry), while more recently there has been an increasing interest in the grain being used for ethanol production and for human consumption (gluten free and as a spirit). The area sown and associated production figures for Queensland, NSW and WA appear in Table 1. Figures have been extracted from the Australian Bureau of Agricultural and Resource Economics and Sciences (ABARES) Australian crop report.
Table 1: Sorghum area and production figures, ABARES, Australian crop report, five growing seasons 2016-17 to 2020-21.
2016-17 2017-18 2018-19 2019-202020-21
(ABARES estimates)
StateArea
('000 ha)Production
(kt)Area
('000 ha)Production
(kt)Area
('000 ha)Production
(kt)Area
('000 ha)Production
(kt)Area
('000 ha)Production
(kt)Queensland 250 604 352 974 394 926 159 313 380 1000
New South Wales 117 387 108 279 152 222 44 79 130 520
Western Australia 0.6 2.3 0.6 1.3 2.4 9.2 0.3 1.8 0.8 2
Australia 368 994 462 1257 550 1161 204 398 511 1522
KEY POINTSn This publication covers four
harvests – 2017-18, 2018-19, 2019-20 and 2020-21 – of the sorghum NVT testing program.
n The performance values for grain yield (variation from the mean) are from four seasons and this should be taken into consideration. These values may not be representative of the long-term seasonal conditions experienced by growers in their individual situations.
n Three of the past four seasons have had extreme conditions, dominated by extensive drought.
n When choosing a hybrid grain sorghum variety, do not rely on the results from a single trial conducted at one location in only one year.
n Successful sorghum production is a combination of good agronomic practices combined with the best hybrids available for your conditions.
More information: GRDC ‘GrowNotes’, www.grdc.com.au, and NSW DPI Summer Crop Management guide, www.dpi.nsw.gov.au

52021 NVT SORGHUM HARVEST REPORT
INTRODUCTION
Table 2: Sorghum NVT regions and production zones. State Region Production zone BoundaryQueensland Central Queensland Central Queensland North North of the Capricorn Highway
Queensland Central Queensland Central Queensland South South of the Capricorn Highway
Queensland Southern Queensland Southern Queensland East East of Millmerran, Dalby, Chinchilla Road
Queensland Southern Queensland Southern Queensland West West of Millmerran, Dalby, Chinchilla Road
New South Wales Northern NSW Northern NSW East East of Newell Highway
New South Wales Northern NSW Northern NSW West West of Newell Highway
New South Wales Liverpool Plains Liverpool Plains East East of the Boggabri to Coolah Road
Western Australia Ord Ord Ord River District
SUMMARYPhase 1 of the sorghum NVT program began in July 2017 and encompassed four trialling regions and seven production zones. The program was continued, capturing two summer cropping seasons, 2017-18 and 2018-19, with the regions expanded in the second year to include Kununurra in WA. The resultant five regions are Central Queensland, Southern Queensland, Northern NSW, Liverpool Plains and the Ord. These regions are split into eight production zones: Central Queensland North, Central Queensland South, Southern Queensland East, Southern Queensland West, Northern NSW East, Northern NSW West, Liverpool Plains East and the Ord (Table 2).Following support from growers, the program was conducted again in 2019-20 and 2020-21. Unfortunately, several trials have had to be discarded in each season as they were not sown or did not meet the rigorous standards as set by the NVT protocol. There were 15 trials completed in the 2017-18 season, 10 in the 2018-19 season, six in the 2019-20 season and 19 in the 2020-21 season. In total, 50 trials have been deemed acceptable and meet the standards set out by the NVT protocols. Individual trial site locations appear in Figure 1 for each production zone and Table 3 on page 6.
SEASON OVERVIEWThis guide covers four summer cropping seasons: 2017-18, 2018-19, 2019-20 and 2020-21. The climatic conditions experienced leading up to and during the growing periods varied greatly among and within the five trialling regions and four growing seasons. Improved subsoil moisture and general growing conditions were experienced across the testing sites for the 2020-21 season. NSW continued to have favourable conditions following a wet winter. These good conditions enabled sowing to start as early as 9 September in Northern NSW and be completed by 24 October on the Liverpool Plains.Southern Queensland, experiencing a relatively dry winter, had a slow start to sowing. After late-winter rainfall in the Western Downs, the Condamine trial was sown on 19 September. However, the ensuing dry period halted sowing until late December rainfall. Sowing of the remaining trials started on 29 December and was completed by 14 January 2021.Central Queensland benefited from early summer rainfall during late December and early January. This ensured all trials were sown early, starting on 18 January and completing by 21 January.The relatively improved conditions resulted in 19 trials, the most in any year, suitable for inclusion in the NVT series (Table 3). Some growers experienced rain before harvest and were forced to dry their grain. Fortunately, this did not occur in any of the sorghum trials.Information relevant to a specific trial site can be accessed from the NVT website (https://nvt.grdc.com.au).

62021 NVT SORGHUM HARVEST REPORT
INTRODUCTION
Table 3: Sorghum NVT environments* (year x location).Production zone Environments 2017-18 season 2018-19 season 2019-20 season 2020-21 seasonCentral Queensland North 8 Clermont, Capella, Duaringa Clermont, Dysart Clermont, Kilcummin, Dysart
Central Queensland South 4 Springsure Rolleston Theodore, Rolleston
Southern Queensland West 6 Miles, Condamine, Billa Billa Billa Billa Condamine, Billa Billa
Southern Queensland East 9 Bongeen, Pampas, Dalby Bongeen, Pampas, Dalby Pampas Pampas, Dalby
Northern NSW West 5 Garah Garah Garah, Burren, Mallowa
Northern NSW East 8 Bellata, Pallamallawa North Star A&B, Pallamallawa North Star, Pallamallawa, Narrabri
Liverpool Plains 7 Mullaley, Caroona Mullaley Breeza Mullaley, Caroona, Premer
Ord 3 Kununurra Kununurra Kununurra
Total 50 15 10 6 19* Environment refers to the unique combination of year and location.
TRIAL ATTRITIONIndividual trials can be excluded from the final NVT database for either statistical or agronomic reasons. If there is no genetic variance – that is, the grain yield of individual hybrids in a trial do not differ significantly – the trial will not be included in any further analysis. An audit has been carried out on trials grown in the regions over the past four seasons. Auditors were required to score more than 25 parameters and determine if an individual site met the stringent requirements of NVT. Trials could be deemed unsuitable for inclusion on an agronomic basis for any of the following reasons: ■ variable biomass across the site;■ uneven establishment across the site or along a row; ■ presence of disease, animal or insect damage; and■ the presence of weeds at populations that would affect grain yield. Trial sites also had to be representative of their region and trial sowing times needed to match those of surrounding crops.In 2020-21 the above-average season meant all trials were sown; three of these trials were abandoned, resulting in 19 trials deemed acceptable to be included in the NVT multi-environment analysis.
TRIAL SITESEach production zone aims to have three to four trial sites with a single time of sowing. Each trial site should:■ ideally have a soil moisture profile greater than 80 per cent of field capacity with no less than one
metre of wet soil;■ have come out of long fallow from winter cereal; ■ have a soil type representative of the zone; and ■ have row spacings that follow industry standards. Successful trial sites within each production zone in each season appear in Table 3.
NUMBER OF HYBRIDS IN EACH TRIALBreeding companies submit hybrids for inclusion in the NVT trials that are suitable for the environments under evaluation. Grain sorghum hybrids have been submitted by the following companies: Barenbrug, Pacific Seeds, Pioneer Seeds, Radicle Seeds and S&W Seed Company. The performance reporting criteria require that hybrids must appear in two years of testing.
TRAITS INVESTIGATEDSeveral traits are assessed within trials including grain yield (tonnes per hectare), screenings (per cent <2 millimetres) and test weight (kilograms per hectolitre). If an NVT trial is sown at a specific location, the resulting combination of year and location is called an environment.

72021 NVT SORGHUM HARVEST REPORT
INTRODUCTION
SERVICE PROVIDERSThe trials were managed by four service providers: NSW Department of Primary Industries, Kalyx Australia, Eurofins Agroscience Services and the Northern Australia Crop Research Alliance (NACRA).
STATISTICAL SUPPORTThe design, analysis and interpretation of results were managed by GRDC’s Statistics for the Australian Grains Industry (SAGI) project team. Over the four summer cropping seasons sampled, a combined analysis of environments (year by location combinations) was completed.
GRAIN YIELDFollowing harvest, trial grain yields are converted to tonnes per hectare (t/ha) and adjusted for grain moisture. Predicted grain yield values for selected sorghum hybrid varieties from trials conducted over the summer growing seasons 2017-18, 2018-19, 2019-20 and 2020-21 are reported in the regional tables.
GRAIN QUALITYResults for screening (%<2.0mm) and hectolitre weight (kg/hL) are reported in the regional tables. The range in both these parameters obtained for individual hybrids across environments demonstrates the difficult seasons growers have experienced.The cause of small grain and low test weight in sorghum is usually associated with poor grain fill immediately after flowering has finished. This represents a relatively short period of time of around 10 to 15 days. The primary reason for screenings is moisture stress in this critical growth stage; other factors include diseases such as charcoal rot, heat stress, chemical drift and insect damage. Moisture stress and heat stress can occur independently but often team up.Test weight is an indicator of grain quality and, from a yield standpoint, is irrelevant. High test weight grain usually has a high amount of starch and a hard endosperm.
INTERPRETING RESULTSBetter outcomes are achieved when decisions are based on robust information. The information presented in this publication comes from the past four seasons and has undergone a rigorous auditing process and statistical analysis. A factor analytic (FA) mixed model approach is used in the multi-environment trial (MET) analysis conducted by GRDC, supported by the SAGI program. This approach generates long-term MET values for hybrids at an individual trial level. This format provides more detailed data to better understand the performance of a hybrid over several years at the individual trial/environment level, rather than just a single averaged value.The results represent the environmental conditions experienced but may not be typical of a given region. Therefore, a grower must decide the relevance of the four testing seasons compared with the long-term seasonal conditions that might be experienced before selecting any variety to sow. The predictive value of this guide will improve as more trials and more years are added to the sorghum NVT database. When assessing a hybrid’s performance, it is imperative to consider the seasonal effects and make particular note of the number of comparisons for each hybrid. Growers are best equipped to interpret these results in relation to rainfall (timing, amount and intensity), temperature (extremes and the length of each event) and local environmental factors that affect a plant’s development. As well as the predicted grain yield values that appear in the data tables, more detailed information can be accessed from the GRDC NVT website (https://nvt.grdc.com.au).
MORE INFORMATIONThe full set of parameters that were recorded appear on the NVT website (https://nvt.grdc.com.au).

82021 NVT SORGHUM HARVEST REPORT
INTRODUCTION
WE WANT YOUR FEEDBACK Complete a short online survey to tell us how you use NVT results.grdc.com.au/harvest-report-feedback
Table 4: Sorghum hybrid details.Company Hybrid Grain colour Maturity Target environment Tillering Standability Midge rating*
Radicle Seeds Agitator Red Medium/quick NA NA NA 4
Barenbrug HGS-114 Red Medium/quick All regions Moderate-low Very good 6
Pacific Seeds MR-Bazley Red Medium/quick All regions Moderate-high Very good 4
Pacific Seeds MR-Taurus Bright red Medium/quick All regions Moderate Very good 6
S&W Seeds Tanami Red Medium/quick All regions Low Very good 5
Pioneer Hi-Bred Aust Pty Ltd 84A66 Bright red Medium All regions Moderate Very good 7
Pioneer Hi-Bred Aust Pty Ltd 84A75 Red Medium All regions High Excellent 6
Pioneer Hi-Bred Aust Pty Ltd 85G33 Red Medium All regions Moderate-high Excellent 6
Barenbrug Cracka Red Medium All regions Moderate-high Excellent 3
S&W Seeds Gibson Red Medium All regions Moderate 6
Pacific Seeds MR-Buster Red Medium All regions Moderate-high Very good 4
Pacific Seeds Sentinel IG Red Medium Medium to good growing conditions High Average 5
Pacific Seeds Resolute Bright red Medium/long Medium to good growing conditions Moderate Very good 8+
Radicle Seeds Brazen Red Medium/slow NA NA NA 5
Pacific Seeds Halifax Red Long Medium to good growing conditions Moderate Very good 7
Barenbrug Liberty White Long Medium to good growing conditions Moderate-high Good 4NA Not Available*Midge resistance rating: 1 susceptible, 2 low, 4 moderate, 6 very high, 7 high, 8+ excellent. Midge rating is the factor by which a hybrid’s midge resistance exceeds that of a fully susceptible hybrid (rating 1). For example, if it is cost-effective to control two midges/head in a rating 1 hybrid, then cost-effective control in a rating 7 hybrid occurs when there are 14 midges/head. For more information regarding midge resistance ratings contact Tracey Shatte ([email protected]).
HYBRID SELECTIONCommercially available hybrid varieties are listed in Table 4, along with their grain colour, maturity, tillering, standability, target environment and midge ratings.
92021 NVT SORGHUM HARVEST REPORT
ORD
CENT
RAL Q
UEEN
SLAN
DSO
UTHE
RN Q
UEEN
SLAN
DNO
RTHE
RN N
SWLI
VERP
OOL P
LAIN
S
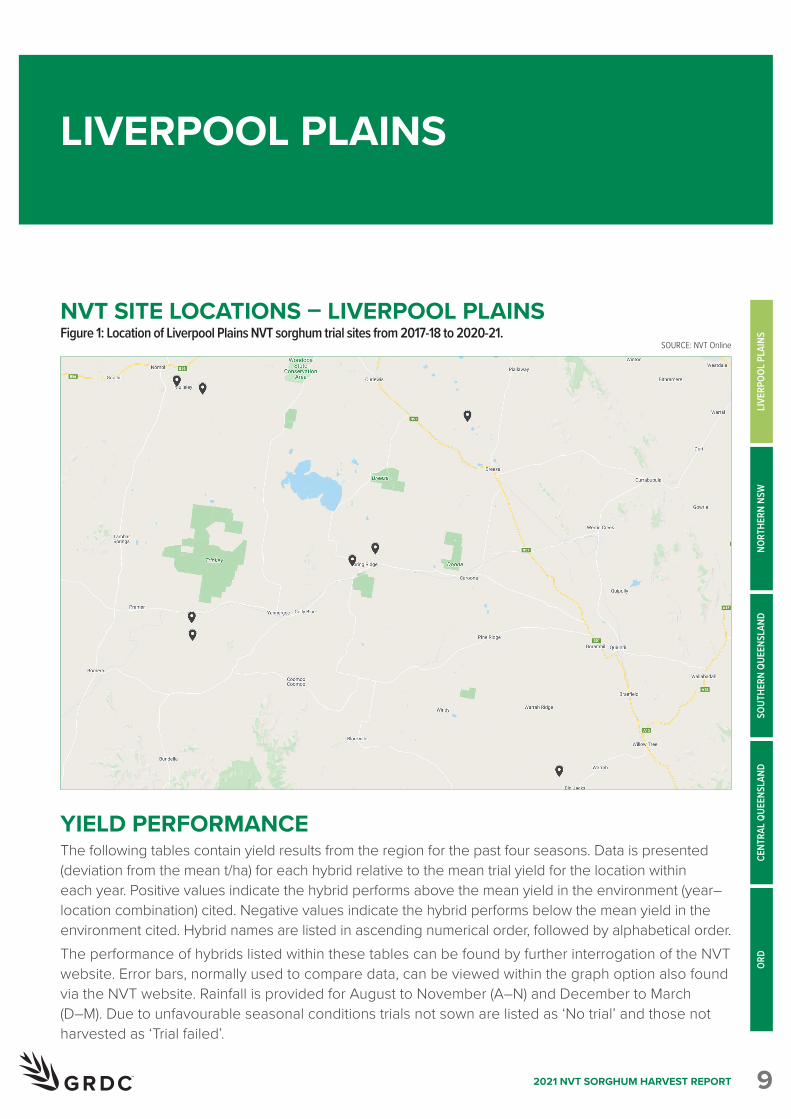
NVT SITE LOCATIONS – LIVERPOOL PLAINSFigure 1: Location of Liverpool Plains NVT sorghum trial sites from 2017-18 to 2020-21.
SOURCE: NVT Online
LIVERPOOL PLAINS
YIELD PERFORMANCE The following tables contain yield results from the region for the past four seasons. Data is presented (deviation from the mean t/ha) for each hybrid relative to the mean trial yield for the location within each year. Positive values indicate the hybrid performs above the mean yield in the environment (year–location combination) cited. Negative values indicate the hybrid performs below the mean yield in the environment cited. Hybrid names are listed in ascending numerical order, followed by alphabetical order. The performance of hybrids listed within these tables can be found by further interrogation of the NVT website. Error bars, normally used to compare data, can be viewed within the graph option also found via the NVT website. Rainfall is provided for August to November (A–N) and December to March (D–M). Due to unfavourable seasonal conditions trials not sown are listed as ‘No trial’ and those not harvested as ‘Trial failed’.
102021 NVT SORGHUM HARVEST REPORT
LIVERPOOL PLAINS
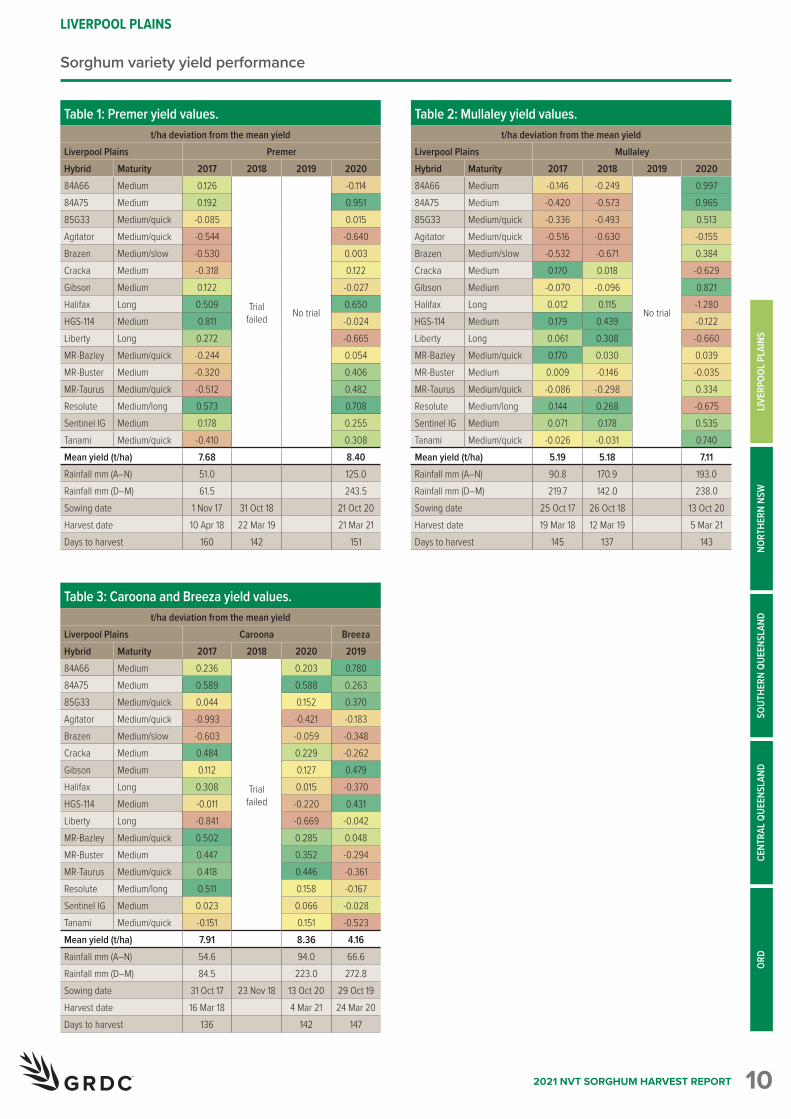
Sorghum variety yield performance
Table 1: Premer yield values.t/ha deviation from the mean yield
Liverpool Plains PremerHybrid Maturity 2017 2018 2019 202084A66 Medium 0.126
Trial failed No trial
-0.11484A75 Medium 0.192 0.95185G33 Medium/quick -0.085 0.015Agitator Medium/quick -0.544 -0.640Brazen Medium/slow -0.530 0.003Cracka Medium -0.318 0.122Gibson Medium 0.122 -0.027Halifax Long 0.509 0.650HGS-114 Medium 0.811 -0.024Liberty Long 0.272 -0.665MR-Bazley Medium/quick -0.244 0.054MR-Buster Medium -0.320 0.406MR-Taurus Medium/quick -0.512 0.482Resolute Medium/long 0.573 0.708Sentinel IG Medium 0.178 0.255Tanami Medium/quick -0.410 0.308Mean yield (t/ha) 7.68 8.40Rainfall mm (A–N) 51.0 125.0Rainfall mm (D–M) 61.5 243.5Sowing date 1 Nov 17 31 Oct 18 21 Oct 20Harvest date 10 Apr 18 22 Mar 19 21 Mar 21Days to harvest 160 142 151
Table 3: Caroona and Breeza yield values.t/ha deviation from the mean yield
Liverpool Plains Caroona BreezaHybrid Maturity 2017 2018 2020 201984A66 Medium 0.236
Trial failed
0.203 0.78084A75 Medium 0.589 0.588 0.26385G33 Medium/quick 0.044 0.152 0.370Agitator Medium/quick -0.993 -0.421 -0.183Brazen Medium/slow -0.603 -0.059 -0.348Cracka Medium 0.484 0.229 -0.262Gibson Medium 0.112 0.127 0.479Halifax Long 0.308 0.015 -0.370HGS-114 Medium -0.011 -0.220 0.431Liberty Long -0.841 -0.669 -0.042MR-Bazley Medium/quick 0.502 0.285 0.048MR-Buster Medium 0.447 0.352 -0.294MR-Taurus Medium/quick 0.418 0.446 -0.361Resolute Medium/long 0.511 0.158 -0.167Sentinel IG Medium 0.023 0.066 -0.028Tanami Medium/quick -0.151 0.151 -0.523Mean yield (t/ha) 7.91 8.36 4.16Rainfall mm (A–N) 54.6 94.0 66.6Rainfall mm (D–M) 84.5 223.0 272.8Sowing date 31 Oct 17 23 Nov 18 13 Oct 20 29 Oct 19Harvest date 16 Mar 18 4 Mar 21 24 Mar 20Days to harvest 136 142 147
Table 2: Mullaley yield values.t/ha deviation from the mean yield
Liverpool Plains MullaleyHybrid Maturity 2017 2018 2019 202084A66 Medium -0.146 -0.249
No trial
0.99784A75 Medium -0.420 -0.573 0.96585G33 Medium/quick -0.336 -0.493 0.513Agitator Medium/quick -0.516 -0.630 -0.155Brazen Medium/slow -0.532 -0.671 0.384Cracka Medium 0.170 0.018 -0.629Gibson Medium -0.070 -0.096 0.821Halifax Long 0.012 0.115 -1.280HGS-114 Medium 0.179 0.439 -0.122Liberty Long 0.061 0.308 -0.660MR-Bazley Medium/quick 0.170 0.030 0.039MR-Buster Medium 0.009 -0.146 -0.035MR-Taurus Medium/quick -0.086 -0.298 0.334Resolute Medium/long 0.144 0.268 -0.675Sentinel IG Medium 0.071 0.178 0.535Tanami Medium/quick -0.026 -0.031 0.740Mean yield (t/ha) 5.19 5.18 7.11Rainfall mm (A–N) 90.8 170.9 193.0Rainfall mm (D–M) 219.7 142.0 238.0Sowing date 25 Oct 17 26 Oct 18 13 Oct 20Harvest date 19 Mar 18 12 Mar 19 5 Mar 21Days to harvest 145 137 143
ORD
CENT
RAL Q
UEEN
SLAN
DSO
UTHE
RN Q
UEEN
SLAN
DNO
RTHE
RN N
SWLI
VERP
OOL P
LAIN
S

112021 NVT SORGHUM HARVEST REPORT
LIVERPOOL PLAINS
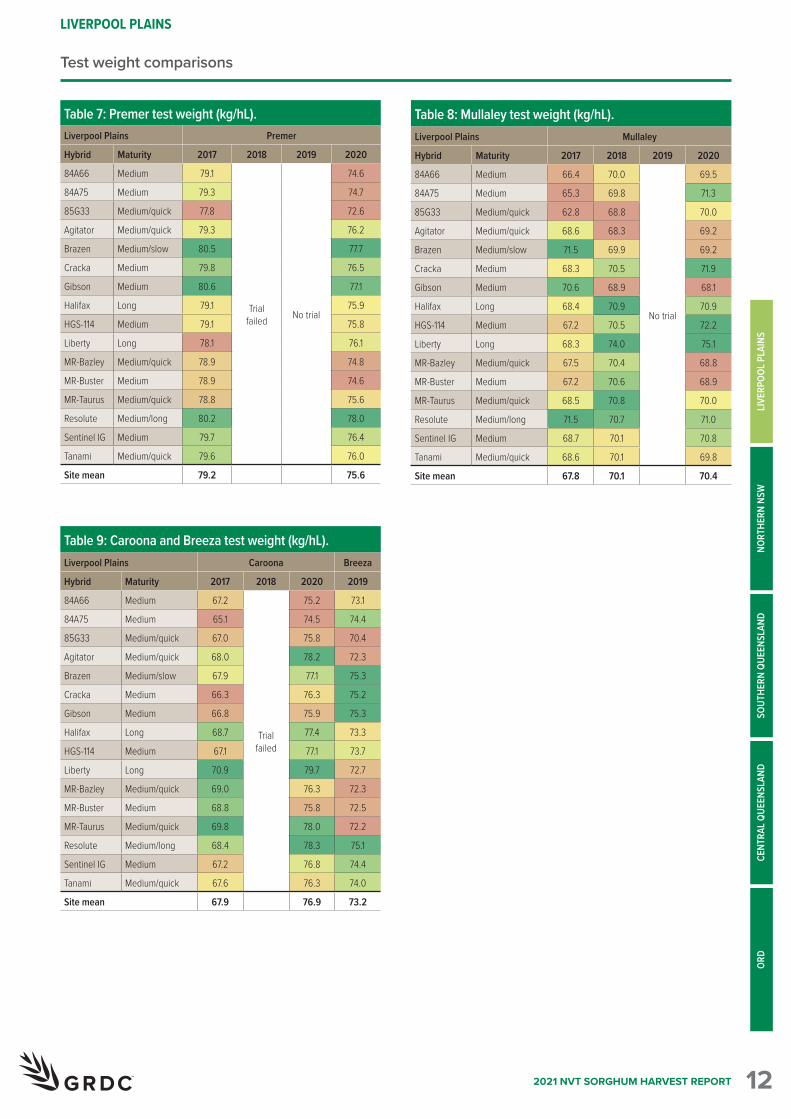
GRAIN QUALITYGrain quality for individual hybrids varies from site to site and from year to year. However, long-term and across-site trends highlight hybrids that can consistently achieve either higher test weights or low grain screenings under a broader range of environments. The grain quality tables of screenings (%<2.0mm) and test weight (kg/hL) contain MET-analysed results for each trial. Due to unfavourable seasonal conditions trials not sown are listed as ‘No trial’ and those not harvested as ‘Trial failed’.
Screenings comparisons
Table 4: Premer screenings (%<2.0mm).Liverpool Plains Premer
Hybrid Maturity 2017 2018 2019 2020
84A66 Medium 3.0
Trial failed No trial
No genetic variance
84A75 Medium 3.5
85G33 Medium/quick 4.1
Agitator Medium/quick 2.9
Brazen Medium/slow 2.4
Cracka Medium 2.6
Gibson Medium 2.7
Halifax Long 2.5
HGS-114 Medium 3.3
Liberty Long 2.1
MR-Bazley Medium/quick 1.6
MR-Buster Medium 2.2
MR-Taurus Medium/quick 2.3
Resolute Medium/long 2.7
Sentinel IG Medium 2.6
Tanami Medium/quick 4.2
Site mean 2.9 0.8
Table 6: Caroona and Breeza screenings (%<2.0mm).Liverpool Plains Caroona Breeza
Hybrid Maturity 2017 2018 2020 2019
84A66 Medium
No genetic variance
Trial failed
2.4 1.9
84A75 Medium 2.7 2.4
85G33 Medium/quick 3.5 3.2
Agitator Medium/quick 2.4 2.1
Brazen Medium/slow 2.9 2.0
Cracka Medium 2.5 1.8
Gibson Medium 3.1 2.8
Halifax Long 2.1 1.7
HGS-114 Medium 2.5 2.3
Liberty Long 2.0 1.6
MR-Bazley Medium/quick 1.9 1.1
MR-Buster Medium 2.3 1.5
MR-Taurus Medium/quick 2.5 1.7
Resolute Medium/long 2.4 1.9
Sentinel IG Medium 2.9 2.2
Tanami Medium/quick 4.3 4.9
Site mean 4.5 2.9 2.3
Table 5: Mullaley screenings (%<2.0mm).Liverpool Plains Mullaley
Hybrid Maturity 2017 2018 2019 2020
84A66 Medium 3.3 3.3
No trial
4.3
84A75 Medium 4.1 3.8 4.5
85G33 Medium/quick 5.6 4.6 4.8
Agitator Medium/quick 3.3 3.3 4.2
Brazen Medium/slow 4.6 3.3 4.5
Cracka Medium 3.9 3.2 4.4
Gibson Medium 4.5 3.7 4.3
Halifax Long 2.8 2.9 4.1
HGS-114 Medium 3.4 3.5 4.3
Liberty Long 2.2 2.6 3.9
MR-Bazley Medium/quick 2.4 2.2 4.0
MR-Buster Medium 3.4 2.8 4.2
MR-Taurus Medium/quick 3.8 3.0 4.3
Resolute Medium/long 3.6 3.2 4.3
Sentinel IG Medium 4.6 3.4 4.5
Tanami Medium/quick 6.0 5.3 4.5
Site mean 4.5 3.6 4.5
ORD
CENT
RAL Q
UEEN
SLAN
DSO
UTHE
RN Q
UEEN
SLAN
DNO
RTHE
RN N
SWLI
VERP
OOL P
LAIN
S
122021 NVT SORGHUM HARVEST REPORT
LIVERPOOL PLAINS
Test weight comparisons
Table 7: Premer test weight (kg/hL).Liverpool Plains Premer
Hybrid Maturity 2017 2018 2019 2020
84A66 Medium 79.1
Trial failed No trial
74.6
84A75 Medium 79.3 74.7
85G33 Medium/quick 77.8 72.6
Agitator Medium/quick 79.3 76.2
Brazen Medium/slow 80.5 77.7
Cracka Medium 79.8 76.5
Gibson Medium 80.6 77.1
Halifax Long 79.1 75.9
HGS-114 Medium 79.1 75.8
Liberty Long 78.1 76.1
MR-Bazley Medium/quick 78.9 74.8
MR-Buster Medium 78.9 74.6
MR-Taurus Medium/quick 78.8 75.6
Resolute Medium/long 80.2 78.0
Sentinel IG Medium 79.7 76.4
Tanami Medium/quick 79.6 76.0
Site mean 79.2 75.6
Table 9: Caroona and Breeza test weight (kg/hL).Liverpool Plains Caroona Breeza
Hybrid Maturity 2017 2018 2020 2019
84A66 Medium 67.2
Trial failed
75.2 73.1
84A75 Medium 65.1 74.5 74.4
85G33 Medium/quick 67.0 75.8 70.4
Agitator Medium/quick 68.0 78.2 72.3
Brazen Medium/slow 67.9 77.1 75.3
Cracka Medium 66.3 76.3 75.2
Gibson Medium 66.8 75.9 75.3
Halifax Long 68.7 77.4 73.3
HGS-114 Medium 67.1 77.1 73.7
Liberty Long 70.9 79.7 72.7
MR-Bazley Medium/quick 69.0 76.3 72.3
MR-Buster Medium 68.8 75.8 72.5
MR-Taurus Medium/quick 69.8 78.0 72.2
Resolute Medium/long 68.4 78.3 75.1
Sentinel IG Medium 67.2 76.8 74.4
Tanami Medium/quick 67.6 76.3 74.0
Site mean 67.9 76.9 73.2
Table 8: Mullaley test weight (kg/hL).Liverpool Plains Mullaley
Hybrid Maturity 2017 2018 2019 2020
84A66 Medium 66.4 70.0
No trial
69.5
84A75 Medium 65.3 69.8 71.3
85G33 Medium/quick 62.8 68.8 70.0
Agitator Medium/quick 68.6 68.3 69.2
Brazen Medium/slow 71.5 69.9 69.2
Cracka Medium 68.3 70.5 71.9
Gibson Medium 70.6 68.9 68.1
Halifax Long 68.4 70.9 70.9
HGS-114 Medium 67.2 70.5 72.2
Liberty Long 68.3 74.0 75.1
MR-Bazley Medium/quick 67.5 70.4 68.8
MR-Buster Medium 67.2 70.6 68.9
MR-Taurus Medium/quick 68.5 70.8 70.0
Resolute Medium/long 71.5 70.7 71.0
Sentinel IG Medium 68.7 70.1 70.8
Tanami Medium/quick 68.6 70.1 69.8
Site mean 67.8 70.1 70.4
ORD
CENT
RAL Q
UEEN
SLAN
DSO
UTHE
RN Q
UEEN
SLAN
DNO
RTHE
RN N
SWLI
VERP
OOL P
LAIN
S

132021 NVT SORGHUM HARVEST REPORT
NORTHERN NSW
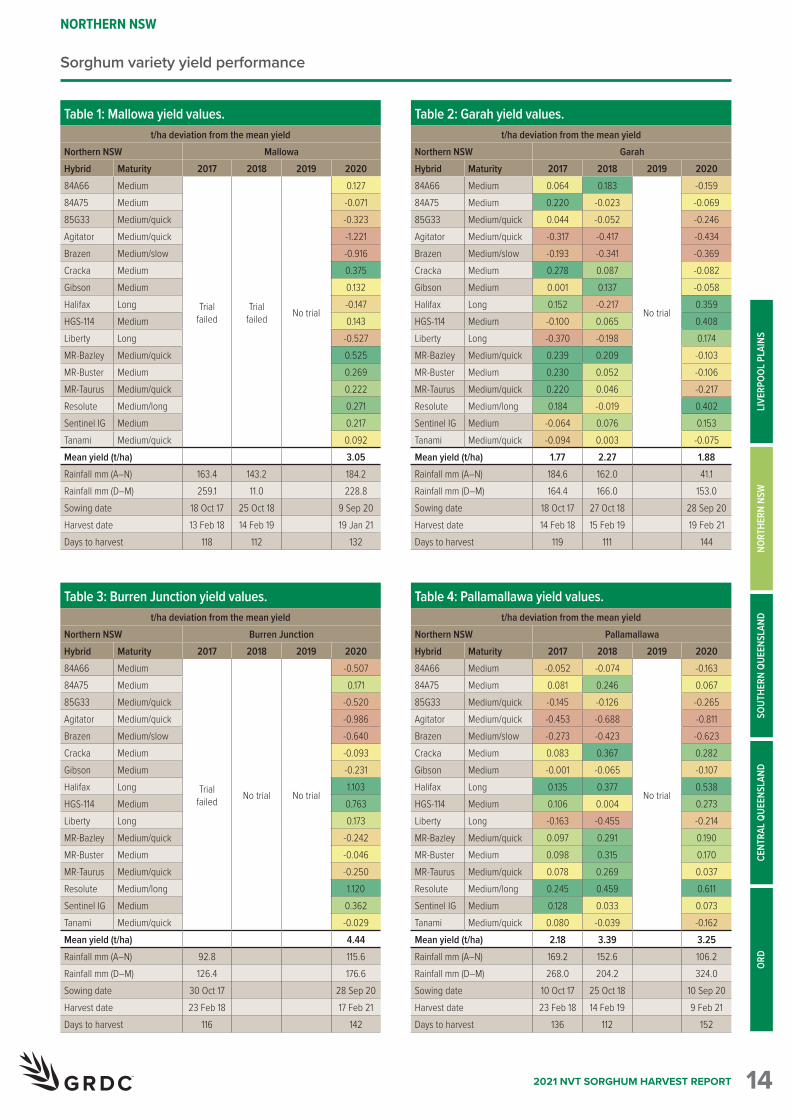
YIELD PERFORMANCE The following tables contain yield results from the region for the past four seasons. Data is presented (deviation from the mean t/ha) for each hybrid relative to the mean trial yield for the location within each year. Positive values indicate the hybrid performs above the mean yield in the environment (year–location combination) cited. Negative values indicate the hybrid performs below the mean yield in the environment cited. Hybrid names are listed in ascending numerical order, followed by alphabetical order.The performance of hybrids listed within these tables can be found by further interrogation of the NVT website. Error bars, normally used to compare data, can be viewed within the graph option also found via the website. Rainfall is provided for August to November (A–N) and December to March (D–M). Due to unfavourable seasonal conditions trials not sown are listed as ‘No trial’ and those not harvested as ‘Trial failed’.
NVT SITE LOCATIONS – NORTHERN NSWFigure 1: Location of Northern NSW NVT sorghum trial sites from 2017-18 to 2020-21.
SOURCE: NVT Online
ORD
CENT
RAL Q
UEEN
SLAN
DSO
UTHE
RN Q
UEEN
SLAN
DNO
RTHE
RN N
SWLI
VERP
OOL P
LAIN
S
142021 NVT SORGHUM HARVEST REPORT
NORTHERN NSW
Sorghum variety yield performance
Table 1: Mallowa yield values.t/ha deviation from the mean yield
Northern NSW MallowaHybrid Maturity 2017 2018 2019 202084A66 Medium
Trial failed
Trial failed No trial
0.12784A75 Medium -0.07185G33 Medium/quick -0.323Agitator Medium/quick -1.221Brazen Medium/slow -0.916Cracka Medium 0.375Gibson Medium 0.132Halifax Long -0.147HGS-114 Medium 0.143Liberty Long -0.527MR-Bazley Medium/quick 0.525MR-Buster Medium 0.269MR-Taurus Medium/quick 0.222Resolute Medium/long 0.271Sentinel IG Medium 0.217Tanami Medium/quick 0.092Mean yield (t/ha) 3.05Rainfall mm (A–N) 163.4 143.2 184.2Rainfall mm (D–M) 259.1 11.0 228.8Sowing date 18 Oct 17 25 Oct 18 9 Sep 20Harvest date 13 Feb 18 14 Feb 19 19 Jan 21Days to harvest 118 112 132
Table 3: Burren Junction yield values.t/ha deviation from the mean yield
Northern NSW Burren JunctionHybrid Maturity 2017 2018 2019 202084A66 Medium
Trial failed No trial No trial
-0.50784A75 Medium 0.17185G33 Medium/quick -0.520Agitator Medium/quick -0.986Brazen Medium/slow -0.640Cracka Medium -0.093Gibson Medium -0.231Halifax Long 1.103HGS-114 Medium 0.763Liberty Long 0.173MR-Bazley Medium/quick -0.242MR-Buster Medium -0.046MR-Taurus Medium/quick -0.250Resolute Medium/long 1.120Sentinel IG Medium 0.362Tanami Medium/quick -0.029Mean yield (t/ha) 4.44Rainfall mm (A–N) 92.8 115.6Rainfall mm (D–M) 126.4 176.6Sowing date 30 Oct 17 28 Sep 20Harvest date 23 Feb 18 17 Feb 21Days to harvest 116 142
Table 2: Garah yield values.t/ha deviation from the mean yield
Northern NSW GarahHybrid Maturity 2017 2018 2019 202084A66 Medium 0.064 0.183
No trial
-0.15984A75 Medium 0.220 -0.023 -0.06985G33 Medium/quick 0.044 -0.052 -0.246Agitator Medium/quick -0.317 -0.417 -0.434Brazen Medium/slow -0.193 -0.341 -0.369Cracka Medium 0.278 0.087 -0.082Gibson Medium 0.001 0.137 -0.058Halifax Long 0.152 -0.217 0.359HGS-114 Medium -0.100 0.065 0.408Liberty Long -0.370 -0.198 0.174MR-Bazley Medium/quick 0.239 0.209 -0.103MR-Buster Medium 0.230 0.052 -0.106MR-Taurus Medium/quick 0.220 0.046 -0.217Resolute Medium/long 0.184 -0.019 0.402Sentinel IG Medium -0.064 0.076 0.153Tanami Medium/quick -0.094 0.003 -0.075Mean yield (t/ha) 1.77 2.27 1.88Rainfall mm (A–N) 184.6 162.0 41.1Rainfall mm (D–M) 164.4 166.0 153.0Sowing date 18 Oct 17 27 Oct 18 28 Sep 20Harvest date 14 Feb 18 15 Feb 19 19 Feb 21Days to harvest 119 111 144
Table 4: Pallamallawa yield values.t/ha deviation from the mean yield
Northern NSW PallamallawaHybrid Maturity 2017 2018 2019 202084A66 Medium -0.052 -0.074
No trial
-0.16384A75 Medium 0.081 0.246 0.06785G33 Medium/quick -0.145 -0.126 -0.265Agitator Medium/quick -0.453 -0.688 -0.811Brazen Medium/slow -0.273 -0.423 -0.623Cracka Medium 0.083 0.367 0.282Gibson Medium -0.001 -0.065 -0.107Halifax Long 0.135 0.377 0.538HGS-114 Medium 0.106 0.004 0.273Liberty Long -0.163 -0.455 -0.214MR-Bazley Medium/quick 0.097 0.291 0.190MR-Buster Medium 0.098 0.315 0.170MR-Taurus Medium/quick 0.078 0.269 0.037Resolute Medium/long 0.245 0.459 0.611Sentinel IG Medium 0.128 0.033 0.073Tanami Medium/quick 0.080 -0.039 -0.162Mean yield (t/ha) 2.18 3.39 3.25Rainfall mm (A–N) 169.2 152.6 106.2Rainfall mm (D–M) 268.0 204.2 324.0Sowing date 10 Oct 17 25 Oct 18 10 Sep 20Harvest date 23 Feb 18 14 Feb 19 9 Feb 21Days to harvest 136 112 152
ORD
CENT
RAL Q
UEEN
SLAN
DSO
UTHE
RN Q
UEEN
SLAN
DNO
RTHE
RN N
SWLI
VERP
OOL P
LAIN
S
152021 NVT SORGHUM HARVEST REPORT
NORTHERN NSW
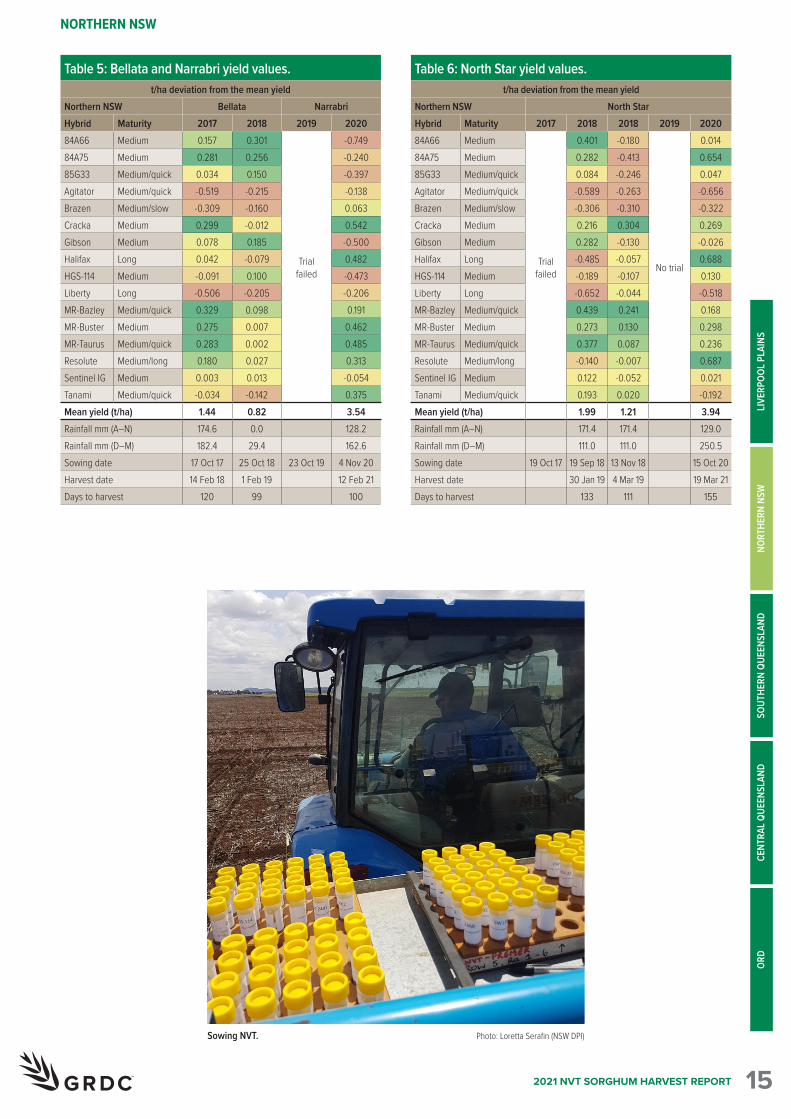
Table 5: Bellata and Narrabri yield values.t/ha deviation from the mean yield
Northern NSW Bellata NarrabriHybrid Maturity 2017 2018 2019 202084A66 Medium 0.157 0.301
Trial failed
-0.74984A75 Medium 0.281 0.256 -0.24085G33 Medium/quick 0.034 0.150 -0.397Agitator Medium/quick -0.519 -0.215 -0.138Brazen Medium/slow -0.309 -0.160 0.063Cracka Medium 0.299 -0.012 0.542Gibson Medium 0.078 0.185 -0.500Halifax Long 0.042 -0.079 0.482HGS-114 Medium -0.091 0.100 -0.473Liberty Long -0.506 -0.205 -0.206MR-Bazley Medium/quick 0.329 0.098 0.191MR-Buster Medium 0.275 0.007 0.462MR-Taurus Medium/quick 0.283 0.002 0.485Resolute Medium/long 0.180 0.027 0.313Sentinel IG Medium 0.003 0.013 -0.054Tanami Medium/quick -0.034 -0.142 0.375Mean yield (t/ha) 1.44 0.82 3.54Rainfall mm (A–N) 174.6 0.0 128.2Rainfall mm (D–M) 182.4 29.4 162.6Sowing date 17 Oct 17 25 Oct 18 23 Oct 19 4 Nov 20Harvest date 14 Feb 18 1 Feb 19 12 Feb 21Days to harvest 120 99 100
Table 6: North Star yield values.t/ha deviation from the mean yield
Northern NSW North StarHybrid Maturity 2017 2018 2018 2019 202084A66 Medium
Trial failed
0.401 -0.180
No trial
0.01484A75 Medium 0.282 -0.413 0.65485G33 Medium/quick 0.084 -0.246 0.047Agitator Medium/quick -0.589 -0.263 -0.656Brazen Medium/slow -0.306 -0.310 -0.322Cracka Medium 0.216 0.304 0.269Gibson Medium 0.282 -0.130 -0.026Halifax Long -0.485 -0.057 0.688HGS-114 Medium -0.189 -0.107 0.130Liberty Long -0.652 -0.044 -0.518MR-Bazley Medium/quick 0.439 0.241 0.168MR-Buster Medium 0.273 0.130 0.298MR-Taurus Medium/quick 0.377 0.087 0.236Resolute Medium/long -0.140 -0.007 0.687Sentinel IG Medium 0.122 -0.052 0.021Tanami Medium/quick 0.193 0.020 -0.192Mean yield (t/ha) 1.99 1.21 3.94Rainfall mm (A–N) 171.4 171.4 129.0Rainfall mm (D–M) 111.0 111.0 250.5Sowing date 19 Oct 17 19 Sep 18 13 Nov 18 15 Oct 20Harvest date 30 Jan 19 4 Mar 19 19 Mar 21Days to harvest 133 111 155
ORD
CENT
RAL Q
UEEN
SLAN
DSO
UTHE
RN Q
UEEN
SLAN
DNO
RTHE
RN N
SWLI
VERP
OOL P
LAIN
S
Sowing NVT. Photo: Loretta Serafin (NSW DPI)

162021 NVT SORGHUM HARVEST REPORT
NORTHERN NSW
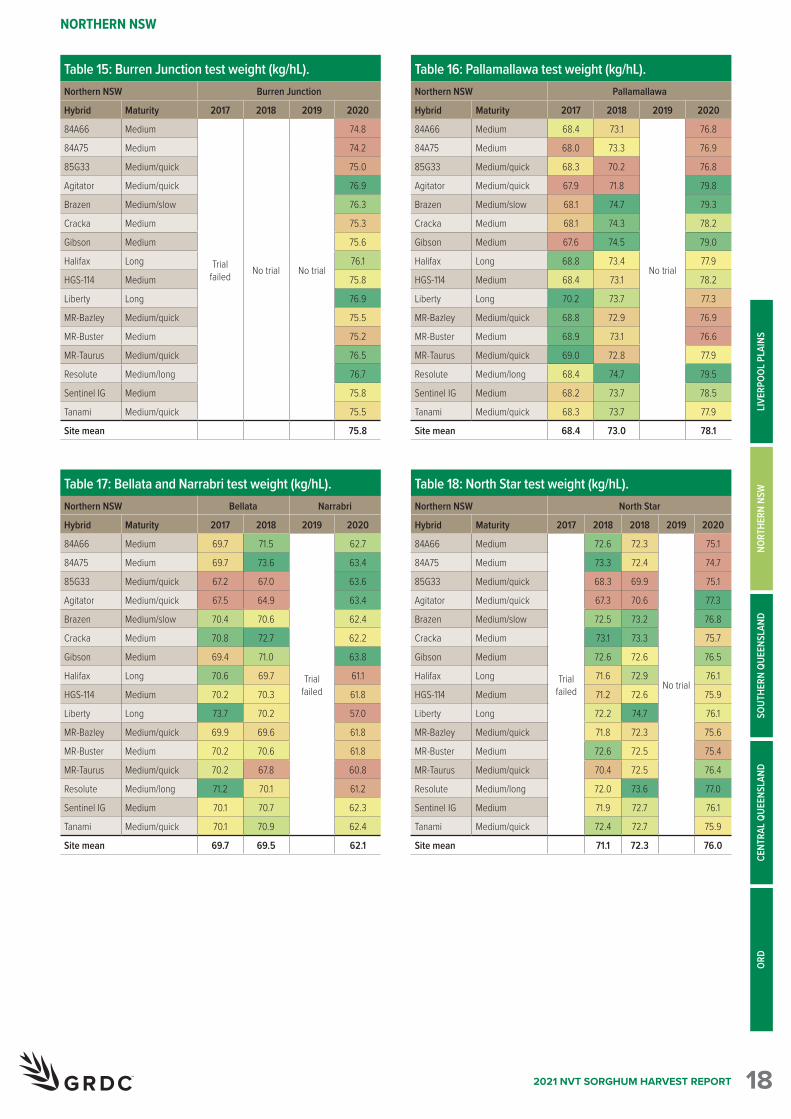
GRAIN QUALITYGrain quality for individual hybrids varies from site to site and from year to year. However, long-term and across-site trends highlight hybrids that can consistently achieve either higher test weights or low grain screenings under a broader range of environments. The grain quality tables of screenings (%<2.0mm) and test weight (kg/hL) contain MET-analysed results for each trial. Due to unfavourable seasonal conditions trials not sown are listed as ‘No trial’ and those not harvested as ‘Trial failed’.
Screenings comparisons
Table 8: Garah screenings (%<2.0mm).Northern NSW Garah
Hybrid Maturity 2017 2018 2019 2020
84A66 Medium 7.2 6.0
No trialNo
genetic variance
84A75 Medium 8.3 6.9
85G33 Medium/quick 12.1 8.4
Agitator Medium/quick 8.5 5.7
Brazen Medium/slow 11.2 7.1
Cracka Medium 8.4 6.6
Gibson Medium 14.0 6.7
Halifax Long 7.1 5.3
HGS-114 Medium 8.3 5.9
Liberty Long 8.2 4.4
MR-Bazley Medium/quick 7.2 4.8
MR-Buster Medium 8.3 5.9
MR-Taurus Medium/quick 9.2 6.3
Resolute Medium/long 8.2 6.2
Sentinel IG Medium 11.2 7.2
Tanami Medium/quick 20.8 7.8
Site mean 11.1 7.0 0.3
Table 10: Pallamallawa screenings (%<2.0mm).Northern NSW Pallamallawa
Hybrid Maturity 2017 2018 2019 2020
84A66 Medium
No genetic variance
6.0
No trial
2.2
84A75 Medium 6.7 2.5
85G33 Medium/quick 9.6 2.8
Agitator Medium/quick 6.7 2.3
Brazen Medium/slow 9.7 1.8
Cracka Medium 7.4 1.9
Gibson Medium 10.8 2.3
Halifax Long 5.9 2.0
HGS-114 Medium 6.3 2.5
Liberty Long 6.4 1.9
MR-Bazley Medium/quick 6.5 1.4
MR-Buster Medium 7.3 1.6
MR-Taurus Medium/quick 8.0 1.7
Resolute Medium/long 7.0 2.0
Sentinel IG Medium 9.5 1.9
Tanami Medium/quick 14.4 3.7
Site mean 4.1 9.2 2.1
Table 9: Burren Junction screenings (%<2.0mm).Northern NSW Burren Junction
Hybrid Maturity 2017 2018 2019 2020
84A66 Medium
Trial failed No trial No trial
0.6
84A75 Medium 0.6
85G33 Medium/quick 0.7
Agitator Medium/quick 0.6
Brazen Medium/slow 0.6
Cracka Medium 0.6
Gibson Medium 0.5
Halifax Long 0.6
HGS-114 Medium 0.6
Liberty Long 0.5
MR-Bazley Medium/quick 0.5
MR-Buster Medium 0.6
MR-Taurus Medium/quick 0.6
Resolute Medium/long 0.6
Sentinel IG Medium 0.6
Tanami Medium/quick 0.5
Site mean 0.6
Table 7: Mallowa screenings (%<2.0mm).Northern NSW Mallowa
Hybrid Maturity 2017 2018 2019 2020
84A66 Medium
Trial failed
Trial failed No trial
3.6
84A75 Medium 4.2
85G33 Medium/quick 4.7
Agitator Medium/quick 3.6
Brazen Medium/slow 2.7
Cracka Medium 3.0
Gibson Medium 3.4
Halifax Long 3.2
HGS-114 Medium 4.1
Liberty Long 2.8
MR-Bazley Medium/quick 2.0
MR-Buster Medium 2.6
MR-Taurus Medium/quick 2.7
Resolute Medium/long 3.2
Sentinel IG Medium 3.0
Tanami Medium/quick 5.4
Site mean 3.3
ORD
CENT
RAL Q
UEEN
SLAN
DSO
UTHE
RN Q
UEEN
SLAN
DNO
RTHE
RN N
SWLI
VERP
OOL P
LAIN
S

172021 NVT SORGHUM HARVEST REPORT
NORTHERN NSW
Test weight comparisons
Table 11: Bellata and Narrabri screenings (%<2.0mm).Northern NSW Bellata Narrabri
Hybrid Maturity 2017 2018 2019 2020
84A66 Medium 9.8 6.6
Trial failed
1.1
84A75 Medium 10.9 7.4 1.1
85G33 Medium/quick 14.5 10.1 1.3
Agitator Medium/quick 10.7 6.4 1.1
Brazen Medium/slow 14.3 11.9 1.4
Cracka Medium 11.5 9.3 1.2
Gibson Medium 15.8 10.3 1.4
Halifax Long 9.6 6.2 1.0
HGS-114 Medium 10.3 5.6 1.0
Liberty Long 10.2 5.5 1.1
MR-Bazley Medium/quick 10.2 7.8 1.2
MR-Buster Medium 11.3 9.0 1.2
MR-Taurus Medium/quick 12.2 9.8 1.3
Resolute Medium/long 11.0 8.2 1.2
Sentinel IG Medium 14.1 11.4 1.4
Tanami Medium/quick 20.5 9.5 1.5
Site mean 13.8 10.3 1.4
Table 12: North Star screenings (%<2.0mm).Northern NSW North Star
Hybrid Maturity 2017 2018 2018 2019 2020
84A66 Medium
Trial failed
7.6 8.8
No trialNo
genetic variance
84A75 Medium 8.4 9.4
85G33 Medium/quick 12.1 10.1
Agitator Medium/quick 8.5 8.8
Brazen Medium/slow 13.3 8.2
Cracka Medium 9.9 8.3
Gibson Medium 14.4 8.9
Halifax Long 7.6 8.3
HGS-114 Medium 7.7 9.2
Liberty Long 8.4 7.9
MR-Bazley Medium/quick 9.0 7.2
MR-Buster Medium 10.0 7.8
MR-Taurus Medium/quick 10.9 8.0
Resolute Medium/long 9.2 8.5
Sentinel IG Medium 12.9 8.4
Tanami Medium/quick 18.2 11.0
Site mean 12.2 8.7 0.2
Table 14: Garah test weight (kg/hL).Northern NSW Garah
Hybrid Maturity 2017 2018 2019 2020
84A66 Medium 75.3 72.2
No trial
72.8
84A75 Medium 75.3 72.8 73.8
85G33 Medium/quick 74.4 70.9 72.0
Agitator Medium/quick 73.2 71.7 75.2
Brazen Medium/slow 74.5 73.1 75.6
Cracka Medium 75.4 73.4 75.6
Gibson Medium 73.9 72.8 74.8
Halifax Long 75.7 72.6 74.5
HGS-114 Medium 75.4 72.8 75.3
Liberty Long 78.3 73.4 75.7
MR-Bazley Medium/quick 75.5 71.8 72.4
MR-Buster Medium 75.8 71.9 72.2
MR-Taurus Medium/quick 75.6 72.1 73.9
Resolute Medium/long 75.2 73.4 76.6
Sentinel IG Medium 75.0 72.9 75.2
Tanami Medium/quick 75.1 72.6 74.2
Site mean 75.1 72.4 74.3
Table 13: Mallowa test weight (kg/hL).Northern NSW Mallowa
Hybrid Maturity 2017 2018 2019 2020
84A66 Medium
Trial failed
Trial failed No trial
78.2
84A75 Medium 77.6
85G33 Medium/quick 78.0
Agitator Medium/quick 80.1
Brazen Medium/slow 79.8
Cracka Medium 78.3
Gibson Medium 79.8
Halifax Long 78.7
HGS-114 Medium 78.3
Liberty Long 77.5
MR-Bazley Medium/quick 78.7
MR-Buster Medium 78.4
MR-Taurus Medium/quick 79.0
Resolute Medium/long 79.5
Sentinel IG Medium 78.8
Tanami Medium/quick 78.8
Site mean 78.8
ORD
CENT
RAL Q
UEEN
SLAN
DSO
UTHE
RN Q
UEEN
SLAN
DNO
RTHE
RN N
SWLI
VERP
OOL P
LAIN
S
182021 NVT SORGHUM HARVEST REPORT
NORTHERN NSW
Table 16: Pallamallawa test weight (kg/hL).Northern NSW Pallamallawa
Hybrid Maturity 2017 2018 2019 2020
84A66 Medium 68.4 73.1
No trial
76.8
84A75 Medium 68.0 73.3 76.9
85G33 Medium/quick 68.3 70.2 76.8
Agitator Medium/quick 67.9 71.8 79.8
Brazen Medium/slow 68.1 74.7 79.3
Cracka Medium 68.1 74.3 78.2
Gibson Medium 67.6 74.5 79.0
Halifax Long 68.8 73.4 77.9
HGS-114 Medium 68.4 73.1 78.2
Liberty Long 70.2 73.7 77.3
MR-Bazley Medium/quick 68.8 72.9 76.9
MR-Buster Medium 68.9 73.1 76.6
MR-Taurus Medium/quick 69.0 72.8 77.9
Resolute Medium/long 68.4 74.7 79.5
Sentinel IG Medium 68.2 73.7 78.5
Tanami Medium/quick 68.3 73.7 77.9
Site mean 68.4 73.0 78.1
Table 15: Burren Junction test weight (kg/hL).Northern NSW Burren Junction
Hybrid Maturity 2017 2018 2019 2020
84A66 Medium
Trial failed No trial No trial
74.8
84A75 Medium 74.2
85G33 Medium/quick 75.0
Agitator Medium/quick 76.9
Brazen Medium/slow 76.3
Cracka Medium 75.3
Gibson Medium 75.6
Halifax Long 76.1
HGS-114 Medium 75.8
Liberty Long 76.9
MR-Bazley Medium/quick 75.5
MR-Buster Medium 75.2
MR-Taurus Medium/quick 76.5
Resolute Medium/long 76.7
Sentinel IG Medium 75.8
Tanami Medium/quick 75.5
Site mean 75.8
Table 17: Bellata and Narrabri test weight (kg/hL).Northern NSW Bellata Narrabri
Hybrid Maturity 2017 2018 2019 2020
84A66 Medium 69.7 71.5
Trial failed
62.7
84A75 Medium 69.7 73.6 63.4
85G33 Medium/quick 67.2 67.0 63.6
Agitator Medium/quick 67.5 64.9 63.4
Brazen Medium/slow 70.4 70.6 62.4
Cracka Medium 70.8 72.7 62.2
Gibson Medium 69.4 71.0 63.8
Halifax Long 70.6 69.7 61.1
HGS-114 Medium 70.2 70.3 61.8
Liberty Long 73.7 70.2 57.0
MR-Bazley Medium/quick 69.9 69.6 61.8
MR-Buster Medium 70.2 70.6 61.8
MR-Taurus Medium/quick 70.2 67.8 60.8
Resolute Medium/long 71.2 70.1 61.2
Sentinel IG Medium 70.1 70.7 62.3
Tanami Medium/quick 70.1 70.9 62.4
Site mean 69.7 69.5 62.1
Table 18: North Star test weight (kg/hL).Northern NSW North Star
Hybrid Maturity 2017 2018 2018 2019 2020
84A66 Medium
Trial failed
72.6 72.3
No trial
75.1
84A75 Medium 73.3 72.4 74.7
85G33 Medium/quick 68.3 69.9 75.1
Agitator Medium/quick 67.3 70.6 77.3
Brazen Medium/slow 72.5 73.2 76.8
Cracka Medium 73.1 73.3 75.7
Gibson Medium 72.6 72.6 76.5
Halifax Long 71.6 72.9 76.1
HGS-114 Medium 71.2 72.6 75.9
Liberty Long 72.2 74.7 76.1
MR-Bazley Medium/quick 71.8 72.3 75.6
MR-Buster Medium 72.6 72.5 75.4
MR-Taurus Medium/quick 70.4 72.5 76.4
Resolute Medium/long 72.0 73.6 77.0
Sentinel IG Medium 71.9 72.7 76.1
Tanami Medium/quick 72.4 72.7 75.9
Site mean 71.1 72.3 76.0
ORD
CENT
RAL Q
UEEN
SLAN
DSO
UTHE
RN Q
UEEN
SLAN
DNO
RTHE
RN N
SWLI
VERP
OOL P
LAIN
S
192021 NVT SORGHUM HARVEST REPORT
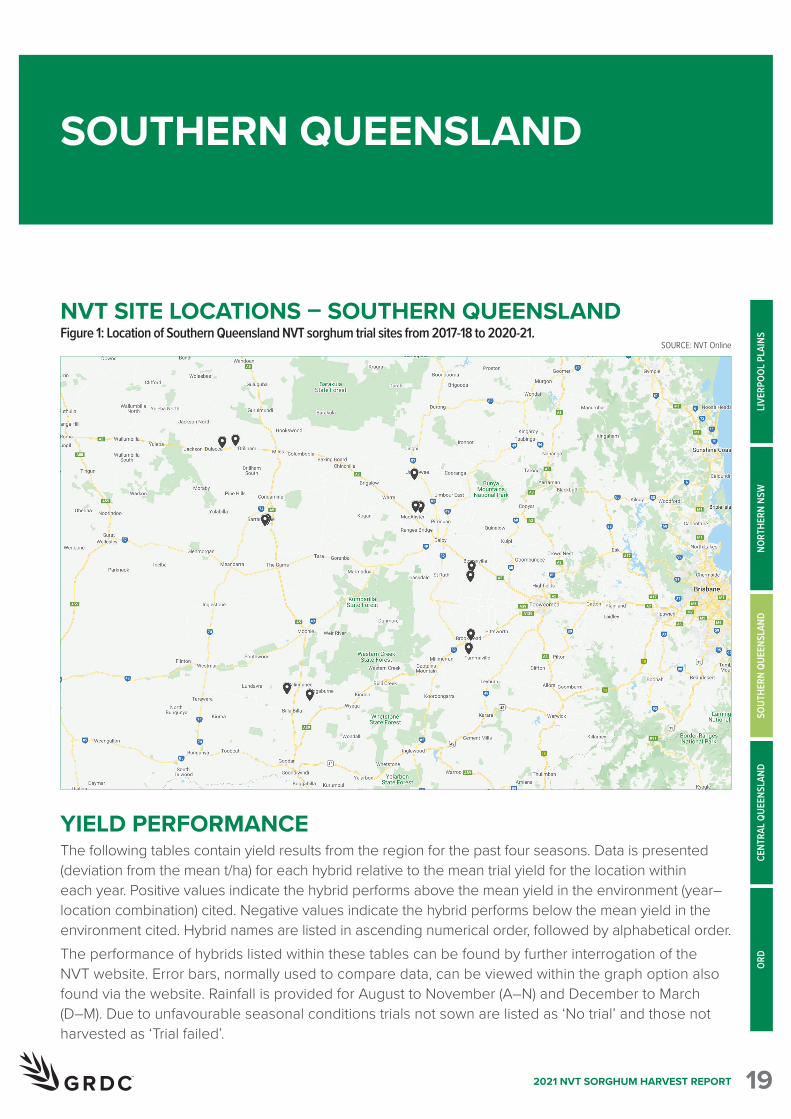
NVT SITE LOCATIONS – SOUTHERN QUEENSLAND Figure 1: Location of Southern Queensland NVT sorghum trial sites from 2017-18 to 2020-21.
SOURCE: NVT Online
SOUTHERN QUEENSLAND
YIELD PERFORMANCE The following tables contain yield results from the region for the past four seasons. Data is presented (deviation from the mean t/ha) for each hybrid relative to the mean trial yield for the location within each year. Positive values indicate the hybrid performs above the mean yield in the environment (year–location combination) cited. Negative values indicate the hybrid performs below the mean yield in the environment cited. Hybrid names are listed in ascending numerical order, followed by alphabetical order.The performance of hybrids listed within these tables can be found by further interrogation of the NVT website. Error bars, normally used to compare data, can be viewed within the graph option also found via the website. Rainfall is provided for August to November (A–N) and December to March (D–M). Due to unfavourable seasonal conditions trials not sown are listed as ‘No trial’ and those not harvested as ‘Trial failed’.
ORD
CENT
RAL Q
UEEN
SLAN
DSO
UTHE
RN Q
UEEN
SLAN
DNO
RTHE
RN N
SWLI
VERP
OOL P
LAIN
S

202021 NVT SORGHUM HARVEST REPORT
SOUTHERN QUEENSLAND
Sorghum variety yield performance
Table 1: Bongeen yield values.t/ha deviation from the mean yield
Southern Queensland BongeenHybrid Maturity 2017 2018 2019 202084A66 Medium 0.546 0.370
No trial Trial failed
84A75 Medium 0.896 1.22785G33 Medium/quick 0.236 0.383Agitator Medium/quick -0.724 -0.659Brazen Medium/slow -0.374 -0.187Cracka Medium -0.325 0.249Gibson Medium 0.411 0.176Halifax Long 0.239 0.652HGS-114 Medium 0.597 0.052Liberty Long -0.338 -0.886MR-Bazley Medium/quick -0.070 0.235MR-Buster Medium -0.098 0.398MR-Taurus Medium/quick -0.134 0.401Resolute Medium/long 0.489 0.688Sentinel IG Medium 0.290 -0.006Tanami Medium/quick -0.200 -0.272Mean yield (t/ha) 6.12 6.19Rainfall mm (A–N) 82.4 206.8 92.8Rainfall mm (D–M) 397.4 207.8 255.5Sowing date 26 Oct 17 28 Oct 18 14 Jan 21Harvest date 2 Mar 18 28 Feb 19Days to harvest 127 123
Table 3: Pampas yield values.t/ha deviation from the mean yield
Southern Queensland PampasHybrid Maturity 2017 2018 2019 202084A66 Medium 0.620 0.305 -2.068 0.24784A75 Medium 1.025 1.333 -1.351 0.97185G33 Medium/quick 0.430 0.770 -2.150 0.351Agitator Medium/quick -0.605 0.181 -2.222 -0.265Brazen Medium/slow -0.248 0.267 -1.197 0.008Cracka Medium 0.137 0.513 0.606 0.035Gibson Medium 0.357 -0.064 -0.949 0.105Halifax Long 0.147 1.154 0.685 0.652HGS-114 Medium 0.064 -0.244 0.082 0.152Liberty Long -0.818 -0.798 0.026 -0.466MR-Bazley Medium/quick 0.292 0.175 0.285 -0.014MR-Buster Medium 0.267 0.461 0.636 0.171MR-Taurus Medium/quick 0.299 0.388 0.611 0.145Resolute Medium/long 0.327 0.690 1.173 0.567Sentinel IG Medium 0.020 -0.574 1.069 -0.035Tanami Medium/quick -0.254 -0.887 1.840 -0.311Mean yield (t/ha) 4.64 6.28 7.79 6.15Rainfall mm (A–N) 82.2 167.6 31.2 104.8Rainfall mm (D–M) 405.8 315.2 120.0 176.2Sowing date 28 Oct 17 28 Oct 18 18 Nov 19 6 Nov 20Harvest date 23 Feb 18 21 Feb 19 6 Apr 20 4 Mar 21Days to harvest 118 116 140 118
Table 2: Dalby yield values.t/ha deviation from the mean yield
Southern Queensland DalbyHybrid Maturity 2017 2018 2019 202084A66 Medium 0.542 0.562
No trial
0.08484A75 Medium 0.677 1.011 0.45085G33 Medium/quick 0.158 0.271 0.008Agitator Medium/quick -0.883 -0.800 -0.502Brazen Medium/slow -0.637 -0.392 -0.265Cracka Medium -0.156 -0.219 -0.035Gibson Medium 0.376 0.404 0.076Halifax Long 0.249 0.299 0.395HGS-114 Medium 0.632 0.521 0.298Liberty Long -0.334 -0.495 -0.209MR-Bazley Medium/quick 0.071 0.013 -0.011MR-Buster Medium -0.079 0.005 0.047MR-Taurus Medium/quick -0.181 -0.021 -0.004Resolute Medium/long 0.512 0.548 0.466Sentinel IG Medium 0.200 0.260 0.138Tanami Medium/quick -0.376 -0.212 -0.100Mean yield (t/ha) 6.30 8.02 3.43Rainfall mm (A–N) 132.8 207.6 78.8Rainfall mm (D–M) 427.2 349.2 361.0Sowing date 10 Nov 17 5 Nov 18 29 Dec 20Harvest date 26 Mar 18 21 Mar 19 22 May 21Days to harvest 136 136 144
Table 4: Billa Billa yield values.t/ha deviation from the mean yield
Southern Queensland Billa BillaHybrid Maturity 2017 2018 2019 202084A66 Medium 0.204 0.244
No trial
-0.03284A75 Medium 0.173 0.088 0.20985G33 Medium/quick 0.073 0.067 -0.026Agitator Medium/quick -0.414 -0.347 -0.276Brazen Medium/slow -0.304 -0.344 -0.165Cracka Medium 0.354 0.159 0.054Gibson Medium 0.083 0.123 -0.026Halifax Long -0.062 -0.039 0.329HGS-114 Medium -0.157 0.079 0.143Liberty Long -0.487 -0.232 -0.109MR-Bazley Medium/quick 0.381 0.223 0.009MR-Buster Medium 0.267 0.065 0.060MR-Taurus Medium/quick 0.270 0.017 0.011Resolute Medium/long 0.057 0.066 0.320Sentinel IG Medium -0.084 -0.056 0.031Tanami Medium/quick -0.113 -0.234 -0.099Mean yield (t/ha) 2.95 2.80 2.84Rainfall mm (A–N) 156.8 156.8 107.0Rainfall mm (D–M) 235.4 235.4 327.0Sowing date 27 Oct 17 27 Oct 18 30 Dec 20Harvest date 12 Feb 18 18 Feb 19 21 May 21Days to harvest 108 114 142
ORD
CENT
RAL Q
UEEN
SLAN
DSO
UTHE
RN Q
UEEN
SLAN
DNO
RTHE
RN N
SWLI
VERP
OOL P
LAIN
S

212021 NVT SORGHUM HARVEST REPORT
SOUTHERN QUEENSLAND
Table 5: Condamine yield values.t/ha deviation from the mean yield
Southern Queensland CondamineHybrid Maturity 2017 2018 2019 202084A66 Medium 0.187
Trial failed No trial
-0.22384A75 Medium 0.249 -0.20885G33 Medium/quick 0.156 -0.180Agitator Medium/quick -0.192 -0.183Brazen Medium/slow -0.157 -0.241Cracka Medium 0.243 0.182Gibson Medium 0.055 -0.171Halifax Long 0.104 0.314HGS-114 Medium -0.080 0.086Liberty Long -0.338 0.080MR-Bazley Medium/quick 0.224 0.050MR-Buster Medium 0.172 0.041MR-Taurus Medium/quick 0.150 -0.056Resolute Medium/long 0.108 0.241Sentinel IG Medium -0.136 -0.068Tanami Medium/quick -0.233 -0.151Mean yield (t/ha) 2.88 1.48Rainfall mm (A–N) 144.7 118.5 74.0Rainfall mm (D–M) 379.7 233.0 238.0Sowing date 24 Oct 17 28 Oct 18 17 Sep 20Harvest date 13 Feb 18 20 Feb 19 13 Jan 21Days to harvest 112 115 118
Table 6: Miles yield values.t/ha deviation from the mean yield
Southern Queensland MilesHybrid Maturity 2017 2018 2019 202084A66 Medium -0.131
Trial failed No trial Trial
failed
84A75 Medium -0.19585G33 Medium/quick -0.055Agitator Medium/quick -0.064Brazen Medium/slow -0.211Cracka Medium 0.337Gibson Medium -0.170Halifax Long 0.275HGS-114 Medium -0.066Liberty Long -0.033MR-Bazley Medium/quick 0.171MR-Buster Medium 0.118MR-Taurus Medium/quick 0.019Resolute Medium/long 0.147Sentinel IG Medium -0.230Tanami Medium/quick -0.306Mean yield (t/ha) 2.38Rainfall mm (A–N) 140.2 134.6 77.8Rainfall mm (D–M) 278.0 83.2 352.3Sowing date 24 Oct 17 21 Dec 18 14 Jan 21Harvest date 19 Feb 18Days to harvest 118
ORD
CENT
RAL Q
UEEN
SLAN
DSO
UTHE
RN Q
UEEN
SLAN
DNO
RTHE
RN N
SWLI
VERP
OOL P
LAIN
S
Billa Billa NVT. Photo: Laurie Fitzgerald
222021 NVT SORGHUM HARVEST REPORT
SOUTHERN QUEENSLAND
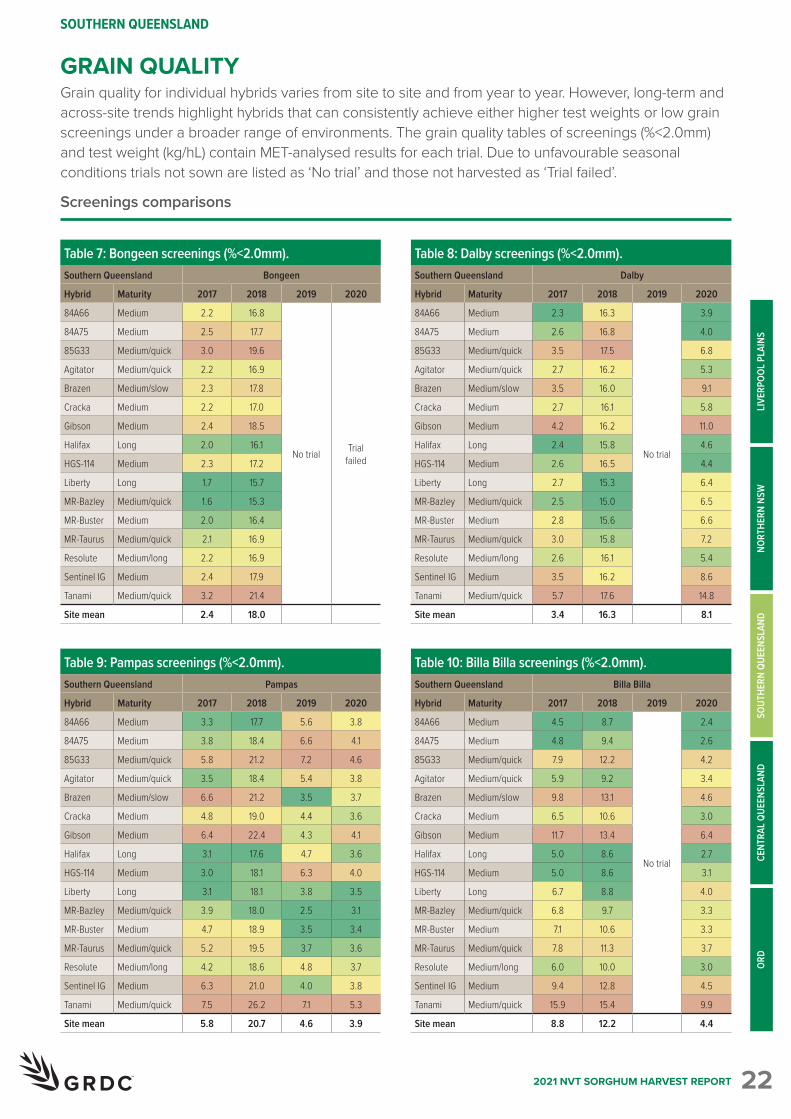
GRAIN QUALITYGrain quality for individual hybrids varies from site to site and from year to year. However, long-term and across-site trends highlight hybrids that can consistently achieve either higher test weights or low grain screenings under a broader range of environments. The grain quality tables of screenings (%<2.0mm) and test weight (kg/hL) contain MET-analysed results for each trial. Due to unfavourable seasonal conditions trials not sown are listed as ‘No trial’ and those not harvested as ‘Trial failed’.
Screenings comparisons
Table 7: Bongeen screenings (%<2.0mm).Southern Queensland Bongeen
Hybrid Maturity 2017 2018 2019 2020
84A66 Medium 2.2 16.8
No trial Trial failed
84A75 Medium 2.5 17.7
85G33 Medium/quick 3.0 19.6
Agitator Medium/quick 2.2 16.9
Brazen Medium/slow 2.3 17.8
Cracka Medium 2.2 17.0
Gibson Medium 2.4 18.5
Halifax Long 2.0 16.1
HGS-114 Medium 2.3 17.2
Liberty Long 1.7 15.7
MR-Bazley Medium/quick 1.6 15.3
MR-Buster Medium 2.0 16.4
MR-Taurus Medium/quick 2.1 16.9
Resolute Medium/long 2.2 16.9
Sentinel IG Medium 2.4 17.9
Tanami Medium/quick 3.2 21.4
Site mean 2.4 18.0
Table 9: Pampas screenings (%<2.0mm).Southern Queensland Pampas
Hybrid Maturity 2017 2018 2019 2020
84A66 Medium 3.3 17.7 5.6 3.8
84A75 Medium 3.8 18.4 6.6 4.1
85G33 Medium/quick 5.8 21.2 7.2 4.6
Agitator Medium/quick 3.5 18.4 5.4 3.8
Brazen Medium/slow 6.6 21.2 3.5 3.7
Cracka Medium 4.8 19.0 4.4 3.6
Gibson Medium 6.4 22.4 4.3 4.1
Halifax Long 3.1 17.6 4.7 3.6
HGS-114 Medium 3.0 18.1 6.3 4.0
Liberty Long 3.1 18.1 3.8 3.5
MR-Bazley Medium/quick 3.9 18.0 2.5 3.1
MR-Buster Medium 4.7 18.9 3.5 3.4
MR-Taurus Medium/quick 5.2 19.5 3.7 3.6
Resolute Medium/long 4.2 18.6 4.8 3.7
Sentinel IG Medium 6.3 21.0 4.0 3.8
Tanami Medium/quick 7.5 26.2 7.1 5.3
Site mean 5.8 20.7 4.6 3.9
Table 8: Dalby screenings (%<2.0mm).Southern Queensland Dalby
Hybrid Maturity 2017 2018 2019 2020
84A66 Medium 2.3 16.3
No trial
3.9
84A75 Medium 2.6 16.8 4.0
85G33 Medium/quick 3.5 17.5 6.8
Agitator Medium/quick 2.7 16.2 5.3
Brazen Medium/slow 3.5 16.0 9.1
Cracka Medium 2.7 16.1 5.8
Gibson Medium 4.2 16.2 11.0
Halifax Long 2.4 15.8 4.6
HGS-114 Medium 2.6 16.5 4.4
Liberty Long 2.7 15.3 6.4
MR-Bazley Medium/quick 2.5 15.0 6.5
MR-Buster Medium 2.8 15.6 6.6
MR-Taurus Medium/quick 3.0 15.8 7.2
Resolute Medium/long 2.6 16.1 5.4
Sentinel IG Medium 3.5 16.2 8.6
Tanami Medium/quick 5.7 17.6 14.8
Site mean 3.4 16.3 8.1
Table 10: Billa Billa screenings (%<2.0mm).Southern Queensland Billa Billa
Hybrid Maturity 2017 2018 2019 2020
84A66 Medium 4.5 8.7
No trial
2.4
84A75 Medium 4.8 9.4 2.6
85G33 Medium/quick 7.9 12.2 4.2
Agitator Medium/quick 5.9 9.2 3.4
Brazen Medium/slow 9.8 13.1 4.6
Cracka Medium 6.5 10.6 3.0
Gibson Medium 11.7 13.4 6.4
Halifax Long 5.0 8.6 2.7
HGS-114 Medium 5.0 8.6 3.1
Liberty Long 6.7 8.8 4.0
MR-Bazley Medium/quick 6.8 9.7 3.3
MR-Buster Medium 7.1 10.6 3.3
MR-Taurus Medium/quick 7.8 11.3 3.7
Resolute Medium/long 6.0 10.0 3.0
Sentinel IG Medium 9.4 12.8 4.5
Tanami Medium/quick 15.9 15.4 9.9
Site mean 8.8 12.2 4.4
ORD
CENT
RAL Q
UEEN
SLAN
DSO
UTHE
RN Q
UEEN
SLAN
DNO
RTHE
RN N
SWLI
VERP
OOL P
LAIN
S

232021 NVT SORGHUM HARVEST REPORT
SOUTHERN QUEENSLAND
Test weight comparisons
Table 11: Condamine screenings (%<2.0mm).Southern Queensland Condamine
Hybrid Maturity 2017 2018 2019 2020
84A66 Medium 3.0
Trial failed No trial
3.4
84A75 Medium 3.7 3.3
85G33 Medium/quick 7.1 3.3
Agitator Medium/quick 4.5 3.3
Brazen Medium/slow 7.1 4.1
Cracka Medium 4.2 3.8
Gibson Medium 9.9 3.8
Halifax Long 3.2 3.5
HGS-114 Medium 4.0 3.1
Liberty Long 4.8 3.5
MR-Bazley Medium/quick 3.8 4.0
MR-Buster Medium 4.5 3.9
MR-Taurus Medium/quick 5.2 3.9
Resolute Medium/long 4.0 3.6
Sentinel IG Medium 7.0 4.0
Tanami Medium/quick 16.2 3.1
Site mean 6.8 3.8
Table 12: Miles screenings (%<2.0mm).Southern Queensland Miles
Hybrid Maturity 2017 2018 2019 2020
84A66 Medium 2.4
Trial failed No trial Trial
failed
84A75 Medium 2.7
85G33 Medium/quick 3.3
Agitator Medium/quick 2.5
Brazen Medium/slow 2.6
Cracka Medium 2.4
Gibson Medium 3.1
Halifax Long 2.2
HGS-114 Medium 2.6
Liberty Long 2.2
MR-Bazley Medium/quick 1.9
MR-Buster Medium 2.2
MR-Taurus Medium/quick 2.4
Resolute Medium/long 2.4
Sentinel IG Medium 2.7
Tanami Medium/quick 4.5
Site mean 2.8
Table 13: Bongeen test weight (kg/hL).Southern Queensland Bongeen
Hybrid Maturity 2017 2018 2019 2020
84A66 Medium 74.6 76.1
No trial Trial failed
84A75 Medium 74.9 76.4
85G33 Medium/quick 74.5 75.0
Agitator Medium/quick 76.7 77.0
Brazen Medium/slow 76.4 78.0
Cracka Medium 75.8 77.3
Gibson Medium 76.4 77.8
Halifax Long 75.3 76.7
HGS-114 Medium 75.6 76.8
Liberty Long 74.4 76.5
MR-Bazley Medium/quick 74.5 76.0
MR-Buster Medium 74.3 76.0
MR-Taurus Medium/quick 75.1 76.4
Resolute Medium/long 76.5 78.0
Sentinel IG Medium 75.8 77.2
Tanami Medium/quick 75.4 76.9
Site mean 75.4 76.7
Table 14: Dalby test weight (kg/hL).Southern Queensland Dalby
Hybrid Maturity 2017 2018 2019 2020
84A66 Medium 75.7 73.8
No trial
73.3
84A75 Medium 76.0 73.1 74.1
85G33 Medium/quick 74.4 72.3 72.6
Agitator Medium/quick 76.2 74.1 75.8
Brazen Medium/slow 77.3 75.4 76.1
Cracka Medium 76.6 74.1 75.5
Gibson Medium 77.4 75.0 75.8
Halifax Long 75.8 74.4 74.5
HGS-114 Medium 75.9 73.7 75.0
Liberty Long 74.7 74.4 74.1
MR-Bazley Medium/quick 75.5 74.3 73.1
MR-Buster Medium 75.5 74.2 72.8
MR-Taurus Medium/quick 75.5 74.5 74.0
Resolute Medium/long 77.0 75.3 76.4
Sentinel IG Medium 76.5 74.3 75.3
Tanami Medium/quick 76.4 74.4 74.6
Site mean 75.9 74.1 74.5
ORD
CENT
RAL Q
UEEN
SLAN
DSO
UTHE
RN Q
UEEN
SLAN
DNO
RTHE
RN N
SWLI
VERP
OOL P
LAIN
S

2021 NVT SORGHUM HARVEST REPORT 24
SOUTHERN QUEENSLAND
Table 15: Pampas test weight (kg/hL).Southern Queensland Pampas
Hybrid Maturity 2017 2018 2019 2020
84A66 Medium 72.0 75.5 77.5 78.2
84A75 Medium 72.4 76.1 75.5 77.0
85G33 Medium/quick 71.1 73.6 75.8 77.8
Agitator Medium/quick 74.1 72.6 76.9 79.2
Brazen Medium/slow 74.6 74.9 78.5 79.2
Cracka Medium 73.5 75.7 76.7 77.7
Gibson Medium 74.6 75.2 77.7 79.0
Halifax Long 72.7 74.6 78.4 78.7
HGS-114 Medium 72.9 74.7 76.7 77.9
Liberty Long 71.4 74.5 79.9 78.5
MR-Bazley Medium/quick 71.9 74.8 79.0 79.1
MR-Buster Medium 71.7 75.2 78.9 78.9
MR-Taurus Medium/quick 72.4 73.9 79.2 79.3
Resolute Medium/long 74.4 74.6 78.6 79.1
Sentinel IG Medium 73.5 74.9 77.3 78.3
Tanami Medium/quick 73.1 75.1 77.9 78.6
Site mean 72.9 74.5 77.6 78.5
Table 16: Billa Billa test weight (kg/hL).Southern Queensland Billa Billa
Hybrid Maturity 2017 2018 2019 2020
84A66 Medium 72.6 73.2
No trial
73.6
84A75 Medium 71.8 73.3 73.7
85G33 Medium/quick 70.8 71.2 73.7
Agitator Medium/quick 70.9 72.7 75.1
Brazen Medium/slow 72.9 74.7 74.7
Cracka Medium 72.5 74.2 74.3
Gibson Medium 72.2 74.3 74.6
Halifax Long 73.2 73.8 74.2
HGS-114 Medium 72.2 73.5 74.3
Liberty Long 75.3 74.5 74.0
MR-Bazley Medium/quick 73.4 73.3 73.7
MR-Buster Medium 73.5 73.4 73.5
MR-Taurus Medium/quick 73.4 73.5 74.2
Resolute Medium/long 73.2 74.9 74.9
Sentinel IG Medium 72.4 73.9 74.4
Tanami Medium/quick 72.7 73.9 74.2
Site mean 72.5 73.4 74.2
Table 17: Condamine test weight (kg/hL).Southern Queensland Condamine
Hybrid Maturity 2017 2018 2019 2020
84A66 Medium 72.5
Trial failed No trial
74.5
84A75 Medium 73.8 74.2
85G33 Medium/quick 70.4 73.9
Agitator Medium/quick 71.9 76.9
Brazen Medium/slow 74.1 77.0
Cracka Medium 74.5 75.4
Gibson Medium 74.0 76.9
Halifax Long 72.6 75.4
HGS-114 Medium 73.3 75.2
Liberty Long 72.4 74.3
MR-Bazley Medium/quick 71.6 74.9
MR-Buster Medium 71.8 74.6
MR-Taurus Medium/quick 71.6 75.5
Resolute Medium/long 74.1 76.9
Sentinel IG Medium 73.6 75.8
Tanami Medium/quick 73.2 75.6
Site mean 72.6 75.4
Table 18: Miles test weight (kg/hL).Southern Queensland Miles
Hybrid Maturity 2017 2018 2019 2020
84A66 Medium 72.4
Trial failed No trial Trial
failed
84A75 Medium 71.4
85G33 Medium/quick 70.2
Agitator Medium/quick 70.5
Brazen Medium/slow 72.9
Cracka Medium 72.7
Gibson Medium 71.5
Halifax Long 73.8
HGS-114 Medium 72.7
Liberty Long 77.8
MR-Bazley Medium/quick 73.4
MR-Buster Medium 73.5
MR-Taurus Medium/quick 74.0
Resolute Medium/long 73.9
Sentinel IG Medium 72.5
Tanami Medium/quick 72.7
Site mean 72.6
ORD
CENT
RAL Q
UEEN
SLAN
DSO
UTHE
RN Q
UEEN
SLAN
DNO
RTHE
RN N
SWLI
VERP
OOL P
LAIN
S

252021 NVT SORGHUM HARVEST REPORT
CENTRAL QUEENSLAND
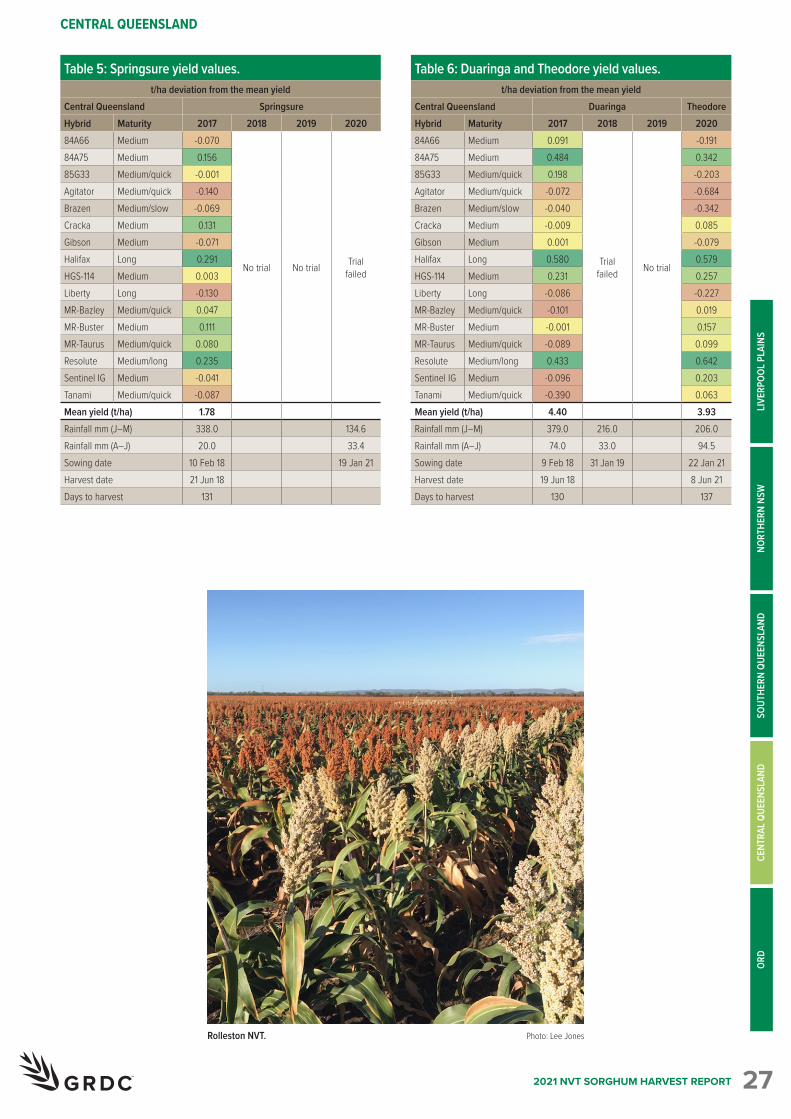
YIELD PERFORMANCE The following tables contain yield results from the region for the past four seasons. Data is presented (deviation from the mean t/ha) for each hybrid relative to the mean trial yield for the location within each year. Positive values indicate the hybrid performs above the mean yield in the environment (year–location combination) cited. Negative values indicate the hybrid performs below the mean yield in the environment cited. Hybrid names are listed in ascending numerical order, followed by alphabetical order.The performance of hybrids listed within these tables can be found by further interrogation of the NVT website. Error bars, normally used to compare data, can be viewed within the graph option also found via the website. Rainfall is provided for January to March (J–M) and April to June (A–J). Due to unfavourable seasonal conditions trials not sown are listed as ‘No trial’ and those not harvested as ‘Trial failed’.
NVT SITE LOCATIONS – CENTRAL QUEENSLAND Figure 1: Location of Central Queensland NVT sorghum trial sites from 2017-18 to 2020-21.
SOURCE: NVT Online
ORD
CENT
RAL Q
UEEN
SLAN
DSO
UTHE
RN Q
UEEN
SLAN
DNO
RTHE
RN N
SWLI
VERP
OOL P
LAIN
S

262021 NVT SORGHUM HARVEST REPORT
CENTRAL QUEENSLAND
Sorghum variety yield performance
Table 1: Clermont yield values.t/ha deviation from the mean yield
Central Queensland ClermontHybrid Maturity 2017 2018 2019 202084A66 Medium 0.261
Trial failed
0.092 -0.09884A75 Medium 0.484 0.233 0.16485G33 Medium/quick 0.304 0.186 -0.129Agitator Medium/quick -0.067 -0.010 -0.408Brazen Medium/slow 0.005 -0.026 -0.224Cracka Medium 0.231 0.312 0.031Gibson Medium 0.083 -0.037 -0.034Halifax Long 0.163 0.215 0.305HGS-114 Medium -0.153 -0.187 0.175Liberty Long -0.442 -0.314 -0.105MR-Bazley Medium/quick 0.200 0.205 0.008MR-Buster Medium 0.215 0.212 0.067MR-Taurus Medium/quick 0.223 0.189 0.029Resolute Medium/long 0.116 0.110 0.355Sentinel IG Medium -0.177 -0.231 0.126Tanami Medium/quick -0.260 -0.273 0.031Mean yield (t/ha) 2.82 1.58 3.15Rainfall mm (J–M) 234.0 292.2 614.0 357.0Rainfall mm (A–J) 13.0 39.6 188.8 61.0Sowing date 11 Feb 18 23 Jan 19 18 Feb 20 20 Jan 21Harvest date 6 Jul 18 18 Jun 20 3 Jun 21Days to harvest 145 121 134
Table 3: Capella and Dysart yield values.t/ha deviation from the mean yield
Central Queensland Capella DysartHybrid Maturity 2017 2018 2019 202084A66 Medium 0.366
No trial
0.082 0.40984A75 Medium 0.859 0.175 0.84485G33 Medium/quick 0.483 0.207 0.204Agitator Medium/quick -0.085 0.164 -0.523Brazen Medium/slow 0.098 0.184 -0.088Cracka Medium 0.342 0.355 -0.274Gibson Medium 0.113 -0.031 0.345Halifax Long 0.307 -0.086 0.031HGS-114 Medium -0.279 -0.471 0.270Liberty Long -0.733 -0.415 -0.427MR-Bazley Medium/quick 0.281 0.277 -0.038MR-Buster Medium 0.373 0.305 0.031MR-Taurus Medium/quick 0.412 0.379 0.106Resolute Medium/long 0.221 -0.156 0.281Sentinel IG Medium -0.243 -0.224 0.322Tanami Medium/quick -0.320 -0.024 0.145Mean yield (t/ha) 2.97 3.40 3.44Rainfall mm (J–M) 86.4 354.4 303.1Rainfall mm (A–J) 20.2 42.6 38.4Sowing date 12 Feb 18 20 Feb 20 21 Jan 21Harvest date 22 Jun 18 25 Jun 20 24 Jun 21Days to harvest 130 126 154
Table 2: Kilcummin yield values.t/ha deviation from the mean yield
Central Queensland KilcumminHybrid Maturity 2017 2018 2019 202084A66 Medium
No trial Trial failed No trial
0.15184A75 Medium 0.28785G33 Medium/quick 0.117Agitator Medium/quick -0.003Brazen Medium/slow 0.134Cracka Medium -0.143Gibson Medium 0.130Halifax Long -0.112HGS-114 Medium -0.005Liberty Long -0.127MR-Bazley Medium/quick -0.047MR-Buster Medium 0.001MR-Taurus Medium/quick 0.070Resolute Medium/long -0.040Sentinel IG Medium 0.107Tanami Medium/quick 0.137Mean yield (t/ha) 2.33Rainfall mm (J–M) 266.5 302.7Rainfall mm (A–J) 41.5 36.6Sowing date 24 Jan 19 21 Jan 21Harvest date 3 Jun 21Days to harvest 133
Table 4: Rolleston yield values.t/ha deviation from the mean yield
Central Queensland RollestonHybrid Maturity 2017 2018 2019 202084A66 Medium
No trial No trial
-0.167 -0.22884A75 Medium 0.220 0.24885G33 Medium/quick -0.065 -0.113Agitator Medium/quick -0.253 -0.360Brazen Medium/slow -0.059 -0.130Cracka Medium 0.203 0.234Gibson Medium -0.118 -0.156Halifax Long 0.346 0.487HGS-114 Medium -0.082 -0.029Liberty Long -0.252 -0.265MR-Bazley Medium/quick 0.092 0.091MR-Buster Medium 0.223 0.246MR-Taurus Medium/quick 0.221 0.221Resolute Medium/long 0.312 0.442Sentinel IG Medium 0.014 0.030Tanami Medium/quick 0.063 0.042Mean yield (t/ha) 4.31 3.31Rainfall mm (J–M) 442.0 209.8Rainfall mm (A–J) 61.8 39.2Sowing date 21 Feb 20 18 Jan 21Harvest date 14 Jul 20 26 May 21Days to harvest 144 128
ORD
CENT
RAL Q
UEEN
SLAN
DSO
UTHE
RN Q
UEEN
SLAN
DNO
RTHE
RN N
SWLI
VERP
OOL P
LAIN
S
272021 NVT SORGHUM HARVEST REPORT
CENTRAL QUEENSLAND
Table 5: Springsure yield values.t/ha deviation from the mean yield
Central Queensland SpringsureHybrid Maturity 2017 2018 2019 202084A66 Medium -0.070
No trial No trial Trial failed
84A75 Medium 0.15685G33 Medium/quick -0.001Agitator Medium/quick -0.140Brazen Medium/slow -0.069Cracka Medium 0.131Gibson Medium -0.071Halifax Long 0.291HGS-114 Medium 0.003Liberty Long -0.130MR-Bazley Medium/quick 0.047MR-Buster Medium 0.111MR-Taurus Medium/quick 0.080Resolute Medium/long 0.235Sentinel IG Medium -0.041Tanami Medium/quick -0.087Mean yield (t/ha) 1.78Rainfall mm (J–M) 338.0 134.6Rainfall mm (A–J) 20.0 33.4Sowing date 10 Feb 18 19 Jan 21Harvest date 21 Jun 18Days to harvest 131
Table 6: Duaringa and Theodore yield values.t/ha deviation from the mean yield
Central Queensland Duaringa TheodoreHybrid Maturity 2017 2018 2019 202084A66 Medium 0.091
Trial failed No trial
-0.19184A75 Medium 0.484 0.34285G33 Medium/quick 0.198 -0.203Agitator Medium/quick -0.072 -0.684Brazen Medium/slow -0.040 -0.342Cracka Medium -0.009 0.085Gibson Medium 0.001 -0.079Halifax Long 0.580 0.579HGS-114 Medium 0.231 0.257Liberty Long -0.086 -0.227MR-Bazley Medium/quick -0.101 0.019MR-Buster Medium -0.001 0.157MR-Taurus Medium/quick -0.089 0.099Resolute Medium/long 0.433 0.642Sentinel IG Medium -0.096 0.203Tanami Medium/quick -0.390 0.063Mean yield (t/ha) 4.40 3.93Rainfall mm (J–M) 379.0 216.0 206.0Rainfall mm (A–J) 74.0 33.0 94.5Sowing date 9 Feb 18 31 Jan 19 22 Jan 21Harvest date 19 Jun 18 8 Jun 21Days to harvest 130 137
ORD
CENT
RAL Q
UEEN
SLAN
DSO
UTHE
RN Q
UEEN
SLAN
DNO
RTHE
RN N
SWLI
VERP
OOL P
LAIN
S
Rolleston NVT. Photo: Lee Jones

282021 NVT SORGHUM HARVEST REPORT
CENTRAL QUEENSLAND
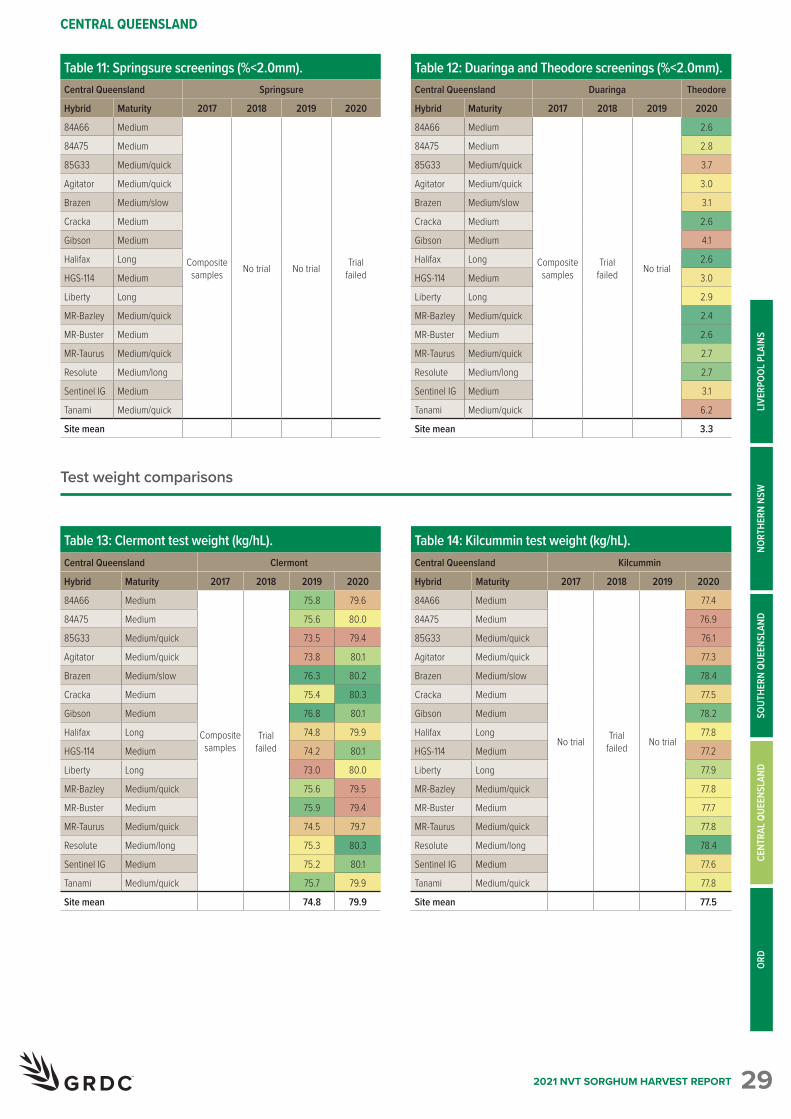
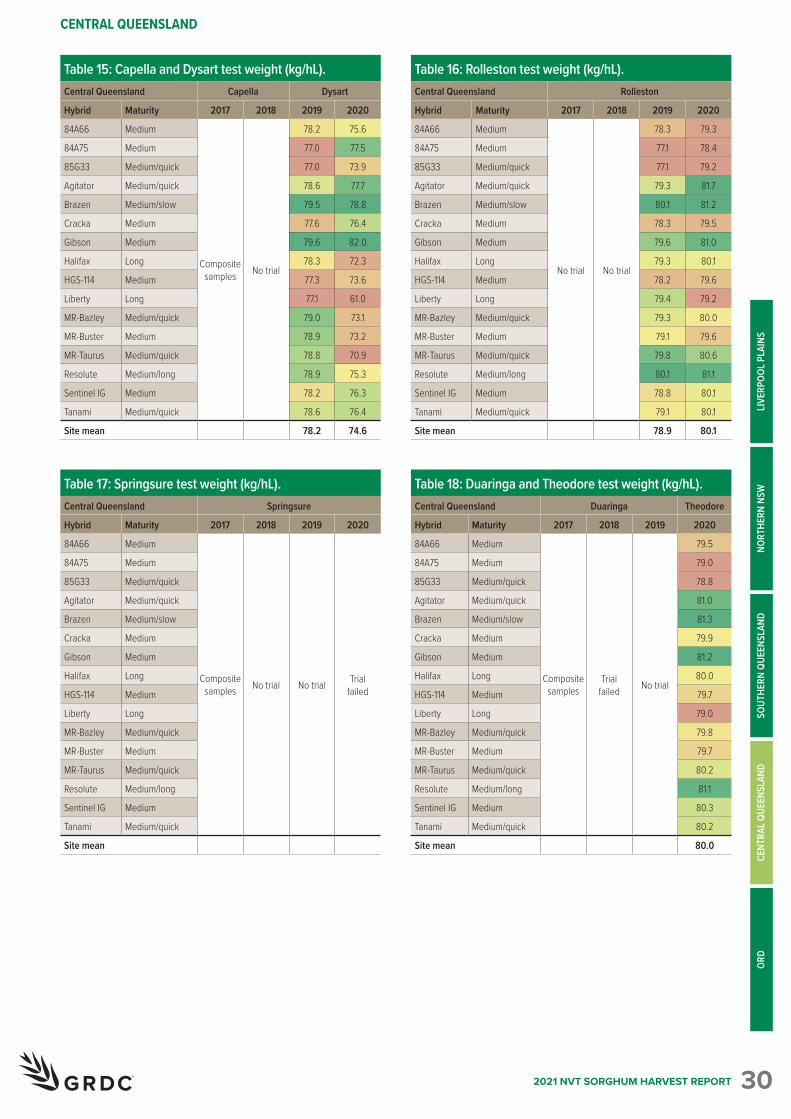
GRAIN QUALITYGrain quality for individual hybrids varies from site to site and from year to year. However, long-term and across-site trends highlight hybrids that can consistently achieve either higher test weights or low grain screenings under a broader range of environments. The grain quality tables of screenings (%<2.0mm) and test weight (kg/hL) contain MET-analysed results for each trial. Due to unfavourable seasonal conditions trials not sown are listed as ‘No trial’ and those not harvested as ‘Trial failed’.
Screenings comparisons
Table 7: Clermont screenings (%<2.0mm).Central Queensland Clermont
Hybrid Maturity 2017 2018 2019 2020
84A66 Medium
Composite samples
Trialfailed
3.9 1.9
84A75 Medium 4.9 2.3
85G33 Medium/quick 8.1 4.7
Agitator Medium/quick 4.8 3.2
Brazen Medium/slow 7.4 4.7
Cracka Medium 5.1 2.6
Gibson Medium 9.1 7.2
Halifax Long 3.7 2.2
HGS-114 Medium 4.6 2.8
Liberty Long 4.3 3.7
MR-Bazley Medium/quick 3.8 2.6
MR-Buster Medium 4.9 2.9
MR-Taurus Medium/quick 5.6 3.4
Resolute Medium/long 4.8 2.6
Sentinel IG Medium 7.3 4.6
Tanami Medium/quick 14.1 12.4
Site mean 7.1 4.6
Table 9: Capella and Dysart screenings (%<2.0mm).Central Queensland Capella Dysart
Hybrid Maturity 2017 2018 2019 2020
84A66 Medium
Composite samples No trial
4.9 0.8
84A75 Medium 5.8 0.4
85G33 Medium/quick 8.2 1.9
Agitator Medium/quick 5.6 2.4
Brazen Medium/slow 6.7 3.6
Cracka Medium 5.3 1.5
Gibson Medium 8.5 6.3
Halifax Long 4.6 1.8
HGS-114 Medium 5.7 1.7
Liberty Long 5.0 4.2
MR-Bazley Medium/quick 4.1 3.2
MR-Buster Medium 5.0 2.5
MR-Taurus Medium/quick 5.6 2.7
Resolute Medium/long 5.3 1.6
Sentinel IG Medium 6.8 3.4
Tanami Medium/quick 13.3 10.4
Site mean 6.9 3.3
Table 8: Kilcummin screenings (%<2.0mm).Central Queensland Kilcummin
Hybrid Maturity 2017 2018 2019 2020
84A66 Medium
No trial Trial failed No trial
8.5
84A75 Medium 8.7
85G33 Medium/quick 13.7
Agitator Medium/quick 12.1
Brazen Medium/slow 16.1
Cracka Medium 10.5
Gibson Medium 22.4
Halifax Long 10.1
HGS-114 Medium 10.9
Liberty Long 14.9
MR-Bazley Medium/quick 12.5
MR-Buster Medium 12.2
MR-Taurus Medium/quick 13.1
Resolute Medium/long 10.6
Sentinel IG Medium 15.6
Tanami Medium/quick 34.0
Site mean 15.3
Table 10: Rolleston screenings (%<2.0mm).Central Queensland Rolleston
Hybrid Maturity 2017 2018 2019 2020
84A66 Medium
No trial No trial
3.3 1.6
84A75 Medium 3.7 2.3
85G33 Medium/quick 4.5 6.9
Agitator Medium/quick 3.2 4.7
Brazen Medium/slow 3.9 6.7
Cracka Medium 3.6 2.5
Gibson Medium 3.8 13.0
Halifax Long 3.0 2.6
HGS-114 Medium 3.3 4.2
Liberty Long 2.6 6.4
MR-Bazley Medium/quick 2.8 3.4
MR-Buster Medium 3.3 3.5
MR-Taurus Medium/quick 3.5 4.4
Resolute Medium/long 3.4 2.8
Sentinel IG Medium 3.9 6.6
Tanami Medium/quick 4.5 25.0
Site mean 3.9 6.8
ORD
CENT
RAL Q
UEEN
SLAN
DSO
UTHE
RN Q
UEEN
SLAN
DNO
RTHE
RN N
SWLI
VERP
OOL P
LAIN
S
292021 NVT SORGHUM HARVEST REPORT
CENTRAL QUEENSLAND
Test weight comparisons
Table 11: Springsure screenings (%<2.0mm).Central Queensland Springsure
Hybrid Maturity 2017 2018 2019 2020
84A66 Medium
Composite samples No trial No trial Trial
failed
84A75 Medium
85G33 Medium/quick
Agitator Medium/quick
Brazen Medium/slow
Cracka Medium
Gibson Medium
Halifax Long
HGS-114 Medium
Liberty Long
MR-Bazley Medium/quick
MR-Buster Medium
MR-Taurus Medium/quick
Resolute Medium/long
Sentinel IG Medium
Tanami Medium/quick
Site mean
Table 12: Duaringa and Theodore screenings (%<2.0mm).Central Queensland Duaringa Theodore
Hybrid Maturity 2017 2018 2019 2020
84A66 Medium
Composite samples
Trial failed No trial
2.6
84A75 Medium 2.8
85G33 Medium/quick 3.7
Agitator Medium/quick 3.0
Brazen Medium/slow 3.1
Cracka Medium 2.6
Gibson Medium 4.1
Halifax Long 2.6
HGS-114 Medium 3.0
Liberty Long 2.9
MR-Bazley Medium/quick 2.4
MR-Buster Medium 2.6
MR-Taurus Medium/quick 2.7
Resolute Medium/long 2.7
Sentinel IG Medium 3.1
Tanami Medium/quick 6.2
Site mean 3.3
Table 13: Clermont test weight (kg/hL).Central Queensland Clermont
Hybrid Maturity 2017 2018 2019 2020
84A66 Medium
Composite samples
Trial failed
75.8 79.6
84A75 Medium 75.6 80.0
85G33 Medium/quick 73.5 79.4
Agitator Medium/quick 73.8 80.1
Brazen Medium/slow 76.3 80.2
Cracka Medium 75.4 80.3
Gibson Medium 76.8 80.1
Halifax Long 74.8 79.9
HGS-114 Medium 74.2 80.1
Liberty Long 73.0 80.0
MR-Bazley Medium/quick 75.6 79.5
MR-Buster Medium 75.9 79.4
MR-Taurus Medium/quick 74.5 79.7
Resolute Medium/long 75.3 80.3
Sentinel IG Medium 75.2 80.1
Tanami Medium/quick 75.7 79.9
Site mean 74.8 79.9
Table 14: Kilcummin test weight (kg/hL).Central Queensland Kilcummin
Hybrid Maturity 2017 2018 2019 2020
84A66 Medium
No trial Trial failed No trial
77.4
84A75 Medium 76.9
85G33 Medium/quick 76.1
Agitator Medium/quick 77.3
Brazen Medium/slow 78.4
Cracka Medium 77.5
Gibson Medium 78.2
Halifax Long 77.8
HGS-114 Medium 77.2
Liberty Long 77.9
MR-Bazley Medium/quick 77.8
MR-Buster Medium 77.7
MR-Taurus Medium/quick 77.8
Resolute Medium/long 78.4
Sentinel IG Medium 77.6
Tanami Medium/quick 77.8
Site mean 77.5
ORD
CENT
RAL Q
UEEN
SLAN
DSO
UTHE
RN Q
UEEN
SLAN
DNO
RTHE
RN N
SWLI
VERP
OOL P
LAIN
S
302021 NVT SORGHUM HARVEST REPORT
CENTRAL QUEENSLAND
Table 15: Capella and Dysart test weight (kg/hL).Central Queensland Capella Dysart
Hybrid Maturity 2017 2018 2019 2020
84A66 Medium
Composite samples No trial
78.2 75.6
84A75 Medium 77.0 77.5
85G33 Medium/quick 77.0 73.9
Agitator Medium/quick 78.6 77.7
Brazen Medium/slow 79.5 78.8
Cracka Medium 77.6 76.4
Gibson Medium 79.6 82.0
Halifax Long 78.3 72.3
HGS-114 Medium 77.3 73.6
Liberty Long 77.1 61.0
MR-Bazley Medium/quick 79.0 73.1
MR-Buster Medium 78.9 73.2
MR-Taurus Medium/quick 78.8 70.9
Resolute Medium/long 78.9 75.3
Sentinel IG Medium 78.2 76.3
Tanami Medium/quick 78.6 76.4
Site mean 78.2 74.6
Table 16: Rolleston test weight (kg/hL).Central Queensland Rolleston
Hybrid Maturity 2017 2018 2019 2020
84A66 Medium
No trial No trial
78.3 79.3
84A75 Medium 77.1 78.4
85G33 Medium/quick 77.1 79.2
Agitator Medium/quick 79.3 81.7
Brazen Medium/slow 80.1 81.2
Cracka Medium 78.3 79.5
Gibson Medium 79.6 81.0
Halifax Long 79.3 80.1
HGS-114 Medium 78.2 79.6
Liberty Long 79.4 79.2
MR-Bazley Medium/quick 79.3 80.0
MR-Buster Medium 79.1 79.6
MR-Taurus Medium/quick 79.8 80.6
Resolute Medium/long 80.1 81.1
Sentinel IG Medium 78.8 80.1
Tanami Medium/quick 79.1 80.1
Site mean 78.9 80.1
Table 17: Springsure test weight (kg/hL).Central Queensland Springsure
Hybrid Maturity 2017 2018 2019 2020
84A66 Medium
Composite samples No trial No trial Trial
failed
84A75 Medium
85G33 Medium/quick
Agitator Medium/quick
Brazen Medium/slow
Cracka Medium
Gibson Medium
Halifax Long
HGS-114 Medium
Liberty Long
MR-Bazley Medium/quick
MR-Buster Medium
MR-Taurus Medium/quick
Resolute Medium/long
Sentinel IG Medium
Tanami Medium/quick
Site mean
Table 18: Duaringa and Theodore test weight (kg/hL).Central Queensland Duaringa Theodore
Hybrid Maturity 2017 2018 2019 2020
84A66 Medium
Composite samples
Trial failed No trial
79.5
84A75 Medium 79.0
85G33 Medium/quick 78.8
Agitator Medium/quick 81.0
Brazen Medium/slow 81.3
Cracka Medium 79.9
Gibson Medium 81.2
Halifax Long 80.0
HGS-114 Medium 79.7
Liberty Long 79.0
MR-Bazley Medium/quick 79.8
MR-Buster Medium 79.7
MR-Taurus Medium/quick 80.2
Resolute Medium/long 81.1
Sentinel IG Medium 80.3
Tanami Medium/quick 80.2
Site mean 80.0
ORD
CENT
RAL Q
UEEN
SLAN
DSO
UTHE
RN Q
UEEN
SLAN
DNO
RTHE
RN N
SWLI
VERP
OOL P
LAIN
S

312021 NVT SORGHUM HARVEST REPORT
ORD
YIELD PERFORMANCE The following table contains yield results from the region for the past four seasons. Data is presented (deviation from the mean t/ha) for each hybrid relative to the mean trial yield for the location within each year. Positive values indicate the hybrid performs above the mean yield in the environment (year–location combination) cited. Negative values indicate the hybrid performs below the mean yield in the environment cited. Hybrid names are listed in ascending numerical order, followed by alphabetical order.The performance of hybrids listed within this table can be found by further interrogation of the NVT website. Error bars, normally used to compare data, can be viewed within the graph option also found via the website. Rainfall and irrigation are provided for May to July (M–J) and August to October (A–O).
NVT SITE LOCATIONS – ORDFigure 1: Location of the Ord NVT sorghum trial sites from 2018-19 to 2020-21.
SOURCE: NVT Online
ORD
CENT
RAL Q
UEEN
SLAN
DSO
UTHE
RN Q
UEEN
SLAN
DNO
RTHE
RN N
SWLI
VERP
OOL P
LAIN
S

322021 NVT SORGHUM HARVEST REPORT
ORD
Sorghum variety yield performance
Table 1: Kununurra yield values.t/ha deviation from the mean yield
Ord KununurraHybrid Maturity 2018 2019 202084A66 Medium -0.389 0.619 0.02484A75 Medium -0.126 1.353 -0.39085G33 Medium/quick -0.440 0.655 -0.527Agitator Medium/quick -0.864 -0.740 -0.741Brazen Medium/slow -0.602 -0.396 -0.225Cracka Medium 0.431 0.880 -0.313Gibson Medium -0.232 0.164 0.307Halifax Long 0.473 0.706 -1.254HGS-114 Medium 0.068 -0.334 -0.088Liberty Long -0.274 -1.435 -0.175MR-Bazley Medium/quick 0.285 0.747 0.169MR-Buster Medium 0.310 0.760 0.021MR-Taurus Medium/quick 0.219 0.720 0.286Resolute Medium/long 0.566 0.657 -0.536Sentinel IG Medium 0.110 -0.441 0.768Tanami Medium/quick 0.094 -0.758 1.272Mean yield (t/ha) 8.02 4.67 5.00Rainfall mm (M–J) Irrigated Irrigated IrrigatedRainfall mm (A–O) Irrigated Irrigated IrrigatedSowing date 23 May 18 4 Jul 19 22 Jun 20Harvest date 20 Sep 18 13 Nov 19 16 Nov 20Days to harvest 120 132 147
ORD
CENT
RAL Q
UEEN
SLAN
DSO
UTHE
RN Q
UEEN
SLAN
DNO
RTHE
RN N
SWLI
VERP
OOL P
LAIN
S
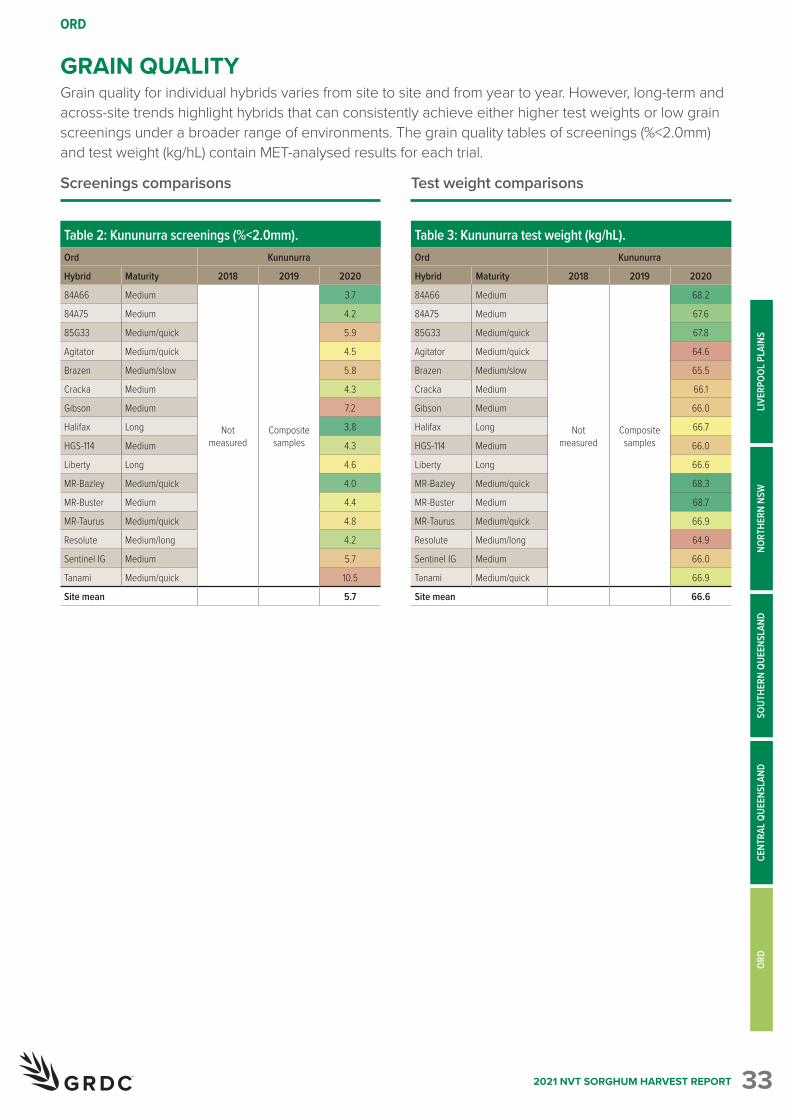
332021 NVT SORGHUM HARVEST REPORT
ORD
GRAIN QUALITYGrain quality for individual hybrids varies from site to site and from year to year. However, long-term and across-site trends highlight hybrids that can consistently achieve either higher test weights or low grain screenings under a broader range of environments. The grain quality tables of screenings (%<2.0mm) and test weight (kg/hL) contain MET-analysed results for each trial.
Screenings comparisons Test weight comparisons
Table 2: Kununurra screenings (%<2.0mm).Ord Kununurra
Hybrid Maturity 2018 2019 2020
84A66 Medium
Not measured
Composite samples
3.7
84A75 Medium 4.2
85G33 Medium/quick 5.9
Agitator Medium/quick 4.5
Brazen Medium/slow 5.8
Cracka Medium 4.3
Gibson Medium 7.2
Halifax Long 3.8
HGS-114 Medium 4.3
Liberty Long 4.6
MR-Bazley Medium/quick 4.0
MR-Buster Medium 4.4
MR-Taurus Medium/quick 4.8
Resolute Medium/long 4.2
Sentinel IG Medium 5.7
Tanami Medium/quick 10.5
Site mean 5.7
Table 3: Kununurra test weight (kg/hL).Ord Kununurra
Hybrid Maturity 2018 2019 2020
84A66 Medium
Not measured
Composite samples
68.2
84A75 Medium 67.6
85G33 Medium/quick 67.8
Agitator Medium/quick 64.6
Brazen Medium/slow 65.5
Cracka Medium 66.1
Gibson Medium 66.0
Halifax Long 66.7
HGS-114 Medium 66.0
Liberty Long 66.6
MR-Bazley Medium/quick 68.3
MR-Buster Medium 68.7
MR-Taurus Medium/quick 66.9
Resolute Medium/long 64.9
Sentinel IG Medium 66.0
Tanami Medium/quick 66.9
Site mean 66.6
ORD
CENT
RAL Q
UEEN
SLAN
DSO
UTHE
RN Q
UEEN
SLAN
DNO
RTHE
RN N
SWLI
VERP
OOL P
LAIN
S

342021 NVT SORGHUM HARVEST REPORT
FURTHER INFORMATION
RESIDUE WATCH: HOW DO I KNOW IF HERBICIDE RESIDUES ARE BREAKING DOWN BEFORE SOWING13 July 2021https://grdc.com.au/resources-and-publications/grdc-update-papers/tab-content/grdc-update-papers/2021/07/residue-watch-how-do-i-know-if-herbicide-residues-are-breaking-down-before-sowingOf note is the sensitivity of sorghum to imazapic residues. Sorghum was more than twice as sensitive as other crop species tested.
BIOLOGY OF FEATHERTOP RHODES GRASS AND WINDMILL GRASS1 June 2021https://grdc.com.au/resources-and-publications/grdc-update-papers/tab-content/grdc-update-papers/2021/06/biology-of-feathertop-rhodes-grass-and-windmill-grassSorghum competition reduced the seed production of feathertop Rhodes grass by more than 80 per cent compared with fallow conditions.
MANAGING CROP DIFFERENCES IN SOIL WATER EXTRACTION AND LEGACY IMPACTS WITHIN A FARMING SYSTEM18 May 2021https://grdc.com.au/resources-and-publications/grdc-update-papers/tab-content/grdc-update-papers/2021/05/managing-crop-differences-in-soil-water-extraction-and-legacy-impacts-within-a-farming-systemFor summer crops, mungbean typically leaves 20mm more residual water than sorghum/maize while cotton leaves 20mm less (i.e. mungbean > sorghum/maize > cotton).
PLANT AVAILABLE WATER CAPACITY – CROP AND VARIETAL DIFFERENCES IN SOIL WATER EXTRACTION18 May 2021https://grdc.com.au/resources-and-publications/grdc-update-papers/tab-content/grdc-update-papers/2021/05/plant-available-water-capacity-crop-and-varietal-differences-in-soil-water-extractionSorghum crop lower limit (CLL) and drained upper limit (DUL) profiles demonstrating the effects of evaporation at the surface and water left behind at depth. Wheat, barley, triticale, oats, canola and sorghum often have a similar field CLL.
FALL ARMYWORM UPDATE2 March 2021https://grdc.com.au/resources-and-publications/grdc-update-papers/tab-content/grdc-update-papers/2021/03/fall-armyworm-updateMonitoring of susceptible crops including maize (for grain or silage) and sorghum is now essential at crop establishment and vegetative stages. Monitoring from tasselling and head emergence in these crops should now include FAW.

352021 NVT SORGHUM HARVEST REPORT
FURTHER INFORMATION
STRATEGIES TO IMPROVE EFFICIENCY OF USE OF APPLIED N, P AND K FERTILISER IN CENTRAL QUEENSLAND19 November 2020https://grdc.com.au/resources-and-publications/grdc-update-papers/tab-content/grdc-update-papers/2020/11/strategies-to-improve-efficiency-of-use-of-applied-n,-p-and-k-fertiliser-in-central-queenslandSummer sorghum remained in the soil after crop harvest, with the overwhelming majority of that still in and around the fertiliser band (Bell et al. ... converted an average sorghum crop (2.3 t/ha) into a good one (3.8 t/ha).
WINTER SOWN SORGHUM FOR CENTRAL QUEENSLAND17 November 2020https://grdc.com.au/resources-and-publications/grdc-update-papers/tab-content/grdc-update-papers/2020/11/winter-sown-sorghum-for-central-queenslandFrom a CQ point of view, winter sorghum is not a simple decision.
FINE TUNING DEEP PHOSPHORUS AND POTASSIUM MANAGEMENT19 November 2020https://grdc.com.au/resources-and-publications/grdc-update-papers/tab-content/grdc-update-papers/2020/11/fine-tuning-deep-phosphorus-and-potassium-managementThe strong P responses at this site were consistent with results from the previous five crops grown on the site (2014, 2015 and 2016 sorghum, 2017 chickpeas and 2018 sorghum), but ... In the first three sorghum crops there was no difference in yields.
SUMMER CROPS: RELATIVE WATER USE EFFICIENCIES AND LEGACY IMPACTS IN FARMING SYSTEMS11 August 2020https://grdc.com.au/resources-and-publications/grdc-update-papers/tab-content/grdc-update-papers/2020/07/summer-crops-relative-water-use-efficiencies-and-legacy-impacts-in-farming-systemsSoil water at sowing is critical for driving the efficiency of summer crops, especially sorghum.
USING PLANT AVAILABLE WATER (PAW) TO INFORM DECISION-MAKING AND CROP RESOURCING: WHAT TO DO WHEN YOU DO NOT HAVE A PAWC CHARACTERISATION ON-SITE30 July 2020https://grdc.com.au/resources-and-publications/grdc-update-papers/tab-content/grdc-update-papers/2020/07/using-plant-available-water-paw-to-inform-decision-making-and-crop-resourcingPlant available water (PAW) is a key determinant of potential yield in dryland agriculture. Obtaining a measurement or estimate of PAW can, therefore, inform crop management decisions relating to time of sowing, crop type or the level of fertiliser inputs.
IMPROVING YIELD RELIABILITY OF GRAIN SORGHUM IN NORTH WEST NSW21 July 2020https://grdc.com.au/resources-and-publications/grdc-update-papers/tab-content/grdc-update-papers/2020/07/improving-yield-reliability-of-grain-sorghum-in-north-west-nswUsing skip or wide row configurations can potentially reduce the risk of crop failure by saving soil water for post anthesis but can also limit yield potential. Solid plant offers more advantages in seasons where yields are likely to be above 3t/ha.
ORD
CENT
RAL Q
UEEN
SLAN
DSO
UTHE
RN Q
UEEN
SLAN
DNO
RTHE
RN N
SWLI
VERP
OOL P
LAIN
S
P Level 4, 4 National Circuit, Barton ACT 2600 | PO Box 5367, Kingston ACT 2604T 02 6166 4500 F 02 6166 4599 E [email protected]
Useful NVT toolsVisit the NVT website @ nvt.grdc.com.au
Harvest Reports Sowing Guides
Disease reporting tool
Long term yield reporter
Trial results
Subscribe to NVT communications to receive Harvest Reports as soon as they are released.
Subscribe nowFollow us on Twitter @NVT_Online