Embed Size (px)
Citation preview
2021 Integrated Resource Plan
Hydro ResourcesIRPAC Meeting – April 8, 2021
John HildrethSenior Engineer

Introduction
• This presentation is intended to be informational, so you understand the development of the hydro generation inputs that go into the Aurora modeling.
• The presentation will discuss the expected drivers of change to the hydro system over the 20-year planning horizon.

Importance• Hydro generation modeling that goes into Aurora lays the building blocks for all
other resources in the IRP.
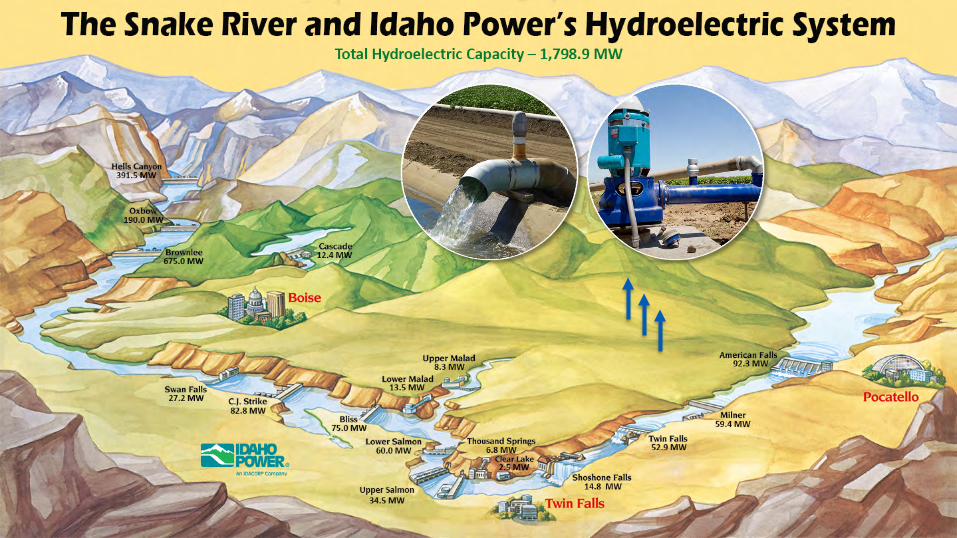
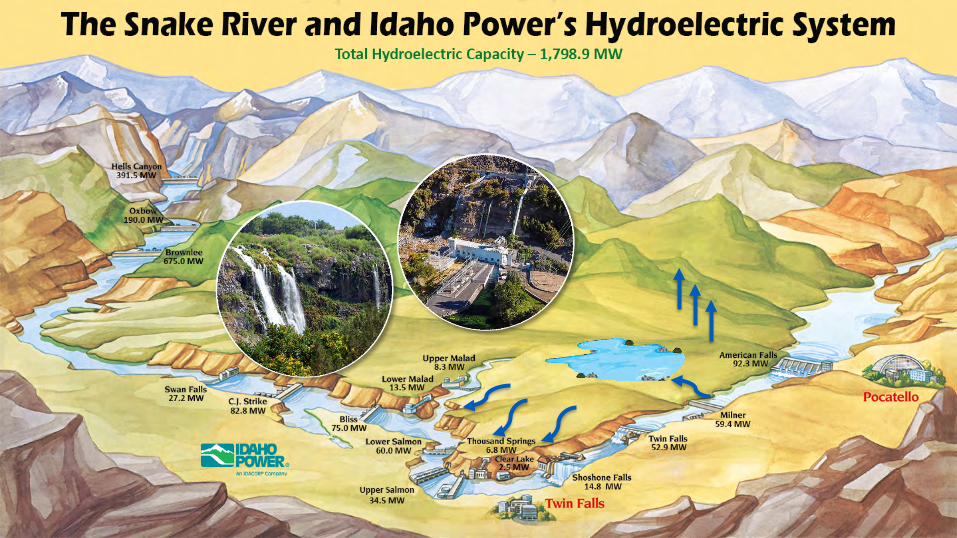
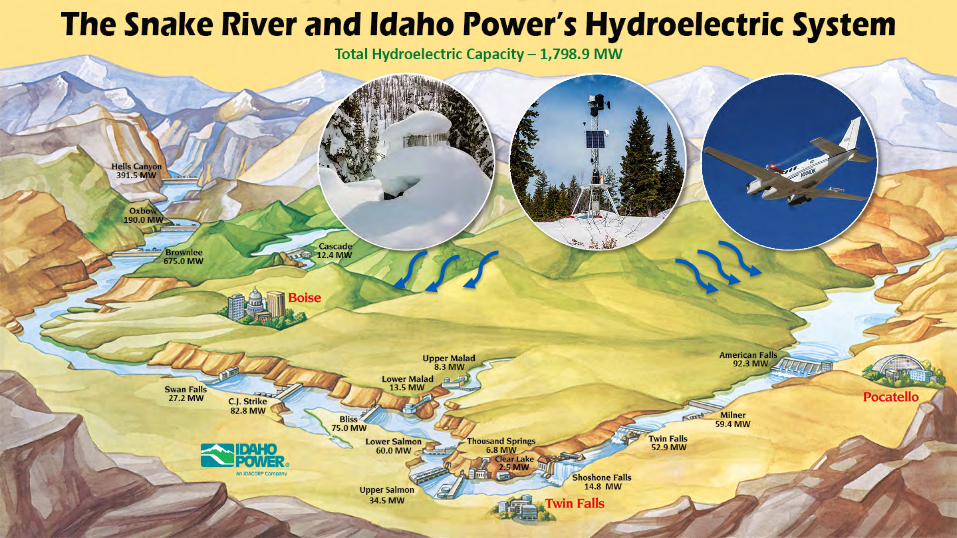
• Idaho Power has almost 1,800 megawatts (MW) of hydroelectric generation capacity.
• Hydro is our largest energy resource.
• Hydro is an inexpensive fuel source and is a key factor in Idaho Power’s ability to keep rates low for our customers.
• Hydro is a highly flexible resource that supports reliability of the system.
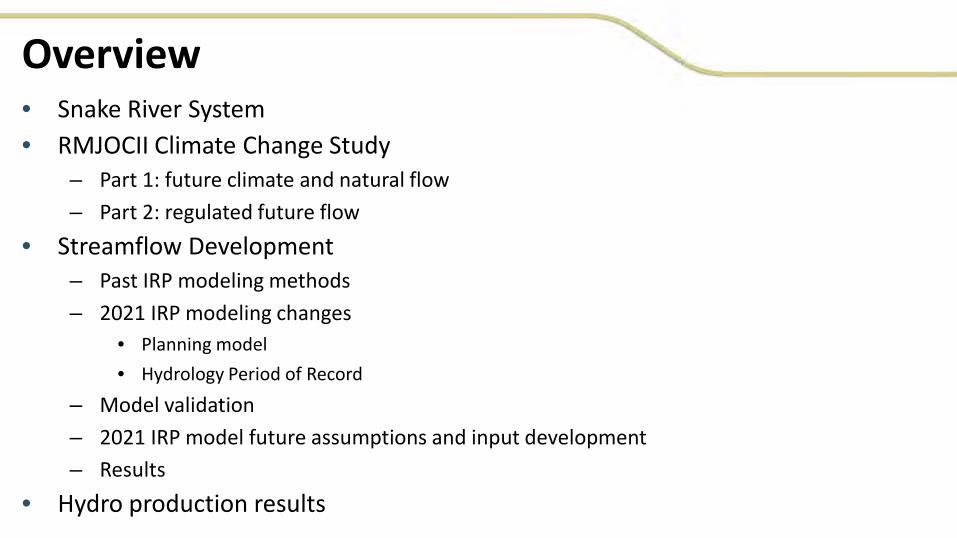
Overview• Snake River System • RMJOCII Climate Change Study
– Part 1: future climate and natural flow– Part 2: regulated future flow
• Streamflow Development– Past IRP modeling methods– 2021 IRP modeling changes
• Planning model• Hydrology Period of Record
– Model validation– 2021 IRP model future assumptions and input development– Results
• Hydro production results

Snake River Basin Teacup Diagram


Climate Change

Long-term Climate Change Planning Studies
CMIP3
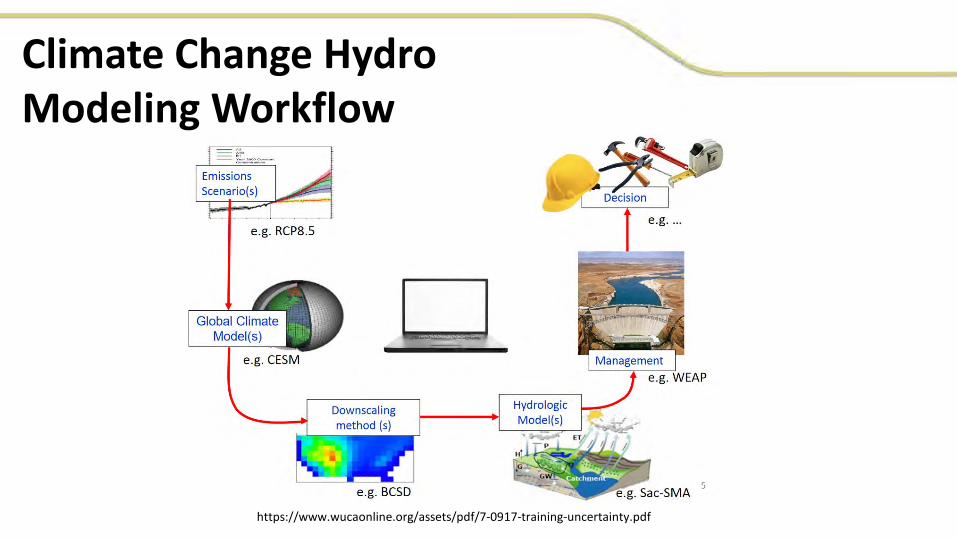
Climate Change Hydro Modeling Workflow
https://www.wucaonline.org/assets/pdf/7-0917-training-uncertainty.pdf

Snake Basin GCM Results
Adopted from Figure 39, Modeled temperature and precipitation changes of 10 GCM’s for Snake River Basin above Lower Granite

Snow Water Equivalent
Adopted from Figure 41, Modeled Columbia Basin Snow Water Equivalent (SWE) in the 1980s and average SWE change of 10 GCM’s using RCP 8.5 for the 2020s (2010–2039)
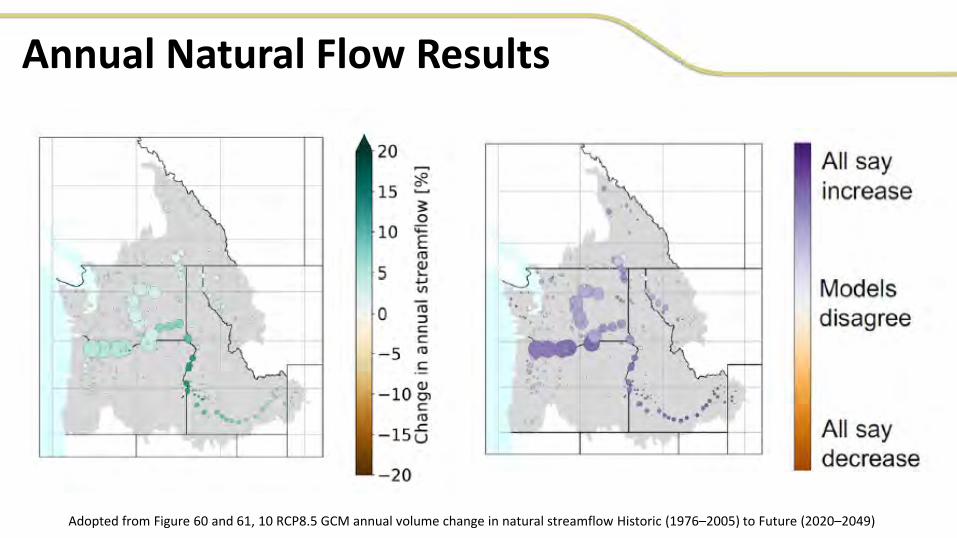
Annual Natural Flow Results
Adopted from Figure 60 and 61, 10 RCP8.5 GCM annual volume change in natural streamflow Historic (1976–2005) to Future (2020–2049)
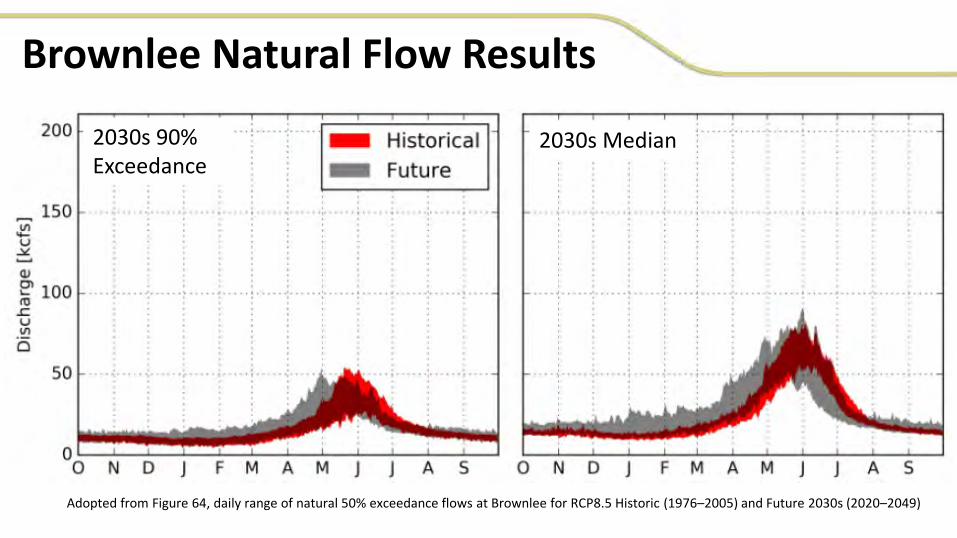
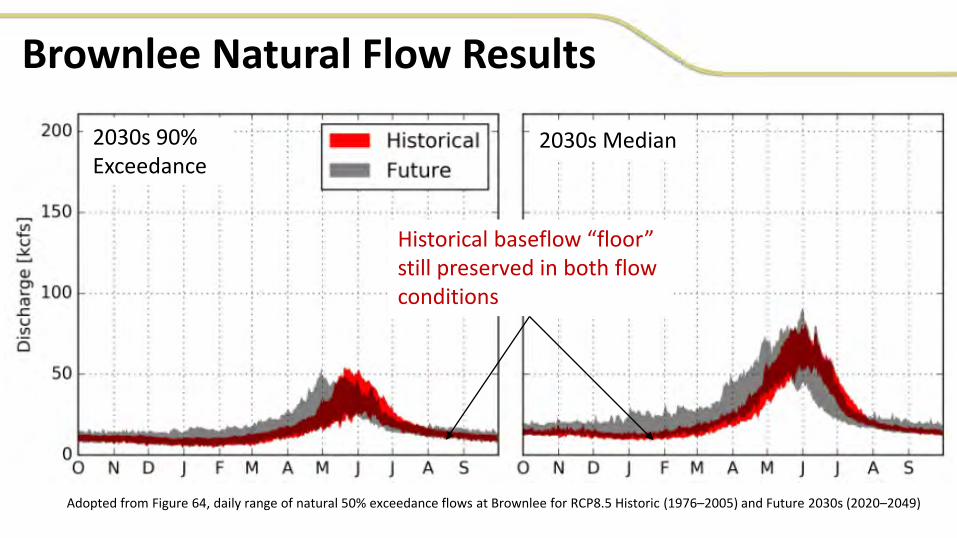
Brownlee Natural Flow Results
Adopted from Figure 64, daily range of natural 50% exceedance flows at Brownlee for RCP8.5 Historic (1976–2005) and Future 2030s (2020–2049)
2030s 90% Exceedance
2030s Median

Brownlee Natural Flow Results
Adopted from Figure 64, daily range of natural 50% exceedance flows at Brownlee for RCP8.5 Historic (1976–2005) and Future 2030s (2020–2049)
2030s 90% Exceedance
2030s Median
Change in center of timing projected two weeks earlier

Brownlee Natural Flow Results
Adopted from Figure 64, daily range of natural 50% exceedance flows at Brownlee for RCP8.5 Historic (1976–2005) and Future 2030s (2020–2049)
2030s 90% Exceedance
2030s Median
Mid-July through October has the least variability and change

Brownlee Natural Flow Results
Adopted from Figure 64, daily range of natural 50% exceedance flows at Brownlee for RCP8.5 Historic (1976–2005) and Future 2030s (2020–2049)
2030s 90% Exceedance
2030s Median
Increase in flow November through May with increased variability
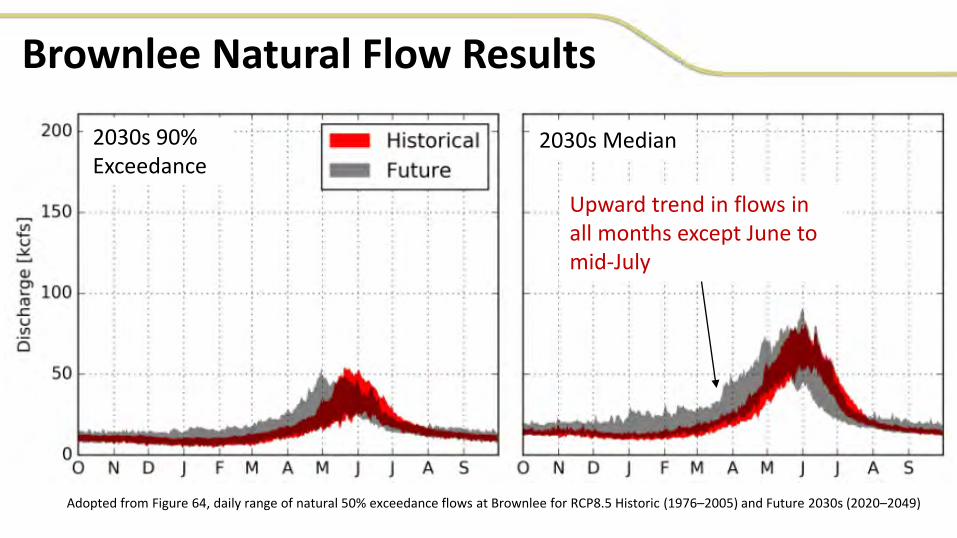
Brownlee Natural Flow Results
Adopted from Figure 64, daily range of natural 50% exceedance flows at Brownlee for RCP8.5 Historic (1976–2005) and Future 2030s (2020–2049)
2030s 90% Exceedance
2030s Median
Upward trend in flows in all months except June to mid-July

Brownlee Natural Flow Results
Adopted from Figure 64, daily range of natural 50% exceedance flows at Brownlee for RCP8.5 Historic (1976–2005) and Future 2030s (2020–2049)
2030s 90% Exceedance
2030s Median
Change in center of timing projected one month earlier

Brownlee Natural Flow Results
Adopted from Figure 64, daily range of natural 50% exceedance flows at Brownlee for RCP8.5 Historic (1976–2005) and Future 2030s (2020–2049)
2030s 90% Exceedance
2030s Median
July through December has the least variability and change

Brownlee Natural Flow Results
Adopted from Figure 64, daily range of natural 50% exceedance flows at Brownlee for RCP8.5 Historic (1976–2005) and Future 2030s (2020–2049)
2030s 90% Exceedance
2030s Median
Increase in flow January through May with increased variability
Brownlee Natural Flow Results
Adopted from Figure 64, daily range of natural 50% exceedance flows at Brownlee for RCP8.5 Historic (1976–2005) and Future 2030s (2020–2049)
2030s 90% Exceedance
2030s Median
Historical baseflow “floor” still preserved in both flow conditions

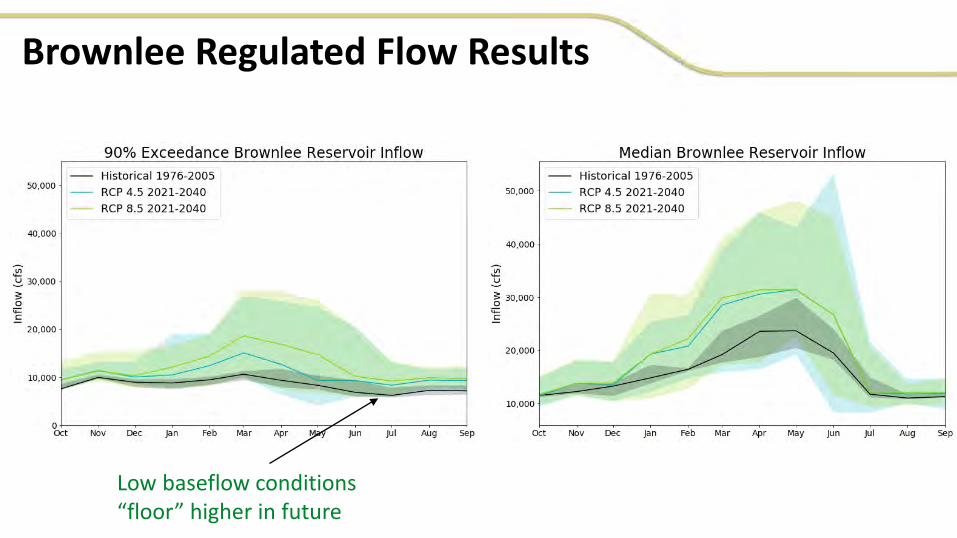
Brownlee Regulated Flow Results

Brownlee Regulated Flow Results
Large increase in variability, greatest in spring

Brownlee Regulated Flow Results
Least variability and change July through December, most critical energy time

Brownlee Regulated Flow Results
Higher or unchanged flows year-round for both water conditions
Brownlee Regulated Flow Results
Low baseflow conditions “floor” higher in future

Brownlee Regulated Flow Results
Upstream reservoir regulation significantly alters and dampens the projected natural flow change

Summary
• For IRP modeling, Idaho Power continues to evaluate the projected distribution of water supply in climate change modeling
– Over the 20-year planning horizon of the IRP, other factors such as managed aquifer recharge and weather modification also influence future water supply distributions.

Objective:To model exceedance
probabilities of hydro generation in each of the next 20 years
IRP Hydro Generation Planning

Modeling Changes From Past IRPs

Old Modeling Process
Statistical Trend Modeling
EFS Cloud Seeding SA
ESPAM 2.1 SRPM PDR580
Modeling Limitations
• Both models are “black boxes.” Results are very difficult to interpret.
• Both models were written in old coding languages.– No modern support or maintenance
• Extensive manual manipulation is required to process inputs and outputs to the model.
• There’s no automation of modeling.
Modeling Limitations
• Model Specific Limitations– SRPM
• Updated through 2009– Reach gains– Reservoir operations– Demands
• Monthly model• Flood control not dynamic to changing hydrology
– PDR580• Reflects outdated plant capacities• Irregular timesteps (monthly and sub-monthly)• Reservoir management of Hells Canyon Complex done outside model in a
spreadsheet

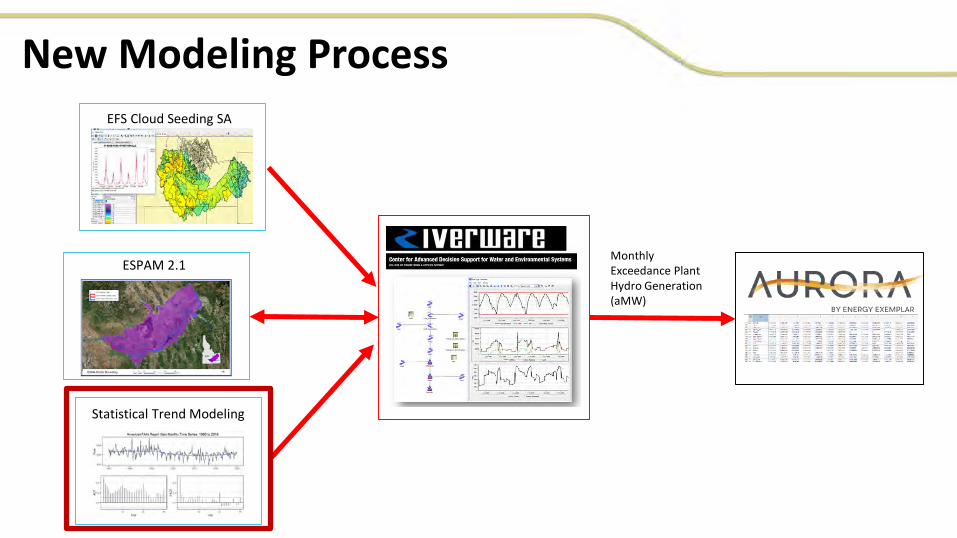
New Modeling Process
Statistical Trend Modeling
EFS Cloud Seeding SA
ESPAM 2.1Monthly Exceedance Plant Hydro Generation (aMW)

CADSWES RiverWare
• Software from the University of Colorado Boulder, Center for Advanced Decision Support for Water and Environmental Systems
• What is it?– Object-oriented, multi-objective river and reservoir modeling decision
support system– Widely used, well-funded, and actively developed software – Large collection of support tools – Allows for automation– Allows for adaptive water management modeling and implementation of
water policy

RiverWare Users and Benefits
Bureau of Reclamation: 27 offices
Tennessee Valley Authority
U.S. Army Corps of Engineers: 13 offices
10 Federal agencies, Tribes and research labs
31 state, city and district water agencies
8 electric utilities in the U.S. and Canada
23 consulting companies and NGOs
12 universities and research groups
19 foreign entities

Snake RiverWare Planning Model• Acquired model from U.S. Bureau of Reclamation (USBR) in early 2020
– Same model used by USBR for the BPA 2020 Modified flows study
• Model was created to answer USBR specific questions– Enhancements added to be used for Idaho Power modeling
• Inclusion of managed recharge• Update to reflect more current reservoir operations• Inclusion of cloud seeding and other management practices affecting reach gains• Inclusion of Idaho Power primary American Falls storage• Allow 0 cfs at Milner• Inclusion of missing Idaho Power hydro projects• Update of plant capacities at all Idaho Power projects• Inclusion of flow augmentation estimates when accounting is not run
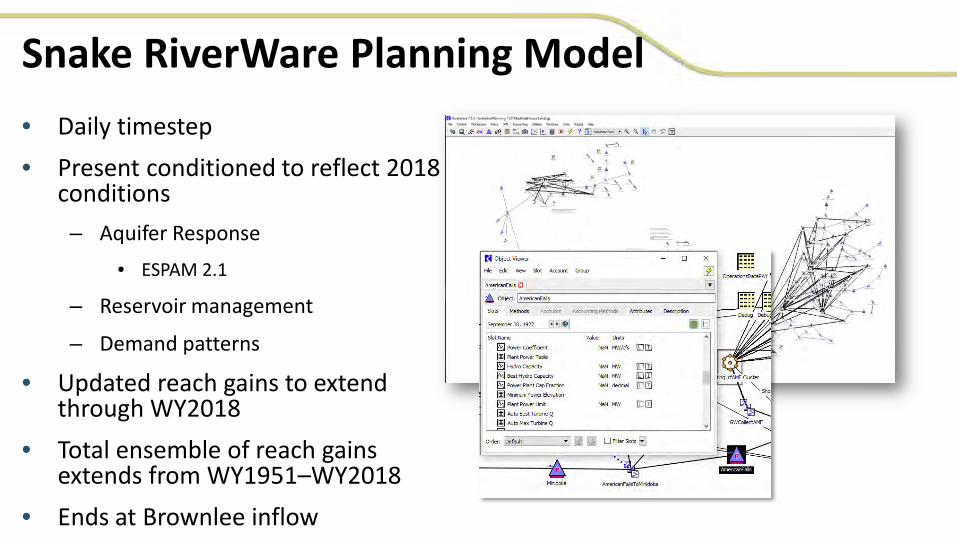
Snake RiverWare Planning Model• Daily timestep• Present conditioned to reflect 2018
conditions– Aquifer Response
• ESPAM 2.1
– Reservoir management
– Demand patterns
• Updated reach gains to extend through WY2018
• Total ensemble of reach gains extends from WY1951–WY2018
• Ends at Brownlee inflow

Hells Canyon Complex Planning model• Contracted with CADSWES to build
HCC planning model in RiverWare• Reflects current level reservoir
management practices– License requirements– Recreational– Environmental– Flood control
• Dynamic operations based on inflow and year
• Plant-based hydro generation modeling
Hydrology Period Of Record (POR)
• Past IRP Modeling– Reach gains used records from 1928-2009.
• Reasons for pursuing new POR– Data back to 1928 was not complete; extensive development of data was
needed.– Certain models did not cover entire period.
• Like-year mapping was performed.– Some reservoirs where not constructed which impact hydrologic characteristics.
• Reservoir evaporation, seepage, etc.• These changes were mostly ignored in recreating data for modeling back to 1928.
– Data quality decreases the further back in time the study goes.

Hydrology POR Study
• Evaluated 3 natural flow locations using the Kolmogorov-Smirnov 2-Sample Test– Upper Snake, Boise, Payette
• Conclusion: Using an alpha value of 0.01 the results showed that for both annual and monthly that the test statistic was less than the critical value and there is not sufficient evidence that the underlying distributions are different
• IRP Modeling Benefits– Easier to understand modeling– More transparent– Uses better quality and more reliable data– Minimal reconstruction of data needed– Modeling confidence– More recent years includes more recent climate signal
RiverWare Modeling Validation
• Looked at model performance from WY 2004–2018• Model is present-conditioned to current reservoir operations
(WY 2018).• These results are prior to future conditioning the model to
expected changes over the IRP planning period.• Goal: To provide evidence models are performing as expected and
provide confidence in the hydro results going into Aurora.

Brownlee Reservoir Inflow

Brownlee Inflow ExceedanceProbability WY 2004–2018

Snake River OutflowBelow Hells Canyon

Hells Canyon Complex Generation
• Observed maintenance and operating reserves are not simulated in RiverWare, this is accounted for in Aurora.
• Modeling purpose is to produces total available aMW with the given water conditions.

Hells Canyon Monthly ExceedanceProbability WY 2004–2018

Future Assumptions Influencing Water Supply• Expected water management activities
– Managed Recharge• IWRB• Private
– Groundwater pumping reductions– System conversions (groundwater supply converted to surface water supply)
• Weather modification• Reach declines
– Based on trend analysis (1990–2019)

New Modeling Process
Statistical Trend Modeling
ESPAM 2.1
EFS Cloud Seeding SA
Monthly Exceedance Plant Hydro Generation (aMW)

Cloud Seeding Benefit Modeling
• EFS is our internal streamflow forecasting system– Calibrated lumped parameter hydrologic model of the Snake Basin– Inputs to the model include Mean Areal Precipitation and Mean Areal
Temperature– Have historic data from WY1951-Current
• 2 Scenarios Developed– 2021 Cloud Seeding Program– 2026 Future Cloud Seeding Build Out
Spatial distribution of percent increase to catchment
Mean Areal Precipitation development
MAP
Reach Gains to RiverWare
Catchment Percent Increase
Basin Percent Increase
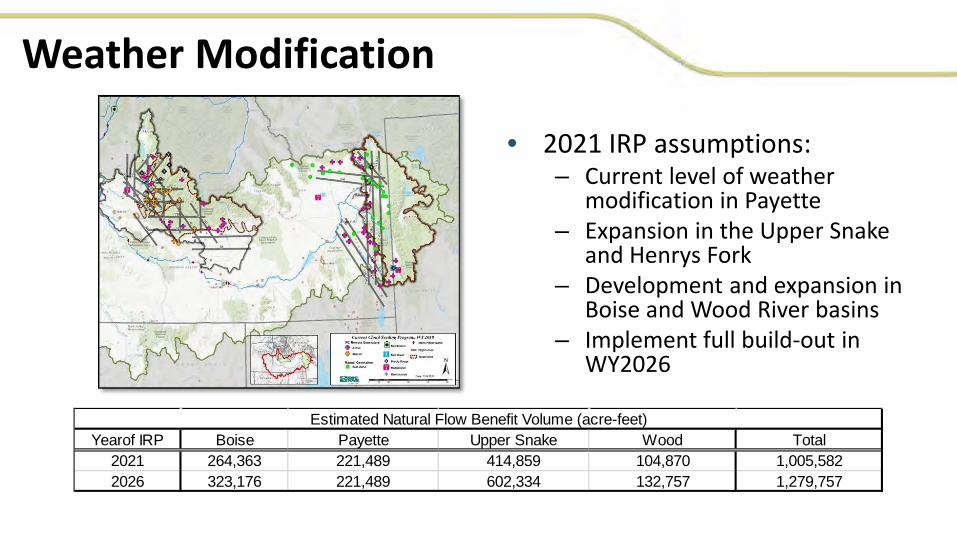
• 2021 IRP assumptions:– Current level of weather
modification in Payette– Expansion in the Upper Snake
and Henrys Fork– Development and expansion in
Boise and Wood River basins– Implement full build-out in
WY2026
Weather Modification
Yearof IRP Boise Payette Upper Snake Wood Total2021 264,363 221,489 414,859 104,870 1,005,5822026 323,176 221,489 602,334 132,757 1,279,757
Estimated Natural Flow Benefit Volume (acre-feet)
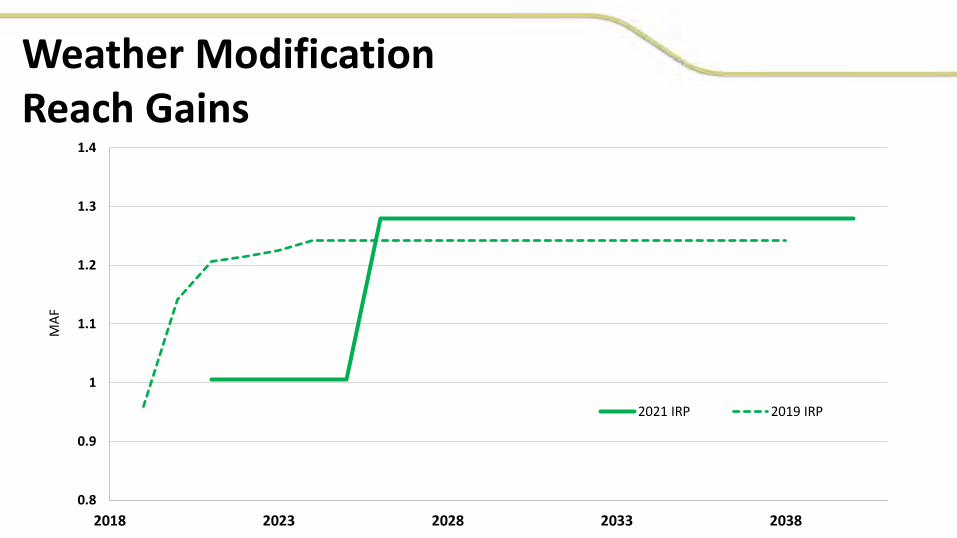
Weather Modification Reach Gains
0.8
0.9
1
1.1
1.2
1.3
1.4
2018 2023 2028 2033 2038
MAF
2021 IRP 2019 IRP

New Modeling Process
Statistical Trend Modeling
EFS Cloud Seeding SA
ESPAM 2.1Monthly Exceedance Plant Hydro Generation (aMW)

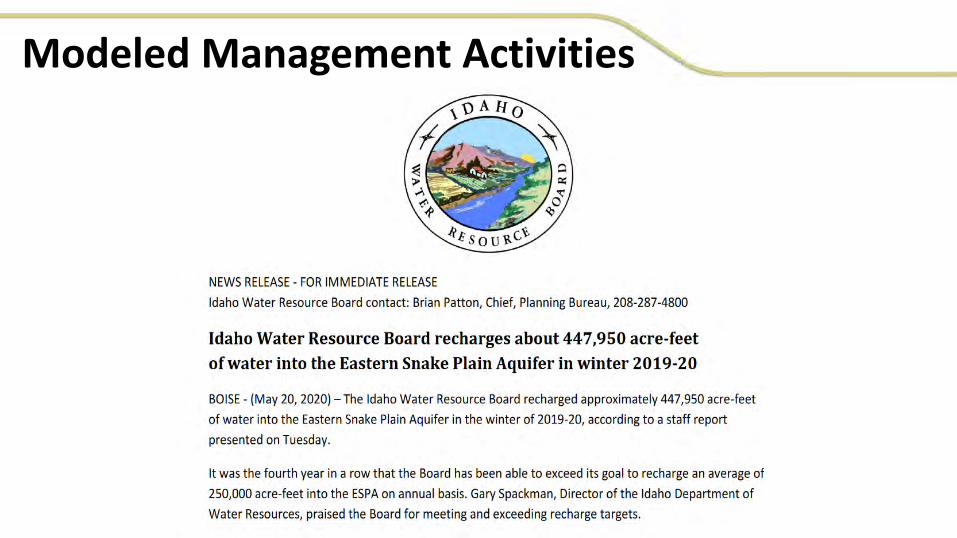
Modeled Management Activities

2016 Settlement Agreement

System Conversions
Adopted from the Interim Mitigation Agreement between SWID-SWC
Courtesy of Idaho Department of Water Resources.

Managed Recharge
Adopted from IDWR
*2020 Private Recharge not yet available
0
100,000
200,000
300,000
400,000
500,000
600,000
700,000
2015 2016 2017 2018 2019 2020
Managed Recharge
Observed Private Recharge (acre-feet)
Observed Storage Water Recharge (acre-feet)
Observed Natural Flow Recharge (acre-feet)

Enhanced Snake Plain Aquifer Model(ESPAM)

Modeling Sequence
• Add expected reach gains to year 2021 of the IRP– Cloud seeding– Trend declines– 2015–2020 observed management practices run through ESPAM
• SWC agreement implementation• System conversions• Recharge
– Idaho Water Resource Board– Private

Modeling Sequence
• Run model and refine recharge capacity assumptions to achieve as close as possible to desired assumptions– 405 KAF/yr total recharge
• 250 KAF/yr IWRB natural recharge• 55 KAF/yr IWRB storage water recharge• 100 KAF/yr private recharge
• Determine the distribution of monthly recharge volumes by upper valley and lower valley canals assuming static distribution from 2021–2040
• Rerun ESPAM with new recharge assumptions from 2015–2040

Water Management Reach Gains
0.4
0.45
0.5
0.55
0.6
0.65
2018 2023 2028 2033 2038
MAF
2021 IRP 2019 IRP
New Modeling Process
Statistical Trend Modeling
EFS Cloud Seeding SA
ESPAM 2.1Monthly Exceedance Plant Hydro Generation (aMW)
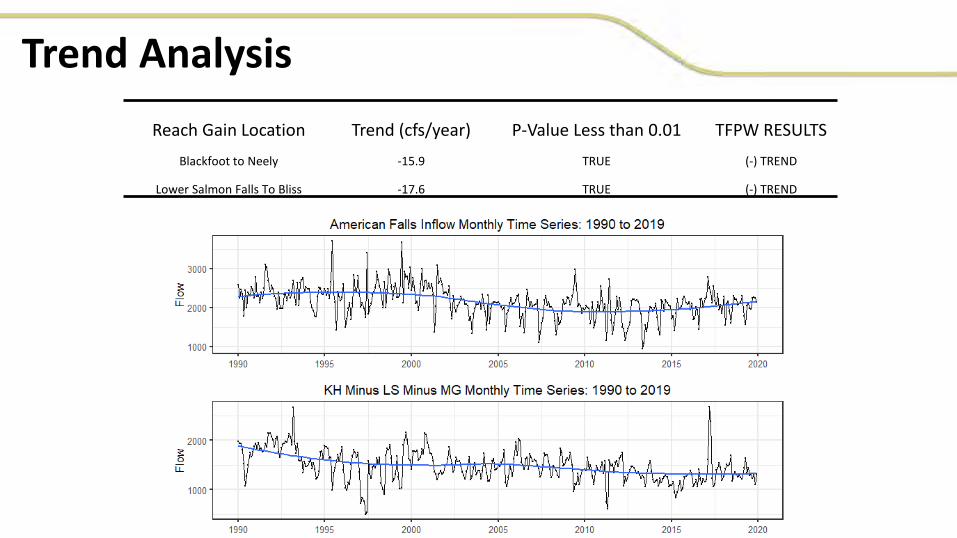
Trend AnalysisReach Gain Location Trend (cfs/year) P-Value Less than 0.01 TFPW RESULTS
Blackfoot to Neely -15.9 TRUE (-) TREND
Lower Salmon Falls To Bliss -17.6 TRUE (-) TREND

Trend Analysis Reach Gains
-1
-0.8
-0.6
-0.4
-0.2
0
0.2
2018 2023 2028 2033 2038
MAF
2021 IRP 2019 IRP

Total Reach Gain Adjustments
0.8
0.9
1
1.1
1.2
1.3
1.4
1.5
1.6
1.7
1.8
2018 2023 2028 2033 2038
MAF
2021 IRP 2019 IRP

Planning Flow Results

Exceedance Plot Interpretation
50%
70%
30%
90%
10%
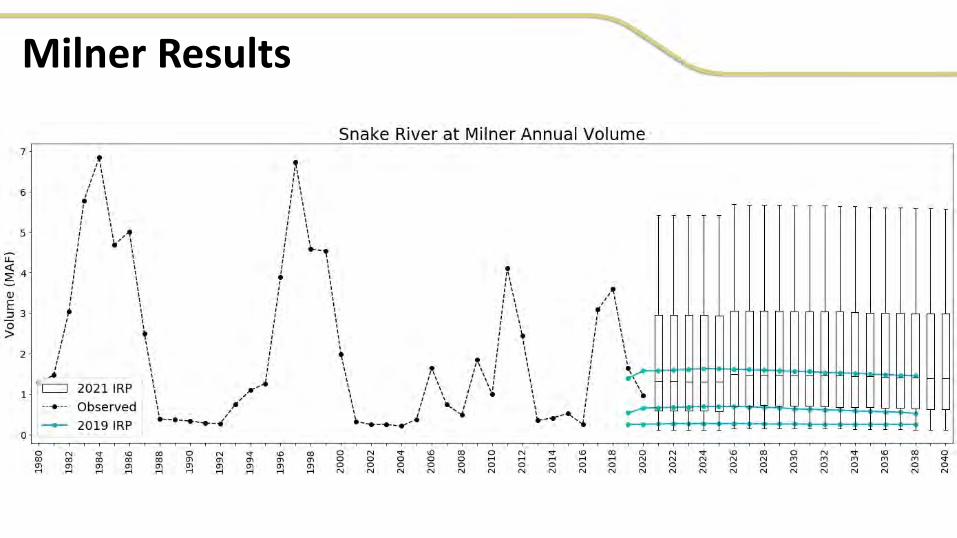
Milner Results

Swan Falls Results

Brownlee Results

Planning Generation Results
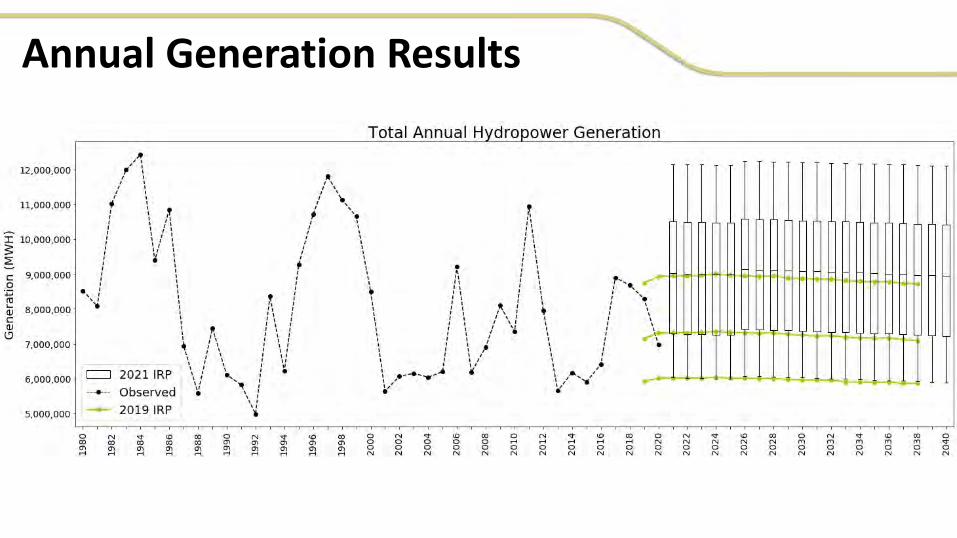
Annual Generation Results

50% Exceedance Generation
1% 1% 0% 0% 0%
2% 2% 2% 2% 2% 3% 2% 3% 3% 3% 3% 3% 3%
-500000
0
500000
1000000
1500000
2000000
4,000,000
5,000,000
6,000,000
7,000,000
8,000,000
9,000,000
10,000,000
Gene
ratio
n In
crea
se (M
WH)
Gene
ratio
n (M
WH)
2019 IRP 2021 IRP MWH Increase

70% Exceedance Generation
0% 0% -1% -1% -1%
1% 1% 1% 1% 2% 2% 1% 2% 2% 2% 2% 2% 2%
-500000
0
500000
1000000
1500000
2000000
4,000,000
4,500,000
5,000,000
5,500,000
6,000,000
6,500,000
7,000,000
7,500,000
8,000,000
Gene
ratio
n In
crea
se (M
WH)
Gene
ratio
n (M
WH)
2019 IRP 2021 IRP MWH Increase
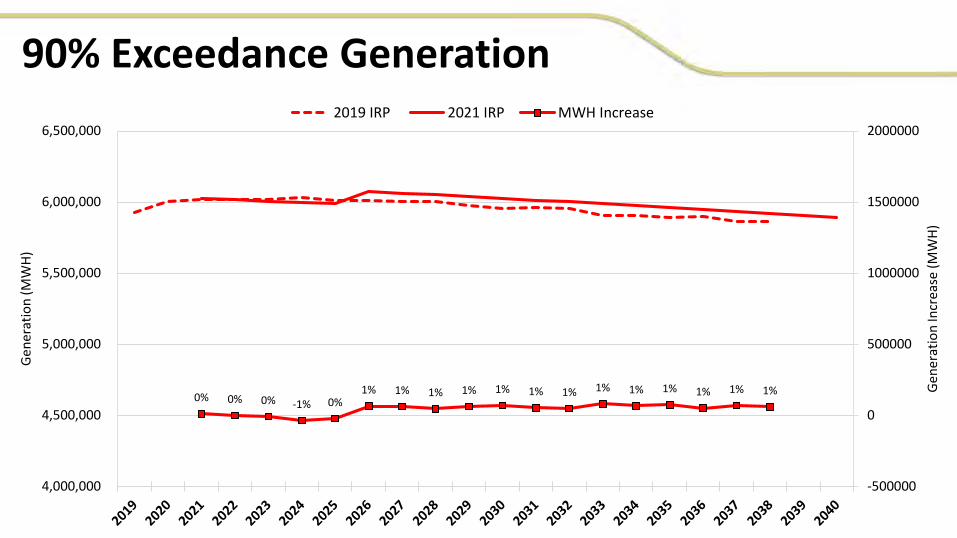
90% Exceedance Generation
0% 0% 0% -1% 0%1% 1% 1% 1% 1% 1% 1% 1% 1% 1% 1% 1% 1%
-500000
0
500000
1000000
1500000
2000000
4,000,000
4,500,000
5,000,000
5,500,000
6,000,000
6,500,000
Gene
ratio
n In
crea
se (M
WH)
Gene
ratio
n (M
WH)
2019 IRP 2021 IRP MWH Increase